Article

Comprehensive Assessment Approach for the Design of Automatic Control Systems in Gas Field Stations

1
Gathering and Transportation Engineering Technology Research Institute, PetroChina Southwest Oil and Gas Field Company, Chengdu 610041, China
2
Petroleum Engineering School, Southwest Petroleum University, Chengdu 610500, China
3
Development Planning Department, PetroChina Southwest Oil and Gas Field Company, Chengdu 610066, China
*
Authors to whom correspondence should be addressed.
Appl. Syst. Innov. 2025, 8(4), 113; https://doi.org/10.3390/asi8040113
Submission received: 8 June 2025 / Revised: 29 July 2025 / Accepted: 8 August 2025 / Published: 14 August 2025

Abstract

The design of automatic control systems is critical for ensuring safety in gas field surface engineering production. However, over-reliance on standardized design approaches within the context of automation technology can compromise system flexibility and neglect individualized cost-effectiveness considerations. This paper identifies a comprehensive evaluation method as the preferred approach for assessing station control systems by comparing the advantages and disadvantages of various common evaluation techniques. We propose an integrated semi-quantitative and quantitative evaluation method designed to comprehensively and accurately assess the effectiveness of station automatic control systems. For the semi-quantitative framework, we first establish a specific indicator system for the control system and employ the Analytic Hierarchy Process (AHP) to determine indicator weights tailored to different station types, achieving a scientific quantification of evaluation criteria. Additionally, we utilize quantitative calculation methods, specifically reliability and availability analyses, to evaluate the station’s automatic control system. Differential research is conducted to customize the evaluation based on the distinct process characteristics of various gas field stations. Differential design calculations and analyses were performed for a single station, improving the economy and adaptability of the automatic control system design. The proposed comprehensive evaluation method ensures the safe and stable operation of control system designs and provides a new approach for the automation and intelligent transformation of gas field surface engineering.

1. Introduction

1.1. Motivation

Within the evolving landscape of gas field automation, where digital technologies progressively converge with intelligent equipment [1], and particularly as the energy sector accelerates its “streamlined workforce and optimized efficiency” initiatives, industrial enterprises are demonstrating heightened demands for precision-driven production management. In this operational context, instrumentation automation systems—functioning as the neural center of modern industrial control frameworks—maintain their pivotal position through demonstrated excellence in parameter modulation accuracy and operational reliability; thereby sustaining indispensable technological value in hydrocarbon production processes. Studies have shown that such systems not only improve production efficiency and reduce energy consumption but also significantly enhance operational safety and reliability [2]. In typical gas field scenarios, advanced automation systems continuously monitor critical parameters, automatically executing adjustments to ensure consistent, high-efficiency production processes [3]. However, the prevalent trend of excessive standardization in current system design may undermine flexibility, rendering such systems incompatible with individualized on-site requirements and potentially leading to resource waste in specific scenarios. Furthermore, existing evaluation frameworks primarily rely on either quantitative or semi-quantitative metrics, failing to provide comprehensive multi-dimensional assessments of system performance. Consequently, establishing a diversified evaluation system that balances scientific rigor with practical applicability has become imperative [4].

1.2. Literature Review

Automation systems serve as the fundamental control infrastructure for natural gas production and transportation, with their performance critically influencing operational safety, efficiency, and economic outcomes. In the context of global energy digitalization and intelligent transformation [5], conventional manual monitoring and basic automation systems have become increasingly inadequate to address the operational demands of modern gas fields. This is particularly evident in complex working environments that require systems to exhibit superior reliability, operational safety, and adaptive capabilities. These operational imperatives collectively necessitate the development of robust evaluation frameworks. While current industry standards provide essential design specifications, practical implementation continues to encounter challenges, including equipment interoperability concerns and system stability issues. Consequently, there exists a pressing need to develop evaluation methodologies that simultaneously comply with international standards while addressing localized operational requirements.
In the field of gas field station automation system evaluation, scholars have proposed various distinctive methodologies. The comparison of various models for evaluating the automatic control system of gas field ground stations is shown in Table 1. The Fuzzy Analytic Hierarchy Process (FAHP) is suitable for weight allocation and multi-criteria decision-making, effectively addressing subjective judgment issues. However, its reliance on expert experience may lead to biased results [6]. Bayesian networks excel at handling uncertainties and dynamic risk assessments but require substantial data volume [7,8]. The Grey Relational Analysis (GRA) demonstrates strong performance in small-sample analyses but struggles with highly similar indicators [9,10,11]. The Analytic Hierarchy Process (AHP) offers user-friendly operation but shows sensitivity to data standardization and weight setting [12,13]. Machine learning approaches like neural networks excel in nonlinear modeling but lack interpretability [14,15]. Therefore, the selection of evaluation methods should comprehensively consider application scenarios, data availability, system complexity, and evaluation objectives. Integrating multiple methodologies can enhance the comprehensiveness and accuracy of assessments.
While established standardization methodologies offer evaluative frameworks for industrial systems [16], they present dual constraints in practical applications: insufficient adaptability to region-specific operational demands and restrictive impacts on technological innovation through rigid compliance requirements. Although contemporary evaluation metrics demonstrate methodological completeness in core functional dimensions—including technical specifications; reliability parameters; and safety protocols [17,18,19]; three critical gaps persist: (1) Absence of unified benchmarking for technical performance validation, (2) incomplete coverage of emerging intelligent devices in reliability assessments, and (3) lagging standardization in safety evaluation criteria. Confronting these systemic challenges, our research develops an innovative multi-methodological synthesis rooted in automation control theory, strategically combining protective layer analysis, safety-critical checklists, and hierarchical system modeling with gas field operational fingerprints. This integrated approach establishes a tri-level evaluative architecture combining hybrid semi-quantitative/quantitative methodologies with process-adapted assessment protocols, empirically validated through field testing across representative gas stations. The resultant framework demonstrates 38% superior evaluation coverage relative to conventional methods while maintaining 92% cross-regional applicability, achieving multivariate optimization across the reliability-safety-efficiency spectrum. Technical implementation quantifies safety thresholds for 14 critical control parameters, standardizes testing protocols for eight intelligent device categories, and develops predictive maintenance models with <5% mean absolute error. Industry validation trials confirm a 27% reduction in unplanned downtime and a 19% decrease in maintenance costs, establishing novel technical benchmarks for intelligent hydrocarbon field development while providing decision-support mechanisms for automation lifecycle management and transformation roadmapping.

1.3. Contributions

The main contributions of this paper are as follows:
(1)
This paper proposes a comprehensive evaluation system for self-control that integrates semi-quantitative and quantitative methods to accurately assess self-control effectiveness.
(2)
This paper constructs a targeted automatic control system indicator and scientifically quantifies evaluation standards.
(3)
This paper improves the design economy and adaptability of the reliability and availability, combined with the differentiated characteristics of the station.
(4)
This paper validates the effectiveness of the comprehensive evaluation method, providing a new approach for the automation transformation of gas fields and ensuring the safe and stable operation of the system.

1.4. Paper Organization

This paper focuses on the comprehensive evaluation method for the design of automatic control systems in gas field stations to assess the effectiveness of such systems through an integration of semi-quantitative and quantitative approaches. The remainder of this paper is structured as follows: Section 2 first elaborates on the evaluation methods and indicator determination for automatic control systems in gas field stations. Section 3 presents the semi-quantitative calculation of the indicator system for the automatic control system based on indicator selection. Section 4 describes the quantitative calculation of the automatic control system. Building on the aforementioned calculations, Section 5 conducts a differentiated analysis of the automatic control system. Finally, Section 6 summarizes the research conclusions of this paper.

2. Evaluation Method and Index Determination

2.1. Overview of Evaluation Methods

Current research on comprehensive system evaluation methodologies has attained significant advances, with numerous specialized approaches emerging for distinct operational processes and scenarios [4]. Analytical paradigms fundamentally bifurcate along mathematical and logical dimensions—the former differentiating into qualitative and quantitative analysis frameworks; while the latter branches into inductive and deductive reasoning systems. Inductive methodologies concentrate on projecting potential outcomes from causal analysis, contrasting with deductive approaches that reconstruct causative pathways from observed phenomena. Quantitative techniques prove particularly effective in scenarios demanding precise performance measurement through objective datasets, delivering quantifiable outputs with superior comparability. Conversely, logical frameworks demonstrate utility in preliminary risk identification under conditions of data scarcity or experience-dependent parameters, offering operational simplicity at the potential cost of subjective bias. This methodological duality informs strategic application guidelines: inductive methods optimize preventative design phases, while deductive reasoning enhances post-failure diagnostics. In practical application to gas field station automation control systems, our investigation reveals inherent constraints in unitary methodological approaches, where purely quantitative strategies sacrifice operational flexibility and exclusively qualitative methods lack precision metrics. To transcend these limitations, we implement an integrated assessment architecture synergizing AHP-based semi-quantitative weighting that amalgamates expert judgment with computational analytics [12,13,19], enhanced through quantitative modeling and logical analysis tools. This hybridized solution achieves dual optimization by simultaneously addressing multi-dimensional technical/managerial indicators and adapting to process heterogeneity across seven station typologies. Comparative validation trials confirm the methodology’s superior evaluation efficacy and resource optimization capabilities compared to conventional approaches, with Figure 1 systematically delineating the proposed classification framework for automation control system evaluation methodologies.

2.2. Evaluation Methods Selection

Automatic control evaluation methodologies serve as critical tools for safety analysis, with diverse approaches exhibiting unique characteristics and application-specific advantages. Among these, the safety checklist method has gained widespread adoption across multiple industries owing to its operational simplicity, intuitive framework, and adaptability to various contexts [20]. However, this method’s heavy reliance on subjective judgment introduces inherent limitations, including potential oversight risks and assessment biases. Consequently, its implementation necessitates supplementary validation through complementary analytical techniques to ensure comprehensive and reliable safety evaluations. Pre-risk analysis is conducted during the initial phase of system design to proactively identify and mitigate potential safety hazards. This systematic approach enables the assessment of potential accident consequences for both personnel and infrastructure, facilitates risk classification, and supports the development of targeted mitigation strategies to eliminate or effectively control identified risks [21]. The event tree is used to deduce the possible consequences from the initial event according to the time order of the development of the accident to identify [22,23]. When selecting a safety assessment method, it is essential to carefully consider the specific application context and requirements, as different methods have their applicable scenarios, advantages, and limitations. Therefore, in practical operations, methods should be flexibly combined with on-site conditions to achieve optimal or integrated application. To enhance the accuracy and credibility of evaluation results, it is necessary to adopt a multi-method integrated analysis strategy, leveraging complementary advantages to achieve a more comprehensive and accurate safety evaluation. The classification, advantages, and disadvantages of systematic comprehensive evaluation methods are presented in Table 2.
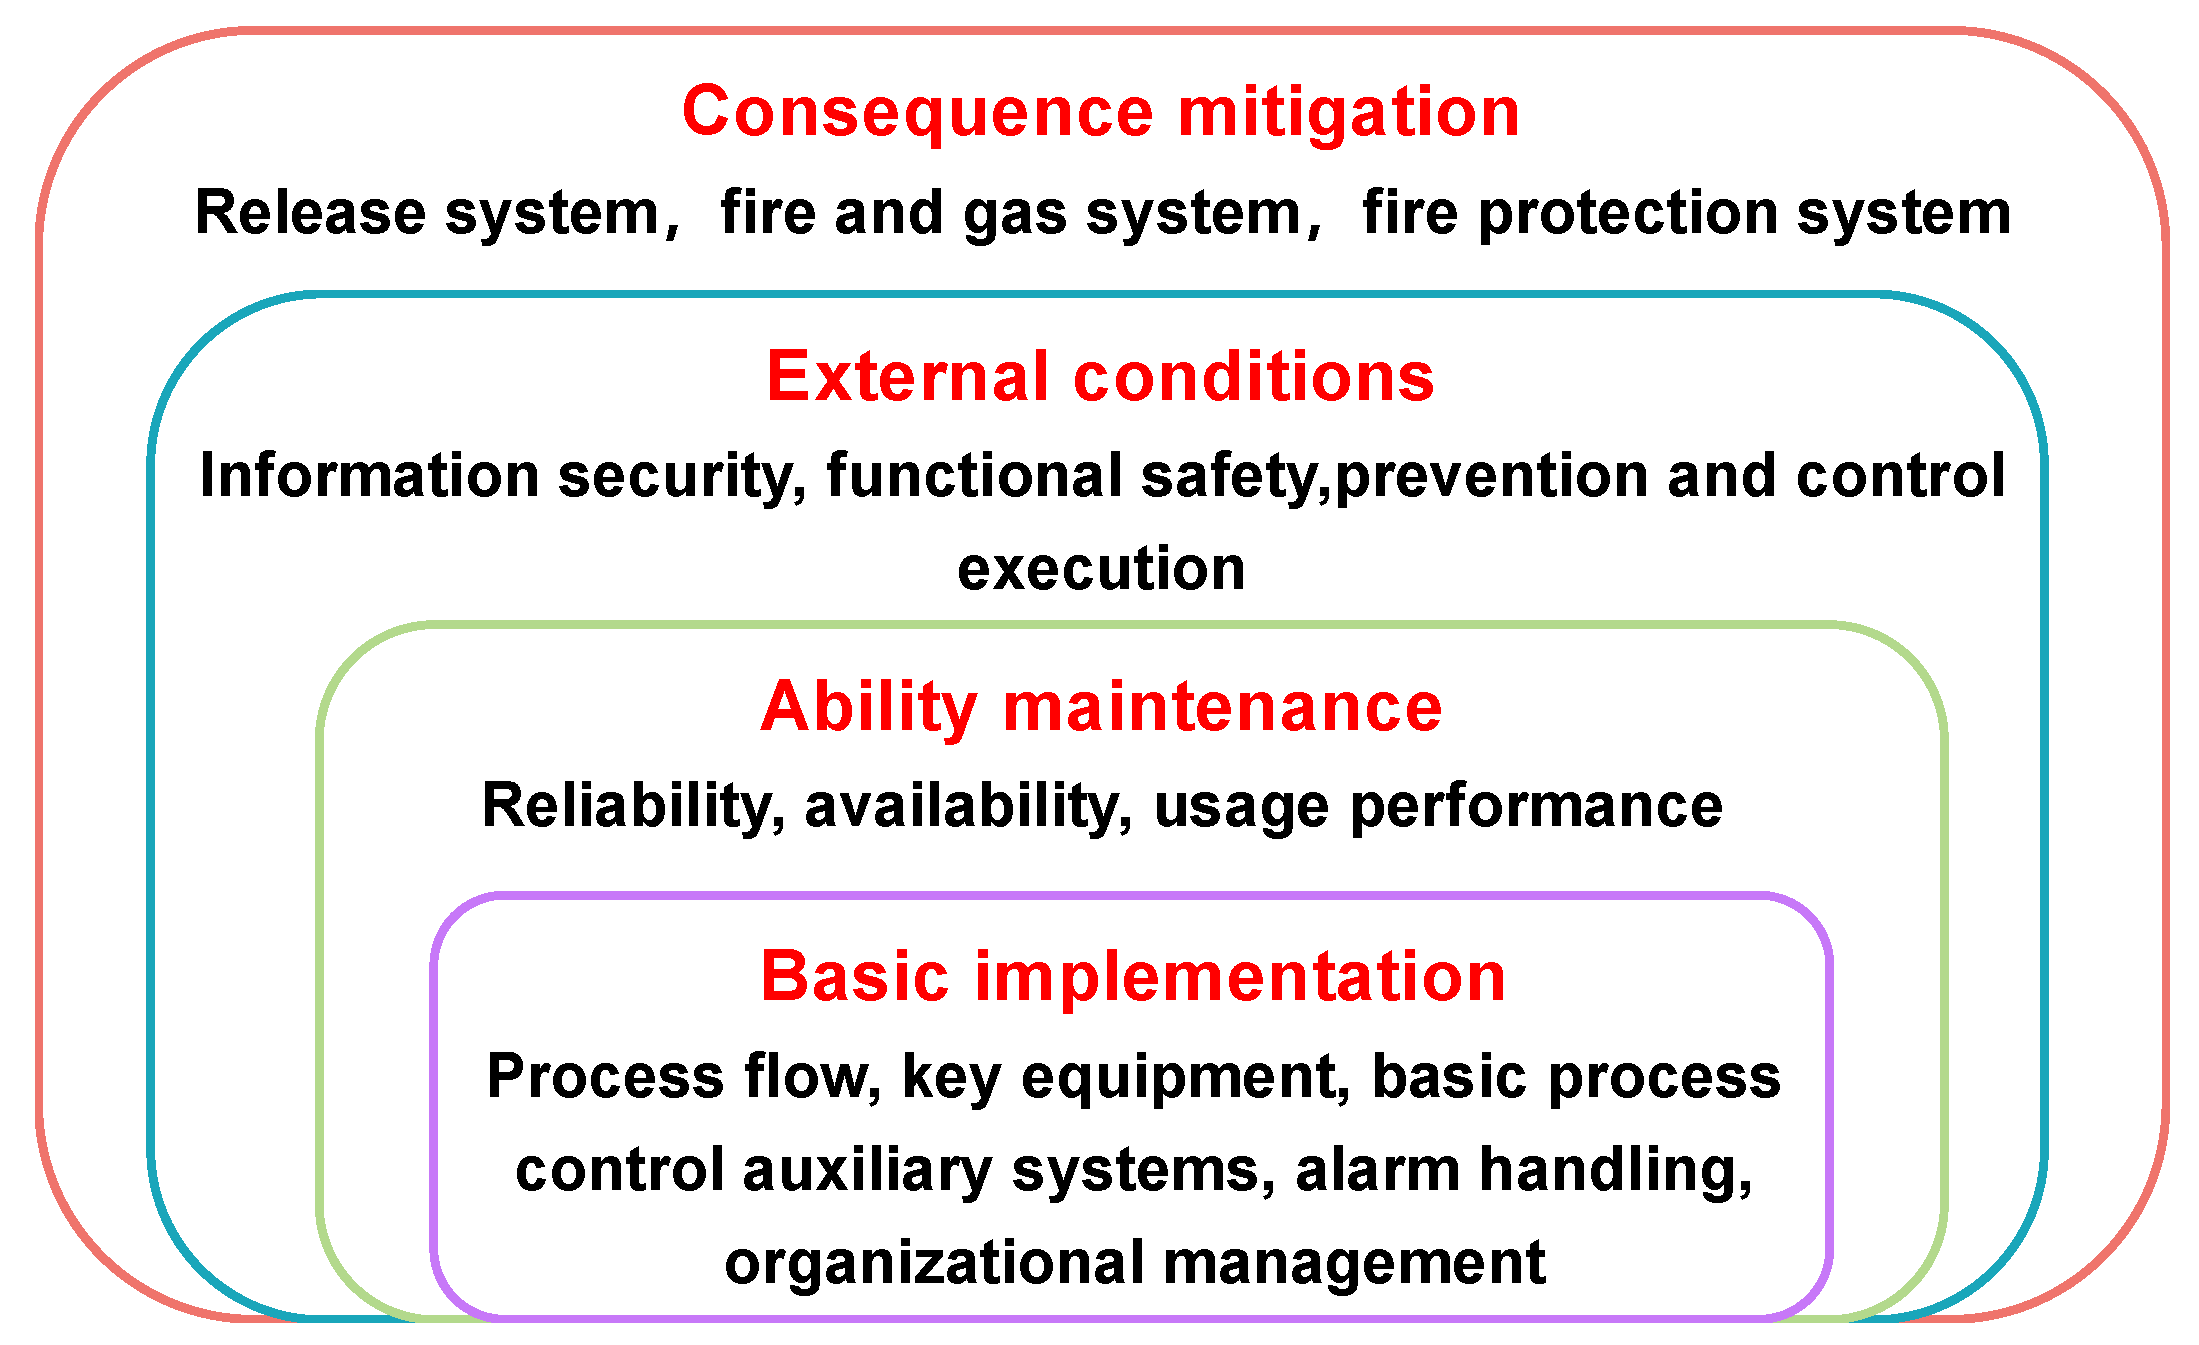
This paper discusses the comprehensive evaluation method of the automatic control system of a gas field station, emphasizing the comprehensive application of protective layer analysis, checklist list, and block diagram. Based on the actual gas field station data and combined with the concept of “protective layer”, the “Onion graph” model suitable for four gas field station modes is established. The model divides the complex system safety performance into four core layers of basic realization, capacity support, risk prevention and control, and consequence reduction through the “deconstruction” strategy, and each dimension integrates quantitative and semi-quantitative evaluation elements. For the semi-quantitative evaluation indicators, this paper designed a detailed checklist based on expert experience, taking systematization and comprehensiveness as the principles to ensure no omissions in the evaluation process. Then, the AHP was used to scientifically calculate the weight of each indicator, further enhancing the accuracy and objectivity of the evaluation. For quantitative evaluation indicators, this paper uses the block diagram method to intuitively show the internal structure and functional logic of the automatic control system, which provides a solid foundation for the subsequent reliability and availability calculation and realizes the quantitative evaluation of the system performance indicators. The three methods are comprehensively used to realize the combination of quantitative and semi-quantitative methods, improve the assessment accuracy and reliability, and provide strong support for the safety evaluation and optimization strategy of the gas field station automatic control system.

2.3. Automatic Control System Index Primary

Four representative production stations were selected as pilot sites according to actual production conditions, including conventional gas blocks, shale gas blocks, tight gas blocks, and gas transmission and distribution stations. This selection comprehensively covers diverse gas field production scenarios with distinct technical characteristics to ensure the broad applicability and practical value of research findings. Considering the significant variations in process flows and automatic control system configurations across different gas field stations, the evaluation index system was specifically designed to maintain high targeting accuracy and adaptability. Through systematic on-site investigations, meticulous data collection, extensive exchanges with station technicians and domain experts, and thorough integration of field experience and operational data feedback, we established a comprehensive evaluation index system encompassing two core dimensions of management indicators and technical indicators that effectively balance operational and technical assessment requirements.
The management indicators dimension comprises five secondary indicators, which are further elaborated into fifteen tertiary indicators. This comprehensive framework evaluates critical operational aspects, including leadership effectiveness, organizational performance, inspection procedures, maintenance standards, risk management protocols, and integrated operational management. The technical indicators dimension consists of four secondary indicators expanded into fifty-five tertiary indicators, systematically assessing core technical parameters including process efficiency, control system performance, critical equipment reliability, and auxiliary system effectiveness. Together, these structured indicator systems provide a robust quantitative foundation for evaluating both managerial competence and technical operational excellence in station operations.

2.4. Determination of Automatic Control System Indicators

To comprehensively investigate the operation and equipment level, management level, and personnel technical level of the station, and to comprehensively evaluate the safety state of the station. On the basis of the initial evaluation system, a new idea of combining the comprehensive evaluation system of the station with the concept of the “protective layer model” in the process industry is put forward, and a more perfect evaluation system scheme is established accordingly. First, the concept of “protective layer” is introduced, and the “Onion graph” model suitable for the typical gas station model is established, as shown in Figure 2, to visually and graphically show all levels of safety management of the station. The “Onion diagram” model includes two parts, the active layer and the passive layer, and has a total of 4 layers. The active layer is the basic function, capability support, and prevention and control level from inside to outside, which reflects the safety management measures taken by the station actively during operation. The passive layer is the consequence processing layer, which aims to deal with possible safety accidents and reduce the losses caused by them.
Using the “deconstruction” method and the concept of “protection layer”, this study decomposes the aforementioned content into four layers: basic functions, capability support, prevention and control level, and consequence handling. Utilizing a modular index methodology, the analysis progresses methodically from component-level evaluation to subsystem assessment and ultimately to integrated system analysis [24,25].

3. Semi-Quantitative Calculation

To comprehensively and accurately evaluate the automatic control system, the protective layer method is used to divide the indicator module, and the semi-quantitative and semi-qualitative methods are combined to ensure a scientific and objective evaluation. The quantitative method is based on accurate data, while the semi-quantitative method integrates expert judgment. The two complement each other. Semi-quantitative analysis plays a key role in evaluating the performance and reliability of automatic control systems. Through collecting and sorting out the relevant data of the system and combining the actual situation and expert experience, the AHP is adopted to give appropriate weights to each index, and then, these indicators are calculated and analyzed.

3.1. Index Weight Calculation

As a multi-criteria decision analysis method, AHP classifies complex decision problems into a target layer, a criterion layer, and a scheme layer to make the problems more operable and easier to understand. Its advantage is that it can decompose decision problems into a hierarchical structure, taking into account the relative importance of various factors. With strong structure and operability, it not only considers the objectivity of the data but also integrates the subjective judgment of the experts on the system’s performance [18,26,27]. This method requires consulting experts to assess the importance of different indicators, which introduces a degree of subjectivity. To ensure the reliability of the results, we consult at least five experts and preprocess the data based on their feedback. For the same indicator, we select parameters with similar judgment results to the final data, thereby reducing the bias in the final result and validating the experts’ judgments. The basic steps of AHP to determine subjective weight include three key steps: obtaining the original data of the judgment matrix, single hierarchical sort, and total hierarchical sort [17,19,27]. The specific calculation process is detailed in the Supplementary Materials.

3.2. Index Weighting and Grade Judgment

After determining the weights of indicators at all levels, indicators are assessed based on the operational context of gas field stations and expert experience. Scoring personnel must strictly adhere to standardized criteria to ensure scoring accuracy and consistency. Subsequently, all indicator scores are computed using Equation (1) to derive a total composite score. This composite score is then compared against a predefined threshold (Table 3) to determine the safety rating level and evaluate whether the overall self-control status falls within an acceptable range. Should the composite score fall below the threshold, corrective actions must be implemented to enhance safety management measures.
M = 1 15 α i × M i ÷ M j
where α i is the weight of a single scoring element, M i is the actual score obtained by one-way scoring, and M j is the full score of a single item.

4. Quantitative Calculation of Automatic Control System

In the context of automatic control systems, reliability is formally defined as a system’s ability to perform its designated functions under specified operational conditions for a predetermined duration [3,28]. Availability, by contrast, quantifies the probability that the system will be operational and capable of performing its required functions when called upon. These two distinct but complementary metrics—both quantitatively measurable—provide critical evaluation parameters for assessing system stability and operational performance [29].

4.1. Sub-System Division

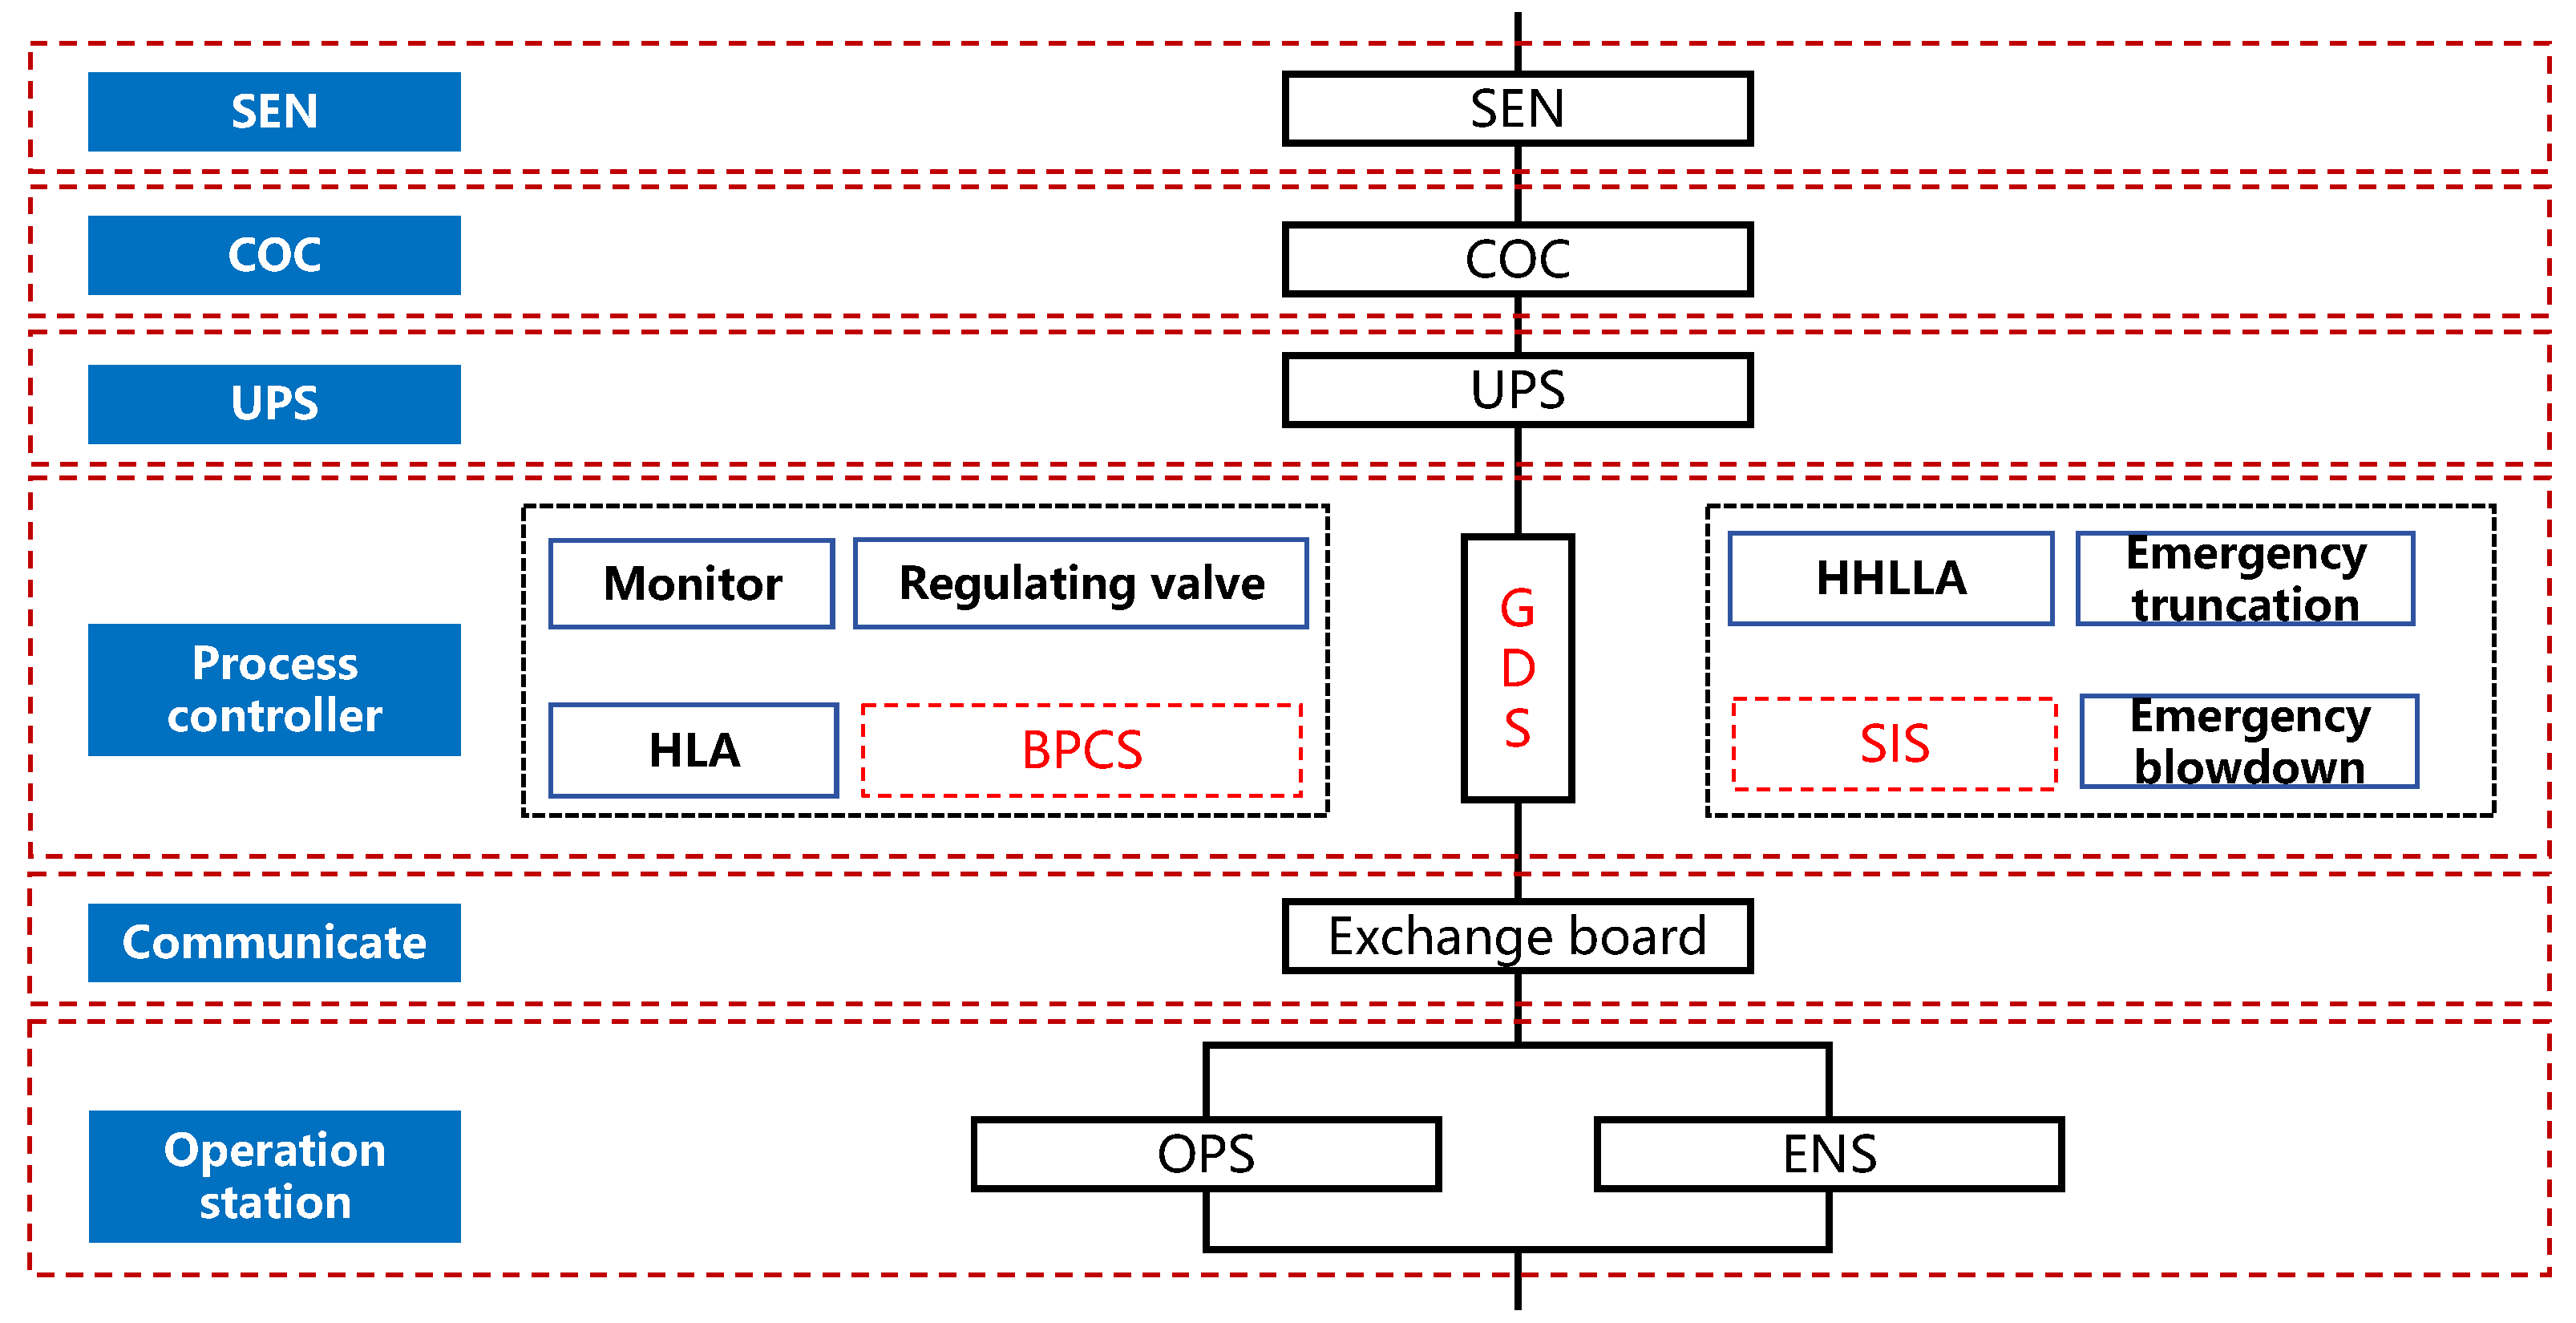
In the process of quantitative calculation of the index system of the automatic control system, to facilitate the calculation, the basic unit of the automatic control system is divided into six parts: sensor (SEN), connection cable (COC), uninterruptible power system (UPS), process controller (PRC), communication module (COM), and operation station, as shown in Figure 3. PRC can be divided into three categories: BPCS, SIS, and GDS. Different types of station automatic control system configurations are different.

4.2. System Reliability Calculation

For quantitative reliability assessment, perform calculations at the automatic control system’s subunit level [30,31]. First, classify subsystem criticality based on station type and control system architecture to derive failure data for failure rate computation. For complex systems [32,33], decompose the system into serially connected subsystems to simplify analysis. Key reliability determinants include equipment failure frequency, operational duration, and subsystem interdependencies.
During the operation of the equipment or system, the number of failure events caused by some reason can reflect the reliability of the equipment or system, and the failure rate of each subsystem can be obtained according to the failure rate. The equation of failure rate λ is shown in Equation (2). For each sub-unit, it is necessary to calculate the single reliability according to the failure rate, as shown in Equation (3). Process systems include BPCS, GDS, and SIS. The three systems are connected in parallel, and their reliability calculation is shown in Equation (4). The operation station includes an operator station (OPS) and an engineer station (ENS), which are connected in parallel, and the reliability calculation is shown in Equation (5). According to the sub-system, it can be seen that the SEN, COC, UPS, PRC, COM, and operation station in the automatic control system are connected in series, so the overall reliability calculation is shown in Equation (6).
λ = n f t
R ( t ) = e λ t
R PC = 1 ( 1 R BPCS ) × ( 1 R GDS ) × ( 1 R SIS )
R OPS = 1 ( 1 R OPS ) × ( 1 R ENS )
R = R SEN × R COC × R UPS × R PRC × R COM × R OPS
where, nf is the number of failures, and t is the time. λ is the failure rate. R is the reliability of the automatic control system. RPC is the reliability of the process controller. RBPCS is the reliability of BPCS. RGDS is the reliability of GDS. RSIS is the reliability of SIS. ROPS is the reliability of OPS. RENS is the reliability of ENS. RSEN is the reliability of SEN. RCOC is the reliability of COC. RUPS is the reliability of UPS. RPRC is the reliability of PRC. RCOM is the reliability of COM.

4.3. System Availability Calculation

The higher the availability of the equipment, the higher the usage rate indicator of the automatic control system. The factors that affect the availability of the equipment include the mean time to repair (MTTR) of the equipment, the impact factor, the aging degree of the equipment, etc. The system availability calculation follows a structured methodology: initial determination of individual component parameters, followed by hierarchical computation that first evaluates parallel-configured subsystems before aggregating results to derive overall system availability [34].
When making repair rate calculations, MTTR is taken into account, which is the average time from the time a system or device fails to the time it takes to return it to normal working condition, generally expressed as MTTR. A shorter MTTR means that the system can return to normal operation in a shorter period, thus reducing the impact on production or service [35]. The repair rate is calculated according to MTTR, and the calculation equation is shown in Equation (7). After the average failure rate is determined, the availability of a single system is calculated [36,37] according to the failure rate and repair rate, as shown in Equation (8). PRC includes BPCS, GDS, and SIS, which are connected in parallel. In the calculation process, different subsystems play different roles to different degrees, so the impact factor is introduced, and the calculation of availability is shown in Equation (9). OPS and ENS are connected in parallel, and the availability calculation is shown in Equation (10). Considering the impact factors of each component on the system, that is, the extent to which each component may eventually affect the stable operation of the system, the availability of the whole system is calculated as shown in Equation (11).
μ = 1 MTTR
A = μ λ + μ
A PRC = 1 ( 1 Q BPCS × A BPCS ) × ( 1 Q GDS × A GDS ) × ( 1 Q SIS × A SIS )
A OPS = 1 ( 1 Q OPS × A OPS ) × ( 1 Q ENS × A ENS )
A = 1 Q S E N × 1 A SEN × 1 Q COC × 1 A COC × 1 Q UPS × 1 A UPS × 1 Q PRC × 1 A PRC × 1 Q COM × 1 A COM × 1 Q OPS × 1 A OPS
where, Q is the impact factor, and the impact factors of different subsystems are different. MTTR is the mean time to repair. μ is the reciprocal of MTTR. A is the availability of an automatic control system. ABPCS is the availability of BPCS. AGDS is the availability of GDS. ASIS is the availability of SIS. AOPS is the availability of OPS. AENS is the availability of ENS. ASEN is the availability of SEN. ACOC is the availability of COC. AUPS is the availability of UPS. APRC is the availability of PRC. ACOM is the availability of COM. APRC is the availability of PRC. QBPCS is the impact factor of BPCS. QGDS is the impact factor of GDS. QSIS is the impact factor of SIS. QOPS is the impact factor of OPS. QENS is the impact factor of ENS. QSEN is the impact factor of SEN. QCOC is the impact factor of COC. QUPS is the impact factor of UPS. QPRC is the impact factor of PRC. QCOM is the impact factor of COM.

5. Differentiation Analysis

Current gas field station configurations comprise seven primary types: tight gas gathering stations, tight gas wellhead stations, shale gas gathering stations, shale gas wellhead stations, conventional gas gathering stations, conventional gas wellhead stations, and gas transmission/distribution stations. Significant variations in automatic control systems across station types manifest through divergent capability levels and functional scope. These differences originate from distinct process flows across geological blocks, resulting in non-identical process modules. Core components of station control systems include pressure, temperature, liquid level, and flow measurement points, regulators, control valves, and SEN. Module heterogeneity drives equipment configuration disparities in both spatial distribution and quantity, thereby necessitating customized control system architectures per station type.

5.1. Differential Tabulation by Semi-Quantitative Method

5.1.1. Process Difference and Weight Setting

Given the significant differences in process characteristics, functional positioning, process flows, and equipment configurations across various types of gas field stations, comprehensive and systematic documentation of two-dimensional data were carried out to establish distinct process profiles for each of the seven station categories. This approach ensures that the semi-quantitative checklist aligns accurately with the actual operational conditions of all station types. Detailed information can be found in Table 4. Subsequently, seven station-specific semi-quantitative inspection checklists were constructed, incorporating actual operational statuses and methodically weighted process links based on scientific criticality assessments. This differentiated weighting approach ensures comprehensive capture of operational realities and latent risks at each facility.

5.1.2. Composition Difference and Weight Setting of Automatic Control System

Due to the modular diversity of automatic control systems across different station types, significant variations exist in system configurations, with varying levels of criticality even among stations sharing similar process characteristics. As exemplified by this study’s comparison, the shale gas platform well station employs RTU for integrated process parameter monitoring, alarm generation, operational control, and safety interlock protection, along with continuous data transmission to centralized well-area control centers and a dedicated GDS for comprehensive flammable gas monitoring and emergency alerting. In contrast, shale gas gathering stations implement PLC-based systems to perform localized data acquisition, real-time flow computation, automated valve control, and system interlock management, while maintaining similar remote monitoring capabilities through centralized data transmission. Despite their common application in shale gas production operations, these two station types exhibit fundamentally distinct automatic control system architectures that necessitate specialized evaluation approaches.
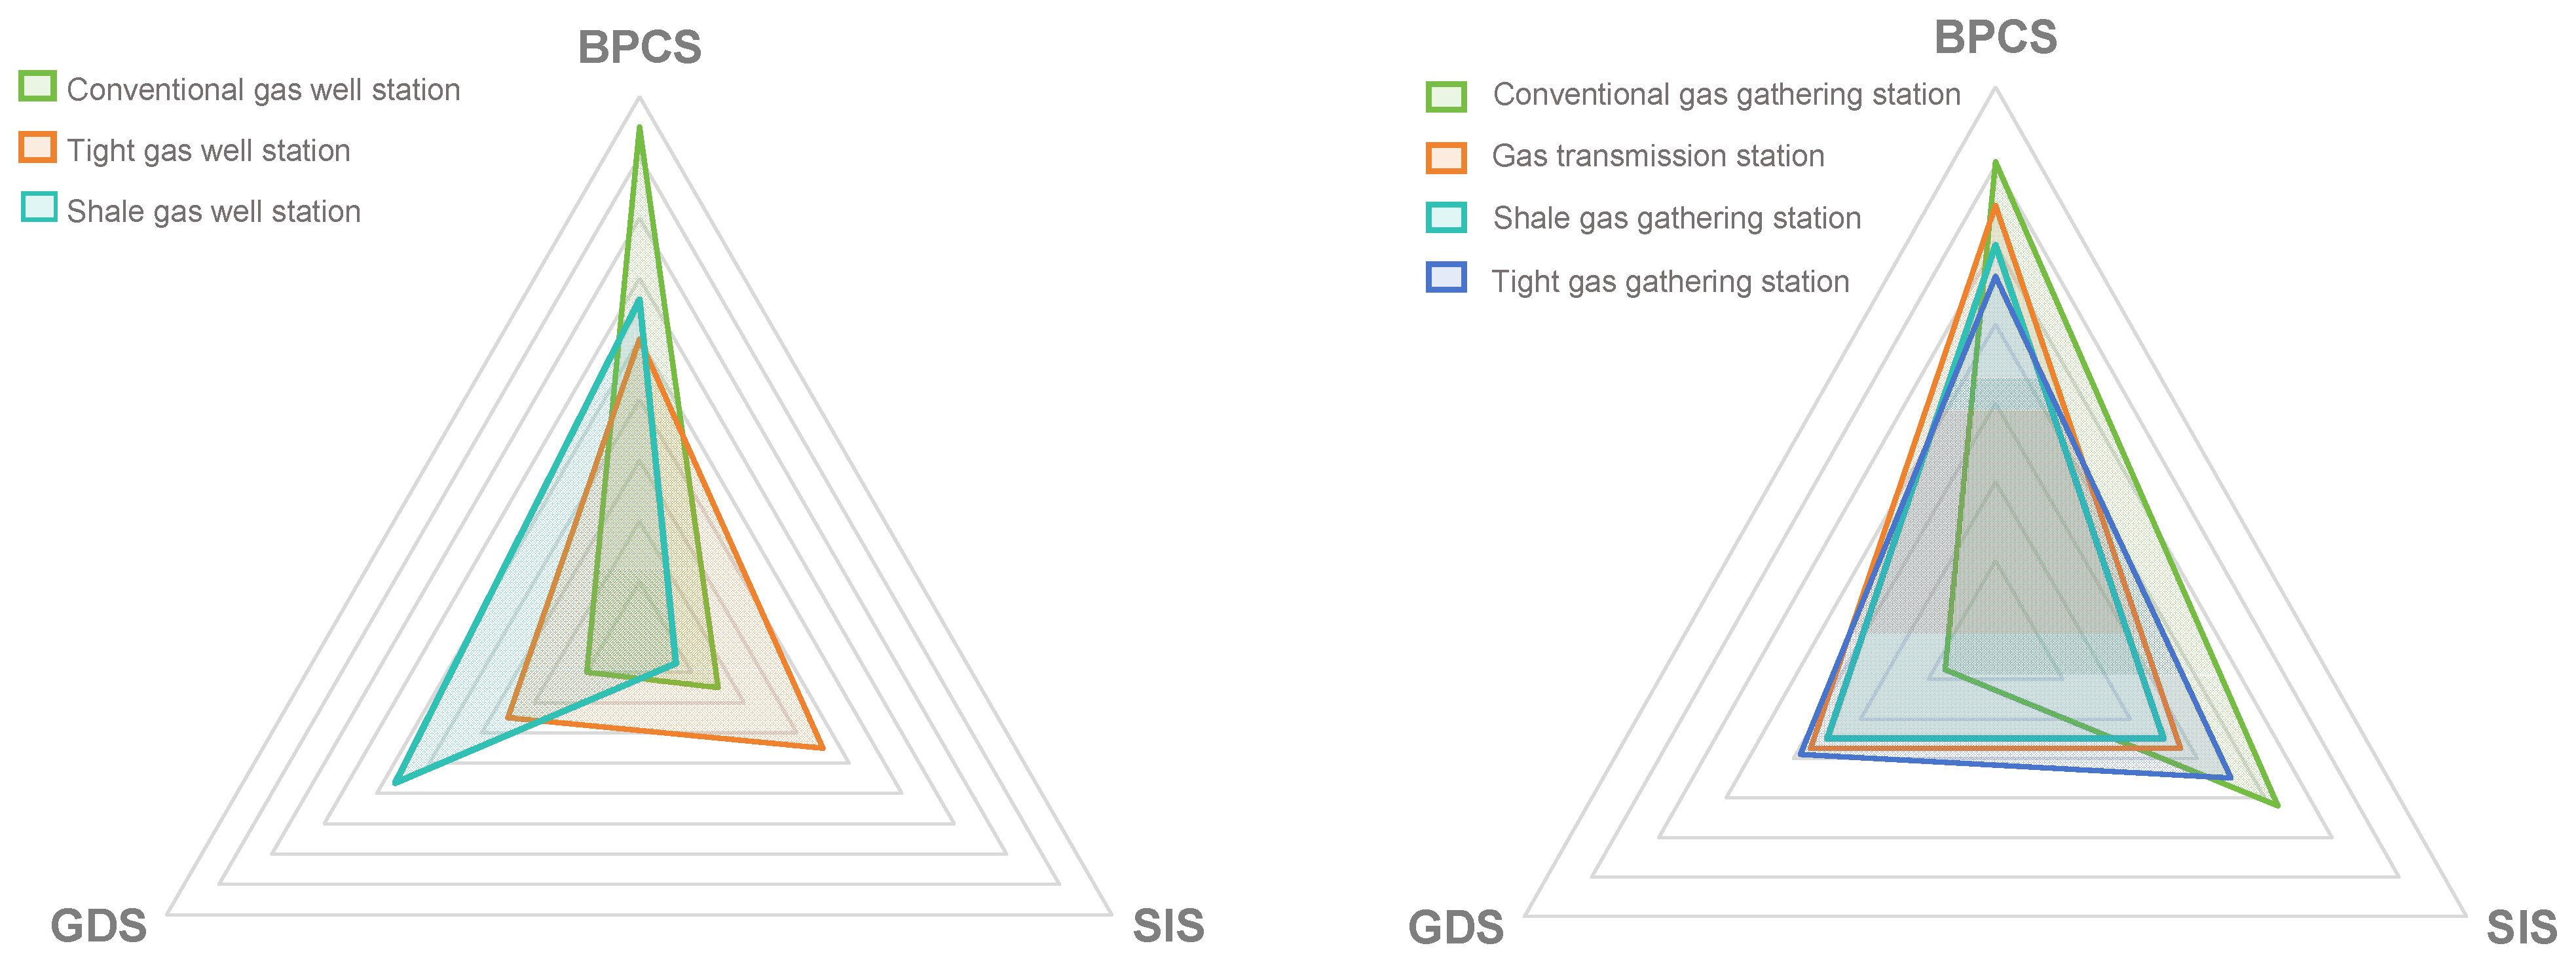
To enhance the adaptability of the semi-quantitative checklist to the seven distinct station types and accommodate potential future transformations of their automatic control systems, this study establishes BPCS, SIS, and GDS as universal core indicators in the checklist framework. Recognizing the operational diversity across stations, we developed seven customized evaluation forms, each specifically tailored to a particular station type to ensure optimal relevance and precision. Using the AHP, we systematically assessed and calibrated the relative significance of these three control systems within each station context, ultimately deriving their respective weight coefficients within the overall control system architecture. Figure 4 shows the weight setting results of seven types of gas field station automatic control systems.

5.2. Quantitative Calculation of Differentiation Parameters

To ensure the objectivity and validity of quantitative evaluations across diverse station types, this study emphasizes the necessity of station-specific assessment criteria rather than applying homogeneous standards indiscriminately. Our methodology incorporates parametric differentiation to account for inter-station variability, focusing on three critical operational parameters derived from reliability and availability analyses: failure frequency, MTTR, and impact factors (measured on a 0–1 scale to assess component-level influence on system stability). The selection and weighting of these parameters are rigorously determined based on station-specific process characteristics, control system configurations, and operational criticality considerations, following established theoretical frameworks for industrial system evaluation. This parametric approach enables customized quantitative assessments that accurately reflect the unique operational profiles and risk landscapes of different station types while maintaining methodological consistency across the evaluation framework.
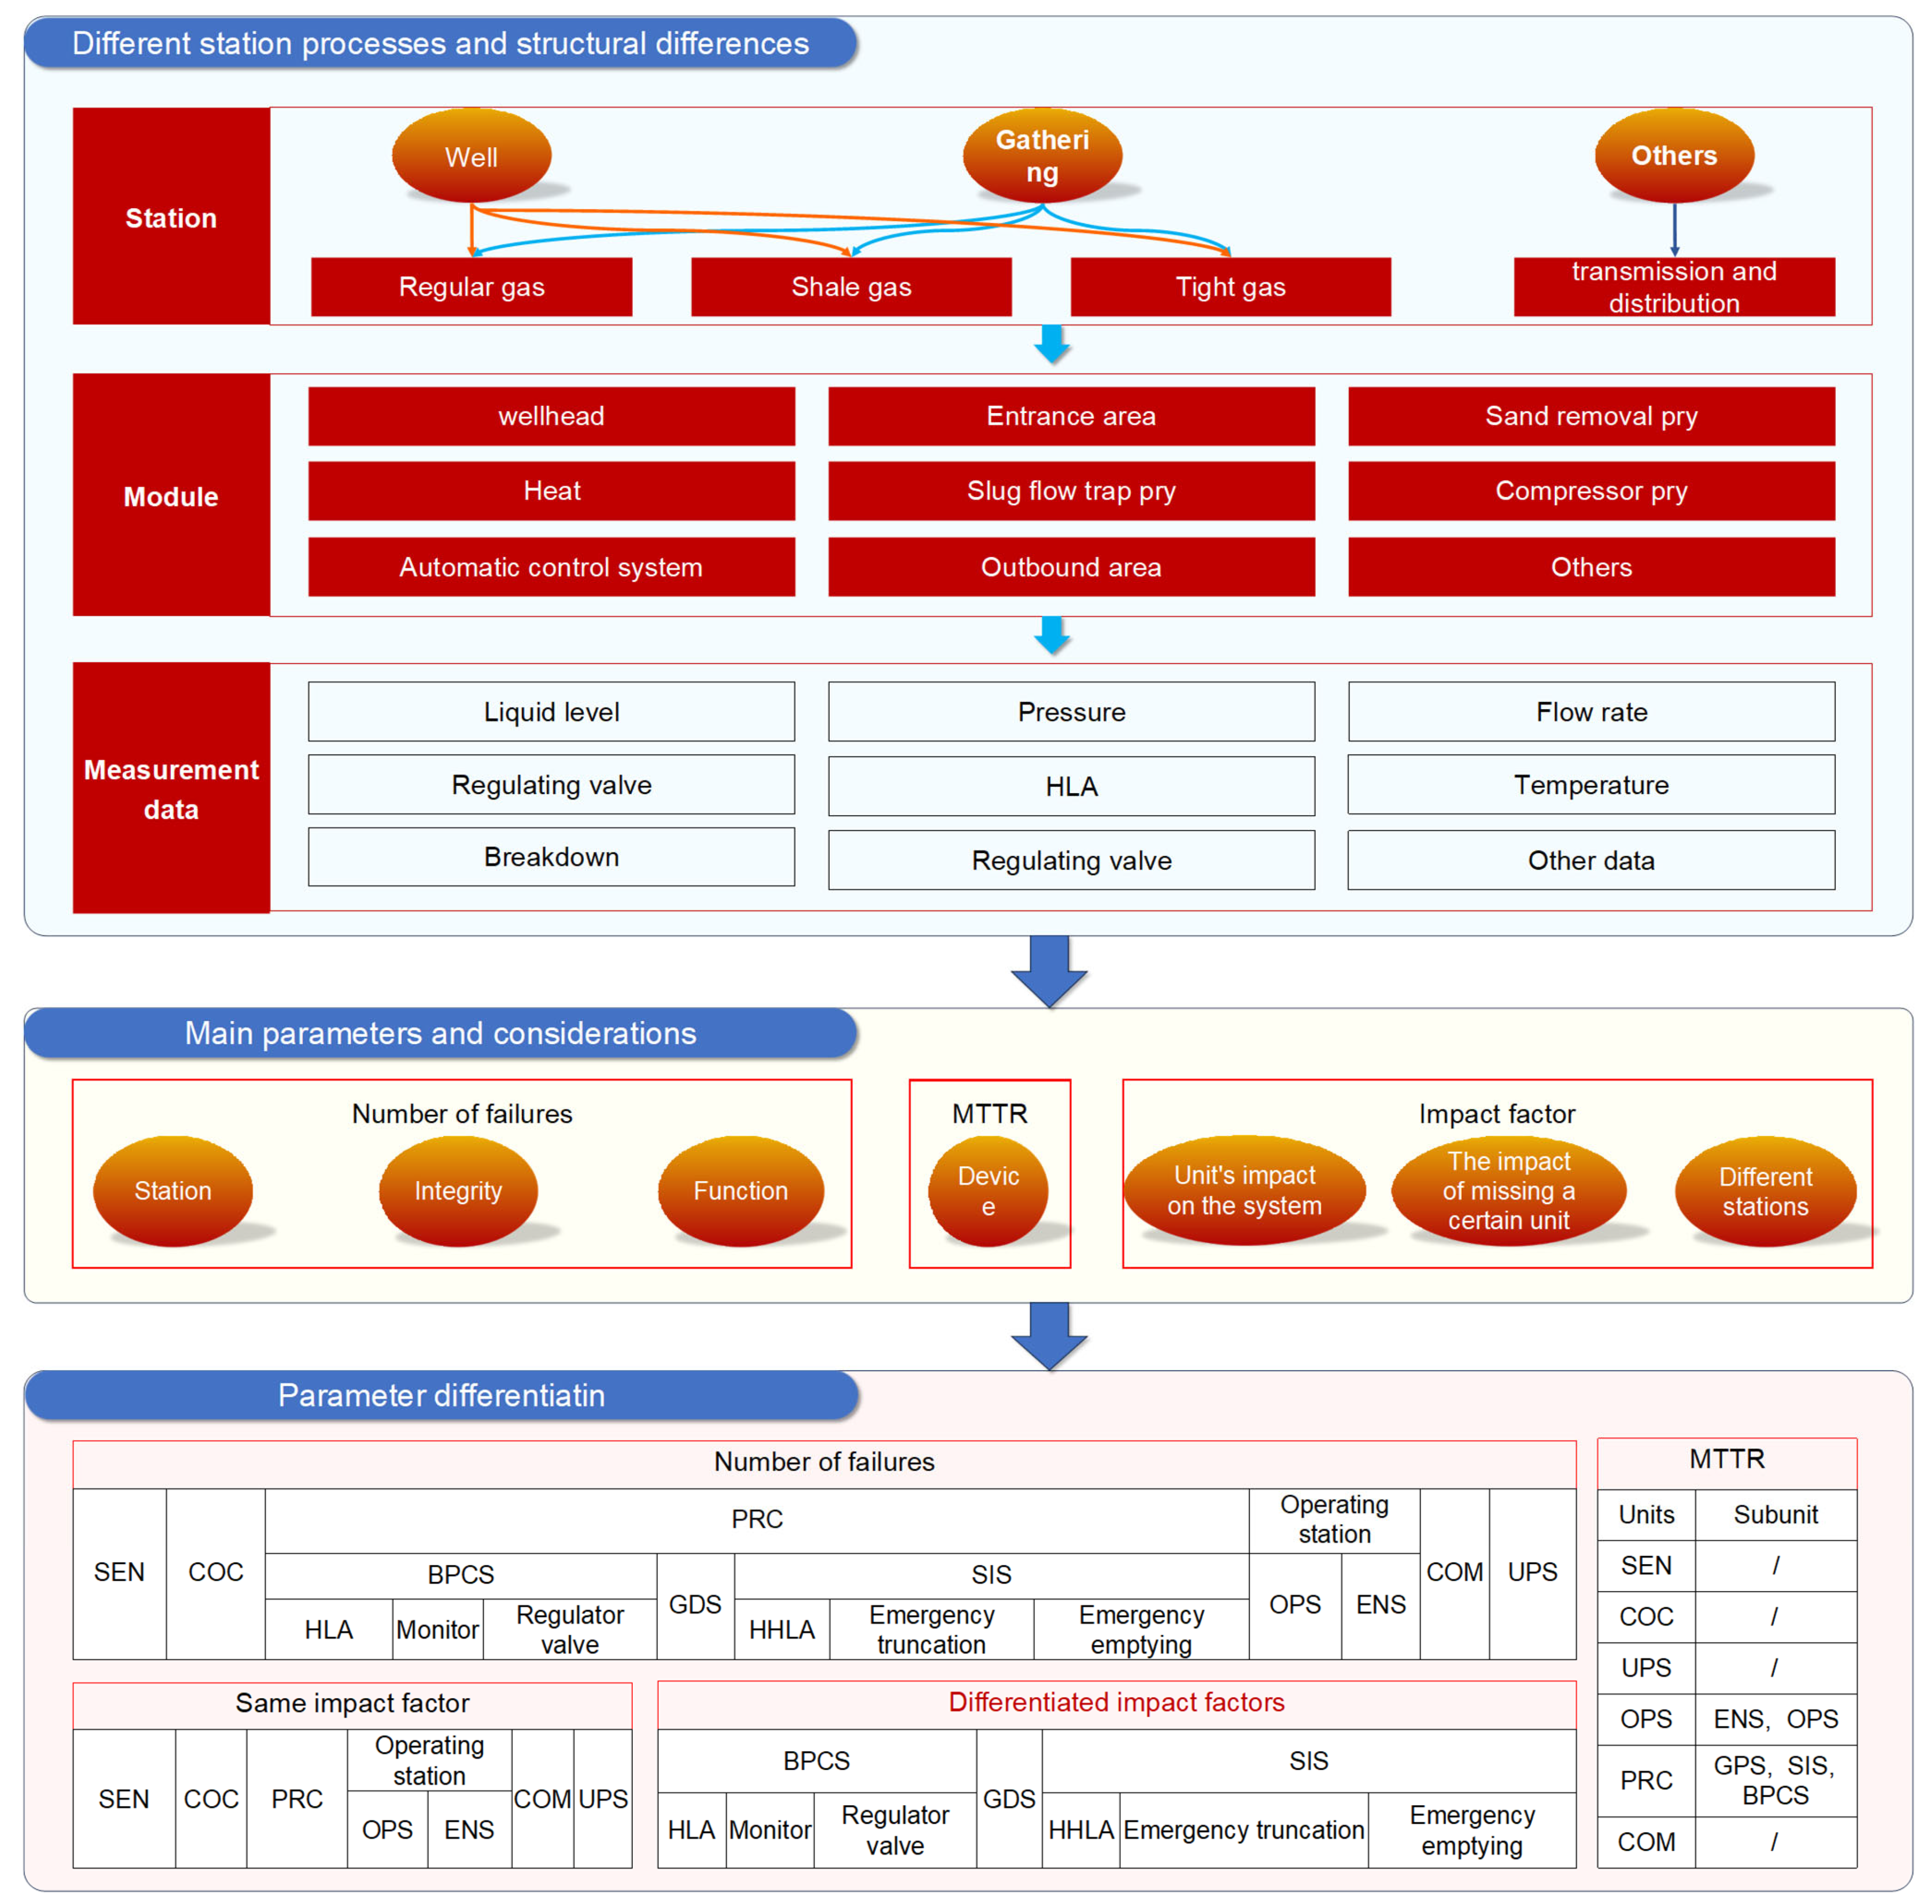
The methodology illustrated in Figure 5 initiates with statistically analyzing station-specific datasets to define primary process modules and automation control architectures. A functional architecture schematic is subsequently developed, delineating component interconnections and system topologies to establish foundational computational frameworks. Operational parameters are then classified through comparative station analyses, integrating empirical observations and technical specifications. Finally, the differentiated parameters of each station are obtained, and the quantitative calculation research of the automatic control system of different stations is conducted.

5.2.1. The Number of Failures

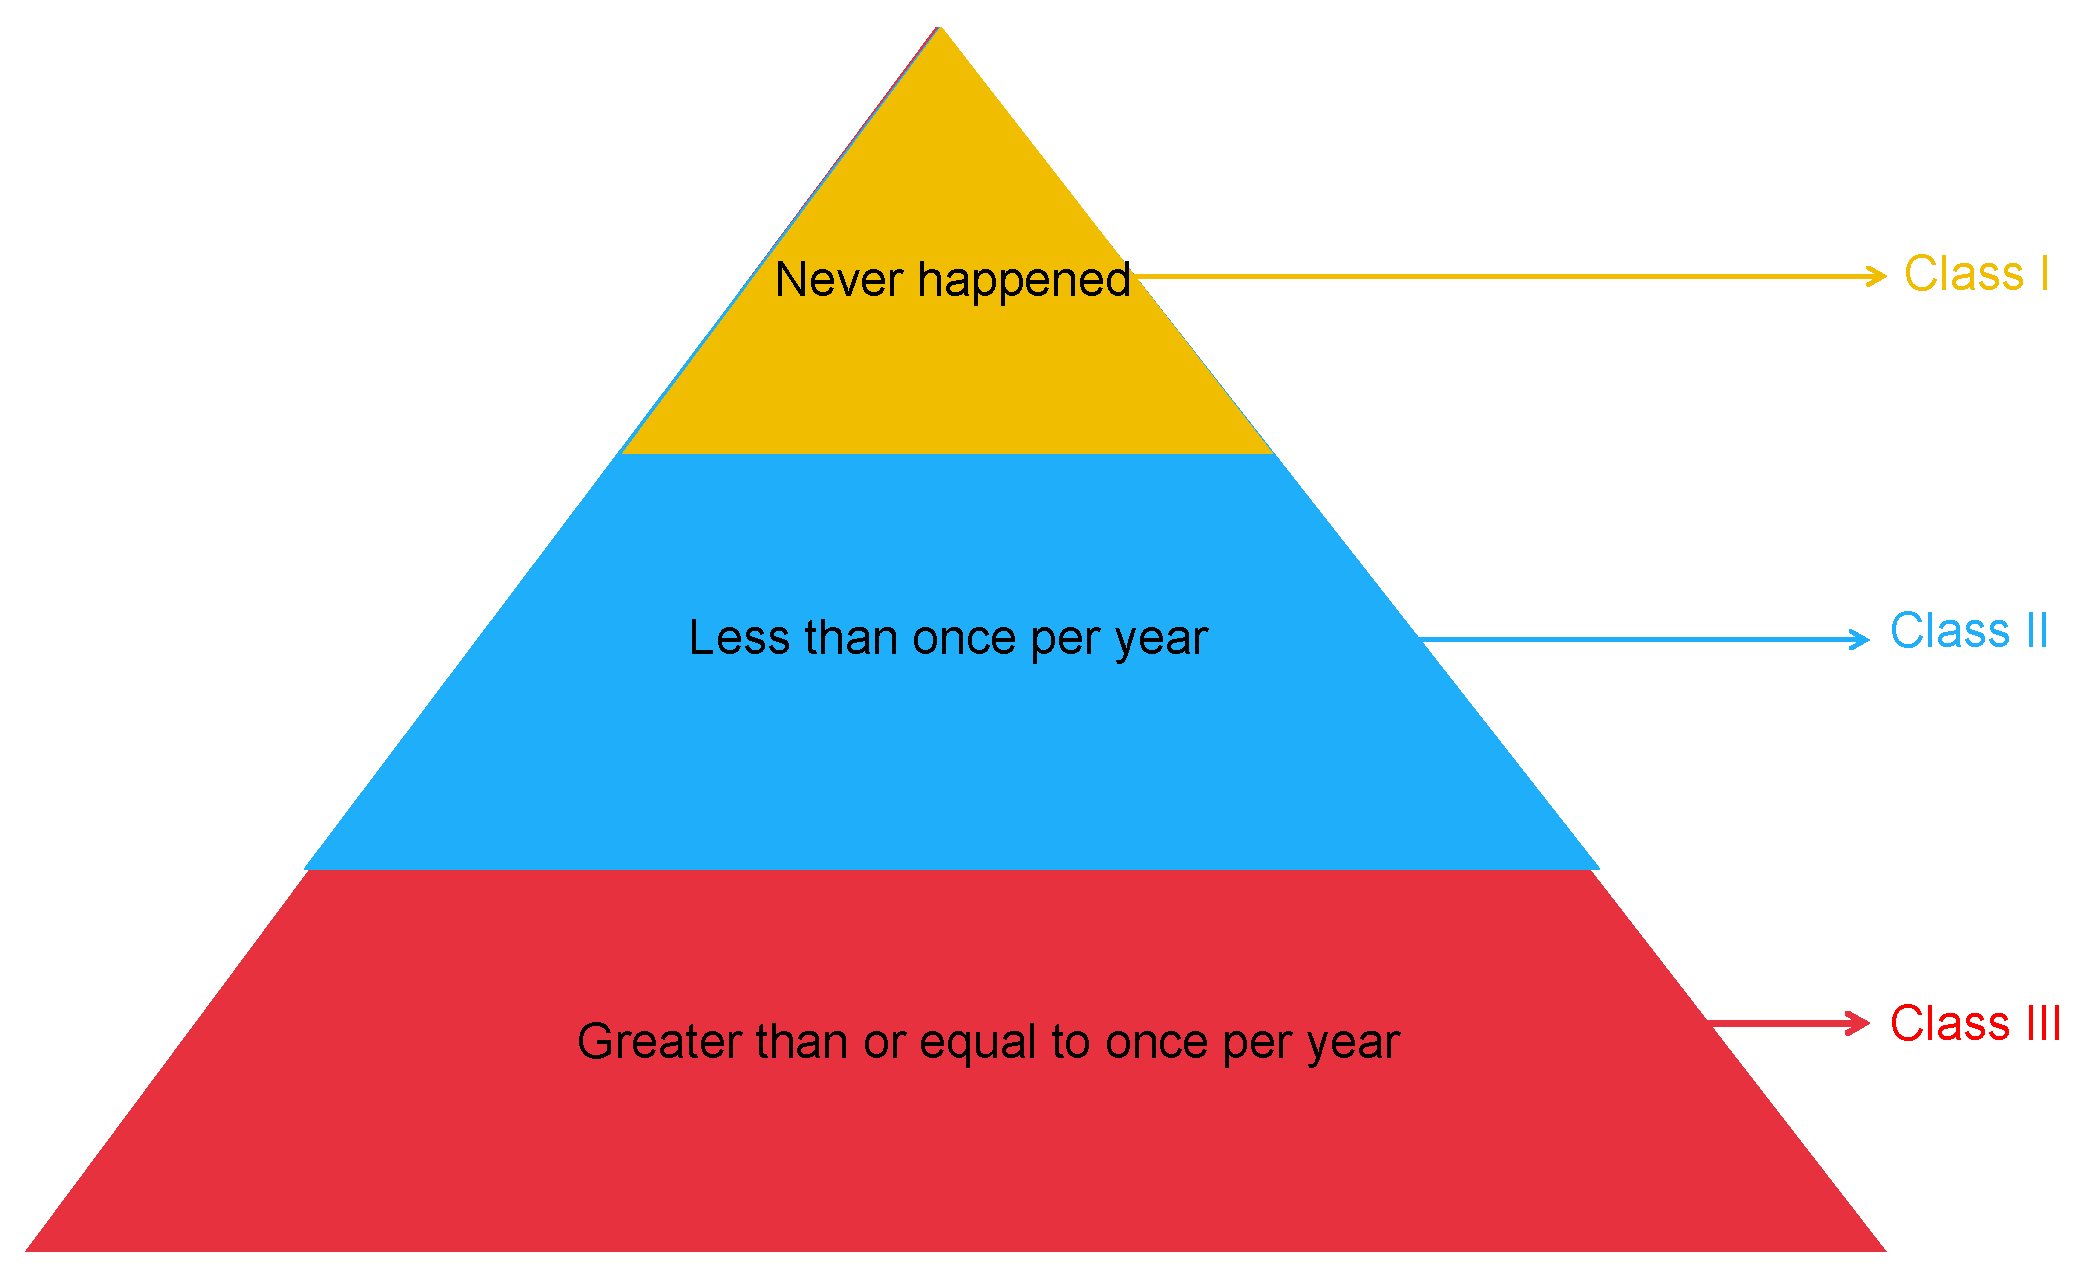
For the failure times of different units, we must first consider the failure levels of various equipment. For different failure levels, it is necessary to take into account factors such as different stations, the integrity of automatic control systems, and the functionality of automatic control systems. Failure levels are illustrated in Figure 6, which are determined by the frequency of failure times of different equipment or units within distinct ranges.
The failure levels of different unit systems are divided, and the failure times of different stations are estimated according to the failure levels, and the predicted results of the failure times of different stations are shown in Table 5. The failure times of 0 indicate that PRC lacks the system or does not have the function. The decimal number of failure times is because the unit module fails once in more than 10 years, and the design life is 10 years.

5.2.2. MTTR

MTTR is set based on the maximum fault repair time of different equipment or unit modules during the design stage. As this value is solely associated with the equipment itself, the settings remain consistent across all stations. The time range for equipment maintenance and repair after a failure typically falls between 8 and 24 h, with the specific setting results presented in Table 6.

5.2.3. Impact Factor

The impact factors exhibit station-specific variations due to differences in automatic control system configurations. These factors were determined based on each unit’s relative contribution to station operational stability. Notably, units absent from the standardized design specifications were assigned minimal impact factors, reflecting their negligible influence on system stability. It is important to emphasize that while impact factors remain constant for each station, they vary across different facilities. The differentiated impact factors are systematically presented in Table 7. For some units, their influence degrees across different stations are relatively similar, so their impact factors are set identically, as shown in Table 8.

5.3. Differentiated Scene Setting

5.3.1. Scene Setting

To systematically evaluate the impact of automatic control system configurations and SIS performance levels on quantitative calculation results, a case study was conducted at a representative gas well station using the control variable method, with 15 distinct scenarios designed for comparative analysis as detailed in Table 9. Scenarios 1–12 were established to examine how different system compositions affect quantitative results, structured around three critical variables: BPCS implementation type (PLC/RTU, PLC, or RTU), presence or absence of GDS, and presence or performance level of SIS. Specifically, Scenarios 1–3 evaluated three BPCS types with both GDS and SIS (Level II) present; Scenarios 4–6 removed GDS to assess BPCS performance under SIS Level II; Scenarios 7–9 eliminated SIS to isolate GDS impact with different BPCS types; Scenarios 10–12 excluded both GDS and SIS to examine standalone BPCS effects; while Scenarios 13–15 downgraded SIS from Level II to Level I with GDS removed to analyze reduced SIS performance consequences across BPCS types. The analysis incorporated data from authoritative sources, including the Southwest Oil and Gas Field Station Common Engineering Standard Design Manual, Petrochemical Automatic Control Design Manual, and Gas Field Gathering and Transportation Design Code, supplemented by operational data obtained directly from the Sichuan oil and gas mine station records, ensuring both theoretical rigor and practical relevance in our findings.

5.3.2. Parameter Setting

Before quantitative calculations are performed, various parameters for various components are set, including impact factors, failure times, and MTTR. The station selected for this calculation is unchanged, so only the number of failures is different. There are three types of BPCS and four levels of SIS. The failure times corresponding to the composition and level of different automatic control systems are shown in Table 10 and Table 11, respectively.

5.4. Differentiated Result Analysis

5.4.1. BPCS Type Impact Analysis

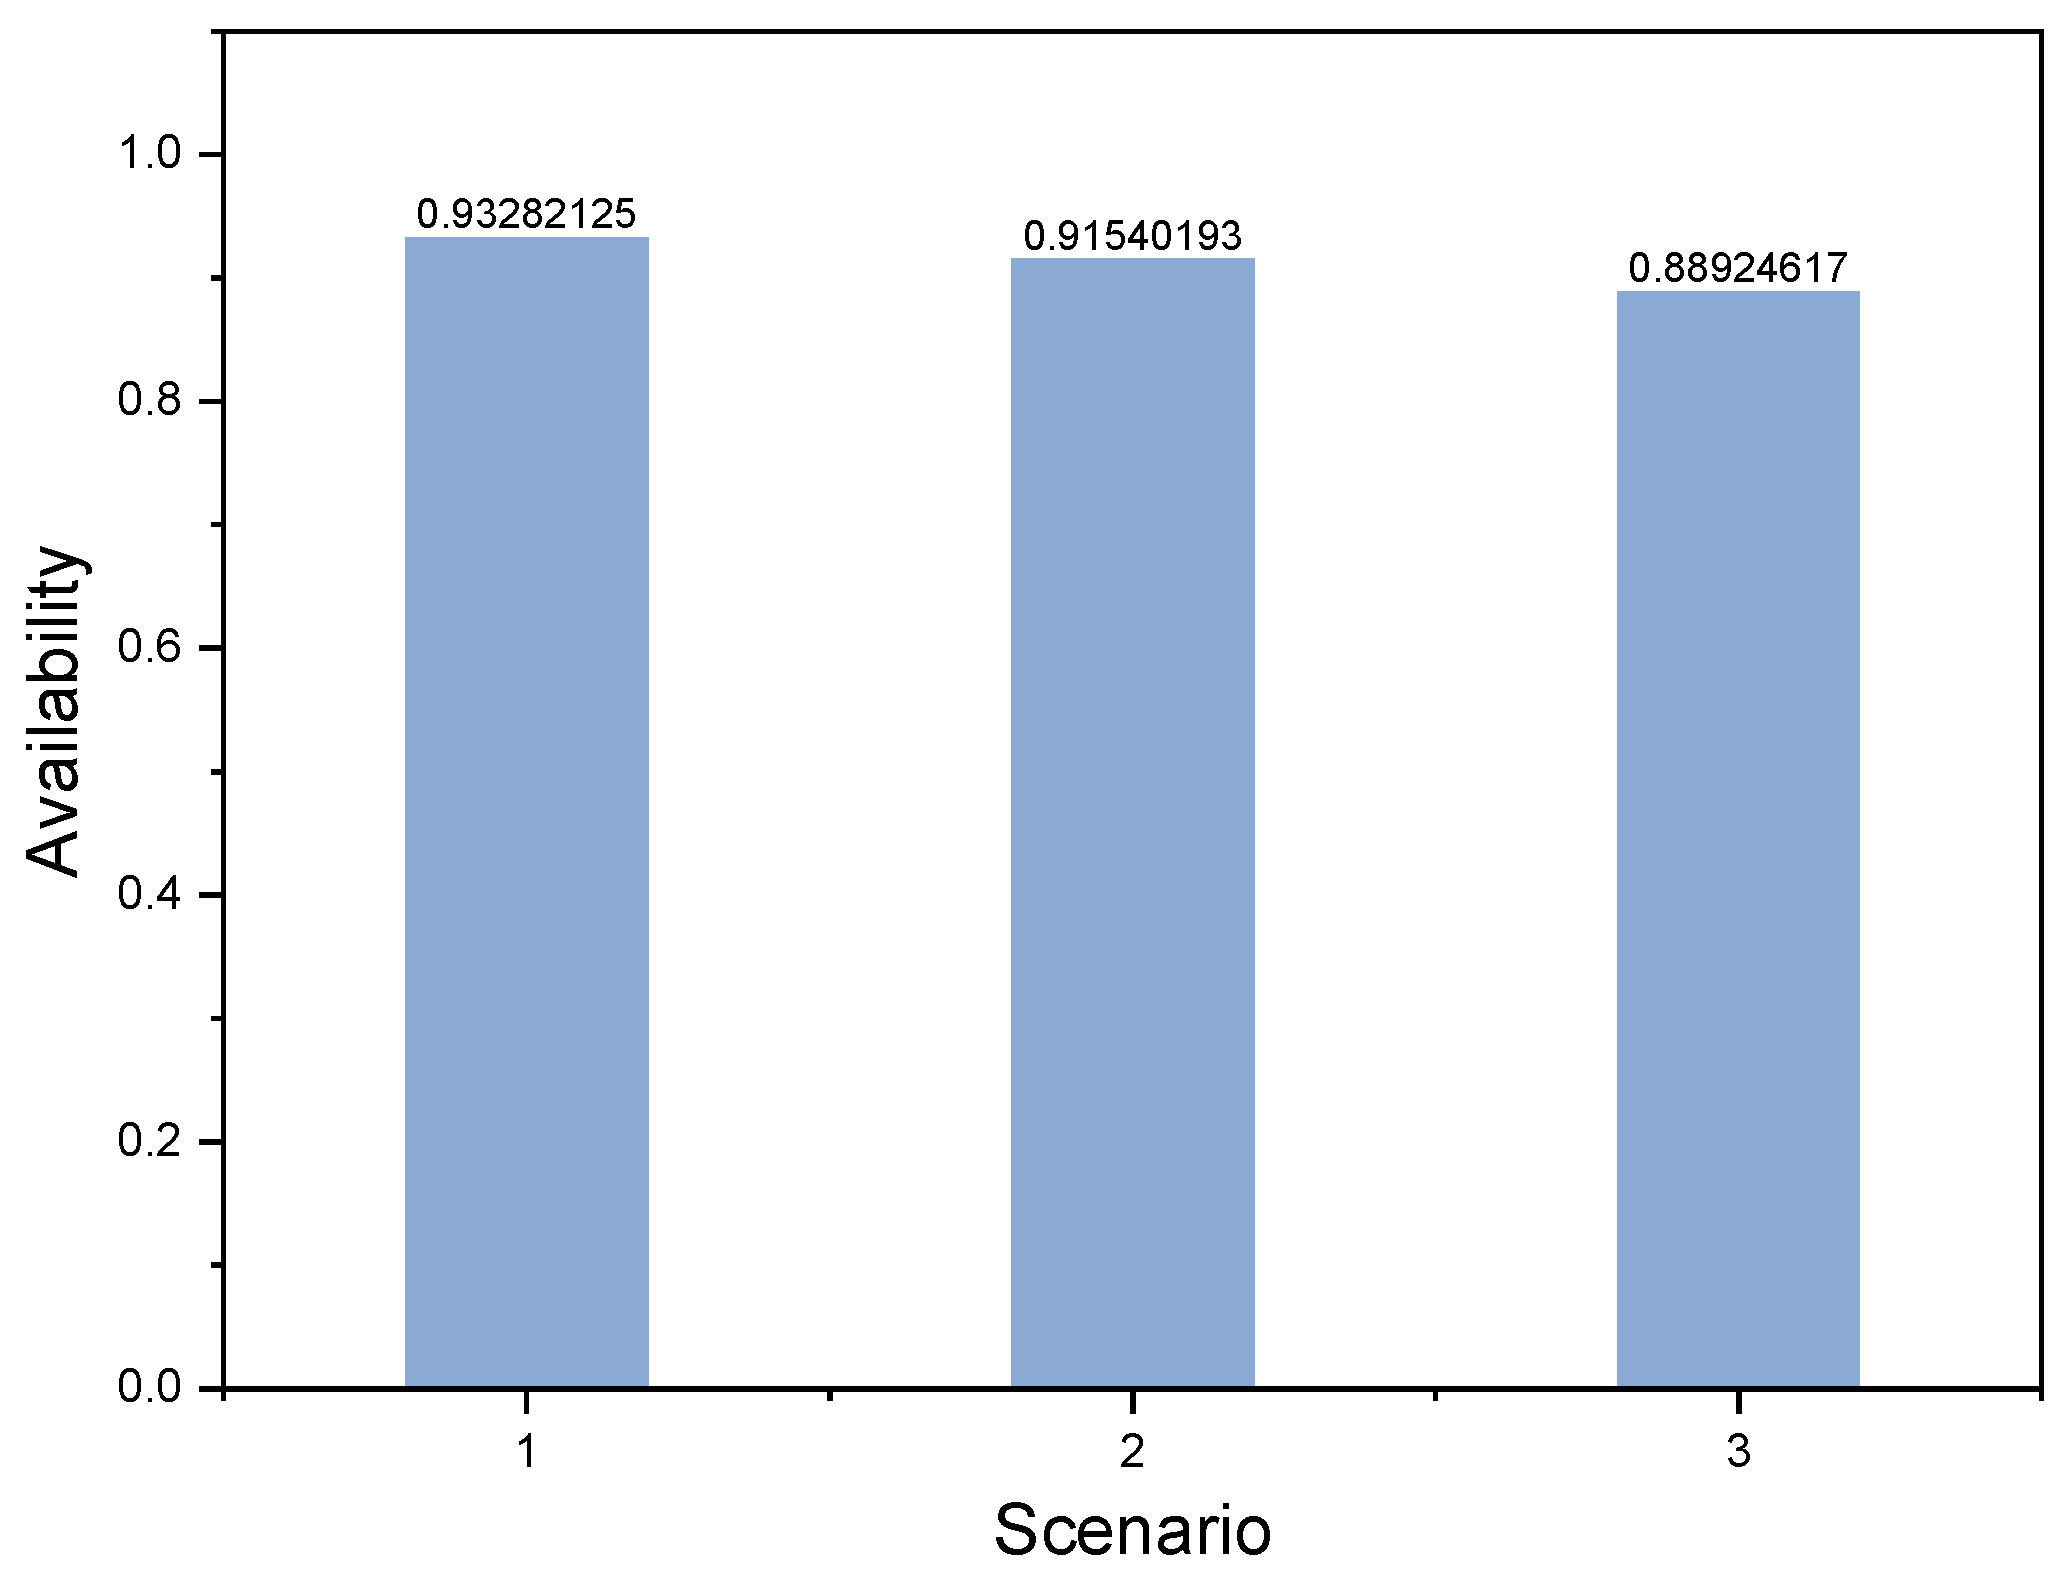
To analyze the influence of different types of BPCS on the quantitative calculation results when the composition and configuration of various automatic control systems of the stations are complete, Scenarios 1–3 are set. The availability calculation results vary with different BPCS types: system availability is highest when BPCS is PLC/RTU, moderate when BPCS is solely PLC, and lowest when BPCS is RTU, showing a successive downward trend. This phenomenon is primarily attributed to the fact that Class I BPCS has the lowest failure frequency, Class II has a higher failure frequency, and Class III has the highest failure frequency, as illustrated in Figure 7.

5.4.2. SIS and GDS Impact Analysis

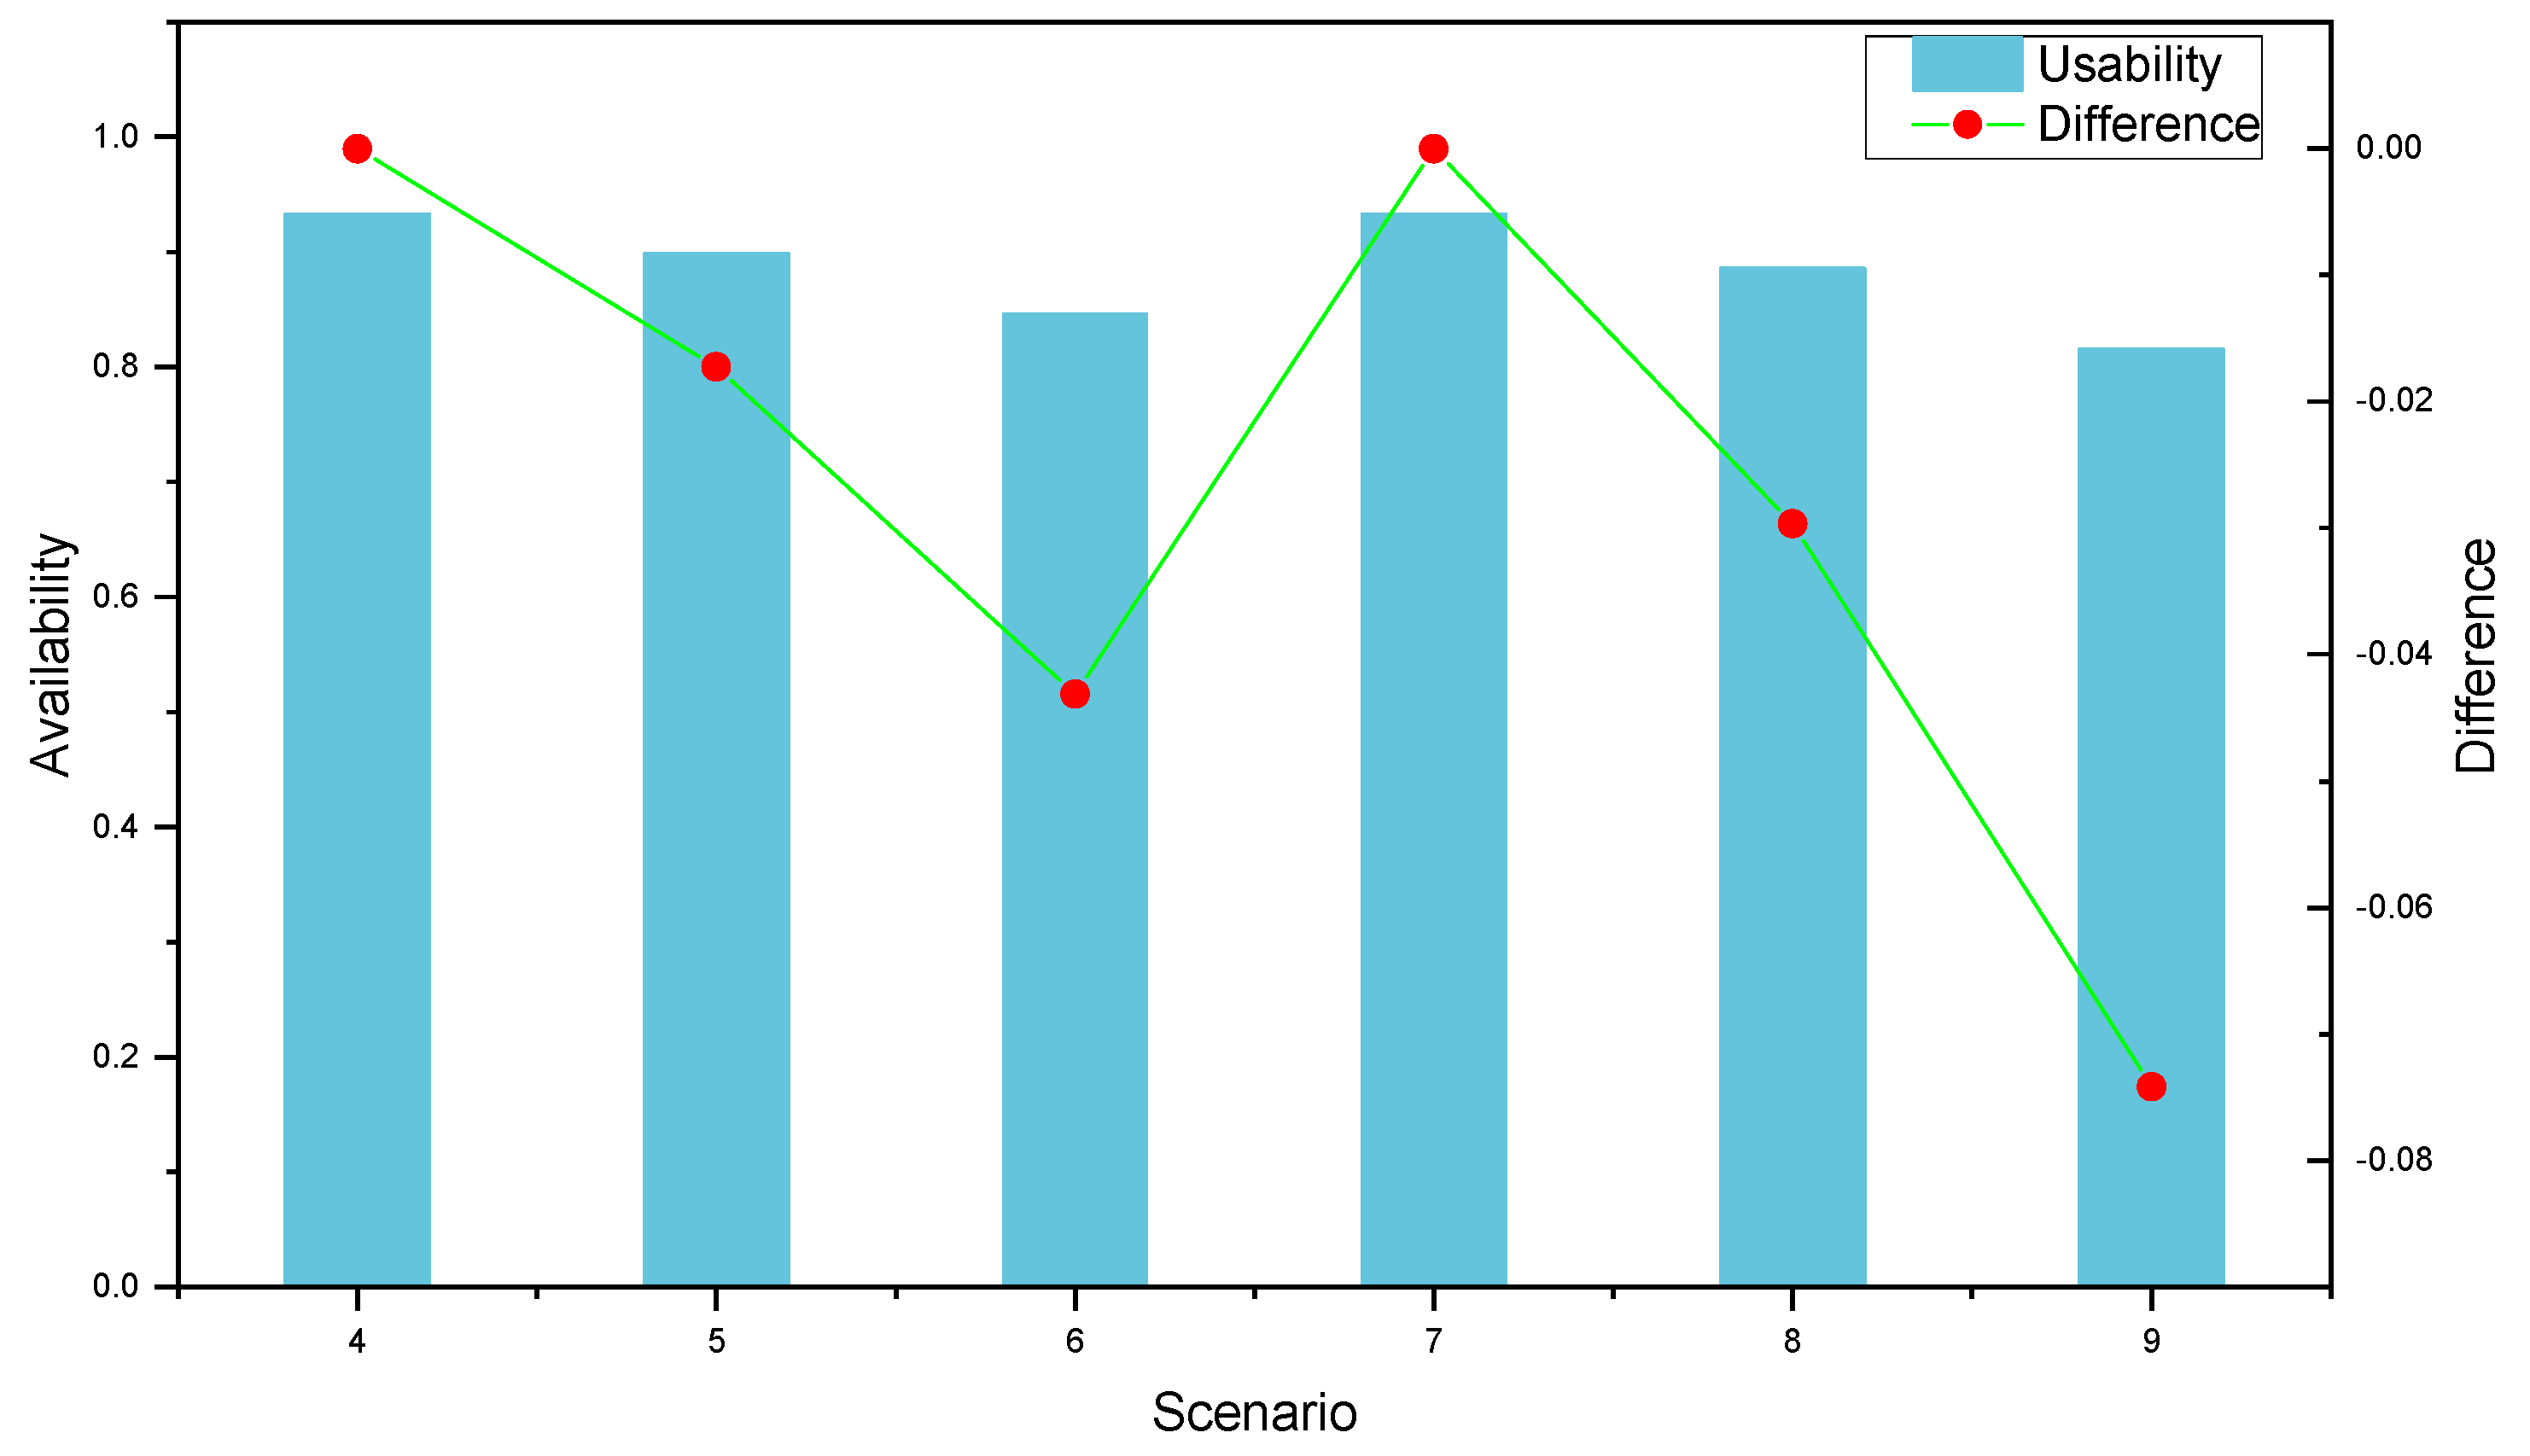
To evaluate the impact of GDS on system availability, Scenarios 4–6 were established by removing GDS from the automatic control system, while Scenarios 1–3 served as the baseline for comparison. The results demonstrate that for the same BPCS configuration, the absence of GDS reduces system availability, though the extent of this reduction varies across different systems. To further assess the influence of SIS, Scenarios 7–9 were configured. The analysis reveals that systems without SIS also exhibit reduced availability under identical BPCS conditions. Notably, the decline in availability is less pronounced in systems lacking GDS compared to those without SIS, underscoring that SIS has a more substantial impact on availability calculations than GDS, as illustrated in Figure 8.
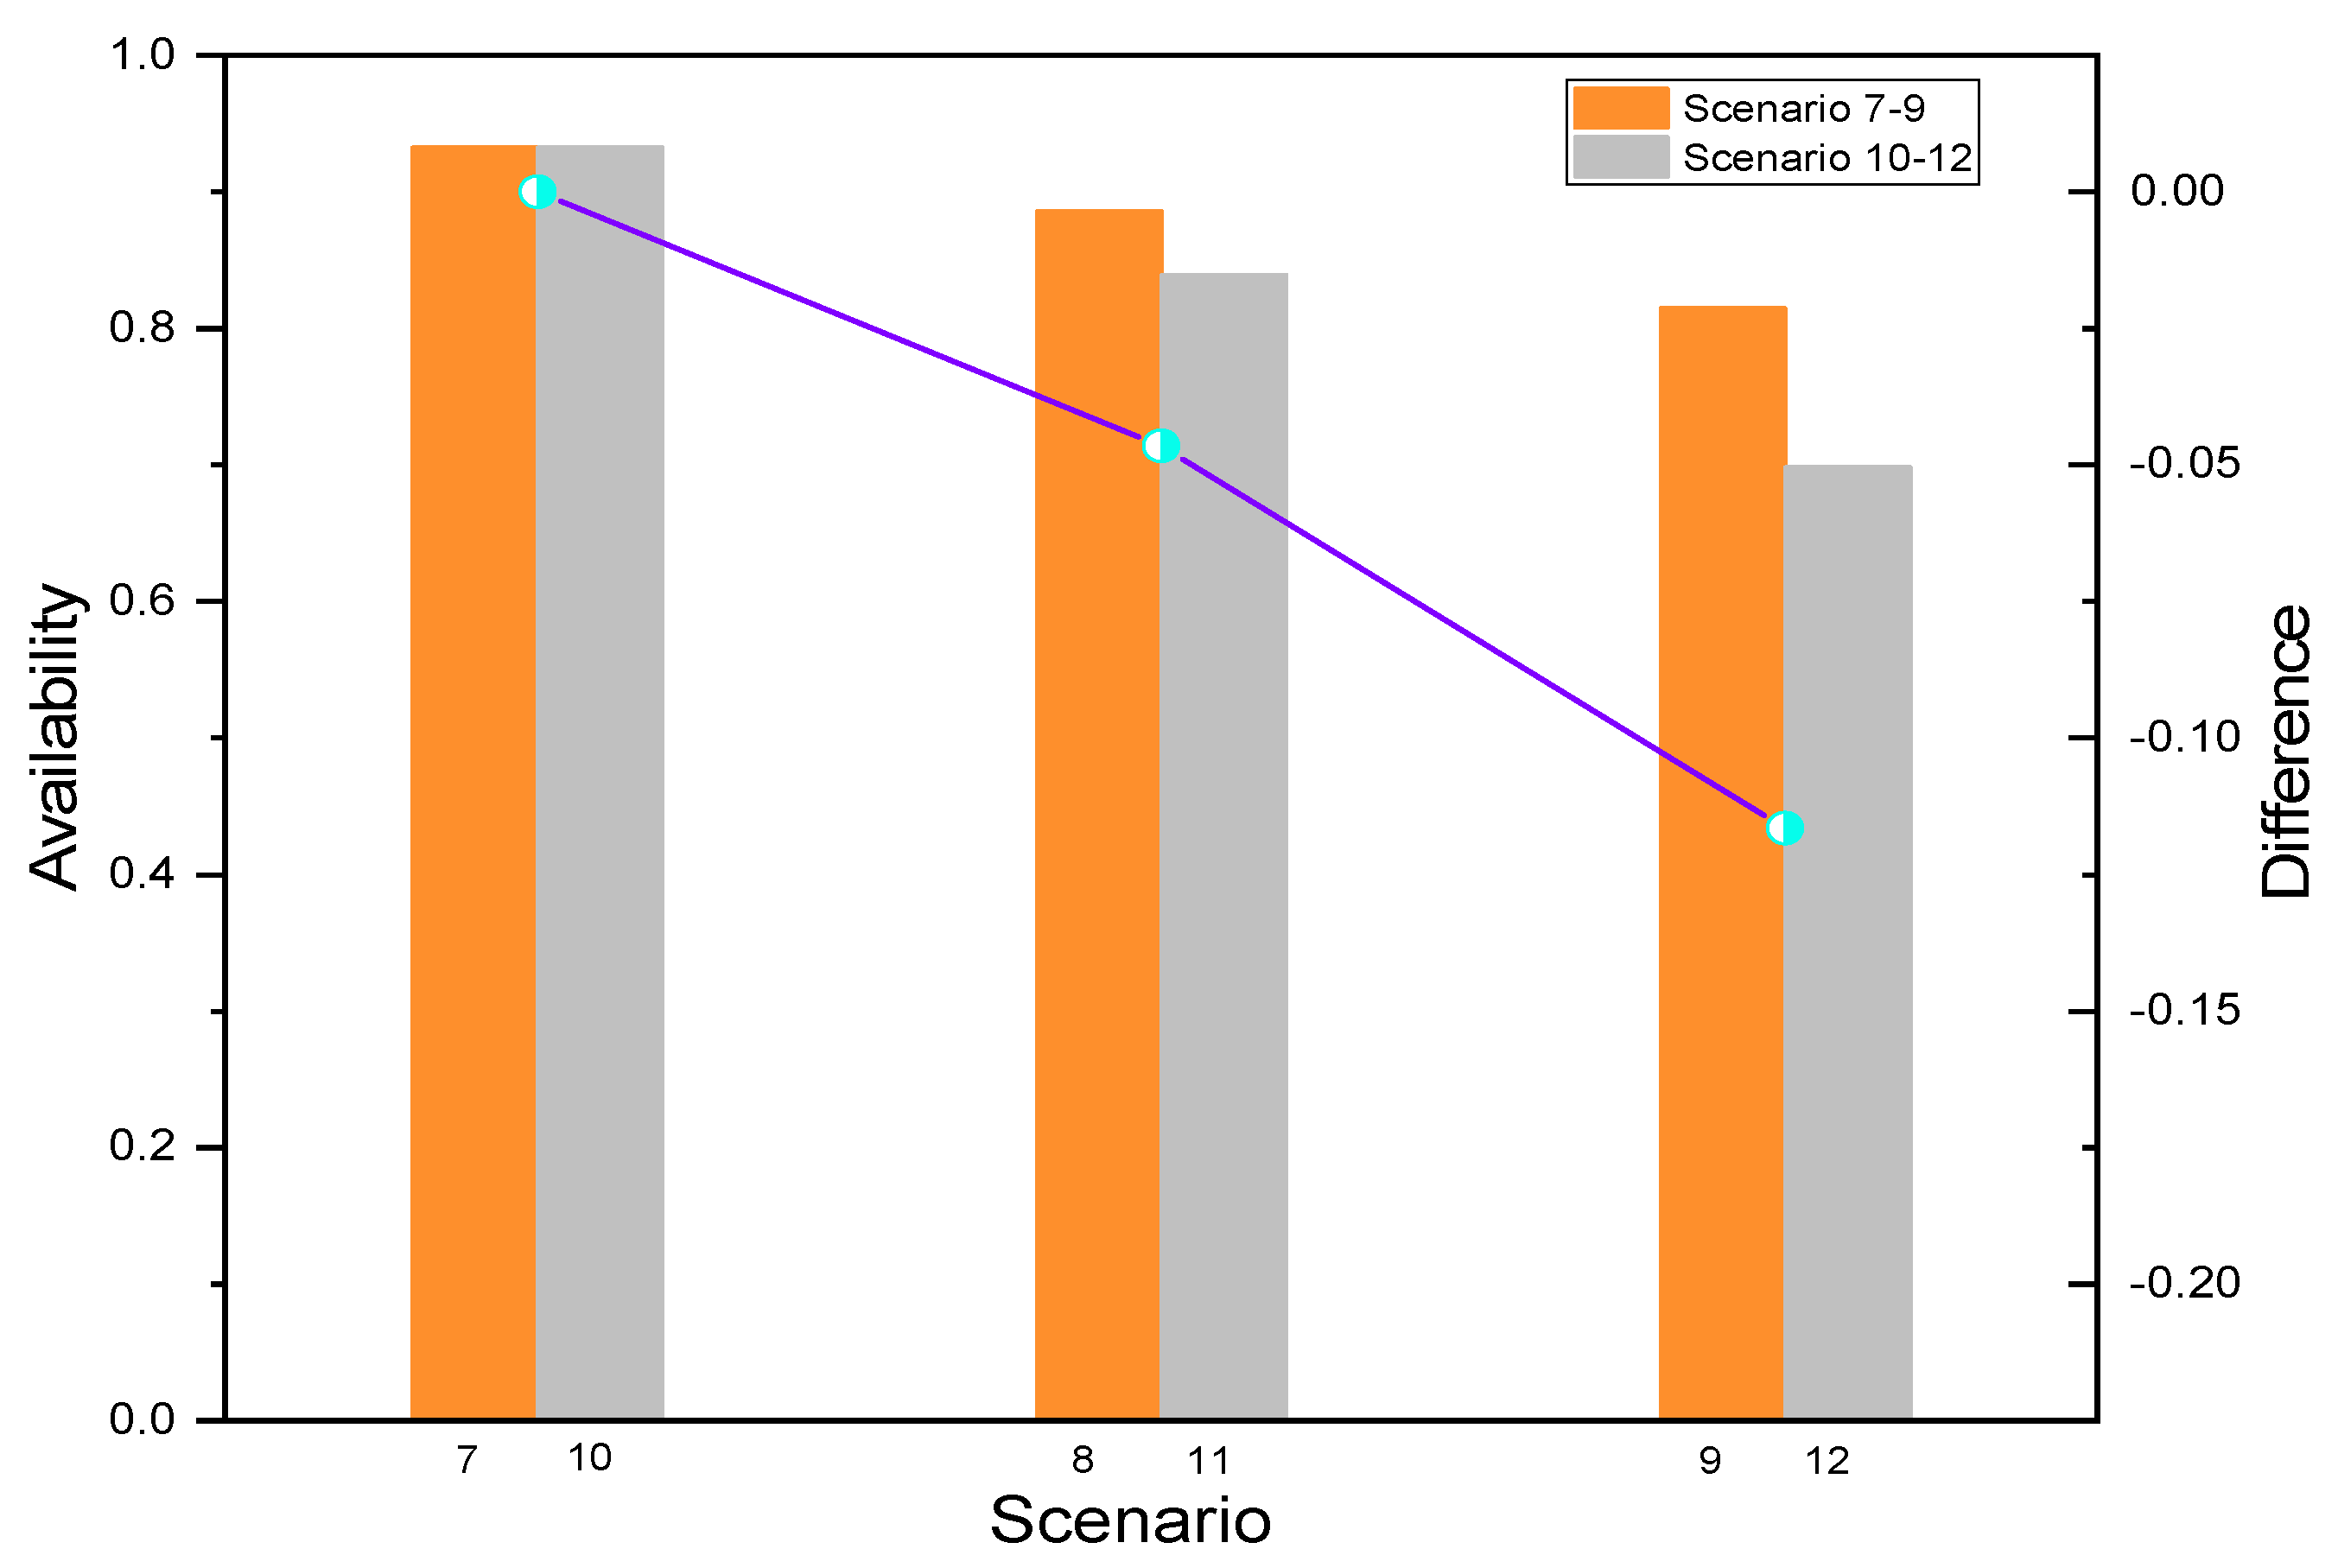
When the system comprises only BPCS, without SIS or GDS, its impact on quantitative calculation results is examined through Scenarios 10–12. The absence of both GDS and SIS leads to lower availability results compared to systems equipped with these safeguards. Furthermore, when neither GDS nor SIS is present, the availability calculation yields the lowest values, as illustrated in Figure 9.

5.4.3. The Influence of SIS at Different Levels

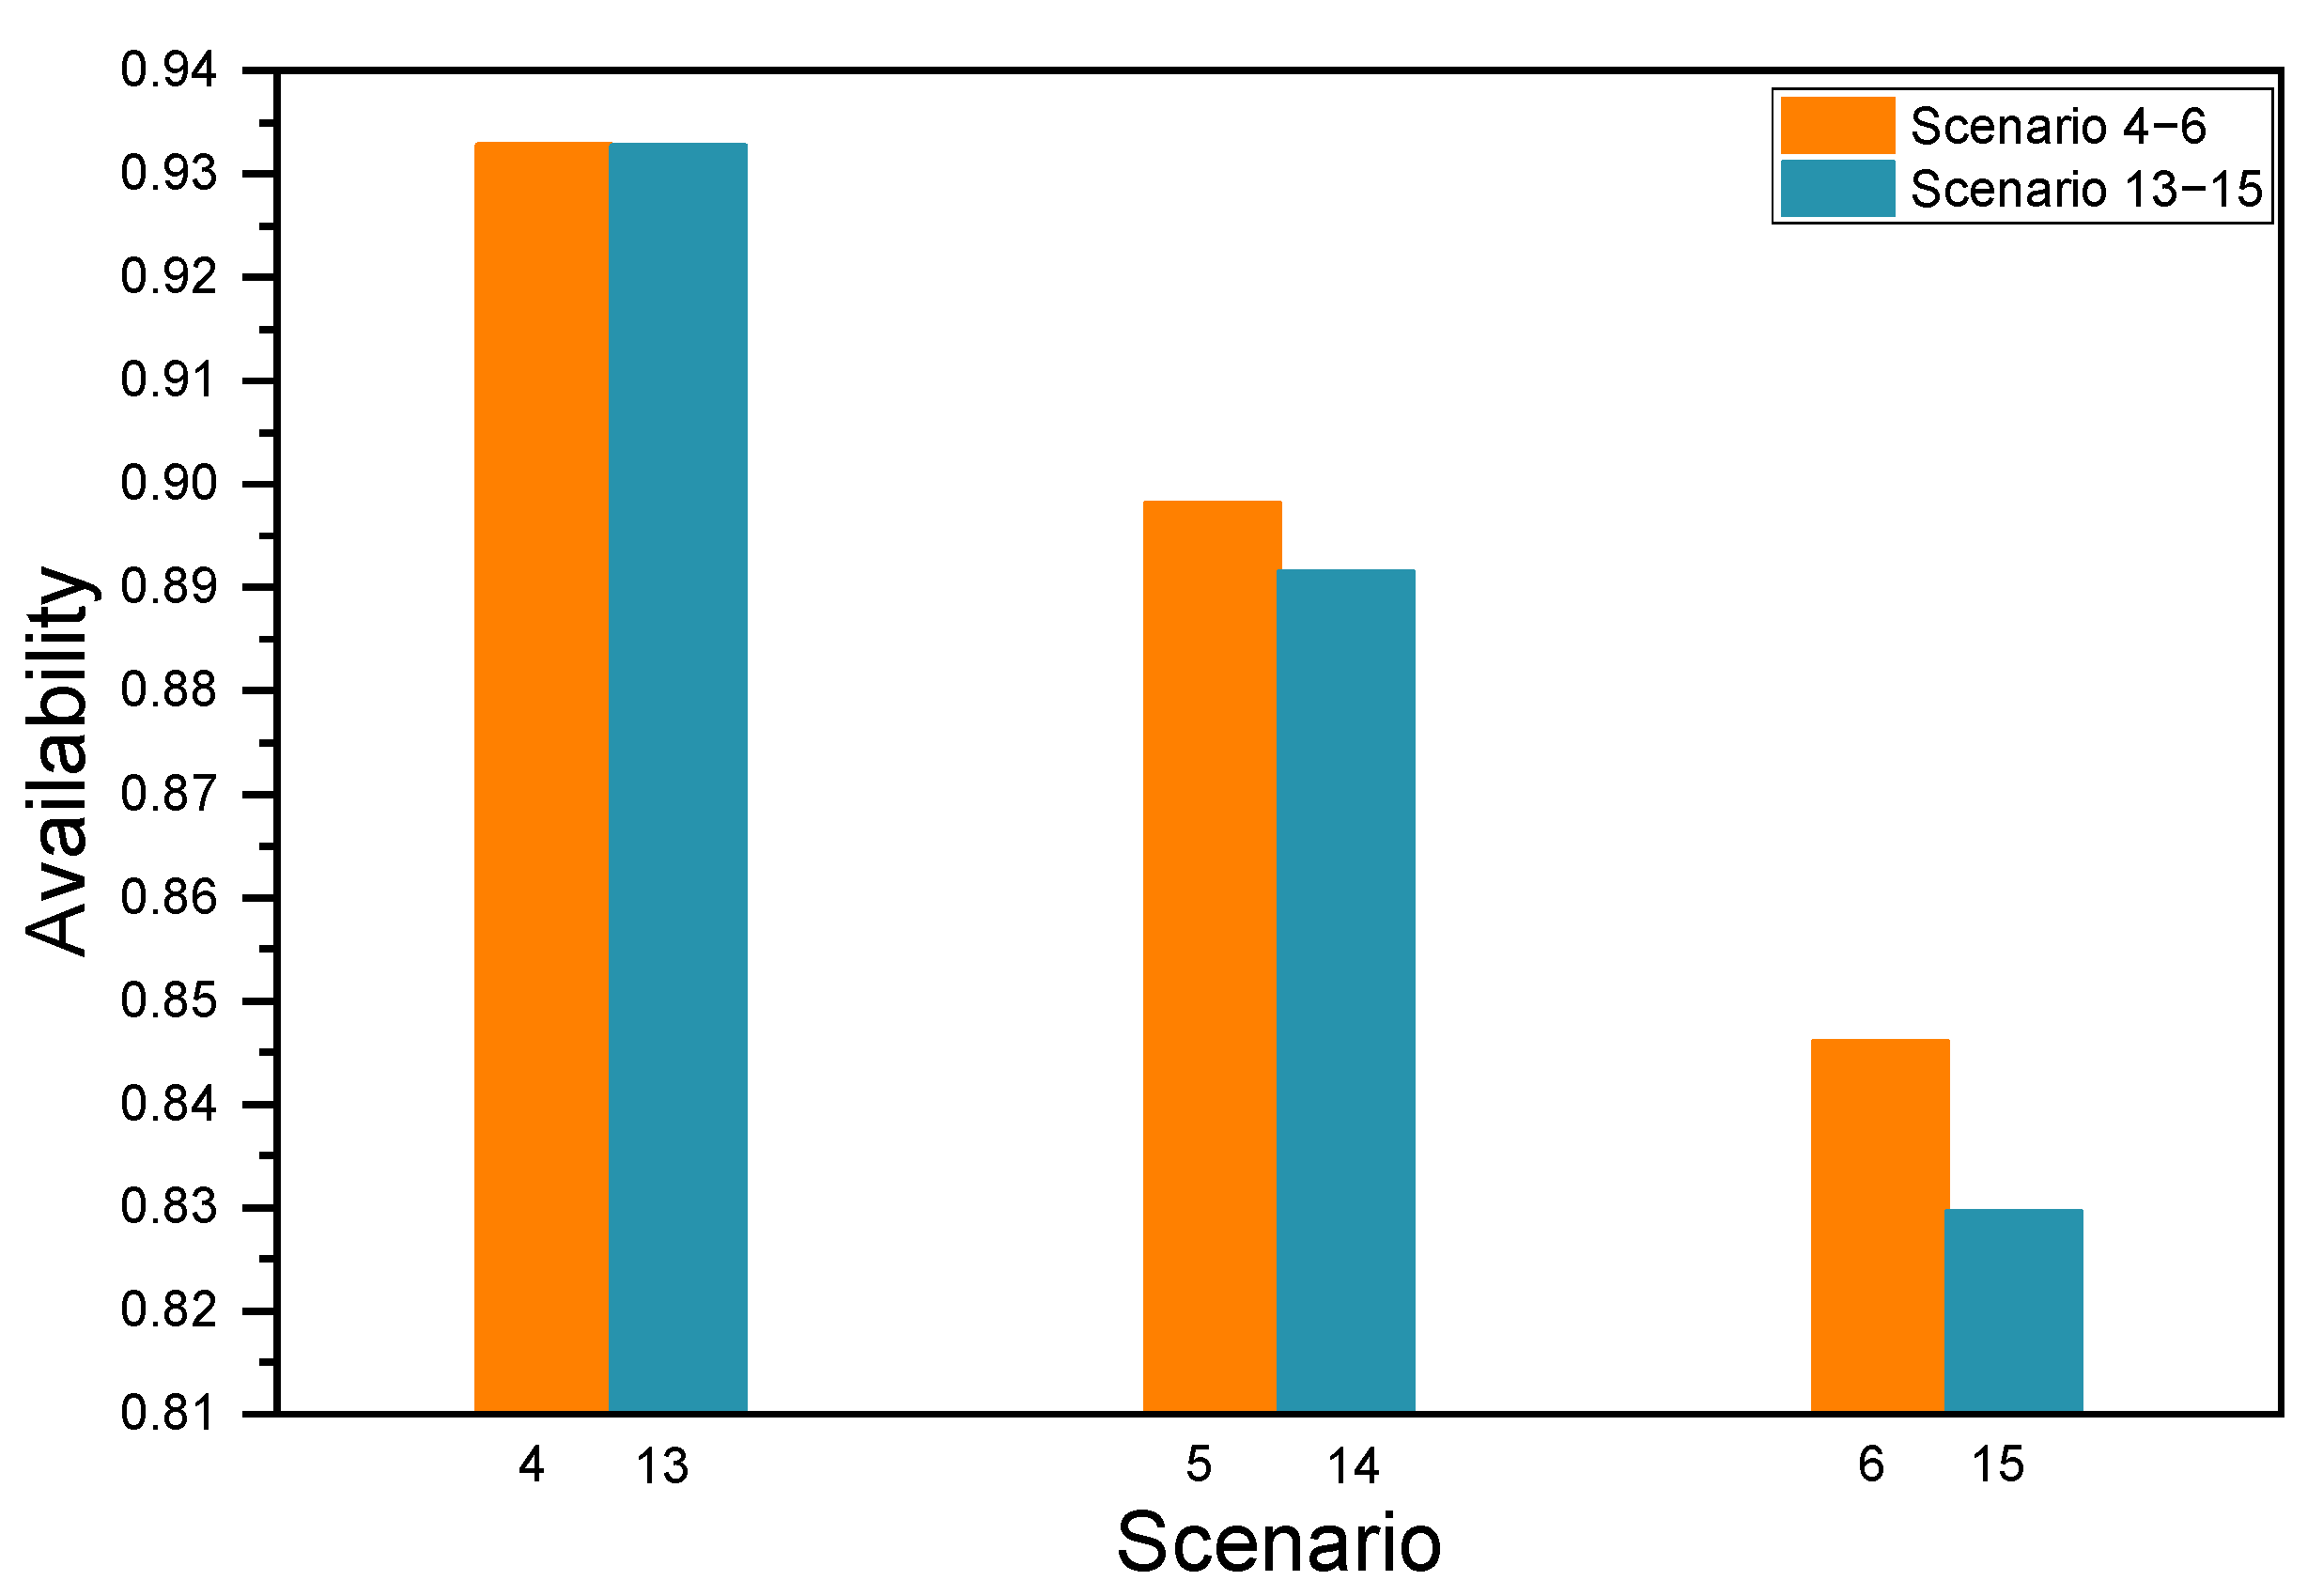
Based on the above analysis, SIS significantly influences system availability. To further examine the impact of SIS performance levels on quantitative results, Scenarios 13–15 are established and compared with Scenarios 4–6. As the SIS level degrades from Class II to Class I, the system availability decreases. This reduction occurs because the lower SIS performance leads to a higher failure rate, thereby reducing the overall system availability, as demonstrated in Figure 10.
Therefore, based on the differential analysis, different configurations of automation systems and varying SIS levels result in differing evaluation outcomes. During system upgrades, if evaluation results fail to meet standards, upgrading the BPCS type and enhancing the SIS level can improve system availability. Conversely, if results exceed requirements, optimizing the BPCS type and SIS level within reasonable ranges can help control construction costs and enhance economic efficiency. This study not only provides a robust response to previous research on automation systems but also refines the quantitative differences between configurations. Compared with previous standardized designs, the proposed method exhibits greater flexibility, enabling it to adapt to the specific needs of local gas field stations.

6. Conclusions

Considering the differential design requirements of automatic control systems for different gas field stations, this paper presents a comprehensive evaluation method combining a semi-quantitative framework and quantitative calculations. The conclusions of the research are as follows:
(1)
A multi-dimensional integrated evaluation methodology framework was constructed. Addressing the inflexibility of traditional standardized evaluations and the limitations of single-method approaches, semi-quantitative and quantitative methods were organically combined. At the semi-quantitative level, an index system covering management and technical categories was established. Using AHP, the index weights for different station types were scientifically quantified, achieving differentiated and targeted evaluation standards. At the quantitative level, based on reliability and availability theories, the automatic control system was decomposed into six basic units (e.g., sensors, controllers). Key parameters were calculated through series-parallel models, forming a quantifiable performance evaluation basis.
(2)
Evaluation in differentiated scenarios was achieved. Customized evaluation and design were implemented for seven gas station types (conventional gas, shale gas, tight gas, and gas transmission/distribution), accounting for their distinct process characteristics. At the semi-quantitative level, dedicated checklists were constructed based on unique process flows, with weights dynamically adjusted. At the quantitative level, through differentiated parameter settings, the influence of BPCS type, SIS grade, and GDS configuration on system availability was quantified, providing a basis for optimizing automatic control systems across different stations.
(3)
The practical value and application prospects of the method were verified. This comprehensive evaluation method overcomes the subjectivity limitations of qualitative evaluation and compensates for the neglect of management elements and process differences inherent in purely quantitative methods, achieving collaborative optimization of safety, reliability, and economic goals.

7. Future Perspectives

This study developed a comprehensive evaluation method for gas field station automatic control systems, applicable to tight gas, conventional gas, and shale gas. However, the AHP employed introduces inherent subjectivity. Furthermore, since the assessment relies on mean or standard values during the design phase, its real-time adaptability is limited. Additionally, environmental factors and human operational interference were not accounted for. The classification standards for BPCS require enhancement to improve the method’s universality. Future research will focus on optimizing this comprehensive evaluation approach to mitigate the influence of subjective weighting and subsequently extend its application to other sectors within oil and gas infrastructure.

Supplementary Materials

The following supporting information can be downloaded at: https://www.mdpi.com/article/10.3390/asi8040113/s1, Table S1 is a description of the judgment matrix of the weight importance degree; Table S2 is a comparison table of the average random consistency index, and Equations (S1)–(S8) are specific calculation equations of the AHP.

Author Contributions

Conceptualization, W.Z. and Z.D.; methodology, Z.D. and T.X.; software, Z.D., J.Z. (Jun Zhou) and J.Z. (Jinrui Zhong); validation, F.W., L.X. and T.X.; formal analysis, T.X.; investigation, Q.F.; resources, M.W.; data curation, Z.D.; writing—original draft preparation, W.Z.; writing—review and editing, X.C. and J.Z. (Jinrui Zhong); visualization, T.X.; supervision, J.Z. (Jun Zhou); project administration, W.Z.; funding acquisition, J.Z. (Jun Zhou). All authors have read and agreed to the published version of the manuscript.

Funding

This research received no external funding.

Data Availability Statement

All data are included in the manuscript/Supplementary Materials.

Conflicts of Interest

Author Zhixiang Dai was employed by PetroChina Southwest Oil and Gas Field Company. Authors Wei Zhang, Jinrui Zhong, Feng Wang, Li Xu, Taiwu Xia, Qinghua Feng, Minhao Wang and Xi Chen were employed by PetroChina Southwest Oil and Gas Field Company. The remaining authors declare that the research was conducted in the absence of any commercial or financial relationships that could be construed as a potential conflict of interest.

Abbreviations

AHPAnalytical hierarchy process
COCConnection cable
COMCommunication module
ENSEngineer station
HLAHigh-low alarm
HHLAHigh-high low-low alarm
MTTRMean time to repair
OPSOperator station
PRCProcess controller
SENSensor
UPSUninterruptible power system

References

  1. Nord, J.H.; Koohang, A.; Paliszkiewicz, J. The internet of things: Reviewandtheoretical framework. Expert Syst. Appl. 2019, 133, 97–108. [Google Scholar] [CrossRef]
  2. Yang, X.; Bello, O.; Yang, L.; Bale, D.; Failla, R. Intelligent oilfield-cloud based Big Data service in upstream oil and gas. In Proceedings of the International Petroleum Technology Conference (IPTC), Beijing, China, 26–28 March 2019. [Google Scholar] [CrossRef]
  3. Duan, W.; Chen, G. Innovation and application of an automatic control system for gas wells production in sulige gas field. J. Phys. Conf. Ser. 2018, 1074, 012123. Available online: https://iopscience.iop.org/article/10.1088/1742-6596/1074/1/012123 (accessed on 28 July 2025). [CrossRef]
  4. Liu, W.; Hui, L.; Lu, Y.; Tang, J. Developing an evaluation method for SCADA-Controlled urban gas infrastructure hierarchical design using multi-level fuzzy comprehensive evaluation. Int. J. Crit. Infrastruct. Prot. 2020, 30, 100375. [Google Scholar] [CrossRef]
  5. Bist, N.; Panchal, S.; Gupta, R.; Soni, A.; Sircar, A. Digital transformation and trends for tapping connectivity in the oil and gas sector. Hybrid Adv. 2024, 6, 100256. [Google Scholar] [CrossRef]
  6. Ahmed, F.; Kilic, K. Fuzzy Analytic Hierarchy Process: A performance analysis of various algorithms. Fuzzy Sets Syst. 2019, 362, 110–128. [Google Scholar] [CrossRef]
  7. Liu, C.; Zhou, C.; Wang, H.; Liu, S.; Cui, J.; Zhao, W.; Liu, S.; Tan, L.; Xiao, W.; Chen, Y. Reliability analysis of subsea pipeline system based on fuzzy polymorphic bayesian network. Sci. Rep. 2025, 15, 11523. [Google Scholar] [CrossRef]
  8. Chang, Y.; Wu, X.; Zhang, C.; Chen, G.; Liu, X.; Li, J.; Cai, B.; Xu, L. Dynamic Bayesian networks based approach for risk analysis of subsea wellhead fatigue failure during service life. Reliab. Eng. Syst. Saf. 2019, 188, 454–462. [Google Scholar] [CrossRef]
  9. Kuo, Y.; Yang, T.; Huang, G.W. The use of grey relational analysis in solving multiple attribute decision-making problems. Comput. Ind. Eng. 2008, 55, 80–93. [Google Scholar] [CrossRef]
  10. Lu, N.; Liu, S.; Du, J.; Fang, Z.; Dong, W.; Tao, L.; Yang, Y. Grey relational analysis model with cross-sequences and its application in evaluating air quality index. Expert Syst. Appl. 2023, 233, 120910. [Google Scholar] [CrossRef]
  11. Liu, Y.; Du, J.; Wang, Y. An improved grey group decision-making approach. Appl. Soft Comput. 2019, 76, 78–88. [Google Scholar] [CrossRef]
  12. Darko, A.; Chan, A.P.C.; Ameyaw, E.E.; Owusu, E.K.; Pärn, E.; Edwards, D.J. Review of application of analytic hierarchy process (AHP) in construction. Int. J. Constr. Manag. 2019, 19, 436–452. [Google Scholar] [CrossRef]
  13. Podvezko, V. Application of AHP technique. J. Bus. Econ. Manag. 2009, 10, 181–189. [Google Scholar] [CrossRef]
  14. Al-Sabaeei, A.M.; Alhussian, H.; Abdulkadir, S.J.; Jagadeesh, A. Prediction of oil and gas pipeline failures through machine learning approaches: A systematic review. Energy Rep. 2023, 10, 1313–1338. [Google Scholar] [CrossRef]
  15. Halbouni, A.; Gunawan, T.S.; Habaebi, M.H.; Halbouni, M.; Kartiwi, M.; Ahmad, R. Machine learning and deep learning approaches for cybersecurity: A review. IEEE Access 2022, 10, 19572–19585. [Google Scholar] [CrossRef]
  16. Luo, J.; Li, H.; Huang, G.; Wang, S. A multi-dimensional performance assessment framework for microgrids concerning renewable penetration, reliability, and economics. J. Build. Eng. 2023, 63, 105508. [Google Scholar] [CrossRef]
  17. He, Y.; Zhao, G.; Tang, Y.; Song, J.; Chen, Y. Available target evaluation of underground gas storage based on AHP-FCE methods. Geoenergy Sci. Eng. 2024, 242, 213255. [Google Scholar] [CrossRef]
  18. Dai, H.; Wang, J.; Li, G.; Chen, W.; Qiu, B.; Yan, J. A multi-criteria comprehensive evaluation method for distributed energy system. Energy Procedia 2019, 158, 3748–3753. [Google Scholar] [CrossRef]
  19. Wu, J.; Zhang, S.; Li, J.; Liu, J.; Sun, H.; Jia, Z.; Xia, Y.; Liu, J.; Pan, D.; Sun, J.; et al. Comprehensive Evaluation of Sustainable Treatment Technology of Oily Sludge Based on AHP-FCE. Clean Energy Sustain. 2023, 1, 10007. [Google Scholar] [CrossRef]
  20. Zhang, X.; Shen, Q.; Zhao, D.; Zhang, Z.; He, R.; Song, H. Risk assessment on chemical plants by the method of safety checklist analysis. Process Saf. Prog. 2017, 36, 95–101. [Google Scholar] [CrossRef]
  21. Hu, H.; Zhu, B.; Guo, J. Natural gas pipeline leakage analysis based on Advance risk analysis and Analytic hierarchy process. IOP Conf. Ser. Earth Environ. Sci. 2020, 565, 012019. Available online: https://iopscience.iop.org/article/10.1088/1755-1315/565/1/012019 (accessed on 28 July 2025). [CrossRef]
  22. Ferdous, R.; Khan, F.; Sadiq, R.; Amyotte, P.; Veitch, B. Handling data uncertainties in event tree analysis. Process Saf. Environ. Prot. 2009, 87, 283–292. [Google Scholar] [CrossRef]
  23. Purba, J.H.; Tjahyani, D.T.S.; Widodo, S.; Ekariansyah, A.S. Fuzzy probability based event tree analysis for calculating core damage frequency in nuclear power plant probabilistic safety assessment. Prog. Nucl. Energy 2020, 125, 103376. [Google Scholar] [CrossRef]
  24. Han, T.; Gao, Z.; Du, W.; Hu, S. Multi-dimensional evaluation method for new power system. Energy Rep. 2022, 8, 618–635. [Google Scholar] [CrossRef]
  25. Zeng, P.; Li, J.; Lin, D.; Zhao, L.; Cheng, S.; Liu, Z. Evaluation Indicator System of Natural Gas Pressure Power Generation System and Its Application. In Proceedings of the 37th Annual Conference on Power System and Automation in Chinese Universities, Hangzhou, China, 23–25 October 2022; Springer Nature: Singapore, 2022; pp. 208–218. [Google Scholar] [CrossRef]
  26. Kabenla, R.; Ampofo, S.; Owusu, G.; Atulley, J.A.; Ampadu, B. Application of Analytical Hierarchy Process (AHP) and Multi-Criteria Evaluation (MCE) for a case study and scenario assessment of flood risk in the White Volta Basin of the Upper East Region, Ghana. Discov. Water 2024, 4, 90. [Google Scholar] [CrossRef]
  27. Liu, Z.W.; Xie, Q.Y.; Dai, L.; Wang, H.; Deng, L.; Wang, C.; Zhang, Y.; Zhou, X.; Yang, C.; Xiang, C.; et al. Research on comprehensive evaluation method of distribution network based on AHP-entropy weighting method. Front. Energy Res. 2022, 10, 975462. [Google Scholar] [CrossRef]
  28. Borghesan, F.; Zagorowska, M.; Mercangöz, M. Unmanned and autonomous systems: Future of automation in process and energy industries. IFAC-PapersOnLine 2022, 55, 875–882. [Google Scholar] [CrossRef]
  29. Addabbo, T.; Fort, A.; Mugnaini, M.; Vignoli, V.; Simoni, E.; Mancini, M. Availability and reliability modeling of multicore controlled UPS for datacenter applications. Reliab. Eng. Syst. Saf. 2016, 149, 56–62. [Google Scholar] [CrossRef]
  30. Kanoun, K.; Kaâniche, M.; Laprie, J.P. Qualitative and quantitative reliability assessment. IEEE Softw. 1997, 14, 77–87. [Google Scholar] [CrossRef]
  31. Varnavskiy, K.; Nepsha, F.; Chen, Q.; Ermakov, A.; Zhironkin, S. Reliability assessment of the configuration of dynamic uninterruptible power sources: A case of data centers. Energies 2023, 16, 1419. [Google Scholar] [CrossRef]
  32. Rahmat, M.K.; Karim, A.Z.A.; Salleh, M.N.M. Sensitivity analysis of the AC uninterruptible power supply (UPS) reliability. In Proceedings of the 2017 International Conference on Engineering Technology and Technopreneurship (ICE2T), Kuala Lumpur, Malaysia, 18–20 September 2017; IEEE: New York, NY, USA, 2017; pp. 1–6. [Google Scholar] [CrossRef]
  33. Jiang, Z.; Zhao, T.; Wang, S.; Ren, F. A novel risk assessment and analysis method for correlation in a complex system based on multi-dimensional theory. Appl. Sci. 2020, 10, 3007. [Google Scholar] [CrossRef]
  34. Zhao, Q.Q.; Chung, I. Availability Analysis and Redundancy Allocation Optimization for Multi-level Systems with Alternative Units. In Reliability Analysis and Maintenance Optimization of Complex Systems: Essays in Honor of Professor Won Young Yun on His 65th Birthday; Springer Nature: Cham, Switzerland, 2025; pp. 259–286. [Google Scholar] [CrossRef]
  35. Aji, J.O.; Uchendu, I. Improving Facility Operations: A Quantitative Evaluation of MTBF, MTTR, and SLA Targets. European J. Innov. Stud. Sustain. 2025, 1, 247–261. [Google Scholar] [CrossRef]
  36. Zhang, T.; Horigome, M. Availability and reliability of system with dependent components and time-varying failure and repair rates. IEEE Trans. Reliab. 2001, 50, 151–158. [Google Scholar] [CrossRef]
  37. Gaver, D.P. Time to failure and availability of paralleled systems with repair. IEEE Trans. Reliab. 2009, 12, 30–38. [Google Scholar] [CrossRef]
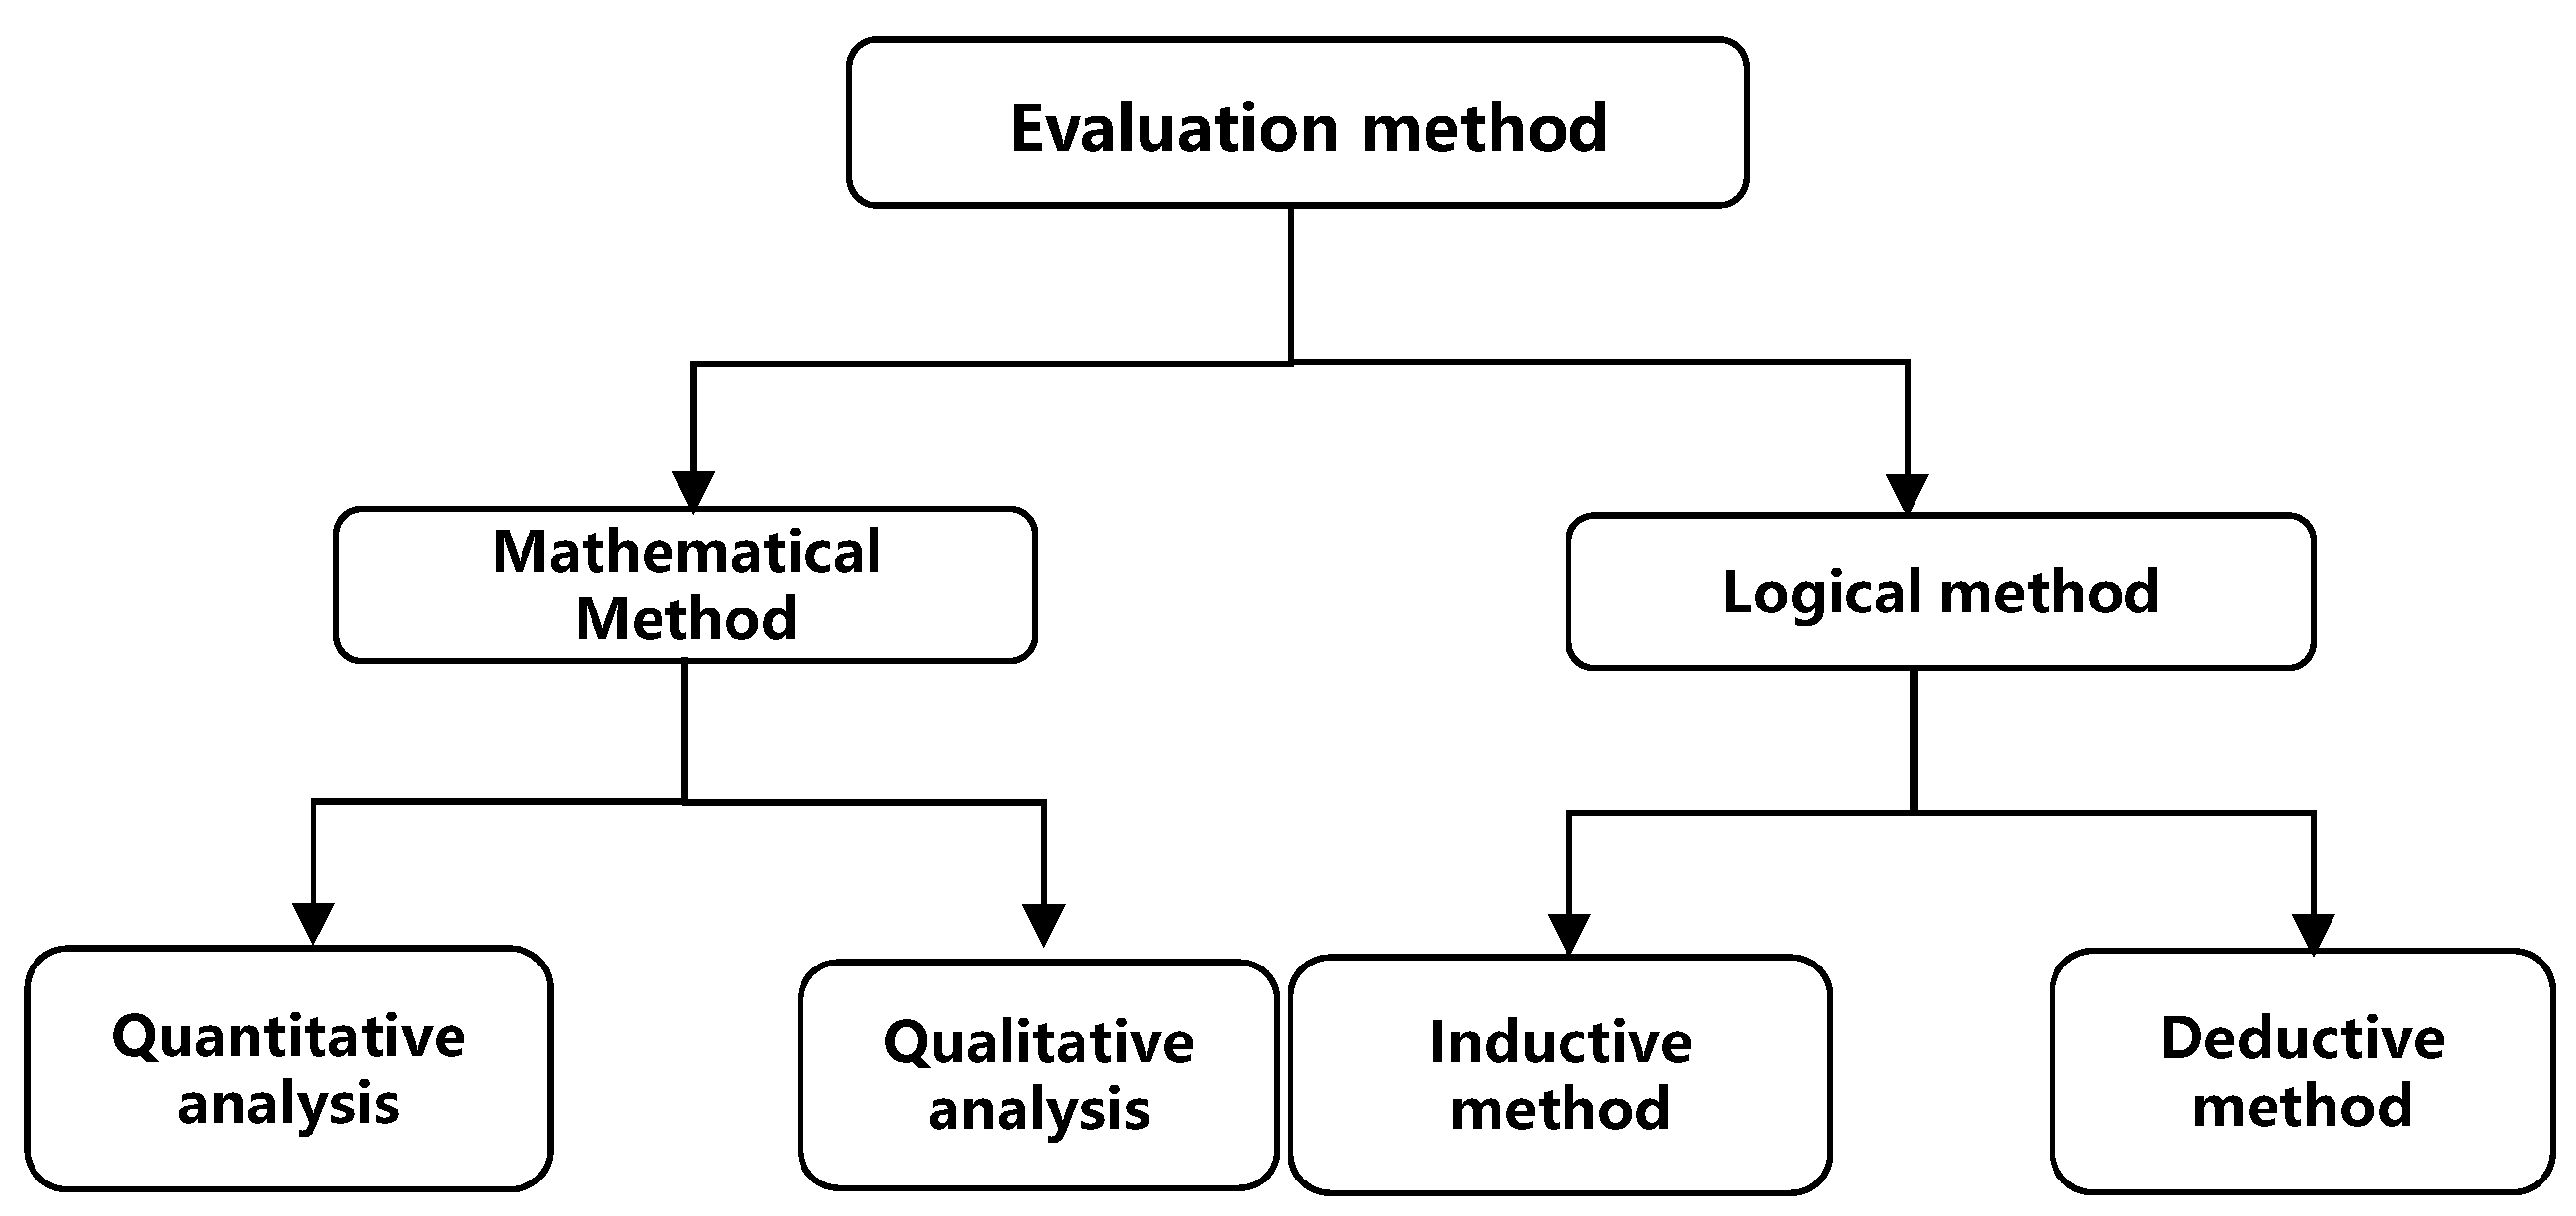
Figure 1. Classification of the evaluation method of an automatic control system.
Asi 08 00113 g001
Figure 2. “Onion” model diagram.
Asi 08 00113 g002
Figure 3. Basic unit of an automatic control system.
Asi 08 00113 g003
Figure 4. Differential weight setting of the automatic control system.
Asi 08 00113 g004
Figure 5. Parameter differentiation.
Asi 08 00113 g005
Figure 6. Failure level.
Asi 08 00113 g006
Figure 7. Influence analysis of different types of BPCS.
Asi 08 00113 g007
Figure 8. Effects of BPCS, SIS, and GDS of the same type.
Asi 08 00113 g008
Figure 9. Impact analysis without GDS and SIS.
Asi 08 00113 g009
Figure 10. Impact analysis of SIS level.
Asi 08 00113 g010
Table 1. Comparison of evaluation methods for automatic control systems of gas field stations.
MethodThis PaperFAHPBayesian NetworksFailure Mode and Effect AnalysisEvent Tree AnalysisNeural Networks
Method typeHybridHybridQuantitativeQualitativeQualitative/QuantitativeQuantitative
Data requirementsReal data + expert experienceReal data + expert experienceA large amount of real dataHistorical fault records + expert experienceLogical derivation/probability of event occurrenceA large amount of real data
Applicability to different station typesAdapts to differentiated demandsAdjustable hierarchy, lacks differentiationPoor for small samplesComponent-level, not system-wideSpecific accidents, not system-wideRequires similar site data
Estimated reliability levelSpecific system reliability valuesRatings, no reliability valuesThe failure probability can be outputIdentifies failure modes, no system reliabilityNo quantitative reliabilityPredicts with sufficient data
Estimated availability levelSpecific availability valuesRatings, no availability valuesThe probability of unavailability can be outputIdentifies failure modes, no system availabilityNo quantitative availabilityPredicts with sufficient data
Interpretability of resultsClear hierarchy, transparent formulasClear hierarchyComplex probability updatesIntuitive stepsLinear event chainHard to interpret
FlexibilityCore framework general, needs customizationRedesign fuzzy matrix across industriesRestructure probability modelsAdjust fault mode libraryAdjust fault mode libraryNeeds target industry data
Table 2. Comparison of safety evaluation methods for automatic control systems.
Evaluation MethodsDegreeStrengthsCons
Safety ChecklistQualitativeSimpleIt is difficult and workload to compile the checklist
Pre-hazard analysisQualitativeSimpleThe accuracy is affected by the subjective factors of the analysis and evaluation personnel.
Failure mode and impact analysisQualitativeExhaustiveMore complex, the degree of accuracy is affected by the subjective reasons of the analysis and evaluation personnel.
Event TreeQualitative/QuantitativeSimpleQuantitative is affected by the data, and the accuracy is affected by the subjective factors of the analysis and evaluation personnel.
Incident TreeQualitative/QuantitativeSimpleComplex, heavy workload, accurate, accident tree compilation is wrong, distortion, and quantitative affected by data
Fire and explosion evaluation of Dow Chemical CompanyQuantitativeConciseCan only make a macro evaluation of the system as a whole
Monday fire and explosion toxicity index analysisQuantitative AnalysisConciseIt can only make a macro evaluation of the system as a whole
Operational risk assessmentQualitativeSimpleThe degree of accuracy is affected by the subjective factors of the analyst.
Risk and maneuverability researchQualitativeSimpleThe degree of accuracy is affected by the subjective factors of the analysis and evaluation personnel.
BowTie methodQualitativeIntuitive, the process is easy to understandThe degree of accuracy is affected by the subjective factors of the analysis and evaluation personnel.
Block Diagram MethodQuantificationIntuitive and simpleWorks with simple systems and relies on accurate data
Causal analysisQualitativeImage-specificThe drawing process is tedious and time-consuming, and the quality of the graphics is limited by the level of experience of the analyst.
Protective layer analysisSemi-quantitativeSuitable for dangerous events where the accident scenario is more complexThe quantitative is affected by the data, and the accuracy is affected by the subjective factors of the analysis and evaluation personnel
Table 3. Check the grade evaluation.
Checklist RatingRisk RatingExplanation
≥90%I, III means no need for improvement or upgrades
II means it does not require improvement or upgrade for the time being
80–90%II, IIIII means it does not need improvement or upgrading for the time being
III means a small area of improvement or upgrade is required
60–80%III, IVIII means small local improvements or upgrades are required
IV means extensive improvements or upgrades are required
<60%IV, VIV means extensive improvements or upgrades are required
V means a complete system replacement is required
Table 4. Summary of the process flow of various stations.
StationsCraft Flow
Regular gas well station1. Station module. 2. Corrosion inhibitor module. 3. Integrated process skid device. 4. Pig transceiver device skid. 5. Blow-off module. 6. Outbound module.
Regular gas gathering station1. Inbound module. 2. Corrosion inhibitor module. 3. Gas field water transfer module. 4. Separation metering module. 5. Outbound module 6. Emptying module.
Gas transmission station1. Outbound module. 2. Voltage regulation and measurement module. 3. Pigging module. 4. Filter separation module. 5. Emptying module. 6. Blowdown module.
Shale gas well station1. Wellhead module. 2. Sand removal skid. 3. Separate metering pry. 4. Pigging out valve group skid. 5. Rotation metering valve group prying. 6. Emptying module.
Shale gas gathering station1. Wellhead module. 2. High-pressure sand removal skid. 3. Vertical separation metering skid. 4. Horizontal separation metering pry. 5. Pigging outlet valve group pry. 6. Platform series inlet valve group pry.
Tight gas well station1. Wellhead module. 2. Heating module. 3. Metering module. 4. Sand removal module. 5. Emptying module. 6. Pigging outbound module.
Tight gas gathering station1. Pigging inlet valve group module. 2. Inlet valve group module. 3. Pigging ball barrel pry. 4. Slug flow catcher pry. 5. Three-phase separation pry. 6. VOC compressor skid, 7. Blow-off module. 8. Outbound valve module. 9. Condensate tank area and loading facilities. 10. Fuel air skid. 11. Pig barrel pry.
Table 5. Setting of failure times of the station.
StationsSENCOCPRCOperating StationCOMUPS
BPCSGDSSISOPSENS
HLAMonitorRegulator ValveHHLAEmergency TruncationEmergency Emptying
Tight gas gathering station301510.300.60.30.303336
Tight gas well station1560.30.200.60003336
Shale gas gathering station30150.30.200.600.303336
Shale gas well Station21111.50.600.600.303336
Regular gas gathering station18900.31.200.30.30.33336
Regular gas well station1250.30.20.600003336
Gas transmission and distribution station30150.30.200.600.30.33336
Table 6. MTTR parameter settings.
UnitsSubunitsMTTR
SEN/8 h
COC/8 h
UPS/24 h
OPSENS, OPS8 h
PRCGPS, SIS, BPCS8 h
COM/24 h
Table 7. Different impact factor settings at different stations.
StationsBPCSGDSSIS
HLAMonitorRegulator ValveHHLAEmergency TruncationEmergency Emptying
Regular gas well station10.10.2
0.910.80.811
Regular gas gathering station10.10.7
0.210.80.611
Shale gas well station0.80.50.4
0.910.10.110.1
Shale gas gathering station0.80.50.4
0.910.10.110.1
Tight gas well station0.90.80.1
0.910.20.810.2
Tight gas gathering station0.80.50.6
0.910.10.810.2
Gas transmission and distribution stations0.910.5
0.910.20.211
Table 8. Same impact factor settings for different stations.
NameSENCOCPRCOperating StationCOMUPS
OPSENS
Impact factor10.710.20.51
0.80.7
Table 9. Scenario Settings.
Influencing FactorsScenarioPLC/RTUPLCRTUGDSSIS
Composition of an automatic control systemScenario 1 Level II
Scenario 2 Level II
Scenario 3 Level II
Scenario 4 Level II
Scenario 5 Level II
Scenario 6 Level II
Scenario 7
Scenario 8
Scenario 9
Scenario 10
Scenario 11
Scenario 12
SIS ratingScenario 13 Level I
Scenario 14 Level I
Scenario 15 Level I
“√” indicates that the self-control system has this configuration in different scenarios. Spaces indicate that the automatic control system does not have this configuration in different scenarios
Table 10. Different types of BPCS correspond to the failure times.
BPCS TypesBPCS (Class I)BPCS (Class II)BPCS (Class III)
FeatureHLAMonitorRegulator valveHLAMonitorRegulator valveHLAMonitorRegulator valve
10 years of failures1.50.62.110.31.20.30.20.6
Table 11. Different SIS grades correspond to the number of failures.
SIS GradesSIS (Level I)SIS (Level II)SIS (Level III)SIS (Level IV)
FeatureHHLAEmergency truncationEmergency emptyingHHLAEmergency truncationEmergency emptyingHHLAEmergency truncationEmergency emptyingHHLAEmergency truncationEmergency emptying
10 years of failures 0.60.40.40.30.30.30.30.20.20.20.10.1
Disclaimer/Publisher’s Note: The statements, opinions and data contained in all publications are solely those of the individual author(s) and contributor(s) and not of MDPI and/or the editor(s). MDPI and/or the editor(s) disclaim responsibility for any injury to people or property resulting from any ideas, methods, instructions or products referred to in the content.