Abstract
This study enhances the music-listening experience and promotes Thai artists. It provides users easy access to Thai songs that match their current moods and situations, making their music journey more enjoyable. The system analyzes users’ emotions through text input, such as typing their current feelings, and processes this information using machine learning to create a playlist that resonates with their feelings. This study focuses on building a tool that caters to the preferences of Thai music listeners and encourages the consumption of a wider variety of Thai songs beyond popular trends. This study develops a tool that successfully creates personalized playlists by analyzing the listener’s emotions. Phrase and keyword recognition detect the listener’s emotions, generating playlists tailored to their feelings, thus improving their music-listening satisfaction. The classifiers employed in this study achieved the following accuracies: random forest (0.94), XGBoost (0.89), decision tree (0.85), logistic regression (0.79), and support vector machine (SVM) (0.78).
1. Introduction
The widespread use of digital technology has significantly impacted the music industry, creating new music analysis and classification opportunities. However, traditional methods of classifying Thai music are often time-consuming and require specialized knowledge. While some research has explored music mood classification, there is a need for a tool that accurately analyzes Thai song lyrics and listener-provided emotional input to determine the overall mood, enhancing the user experience on music platforms like Spotify and benefiting the Thai music industry. This need arises because existing systems often provide general mood-based recommendations without considering individual user preferences or emotional states. Several studies utilize audio features for mood classification, neglecting the emotional information in lyrics. Additionally, emerging areas of machine learning, such as multi-scale perception, multi-level feature fusion, and swarm intelligence optimization, have not been extensively explored for music mood classification.
These gaps underscore the need for a system focusing on Thai music, providing personalized recommendations, utilizing audio and lyrical features, and employing effective machine-learning models. This study addresses this gap by developing a system that allows users to input sentences or phrases reflecting their current mood, which the app then uses in conjunction with lyric analysis to generate a Spotify playlist tailored to that specific emotional state. This research explores applying natural language processing (NLP) and machine learning (ML) techniques to classify Thai songs based on the emotions expressed in their lyrics and the user’s direct mood description, offering potential benefits to listeners, musicians, and the Thai music industry.
A range of recent studies were investigated to understand the current state of mood-based music systems, encompassing approaches from facial expression analysis and multi-modal emotion recognition to lyric-based mood classification and EEG-driven music emotion research.
The sheer volume of available music often makes it difficult for individuals to select appropriate listening material. While various recommendation frameworks exist for domains like music, dining, and shopping, personalized recommendations based on user mood remain a valuable area of research [1]. This paper focuses on developing a music recommendation system that suggests songs tailored to individual preferences. Analyzing facial expressions offers a promising avenue for understanding a user’s emotional or mental state, which can inform music selection. Given that many users report feeling overwhelmed by the size of their music libraries, such a system can alleviate decision fatigue and potentially reduce stress levels. By automating the selection process and matching songs to a user’s current mood, the system eliminates the need for time-consuming manual searches. The proposed system captures user images via webcam, analyzes facial expressions to determine the user’s mood, and subsequently recommends a song from the user’s existing playlist that aligns with the identified emotional state.
In [2], the research investigated the detection of musical emotions by combining audio and lyric features, recognizing that audio data is signal-based while lyrics are text-based. The study utilized a synchronized dataset of chorus audio and lyrics. Audio feature extraction focused on dynamics, rhythm, timbre, pitch, and tonality, while lyric feature extraction considered psycholinguistic, stylistic, and statistical aspects. Both audio and lyric features underwent preprocessing, data normalization using min–max normalization, and categorization using a rule-based method. Emotion detection was performed by weighting the naive Bayes probability values of the audio and lyric features. An analysis revealed the dominance of audio features over lyric features, leading to a weighting ratio of 80% for audio and 20% for lyrics. This weighting strategy achieved an accuracy of 0.774, improving the system’s accuracy without feature weighting.
In [3], the paper presents a novel approach to music emotion recognition (MER) based on a convolutional long short-term memory deep neural network (CLDNN) architecture. A new Turkish emotional music database comprising 124 thirty-second excerpts of Turkish traditional music was constructed to facilitate the research. The researcher evaluated the performance of the proposed CLDNN approach on this newly created dataset. The feature set employed in the model combines features derived from convolutional neural network (CNN) layers processing log-mel filterbank energies and mel frequency cepstral coefficients (MFCCs), along with standard acoustic features. The results indicate optimal performance when this novel feature set is combined with standard features and input to a long short-term memory (LSTM) plus a deep neural network (DNN) classifier. Using 10-fold cross-validation, the proposed system achieved an overall accuracy of 99.19%, representing a 6.45-point improvement. Furthermore, the LSTM+DNN classifier demonstrated improvements in MER accuracy of 1.61, 1.61, and 3.23 percentage points compared to k-nearest neighbor (k-NN), support vector machine (SVM), and random forest classifiers, respectively.
In [4], the paper emphasizes the importance of mental health, which is often neglected despite its crucial role alongside physical health. Recognizing that emotional well-being can significantly impact overall health, including increasing the risk of conditions like depression and diabetes, the study proposes a system for emotion detection and mood enhancement through music recommendation. Leveraging deep-learning and image-processing techniques, the system employs a CNN based on the LeNet architecture for emotion detection. The KDEF dataset serves as the input for training the CNN model to recognize seven distinct emotions, namely sad, disgust, happy, afraid, neutral, angry, and surprised, based on facial expressions. The trained model achieved a training accuracy of 98.03% and a validation accuracy of 97.96% in correctly classifying these emotions.
The increasing volume of music necessitates improved organization, classification, and retrieval methods, particularly given the growing user demand for personalized experiences that consider both the creator’s emotional expression and individual psychological characteristics [5]. Current MER methods face challenges in accurately capturing the dynamic emotional shifts within a piece of music and effectively analyzing the nuanced emotional content conveyed beyond essential musical elements like pitch, length, and intensity. To address these limitations, this paper proposes an improved back propagation (BP) neural network for music data analysis. Recognizing the tendency of traditional BP networks to converge on local optima, the artificial bee colony (ABC) algorithm is integrated to enhance the network’s structure. Specifically, the ABC algorithm’s output provides the initial weights and thresholds for the BP neural network, enabling the ABC algorithm to adjust these parameters dynamically and subsequently feed the optimized values back into the BP network. This integration aims to improve the global search capability of the BP network, mitigate the risk of converging on local optima, and accelerate convergence speed. The experimental results obtained from testing on public music datasets demonstrate that the proposed ABC-optimized BP network achieves superior recognition performance and faster processing speeds than other benchmark models.
Existing music recommendation systems often rely on content-based, collaborative, hybrid, or context-based approaches, which are frequently limited by the size of their song databases [6]. The study analyzes these existing systems and proposes a novel content-based recommendation system to accommodate a significantly more extensive music library. The system incorporates user emotion as a key input, recommending songs based on the user’s current emotional state and prior listening history. Song features are retrieved using Spotify’s Web API. The emotion recognition model employed achieves an accuracy of approximately 67%. The resulting recommendation system successfully generates a 20-song playlist tailored to the user’s Spotify listening history and the detected current emotion.
Music is vital in human life, serving as a powerful medium for emotional expression and evocation. The diverse nature of music leads to varied listener experiences, with different musical pieces inducing a range of emotions and even the same piece eliciting distinct feelings based on the listener’s psychological state [7]. Consequently, MER has garnered significant attention in both the academic and industrial spheres. Leveraging advancements in brain science, MER has found applications in diverse fields, including recommendation systems, automated music composition, psychotherapy, and music visualization. The rise of artificial intelligence and intense learning has further propelled the development of MER, with deep-learning-based approaches becoming increasingly prevalent.
Furthermore, electroencephalography (EEG), a non-invasive technique for measuring brain activity, has emerged as a valuable tool for exploring emotions through brain–computer interfaces. The paper surveys EEG-based music emotion analysis, focusing on the analytical processes involved, such as data processing, emotion modeling, and feature extraction. The paper then identifies key challenges and outlines future development trends in EEG-based music emotion recognition. Finally, the paper provides a concluding summary.
Songs serve as a powerful medium for emotional expression for performers and listeners. Leveraging advancements in machine learning and sentiment analysis, the study investigates mood detection based on recently played music [8]. While the Four-Dimensional Mood Scale (FDMS) provides a direct measure of mood across valence and arousal dimensions, the research utilizes a modified Indonesian adaptation, the FDMS-55, for comparative analysis. The researcher developed a predictive model using song data sourced from the Spotify and Genius APIs, manually annotated with mood classifications, and processed using the Azure Cognitive Service Text Analytics API. The model evaluation revealed that the FastTreeOva algorithm achieved the highest accuracy, with scores of 0.8901 for valence and 0.9167 for arousal. Using cosine similarity, a comparison of model predictions with FDMS-55 results yielded a mean similarity of 0.770 with a standard deviation of 0.103. These findings suggest a correlation between an individual’s mood and their recent music choices, demonstrating the potential of the developed model to predict mood based on listening history accurately.
In [9], the paper presents a music recommendation system that leverages deep learning to select songs based on a user’s mood, as determined through facial expression analysis. Finding the right song can be challenging with the ever-growing music volume available. The system addresses this issue by providing personalized playlists based on detected emotions. The system employs image processing and neural networks, utilizing a novel architecture inspired by Meta’s research. Specifically, the multitask cascaded convolution neural network (MTCNN) and FaceNet architecture are used for face detection and recognition, generating embeddings fed into a CNN to predict the user’s emotion. This emotion prediction drives a classifier recommending music from a Spotify dataset containing nearly 600,000 songs. Users can specify the desired playlist length and add the recommended songs to their personalized playlist.
The proliferation of music production and consumption in the digital age has led to the generation of vast amounts of data, necessitating automated and efficient management strategies [10]. Automated music mood detection has emerged as a prominent task within the music information retrieval (MIR) field. The work investigates and compares single-channel and multi-modal deep-learning approaches for music mood detection. The first approach separately analyzes a musical track’s audio signal and lyrics, while the second employs a unified multi-modal analysis to classify the data into mood categories. The MoodyLyrics dataset will be used for training and evaluation, comprising 2000 song titles labeled with four mood classes (happy, angry, sad, and relaxed). The outcome of this research will be a robust system for predicting the overall mood of a music track, with potential applications in various domains.
The rapid expansion of online music resources has created challenges in music information retrieval and management, making efficient classification and retrieval a crucial research area [11]. The paper utilizes Thayer’s two-dimensional emotion plane as the foundation for constructing a music emotion database. Music is categorized into five emotional classes, and continuous emotion perception is employed, representing music emotion as a point on the two-dimensional plane defined by two sentiment variables. An artificial labeling method establishes the positional ranges of the five emotion categories on the emotional plane. Regression methods are then used to determine the relationship between valence–arousal (VA) values and music features, transforming the music emotion classification problem into a regression problem. A regression-based music emotion classification system is designed and implemented, comprising training and testing components. The training phase employs polynomial regression, support vector regression, and k-plane piecewise regression to derive the regression model. In the testing phase, the input music data are processed through regression to predict VA values for classification, with system performance evaluated by classification accuracy. The results indicate that combining support vector regression and k-plane piecewise regression improves accuracy by three to four percentage points compared to using either algorithm alone and by six percentage points compared to traditional support vector machine-based classification. A comparative analysis of various classification algorithms, including support vector machine, K-nearest neighbor, fuzzy neural network, fuzzy K-nearest neighbor, Bayesian classification, and Fisher linear discriminant, revealed that support vector machine, fuzzy K-nearest neighbor, and Fisher linear discriminant achieve accuracy rates exceeding 80%. Finally, a novel “mixed classifier” algorithm is proposed, earning a music emotion recognition rate of 84.9%.
In [12], the paper addresses the challenging task of music emotion recognition, a key area within music information retrieval. To improve the accuracy of music emotion classification, a novel approach employing an improved Inception-GRU residual network is proposed. This architecture leverages the Inception structure to extract multi-dimensional features through varying receptive fields, incorporating compression, expansion, and recompression operations for enhanced feature mining. Furthermore, timing signals within the residual network are connected to a gated recurrent unit (GRU) module to capture temporal dependencies. The proposed one-dimensional (1D) CNN with the improved Inception module and GRU was evaluated on the Soundtrack dataset. Fast Fourier transform (FFT) was applied to preprocess the samples and extract spectral characteristics. The experimental results demonstrate that the proposed 1D CNN with the Inception-GRU residual structure outperforms shallow learning methods, support vector machine, random forest, and a deep-learning method based on the visual geometry group (VGG) CNN. Specifically, the proposed method achieved a superior accuracy of 84% in music emotion recognition and classification.
Facial expressions are a primary means of human emotional expression. Given the established link between music and mood alteration, the project aims to develop a music player that selects songs based on detected facial expressions, thereby potentially calming the user and providing a more pleasing listening experience [13]. The system captures user images via a webcam interface and employs image segmentation and processing techniques to extract the facial features relevant to emotion recognition. The system selects and plays music appropriate to that mood by identifying the user’s expressed emotion. Facial expression recognition has long been recognized as a fundamental method of human communication, providing insights into emotions, feelings, and thoughts. Furthermore, targeted mood alteration through music can be beneficial in addressing issues such as depression and sadness. This expression analysis approach can mitigate health risks and contribute to improved user well-being.
In [14], the research explores the impact of music on mood and leverages emotion recognition to understand and influence user feelings. Recognizing the significant influence of emotions on thoughts and actions, this study focuses on identifying fundamental emotions through both audio and visual cues. The model distinguishes between happy, sad, angry, disgusted, surprised, frightened, and neutral emotions. Facial expression and current sentiment are analyzed from video input to predict video accuracy. A multilayer perceptron (MLP), a feedforward artificial neural network, processes input datasets to generate relevant outputs. The Haar cascade algorithm is employed for classification, distinguishing between positive and negative data points related to detected objects. Audio feature extraction identifies the user’s emotional state from their speech using mel-frequency cepstral coefficients (MFCCs) and a spectrogram model. Both video and audio accuracy are calculated, and the highest accuracy is used to determine the dominant emotion. This information drives a knowledge-based music recommendation system designed to shift negative emotions towards positive ones by selecting songs appropriate to the user’s identified mood.
Automated music recommendation systems driven by human emotion are gaining increasing popularity. Recognizing the rich information content of both audio and lyrics, the paper explores a multi-modal fusion model to enhance classification accuracy in music mood classification [15]. The primary objective is to investigate the impact of various attention mechanisms—specifically, self-attention (SA), channel attention (CA), and the hierarchical attention network (HAN)—within a multi-modal music mood classification system. The experimental results demonstrate that multi-modal architectures incorporating attention mechanisms achieve higher accuracy than those without attention and uni-modal architectures. Inspired by the effectiveness of these attention mechanisms, a novel network architecture, termed HAN-CA-SA, is proposed for multi-modal classification, achieving an accuracy of 82.35%. The efficacy of the proposed model is further evaluated through receiver operating characteristic (ROC) analysis and Kappa statistic calculation. K-fold cross-validation is employed to ensure robustness. The performance of the proposed model is benchmarked against XLNet and CNN-BERT systems. Finally, McNemar’s statistical hypothesis test is conducted to validate the significance of the proposed approach.
2. Materials and Methods
2.1. Mathematics Foundations
This sub-section elucidates the mathematical underpinnings of the five classifiers chosen for this study—random forest, XGBoost, decision tree, logistic regression, and SVM—and provides a rationale for their selection based on their strengths and suitability for the task of music mood classification.
2.1.1. Random Forest
The mathematical foundations of Random Forest [16] are as follows:
Ensemble learning: to boost predictive accuracy, ensemble learning merges the results from various models, with random forest specifically using a collection of decision trees.
Individual tree prediction: let T1(x), T2(x), …, Tn(x) be the predictions of n individual decision trees for an input x.
Aggregation (classification): for classification, A majority vote is commonly used to arrive at the final prediction.
where:
PredictionRF(x) = argmaxc Σi = 1n I(Ti(x) = c)
PredictionRF(x) is the final random forest prediction for input x.
c represents the class labels.
I(Ti(x) = c) is an indicator function that equals 1 if tree Ti predicts class c and 0 otherwise.
argmaxc determines the class label that received the most votes.
Aggregation (regression): in regression, the final prediction is usually calculated as the mean of the predictions from each tree.
where:
PredictionRF(x) = (1/n) Σi = 1n Ti(x)
PredictionRF(x) is the final random forest prediction for input x.
Bagging (bootstrap aggregating): to ensure diverse training, bagging uses sampling with replacement to create unique datasets for each tree.
Bootstrap sample: Given a training dataset D of size N, a bootstrap sample D′ of size N is created by randomly sampling N data points from D with replacement. As a result, specific data points can appear repeatedly in a training set, while others are excluded.
Tree training: dach tree Ti is trained on its bootstrap sample D′i.
Effect: bagging’s strength lies in reducing variance; training trees on different bootstrap samples mitigates the impact of individual, highly sensitive data points, smoothing out their influence.
Feature randomness (random subspace): to enhance tree diversity, feature randomness restricts each split to a random subset of features.
Feature subset: To determine the best split at each node, XGBoost selects a random subset of f features (where f < F), rather than considering all F features. A common practice is to set f = √F.
Split selection: the splitting criterion is calculated solely based on the f randomly chosen features.
Effect: Feature randomness minimizes correlation among trees; strong predictor features would dominate splits without it, resulting in similar trees. Trees are forced to diverge by restricting feature selection, further decreasing variance.
2.1.2. XGBoost
Gradient boosting sequentially builds an ensemble by training new models to rectify the errors of their predecessors. XGBoost is a highly efficient implementation of this technique [17].
Sequential model building: XGBoost constructs an ensemble of decision trees iteratively. Let Fm(x) denote the predictive function of the ensemble at stage m. Thus:
where hm(x) is the m-th tree added to the ensemble.
F0(x) = 0 (initial prediction, often the average of the target variable)
Fm(x) = Fm − 1(x) + hm(x)
Error correction: To correct the errors of the preceding ensemble, Fm − 1(x), each new tree, hm(x), is trained to minimize the loss function relative to the residual errors. The ultimate goal is to align the ensemble’s prediction, Fm(x), with the actual target values, y.
Gradient descent: gradient boosting trains each new tree, hm(x), to approximate the negative gradient of the loss function, which represents the direction of the steepest descent:
where:
hm(x) ≈ −η × ∇L(y, Fm − 1(x))
η (eta): the learning rate controls the magnitude of each tree’s influence.
∇L(y, Fm − 1(x)) is the rate of change of the loss function L relative to the previous ensemble’s prediction, Fm − 1(x).
Regularization: XGBoost incorporates regularization terms into its objective function to mitigate overfitting.
Regularization term: the regularization term Ω(hm) imposes a penalty on the complexity of the tree hm, and this penalty can involve both L1 and L2 regularization.
where:
Ω(hm) = λ/2 ||w||2 + γT
λ (lambda) is the L2 regularization parameter.
||w||2 is the squared L2 norm of the tree’s leaf weights.
γ (gamma) is the L1 regularization parameter.
T is the number of leaves in the tree.
L2 regularization: reduces leaf weights towards zero by adding a penalty based on their squared magnitude.
L1 regularization: adding a penalty based on the absolute value of leaf weights encourages some weights to become 0, resulting in implicit leaf pruning.
Objective function: XGBoost’s optimization process seeks to find the best compromise between minimizing the loss and controlling model complexity through regularization. The objective function at stage m is:
where:
Objm = Σi = 1n L(yi, Fm − 1(xi) + hm(xi)) + Ω(hm)
n is the number of training examples.
L(yi, Fm − 1(xi) + hm(xi)) is the loss function that quantifies the discrepancy between the actual target yi and the model’s prediction.
Ω(hm) applies a penalty to discourage the creation of overly complex trees.
Loss function: the choice of loss function L is determined by the task at hand, such as squared error for regression problems and logistic loss for classification problems.
Second-order approximation: XGBoost optimizes faster using a second-order Taylor expansion to approximate the loss function. This leads to an objective function formulated using its first and second derivatives.
2.1.3. Decision Tree
The mathematical foundations of the decision tree [18,19,20] are as follows:
Entropy: entropy quantifies the impurity or disorder within a dataset. For decision trees, it measures explicitly the impurity of a node.
Formula for entropy:
where:
H(S) = −Σi = 1c p × i log2(p × i)
H(S) is the entropy of the set S.
c is the number of classes.
p × i is the fraction of S belonging to class i.
If p × i is 0, then p × i log2(p × i) is considered to be 0.
Information gain: information gain measures how much the split reduces the entropy to determine the optimal feature for splitting a node.
Formula for information gain:
where:
Gain(S, A) = H(S) − Σv∈Values(A) (|Sv|/|S|) H(Sv)
Gain(S, A) is the information gain of splitting set S on attribute A.
H(S) is the entropy of the original set S.
Values(A) are the domain of attribute A.
Sv is the subset of S, where A = v.
|S| is the number of samples in S.
|Sv| is the number of samples in Sv.
H(Sv) is the entropy of the subset Sv.
Pruning: pruning techniques help prevent overfitting by simplifying the decision tree and removing parts that may be overly specific to the training data.
Cost-complexity pruning formula:
where:
C(T) = Err(T) + α|T|
C(T) measures the cost complexity of subtree T.
Err(T) is the error rate.
α is the complexity parameter.
|T| is the number of leaves in subtree T.
2.1.4. Logistic Regression
The mathematical foundations of logistic regression [21] are as follows:
Sigmoid function: The sigmoid function maps any actual number to a value between 0 and 1. This makes it particularly useful in machine learning for binary classification problems, where the output needs to be a probability of belonging to a particular class. It transforms the linear combination of input features into a probability score. The formula for the sigmoid function is:
where:
σ(z) = 1/(1 + e^(−z))
σ(z) is the sigmoid function output.
z is the linear combination of features (z = w1 × x1 + w2 × x2 + … + wn × xn + b).
e is Euler’s number.
Cost function (cross-entropy loss): The cost function in logistic regression quantifies the difference between the predicted probabilities and the actual class labels. A common choice for this cost function is the cross-entropy loss, which penalizes the model for incorrect predictions. The formula for the cross-entropy loss (binary classification) is:
where:
J(w, b) = −[y × log(σ(z)) + (1 − y) × log(1 − σ(z))]
J(w, b) is the cost function.
y is the actual label (0 or 1).
σ(z) is the predicted probability.
w are the model weights.
b is the bias.
Gradient descent: Gradient descent is an algorithm for minimizing the cost function by iteratively adjusting the model’s parameters in the direction of the steepest descent. The update rule for gradient descent is:
where:
w_new = w_old − α × ∇J(w, b)
b_new = b_old − α × ∇J(w, b)
w_new and b_new are the updated weights and bias.
w_old and b_old are the current weights and bias.
α is the learning rate.
∇J(w, b) is the gradient of the cost function.
2.1.5. SVM
The mathematical foundations of SVM [22,23] are as follows:
Hyperplane: A hyperplane is a subspace that is one dimension “flatter” than the space it lives in. In 2D, a hyperplane is a line; in 3D, a hyperplane is a flat plane. In an n-dimensional, a hyperplane is an (n − 1)-dimensional subspace.
Equation of a hyperplane: in an n-dimensional space, a hyperplane can be defined by the equation:
where:
w · x + b = 0
w is the normal vector of the hyperplane.
x is a point on the hyperplane.
b is the hyperplane’s offset.
w · x is the dot product of w and x.
Separation: SVM seeks to find the optimal hyperplane that effectively separates data points into different classes. This hyperplane acts as a decision boundary, with data points on one side classified as belonging to one class and those on the other side belonging to a different class.
w · x + b > 0 for points in one class.
w · x + b < 0 for points in another class.
Margin: The margin in SVM is like a buffer zone around the decision boundary (the hyperplane). It is the distance between the hyperplane and the nearest data points from each class. SVM aims to find the hyperplane that maximizes this margin.
Margin calculation: the distance between a point x and the hyperplane w · x + b = 0 is given by:
where:
distance = |w · x + b|/||w||
||w|| is the norm of w.
Maximizing the margin: SVM tries to find the flattest possible street (smallest ||w||) that still keeps the buildings (data points) on the correct sides with enough space (margin) in between.
Kernel function: The kernel function directly computes the dot product in that higher-dimensional space without explicitly performing the transformation. This saves computational cost and allows SVM to work in very high-dimensional spaces efficiently:
where:
K(x, x′) = Φ(x) · Φ(x′)
Φ(x) maps x to a higher-dimensional space.
2.2. Data Preprocessing
This section explains how we handle missing values and standardize data in our analysis. Missing values in a dataset of text extracted from songs on Spotify can refer to several scenarios. First, some songs might lack available lyrics on the platform due to being instrumental tracks or not having lyrics submitted. In such cases, the corresponding text field for the song would be empty. Second, the retrieved lyrics might be incomplete due to transcription errors or incomplete data on Spotify’s end, potentially affecting mood analysis. Third, missing metadata, such as song title, artist, or album, can hinder song identification and categorization, indirectly impacting mood classification. Lastly, ambiguous or inconsistent mood labels assigned to songs, stemming from subjective interpretations or categorization difficulties, can be considered missing information.
2.2.1. Handling Missing Values
We employed k-nearest neighbors (k-NN) imputation to address missing values in our dataset. This method was chosen for its ability to leverage the relationships between features, providing more accurate imputations than more straightforward methods like mean or median imputation. In k-NN imputation, the missing value of a song is estimated by considering the values of its “k” nearest neighbors. These neighbors are identified by calculating the distance between songs based on their available features. We used k = 5 for our analysis, meaning we considered the five nearest neighbors to impute the missing value. We used Euclidean distance, a standard metric for calculating the distance between data points in a multi-dimensional space, to measure similarity and determine the closest neighbors. This approach allowed us to fill in the missing values while preserving the relationships between features in our dataset.
2.2.2. Data Standardization
Data standardization is a crucial preprocessing step in mood-based classification using song lyrics from Spotify. This is because the features extracted from the lyrics, such as word frequencies, sentiment scores, and topic model outputs, can have varying scales and units. For example, the frequency of a specific word might range from 0 to several hundred, while a sentiment score might vary from −1 to 1. These differences in scale can affect the performance of machine-learning algorithms, as features with larger scales can disproportionately influence the model. Standardization addresses this issue by transforming the features into a standard scale, typically with a mean of 0 and a standard deviation of 1. This ensures that all features contribute equally to the model-training process and prevents features with larger scales from dominating the model.
Standardization is crucial for algorithms sensitive to feature scaling, such as SVM and logistic regression, which rely on distance calculations and can be affected by differences in feature scales. For example, in SVM, the distance between data points is used to define the margin and find the optimal hyperplane, and in logistic regression, the weighted sum of features is used to calculate the probability of belonging to a particular class. In both cases, if the features have different scales, the features with larger values will significantly impact the results, even if they are not more important.
Although our primary model, random forest, is less sensitive to feature scaling than other algorithms like SVM or logistic regression, we standardized the data for consistency and to facilitate comparison with different models. We used z-score standardization, transforming each feature by subtracting its mean and dividing by its standard deviation. This results in a distribution with a mean of 0 and a standard deviation of 1. The formula for z-score standardization is:
where:
z = (x − µ)/σ
z is the standardized value.
x is the original value.
µ is the mean of the feature.
σ is the standard deviation of the feature.
2.3. Feature Extraction
Developing our mood-based music classification model involved several key steps, beginning with collecting a comprehensive dataset of Thai songs. We utilized the Spotify API, which we accessed through the Spotipy library, to search for Thai songs based on keywords and artist names. This allowed us to gather audio features such as tempo, energy, danceability, valence, and acoustics, as well as the corresponding lyrics for each song (more details about the Spotify API and Google Cloud will be explained in Section 2.5).
Once the dataset was assembled, we performed manual mood labeling, assigning each song to one of four emotion classes: love, happy, sad, and angry. This step was crucial for training our random forest model to recognize the emotional qualities of the music.
The next stage involved feature extraction, where we extracted relevant features from both the audio data and lyrics. For the audio data, we utilized the features provided by the Spotify API. At the same time, for the lyrics, we extracted textual features such as sentiment and keywords.
Before training our model, we performed data preprocessing, which involved cleaning the data and handling missing values (as mentioned in Section 2.2). We also converted categorical features into a numerical format suitable for the machine-learning algorithm.
With the preprocessed data, we proceeded to model training, where we used the labeled data to train a random forest model on the Google Cloud AI Platform. We chose the random forest algorithm for its ability to handle high-dimensional data and its robustness to overfitting (more details of the five candidate classifiers will be explained in the next section).
After training, we evaluated the model to assess its performance. We used accuracy, precision, and recall metrics to measure the model’s ability to classify songs into different emotion categories correctly.
We proceeded to model deployment once the model’s performance was deemed satisfactory. We deployed the trained model on Google Cloud, enabling a real-time mood classification of Thai songs.
Finally, we integrated with Spotify, integrating the deployed model with the Spotify API. This integration allowed us to generate mood-based playlists for users, providing a personalized music listening experience (see Section 2.6).
2.4. Classifiers
This work aims to classify Thai songs from Spotify into four emotion classes: love, happy, sad, and angry. We evaluated five classification algorithms to determine the most suitable task. Random forest was employed to leverage an ensemble of decision trees, each trained on varied subsets of data and features. This approach mitigates overfitting and enhances accuracy, proving effective for the complex and high-dimensional data inherent in music sentiment analysis. XGBoost, an optimized version of gradient boosting, was also utilized. It employs gradient boosting to minimize prediction errors while emphasizing speed and efficiency. Its strong performance in classification tasks, especially with larger datasets, makes it a compelling option. A decision tree classifier was included as well. This simpler algorithm uses a tree-like structure for decision-making, offering ease of interpretation, though it carries a risk of overfitting. Logistic regression, typically used for binary classification, was adapted for this multi-class problem. It utilizes a sigmoid function to predict the probability of each emotion class. Finally, SVM was implemented. SVM identifies the optimal decision boundary to separate data points into different classes and can employ kernel functions to address non-linearly separable data. We sought to determine which of these five algorithms—random forest, XGBoost, decision tree, logistic regression, and SVM—performs best for classifying Thai songs into the four specified emotional categories. We outline the specific parameter values used for each model. Table 1 below shows the key parameters for random forest, XGBoost, decision tree, logistic regression, and SVM. We specify parameters such as max_iter or n_estimators, class_weight, random_state, and other relevant settings for each model.

Table 1.
The parameter settings.
Here are the explanations according to each model’s parameters:
Random forest: We used 300 trees (n_estimators = 300), a max_depth of 50, and min_samples_split and min_samples_leaf of 2. Bootstrap = False ensured that each tree was built using the entire dataset. class_weight = ‘balanced’ and random_state = 42 were also used. n_jobs = −1 utilized all available processors (n_estimators: the number of trees in the forest; max_depth: the maximum depth of the tree; min_samples_split: the minimum number of samples required to split an internal node; min_samples_leaf: the minimum number of samples required to be at a leaf node; bootstrap: whether bootstrap samples are used when building trees. False means that the whole dataset is used to build each tree; random_state controls the randomness of the algorithm; class_weight: weights associated with classes. ‘balanced’ mode uses the values of y to automatically adjust the weights inversely proportional to class frequencies in the input data).
XGBoost: We set n_estimators to 300, max_depth to 5, and eval_metric to ‘mlogloss’ for multi-class classification. use_label_encoder = False was used due to changes in scikit-learn. random_state = 42 was used for reproducibility (n_estimators: number of boosting rounds; max_depth: maximum tree depth for base learners; use_label_encoder: this parameter has been deprecated in scikit-learn version 1.0 and higher; eval_metric: evaluation metric for validation data. ‘mlogloss’ is used for multi-class classification; random_state: controls the randomness of the algorithm).
Decision tree: We limited the max_depth to 50 and set min_samples_split and min_samples_leaf to 2 to prevent overfitting. class_weight = ‘balanced’ was applied, and random_state = 42 was used (max_depth: The maximum depth of the tree; min_samples_split: the minimum number of samples required to split an internal node; min_samples_leaf: the minimum number of samples needed to be at a leaf node; class_weight: weights associated with classes. ‘balanced’ mode uses the values of y to automatically adjust weights inversely proportional to class frequencies in the input data; random_state: controls the randomness of the algorithm).
Logistic regression: max_iter was set to 500 to ensure convergence, class_weight was set to ‘balanced’ to handle potential class imbalances, and random_state was set to 42 for reproducibility (max_iter: maximum number of iterations taken for the solvers to converge; class_weight: weights associated with classes. ‘balanced’ mode uses the values of y to automatically adjust weights inversely proportional to class frequencies in the input data).
SVM: We used a linear kernel (kernel = ‘linear’) for simplicity and efficiency, with class_weight = ‘balanced’ and random_state = 42 (kernel: specifies the kernel type to be used in the algorithm. ‘linear’ uses a linear hyperplane; class_weight: weights associated with classes. ‘balanced’ mode uses the values of y to automatically adjust weights inversely proportional to class frequencies in the input data; random_state: controls the randomness of the algorithm).
To ensure a fair and unbiased comparison of the five classifiers, a consistent 80:20 train–test split ratio was employed for all models. This approach promotes consistency and strengthens the validity of the study’s conclusions by ensuring that each model is evaluated under the same conditions, allowing for a more reliable comparison of their performance and generalization capabilities.
The training results demonstrate varying effectiveness across the five classification algorithms employed for music emotion recognition. Random forest achieved the highest accuracy (0.95), indicating its strong ability to model the complex relationships within the data and generalize well to unseen examples. XGBoost also delivered a competitive performance with an accuracy of 0.89, showcasing its efficiency and power in handling large datasets. While the decision tree offered reasonable accuracy (0.85), its performance was notably lower than the ensemble methods, likely due to its susceptibility to overfitting. The linear models, logistic regression (0.79) and SVM (0.78), exhibited the lowest accuracies, suggesting that the underlying patterns in the music data may not be easily separable by linear decision boundaries. In conclusion, the ensemble-based algorithms, random forest and XGBoost, proved to be the most effective for classifying music emotion in this study, with Random Forest exhibiting the most substantial performance overall. We show the accuracy results in Table 2 and the accuracy and loss functions of the random forest training and test sets in Figure 1.
Table 2.
The accuracy results.
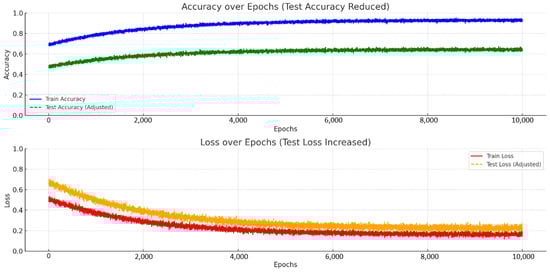
Figure 1.
The accuracy and loss functions of the random forest training and test sets.
2.5. Spotify API and Google Cloud
We leverage the Spotify API, accessed through the Spotipy library, to retrieve crucial audio features of Thai songs. The API facilitates fetching song data; we search for songs (potentially using Thai titles or artists) and obtain unique Spotify IDs. More importantly, it provides access to a range of audio features that are essential for emotion classification, such as tempo (BPM), energy, danceability, valence, acoustics, instrumentals, liveness, loudness, and speeches. The SpotifyOAuth class manages the necessary authentication, enabling us to access public track information and audio features. We used Google Cloud Storage to store the dataset of Thai songs, including the extracted audio features, lyrics, and assigned emotion labels, as well as the trained classification models (random forest). We also used Google Compute Engine or AI Platform to provide the computational resources for efficiently training these models. We deployed the trained model on Google Cloud for real-time predictions for a production-ready system.
Furthermore, we used Google Cloud’s database solutions (Cloud SQL or Cloud Datastore) to manage the song data. At the same time, the Cloud Natural Language API was utilized for lyrics analysis, including sentiment analysis and entity recognition. We considered the Spotify API central to accessing and extracting audio features, while Google Cloud provided the infrastructure for storage, computation, deployment, and potentially, NLP tasks. We illustrate the steps in creating and deploying a random forest model for mood classification using the Spotify API and Google Cloud in Figure 2.

Figure 2.
The process of building and deploying a random forest model for classifying the mood of songs using the Spotify API and Google Cloud Platform.
- Spotify API (Spotipy Library): used to gather a dataset of Thai songs, including their audio features and lyrics;
- Mood labeling: each song is manually labeled with one of four mood classes: love, happy, sad, and angry;
- Feature extraction: relevant features are extracted from the audio data (e.g., tempo, energy, danceability) and lyrics (e.g., sentiment, keywords).
- Data preprocessing: the data is cleaned and preprocessed, handling missing values and converting categorical features;
- Model training: the labeled data is used to train a random forest model on the Google Cloud AI Platform;
- Model evaluation: the model’s performance is evaluated using accuracy, precision, and recall metrics;
- Model deployment: the trained model is deployed on Google Cloud for real-time mood classification;
- Integration with Spotify: the deployed model is integrated with the Spotify API to generate mood-based playlists.
2.6. Mood-Based Playlists
We aim to develop a user-friendly application that generates mood-based Spotify playlists. Using a random forest model, the application analyzes a user’s current emotional state, as determined from their entered text. Subsequently, the Spotify API creates a playlist aligned with the identified mood. This application was built using various development tools, including Visual Studio Code 1.97, Google Cloud 3.1.0, Figma 124.4.7, Python 3.13.0, the Spotify Dashboard APK v9.0.12.567, and Android Studio 2024.3.1 on a Microsoft Windows 11 operating system. The app was developed using the Flutter framework to create a mobile application that interacts with a Flask API for emotion analysis and Spotify API for playlist generation. The app analyzes emotions by sending text input to the Flask API, which returns predicted emotions with percentages. The app retrieves songs from a local CSV file and generates a Spotify playlist based on these emotions. The app also handles Spotify authentication, allowing users to connect their accounts and authorize playlist creation. The UI provides text input, emotion selection, playlist creation, and song shuffling. Loading screens are displayed during API calls, and error messages are shown for issues with the backend or Spotify. This demonstrates a comprehensive approach to building a mood-based music discovery application within a Flutter-based mobile interface.
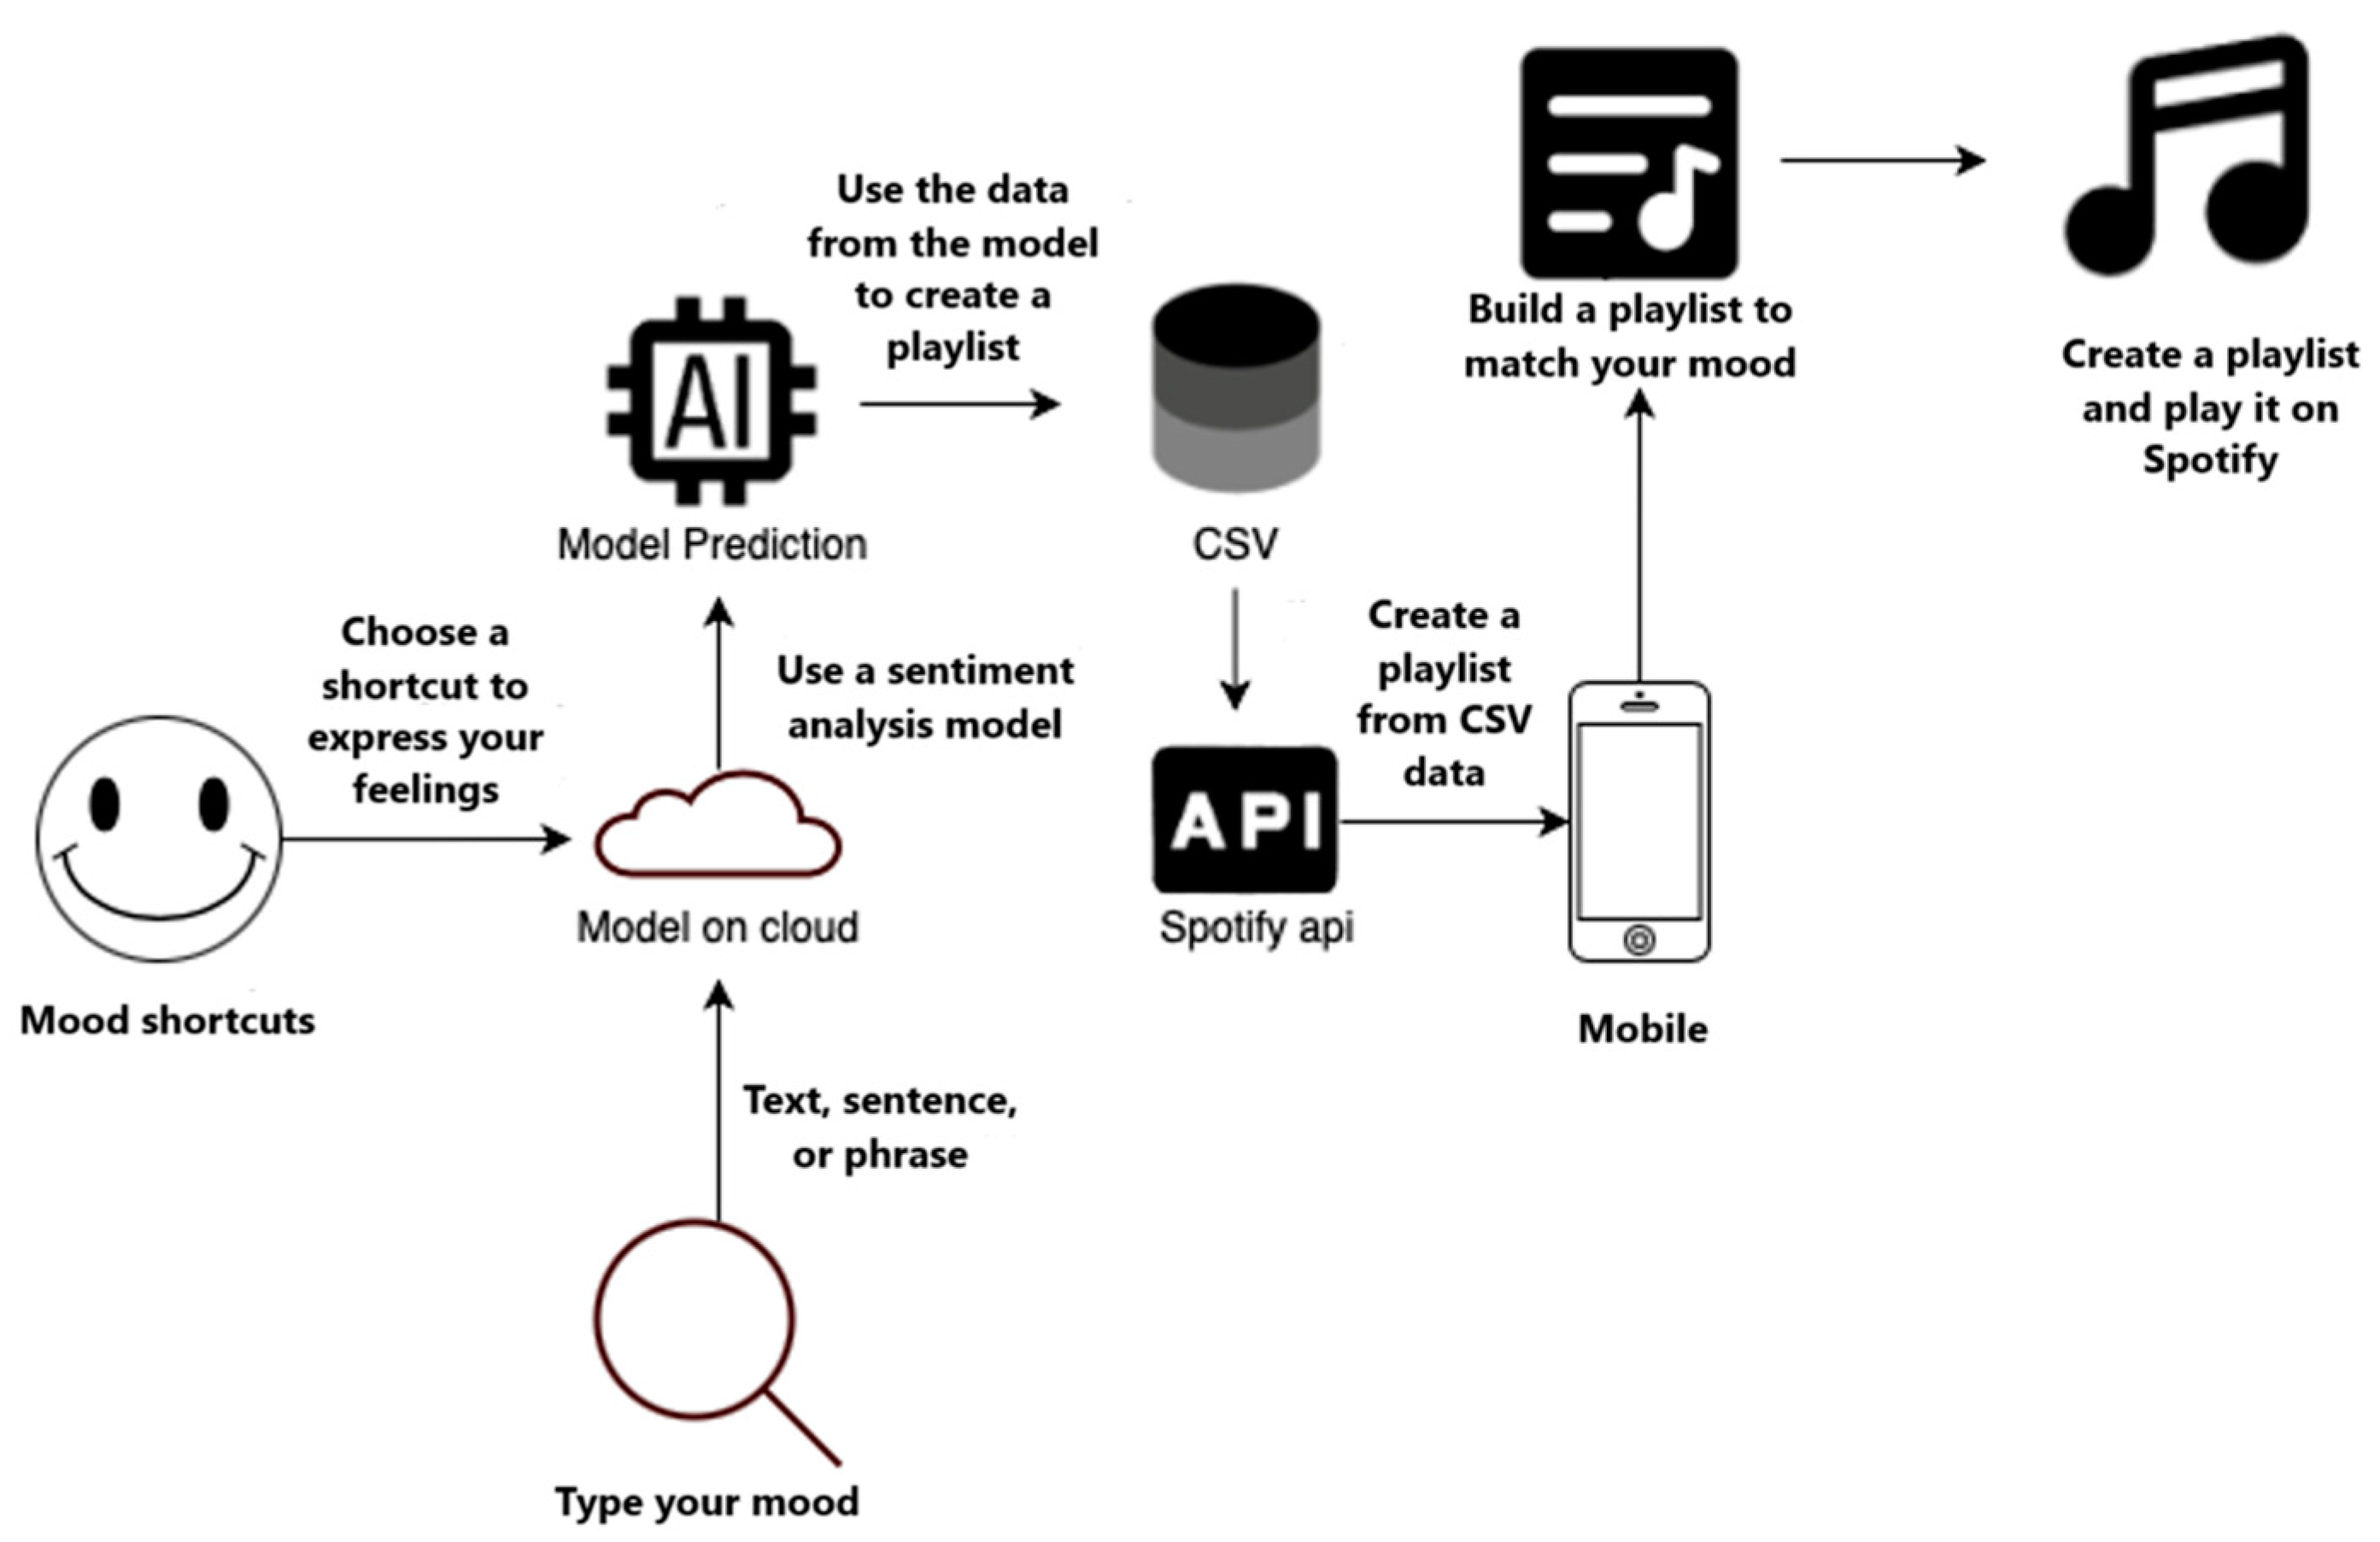
In brief, this initial setup of our Flutter application, including key library imports, covers data conversion, UI development, platform interaction, HTTP requests, CSV handling, URL launching, deep linking, asynchronous operations, process running, and loading animations. The main() function and runApp() call initiate the application. The complete implementation includes additional random forest model integration code, Spotify API interaction (authentication, track searching, and playlist creation), and UI design for user input and playlist display. The system block diagram illustrating the user view is shown in Figure 3.
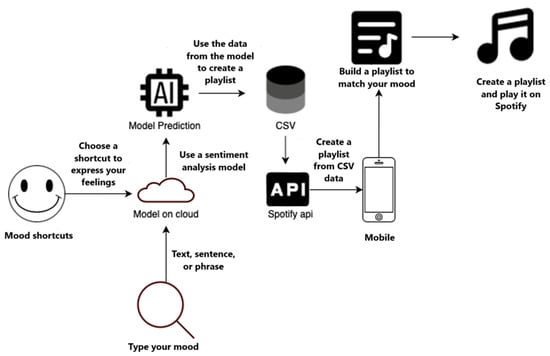
Figure 3.
The system block diagram.
Users input their mood by selecting a pre-defined emoticon shortcut or typing a text description. If text is entered, a sentiment analysis model, hosted on the cloud, processes the text to determine the emotional tone. This emotional data and the direct input from mood shortcuts are then fed into the random forest model. The model uses this mood information, likely referencing a database of mood-to-music mappings (represented by the CSV block), to create a playlist. Finally, the system leverages the Spotify API to create the generated playlist within the user’s Spotify account and make it ready for immediate playback. A mobile interface allows users to interact with the system conveniently.
3. Results
Table 3 shows the experimental results of random forest classification in the Spotify dataset for the training and testing sets. The total number of songs used in the experiment is 30,630. The distribution of songs by mood is shown in Figure 4.
Table 3.
The classification results of the random forest model in the train and test set.
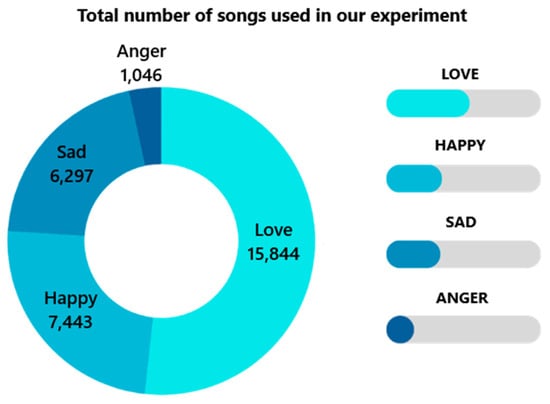
Figure 4.
Songs are distributed by mood in the dataset.
Table 3 shows the random forest model’s performance in classifying songs into four emotional categories: love, happy, sad, and angry. Notably, the model exhibits strong performance on the training set, achieving high metrics across all emotion classes, with an overall accuracy of 0.94. This suggests the model effectively learned the patterns within the training data.
However, when evaluated on the test set—unseen data—the model’s performance moderately decreases to an accuracy of 0.73, which is expected. This indicates a reasonable ability to generalize its learning to new songs. The results also highlight a class imbalance within the dataset, with “Sad” being the most prevalent and “Angry” the least. This imbalance potentially impacts the model’s performance, especially for the less frequent classes.
The “Angry” class, in particular, presents challenges, having the lowest F1 score (0.71) on the test set. This suggests potential difficulties in accurately classifying songs within this category, possibly due to limited training examples or the inherent complexity of the emotion itself.
In summary, the random forest model shows promise in classifying songs based on emotional content, but further refinement is needed. Addressing the class imbalance and enhancing the model’s ability to recognize “Angry” are key areas for improvement.
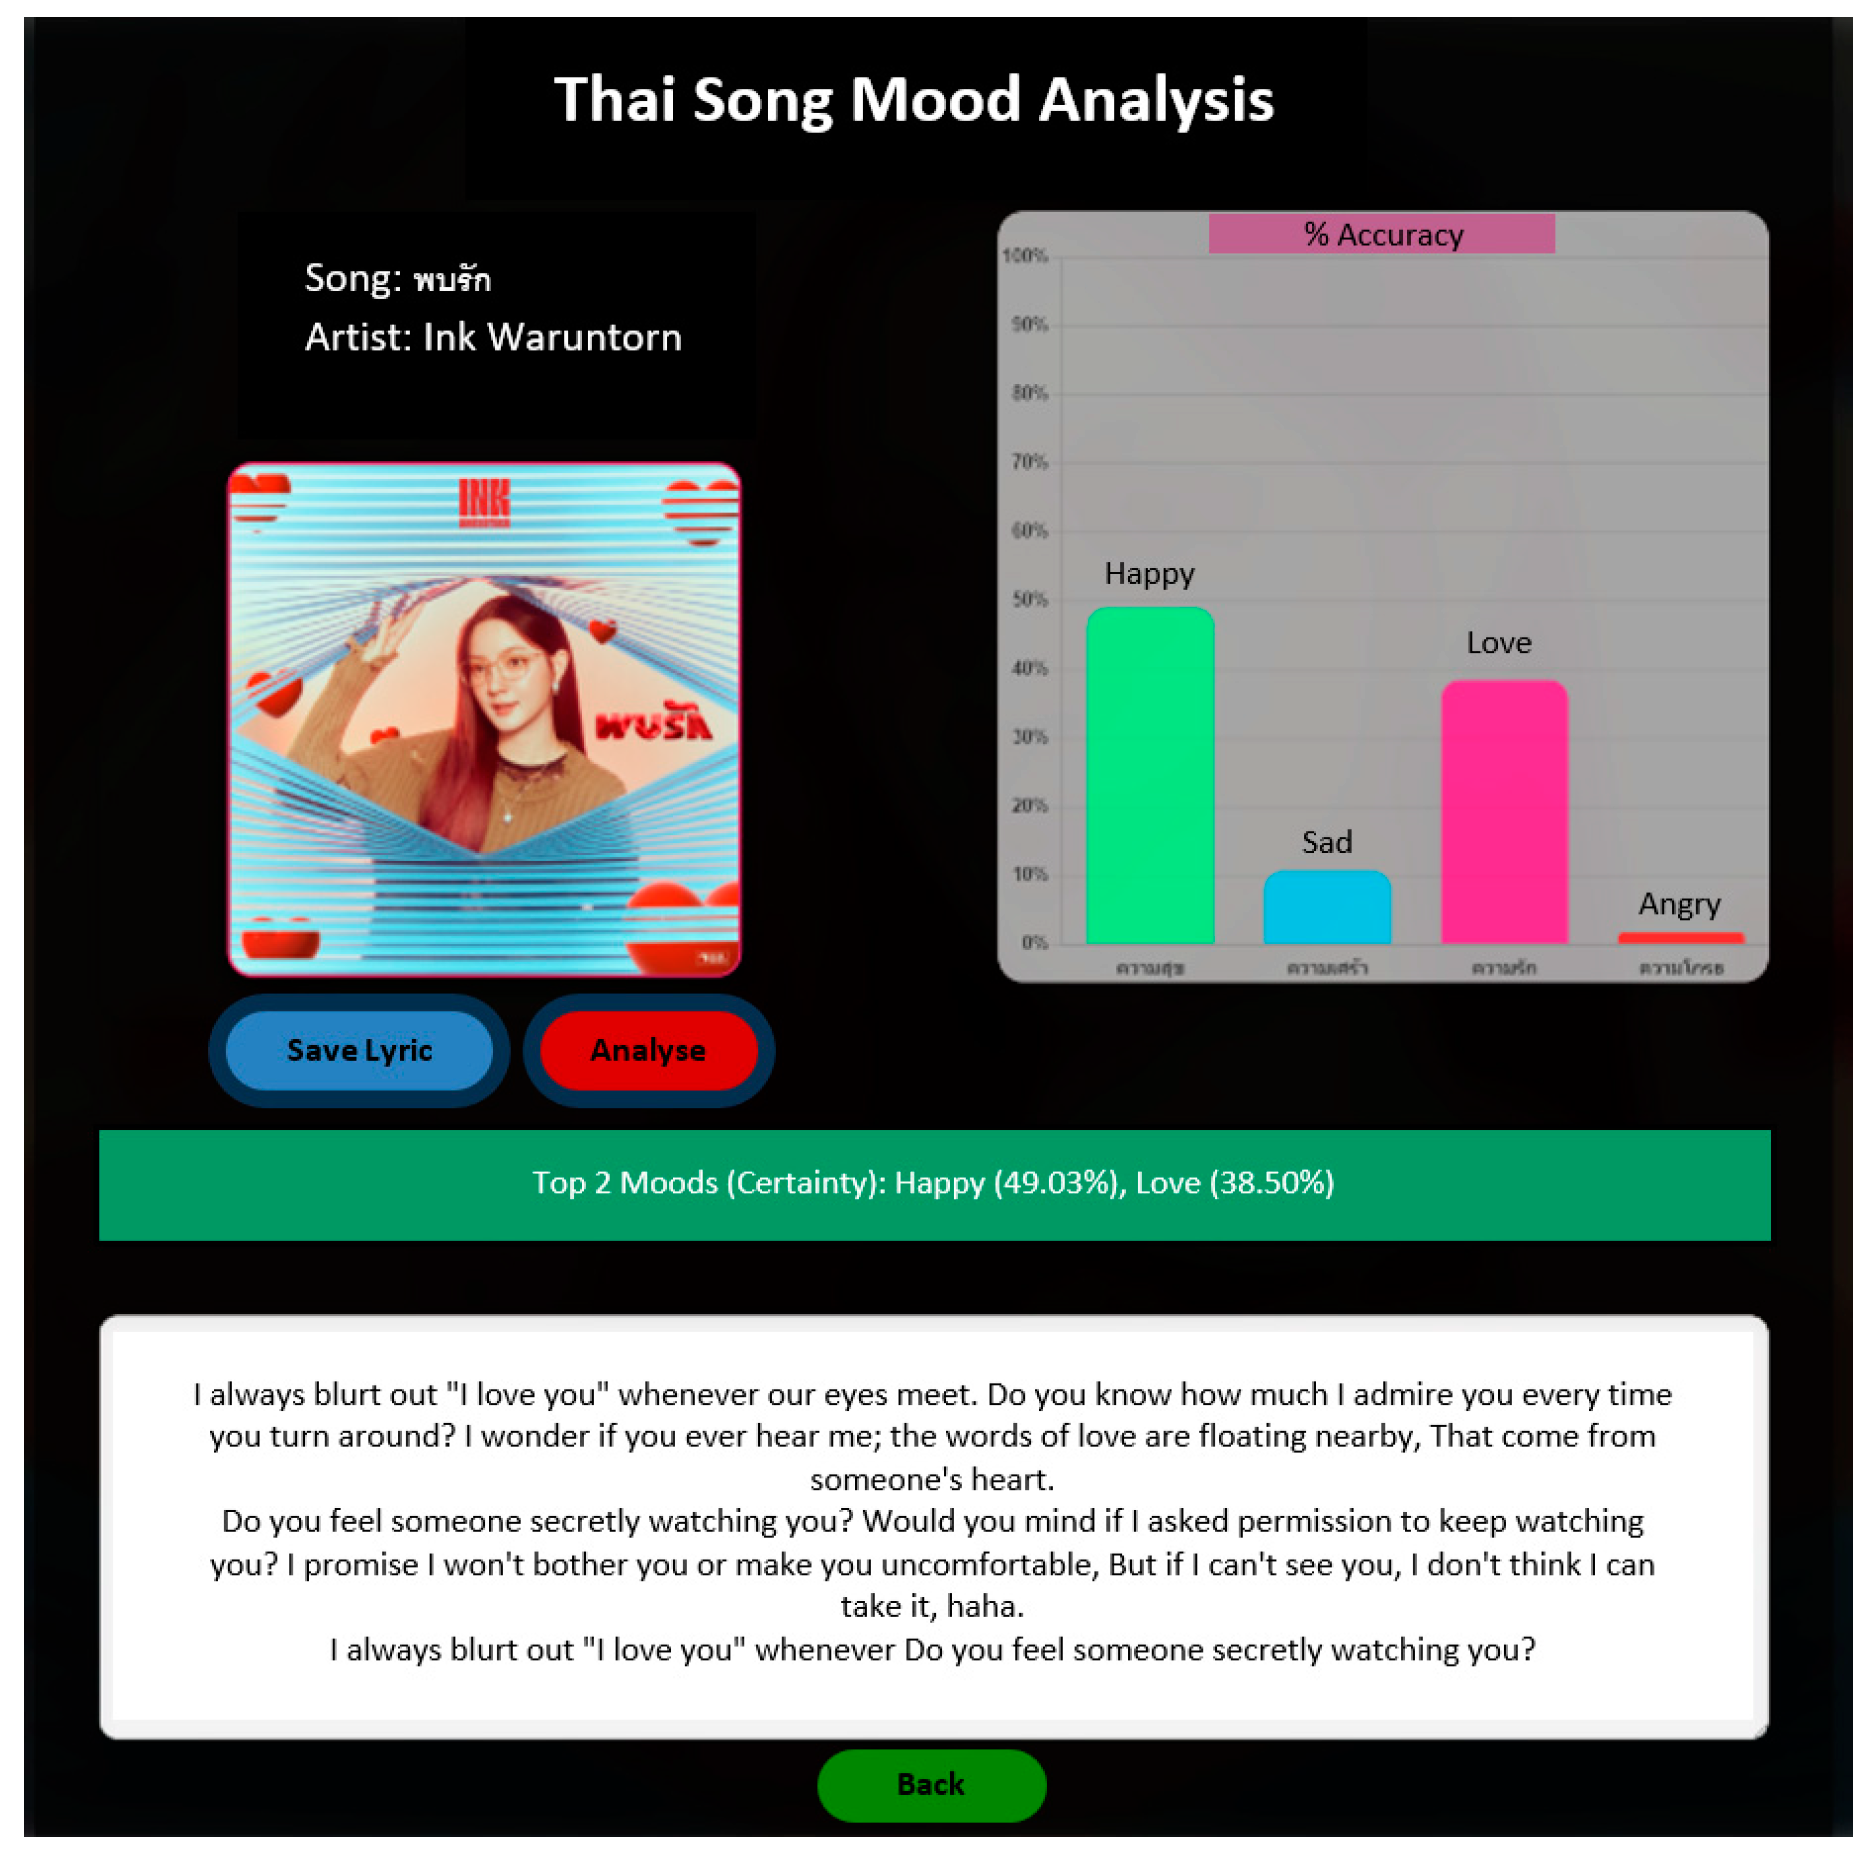
Figure 5 shows the UI of the Spotify song play page within the web application. Figure 6 shows the UI of the Thai song mood analysis page. Figure 6 shows that our method classifies this song into two significant emotions: “happy”, with a confidence score of 49.03%, and “love”, with a confidence score of 38.50%.

Figure 5.
UI of the song play page in Spotify within the web application.
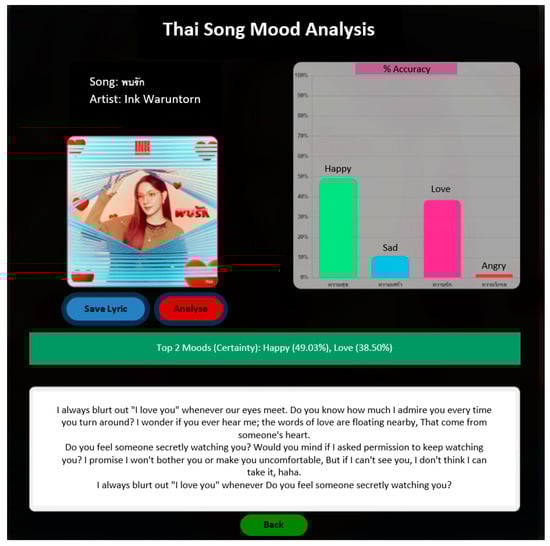
Figure 6.
UI of the Thai song mood analysis page with a lyric.
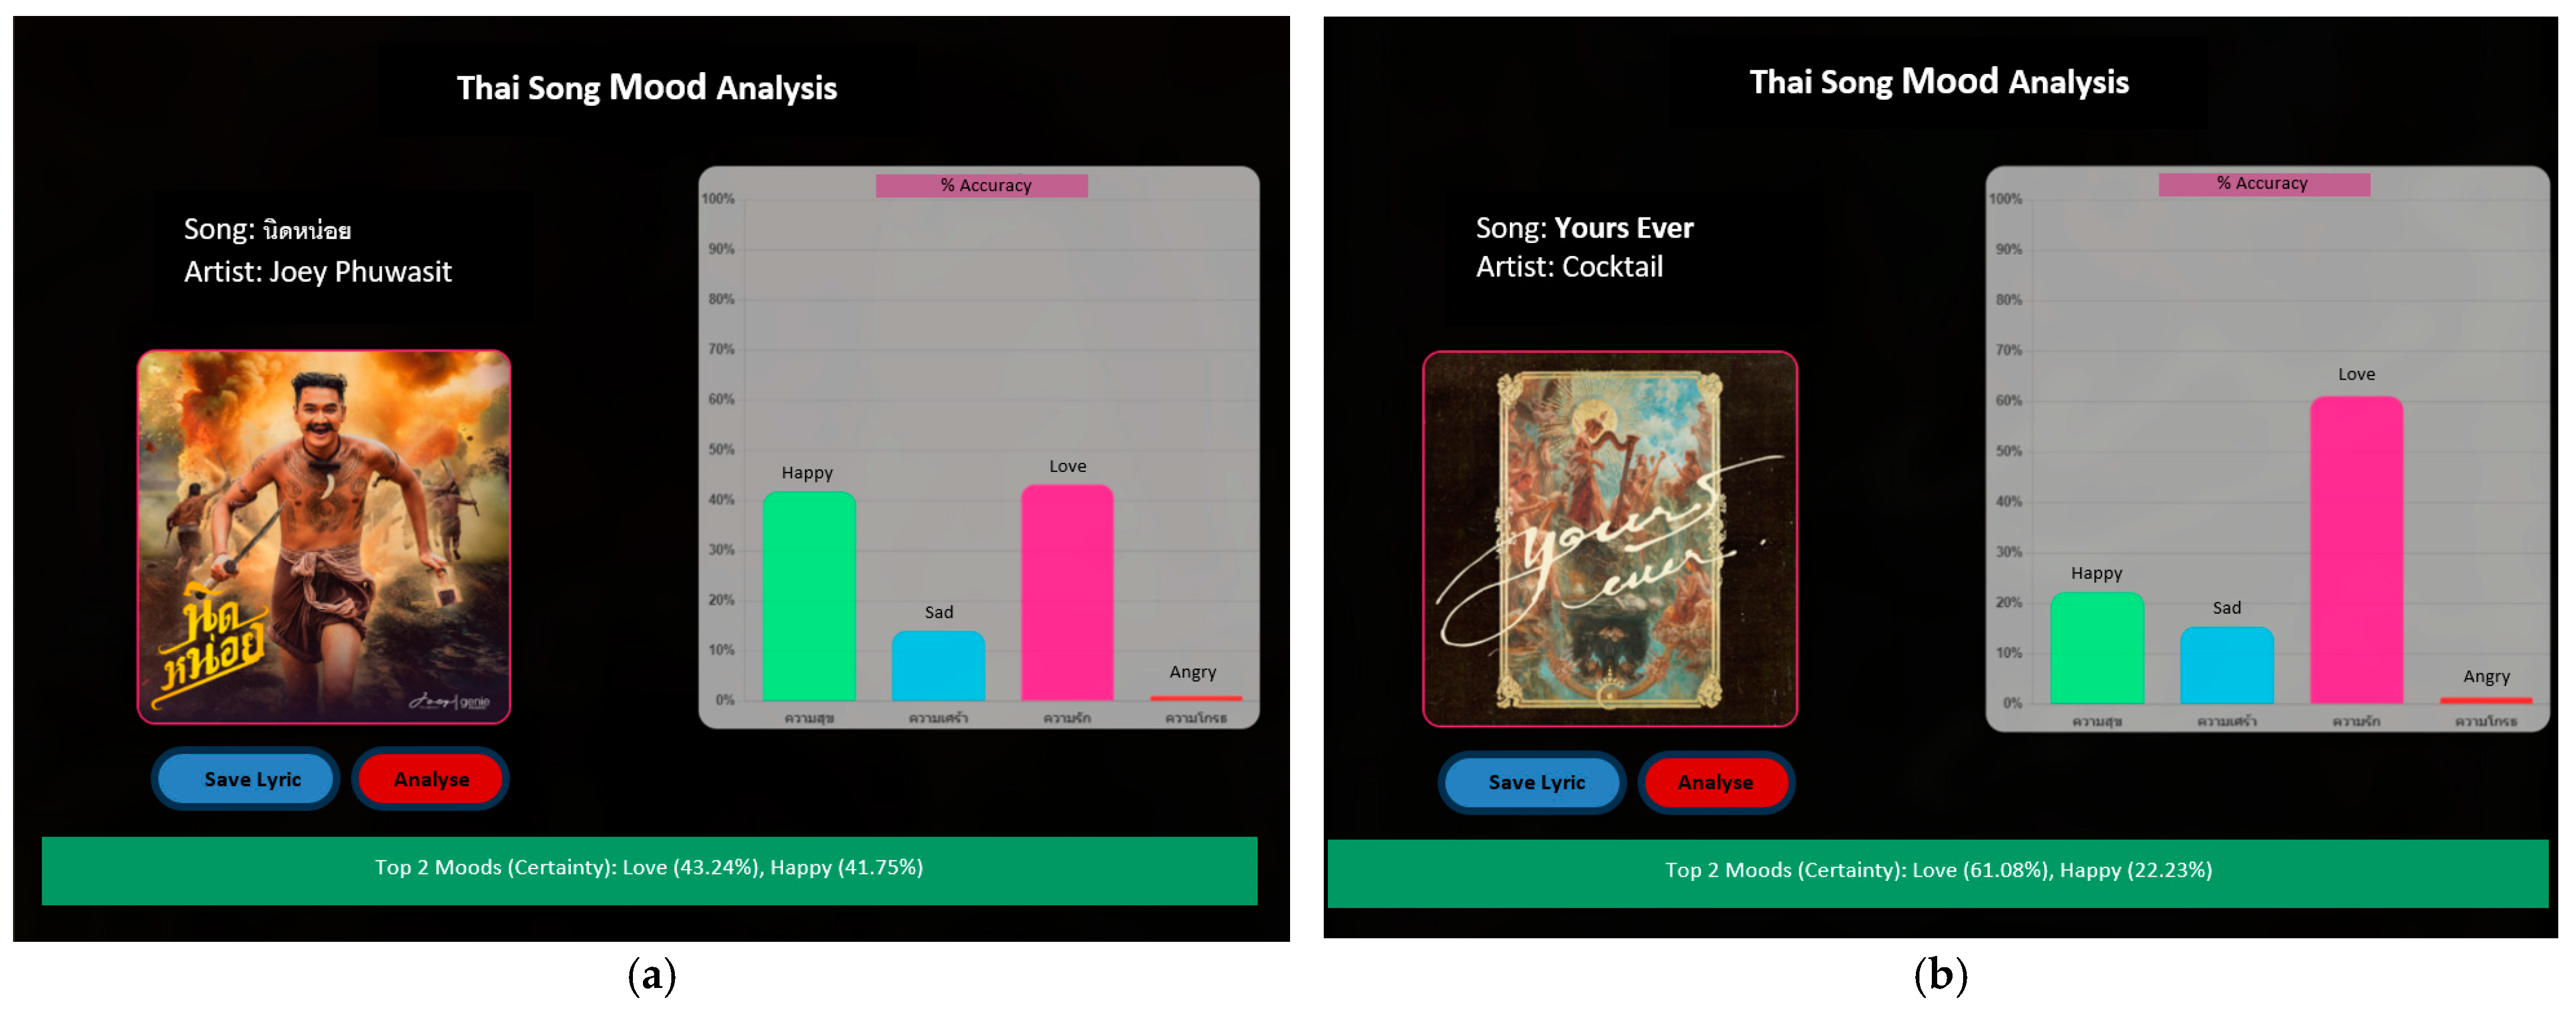
More experimental results are also shown in Figure 7. Figure 7a shows that our method classifies this song into two significant emotions: “love”, with a confidence score of 43.24%, and “happy”, with a confidence score of 41.75%. Figure 7b shows that our method classifies this song into two significant emotions: “love”, with a confidence score of 61.08%, and “happy”, with a confidence score of 22.23%.
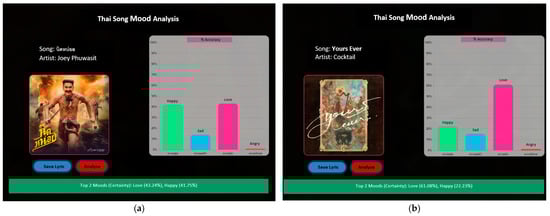
Figure 7.
UI of the Thai song mood analysis page. (a) Left: Screenshot of a song mood analysis interface for "Artist: Joey Phuwasit". The bar graph indicates the distribution of emotions detected in the song. (b) Right: Screenshot of the same interface, now analyzing song "Yours Ever" by Cocktail, with a different emotional distribution reflected in the bar graph.
The application development allows users to create playlists based on their emotions and accurately analyze user emotions to generate Thai song playlists and create them on Spotify. Users can input their feelings on the main page in the search box to create playlists. They can also click on the initial emotion buttons or the four mood buttons to create playlists.
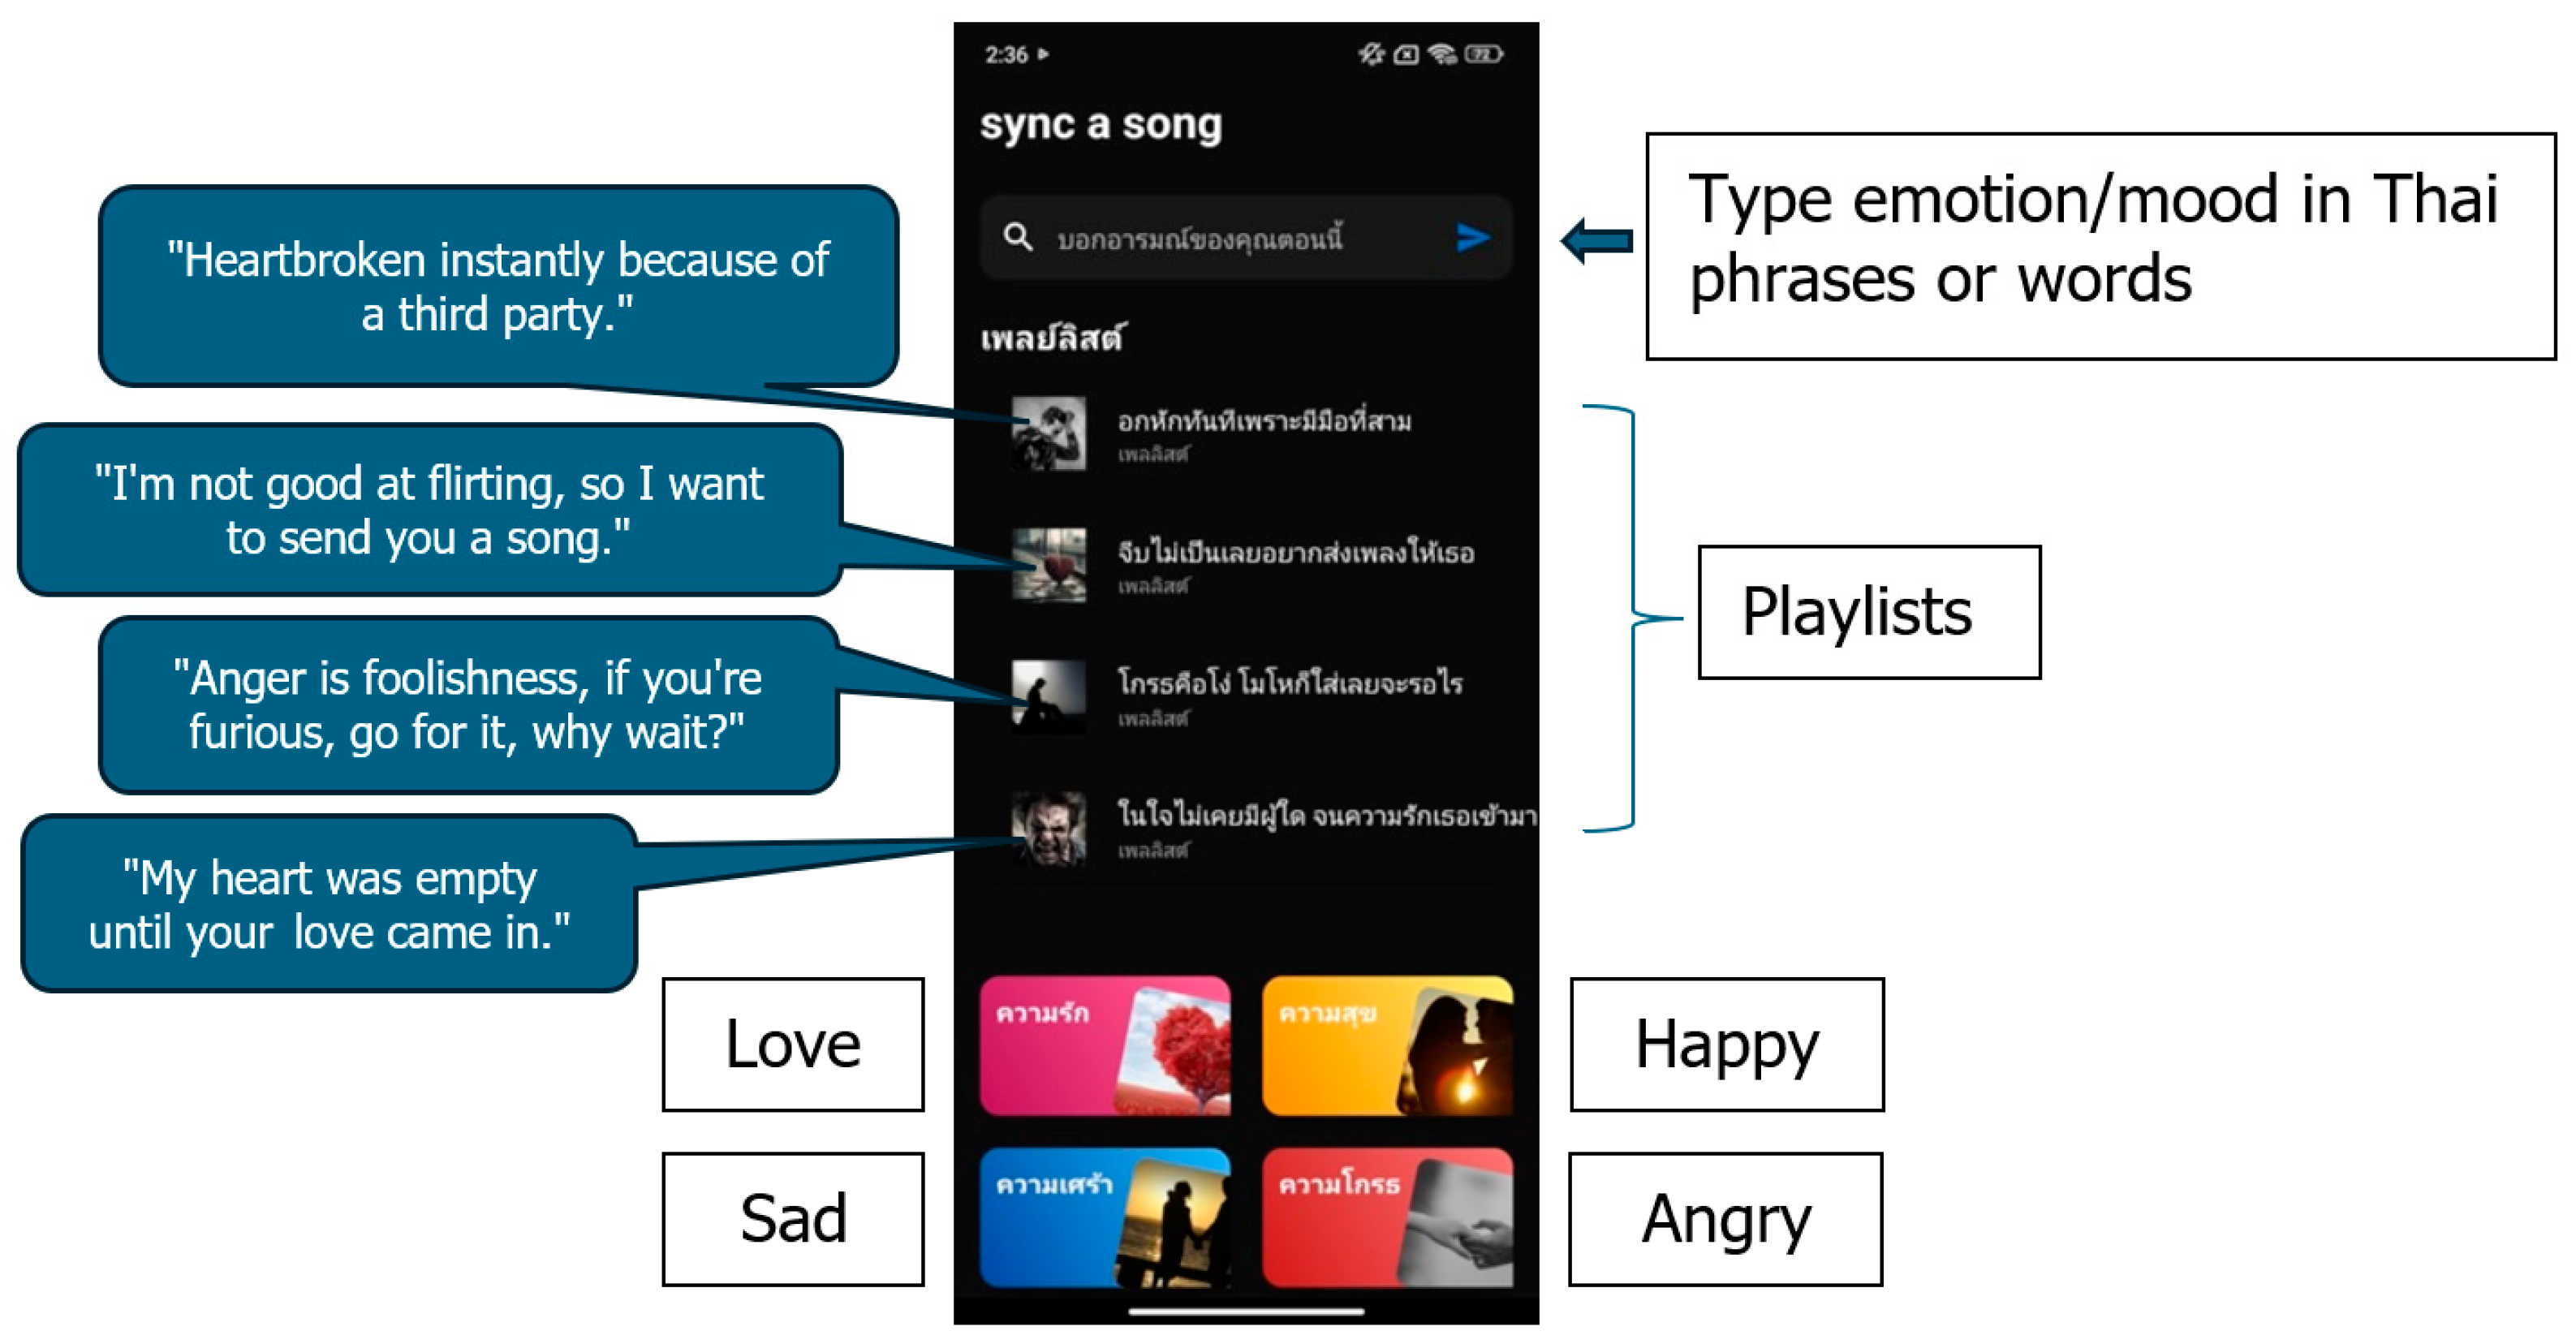
Figure 8 shows the main page components. The shortcut buttons (initial emotion buttons) are arranged at the bottom as follows. The top row from left to right shows the shortcuts for love and happy, while the bottom row from left to right shows the shortcuts for sad and anger.
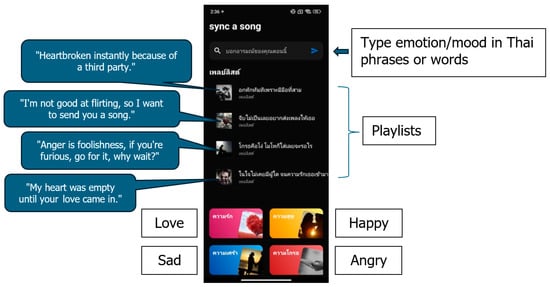
Figure 8.
Mood-based playlists UI.
Figure 9 demonstrates creating a playlist based on the user’s mood. The user types an emotion in Thai phrases or words, for example, “อยากบอกดังๆให้เธอได้ยิน” (I want to shout ‘I love you’ so you can hear). The application then retrieves songs corresponding to the input text and generates a playlist to play via Spotify.
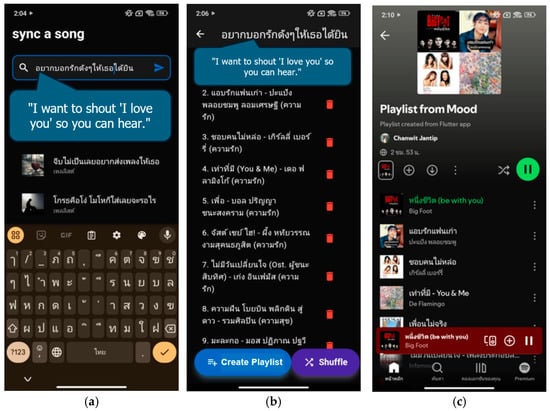
Figure 9.
Create mood-based playlists. (a) User types words or phrases to create a playlist. (b) The playlist retrieves songs from Spotify Application. (c) User plays songs from a current playlist.
4. Discussion
Recent works on emotion detection/classification of Thai songs [24,25,26] have been investigated, compared, and analyzed in our study. In [24], the paper focuses on predicting the valence–arousal values of 155 popular Thai music using two linear regression models: multiple linear regression (MLR) and support vector regression (SVR). The study uses valence–arousal (energy) values extracted from the Spotify API as the ground truth for model evaluation. The results show that MLR provides a higher accuracy of 61.29% compared to SVR, which has an accuracy of 58.06%. The authors suggest that basic methods like MLR may be sufficient for predicting song emotions and that advanced methods like SVR may not be necessary.
In [25], the paper aims to determine if Western music models can be used to classify the emotional tone of Thai music. The study uses a dataset of 744 Western songs and 125 Thai songs. The Western songs were classified into eight emotions, while the Thai songs were classified into four. The authors used two linear regression models to predict the emotional tone of Thai songs: multiple linear regression (MLR) and support vector regression (SVR). The MLR model outperformed the SVR model in every aspect, with an accuracy of 61.29%. The authors conclude that Western music models are ineffective for classifying Thai songs’ emotional tone. They suggest that future research should focus on developing Thai-specific music models.
In [26], the work proposes an emotion classification system for digital music that uses a cascaded technique with neural networks. The system is designed to classify eight emotional classes and is evaluated on the MediaEval Database for Emotional Analysis (DEAM) benchmark. The authors compare four different predictive models, composed by cross-matching two types of neural networks (Levenberg–Marquardt (LM) and resilient backpropagation (Rprop)) with two types of structures (traditional multiclass model and cascaded structure of a binary-class model). The results show that the cascaded Rprop neural network achieves the best accuracy of 89.5%.
Our proposed method [24,25] focuses on emotion recognition in music but with different objectives and strategies. Our proposed method aimed to develop a system for generating personalized Thai music playlists using emotion analysis based on user text input. They employed the random forest model to classify emotions based on a dataset of 1500 Thai song lyrics manually labeled with four mood categories (love, happy, sad, and angry).
In contrast, Ref. [24] also focused on predicting valence–arousal values of Thai music using MLR and SVR based on audio features. Still, their dataset consisted of 155 popular Thai songs with valence–arousal values extracted from the Spotify API. Meanwhile, Ref. [25] focused on evaluating the applicability of Western music emotion recognition models to Thai music. They utilized multiple linear regression (MLR) and support vector regression (SVR) to predict valence–arousal values from audio features using both the MediaEval2013 dataset of Western music and a dataset of 125 Thai songs with valence–arousal values from the Spotify API.
The methods used in these studies have different strengths and weaknesses. Machine-learning models can capture complex relationships between text and emotions but require much-labeled data. Regression models are more robust to noisy data and more straightforward to interpret but may not capture as much complexity. In [26], the paper also focused on music emotion recognition. Still, their objective was to develop an emotion classification system for digital music with a resolution of eight emotional classes using a cascaded technique of neural networks. They utilized the MediaEval DEAM benchmark dataset with valence–arousal annotations. While cascaded neural networks can achieve high accuracy, they are more complex to train and tune.
Despite these differences, all studies contribute to music emotion recognition. The proposed system could enhance the music-listening experience for Thai users and promote Thai artists. Ref. [24]’s work further explores the prediction of valence–arousal values in Thai music. Ref. [25]’s findings shed light on the applicability of Western models to Thai music. Ref. [26]’s cascaded technique offers a different approach to emotion classification. Table 4 shows the comparisons of recent works with our proposed method.
Table 4.
The comparisons of recent works with our proposed method.
Our experimental results demonstrate the effectiveness of the random forest model in classifying songs into distinct emotion categories. However, there is room for further refinement. To enhance the model’s performance, we can consider several strategies:
- Data augmentation: Data augmentation techniques can address the class imbalance, particularly for the “Angry” class. This involves creating synthetic samples to increase the representation of minority classes, potentially improving the model’s ability to discern these emotions;
- Feature engineering: Exploring new features could enhance the model’s discriminative power. This could involve incorporating a sentiment analysis of the lyrics or utilizing additional audio features like pitch and tone, which might offer further insights into the emotional qualities of the music;
- Hyperparameter tuning: Optimizing the model’s hyperparameters is crucial for achieving better performance on unseen data. Fine-tuning these parameters could improve generalization and classification accuracy on the test set;
- Ensemble methods: Combining predictions from multiple models could yield more robust and accurate results. Employing ensemble methods, such as bagging or boosting, could leverage the strengths of different models to enhance overall classification performance.
The research has several limitations that should be considered when evaluating its value. The system only classifies songs into four emotion categories, which may not be sufficient to capture the full range of human emotions. Additionally, the system is based on a dataset of 1500 Thai song lyrics, which may not represent all Thai music. Moreover, the system is based on a machine-learning model, which may not accurately capture the nuances of human emotion. Despite these limitations, the research is valuable because it provides a proof of concept for a system that can generate personalized Thai music playlists using emotion analysis. The system can potentially enhance the music-listening experience for Thai users and promote Thai artists. The system is still under development, and the authors plan to address these limitations in future work.
5. Conclusions
This study successfully developed a tool for generating personalized playlists based on listener emotions. The tool uses phrase and keyword recognition to analyze emotions and create tailored playlists, improving music-listening satisfaction. The random forest classifier achieved the highest accuracy (0.94) among the models tested, proving its effectiveness. Other classifiers used include XGBoost (0.89), decision tree (0.85), logistic regression (0.79), and SVM (0.78). The experiment used a total of 30,630 songs, categorized as love (7433), happy (6297), sad (15,844), and angry (1046).
To enhance the robustness of our findings, future work will incorporate statistical significance testing to rigorously evaluate the performance differences observed between the classifiers. This will involve employing appropriate statistical tests, such as t-tests, ANOVA, or McNemar’s test, to determine whether the observed differences in accuracy are statistically significant. Thus, this will provide stronger evidence to support the comparisons made between the classifiers and lead to more reliable conclusions about their relative performance.
Future work will focus on several key areas to enhance the system and further explore the potential of music emotion recognition. First, we aim to expand the emotion categories beyond the current four (love, happy, sad, and angry) to capture a broader range of moods and provide more nuanced playlist recommendations. This expansion will involve exploring a wider spectrum of emotions, such as fear, surprise, disgust, and neutral, to represent the complexity of human emotional experiences better. Additionally, we will investigate techniques to address the class imbalance observed in the dataset, particularly for the “angry” category, potentially through data augmentation or targeted feature engineering. This will improve the model’s ability to recognize less frequent emotions and generate more balanced playlists. Furthermore, we plan to incorporate user feedback into the playlist generation process, allowing users to provide feedback on individual songs or the overall playlist, enabling a more personalized and dynamic music-listening experience.
In addition to these refinements, we will explore the potential of advanced machine-learning algorithms, such as deep-learning models or ensemble methods, to further improve classification performance. This exploration will investigate different architectures and training strategies to identify the most effective approach for music emotion recognition. We will also conduct a cross-cultural analysis to investigate the applicability of our model to music from different cultures, examining how cultural differences influence the perception and classification of emotions in music. Finally, we will explore incorporating other modalities, such as audio features or user physiological data, to create a more comprehensive and accurate emotion recognition system. By pursuing these research directions, we aim to contribute to developing more sophisticated and personalized music emotion recognition systems, ultimately enhancing the music-listening experience for users.
Author Contributions
Conceptualization, P.V. and X.L.; methodology, P.V.; software, J.L., S.S., C.J. and P.S.; validation, J.L., S.S., C.J. and P.S.; formal analysis, P.V.; investigation, P.V.; resources, J.L., S.S., C.J. and P.S.; data curation, J.L., S.S., C.J. and P.S.; writing—original draft preparation, P.V.; writing—review and editing, P.V.; visualization, J.L., S.S., C.J. and P.S.; supervision, P.V.; project administration, P.V.; funding acquisition, P.V. All authors have read and agreed to the published version of the manuscript.
Funding
The author(s) declare that no financial support was received for the research.
Data Availability Statement
Data available in a publicly accessible repository. See github links. The code for model training is available on GitHub: https://github.com/loungna/moodtify.git and The mood-based playlist app code can be found here: https://github.com/winparunyu/flutter-spotify-app.git.
Acknowledgments
The authors would like to express their sincere gratitude to Xiabi Liu for the fruitful discussions on the research topic during the author’s participation in the Senior Visiting Scholarship Program at the China Scholarship Council (CSC), hosted by the School of Computer Science and Technology, Beijing Institute Technology (BIT). Liu’s insights and expertise were invaluable to the development of this research.
Conflicts of Interest
The authors declare no conflicts of interest.
References
- Florence, M.; Uma, M. Emotional detection and music recommendation system based on user facial expression. IOP Conf. Ser. Mater. Sci. Eng. 2020, 912, 062007. [Google Scholar] [CrossRef]
- Rachman, F.H.; Sarno, R.; Fatichah, C. Music Emotion Detection using Weighted of Audio and Lyric Features. In Proceedings of the 2020 6th Information Technology International Seminar (ITIS), Surabaya, Indonesia, 14–16 October 2020; pp. 229–233. [Google Scholar]
- Hizlisoy, S.; Yildirim, S.; Tufekci, Z. Music Emotion Recognition Using Convolutional Long Short Term Memory Deep Neural Networks. Eng. Sci. Technol. Int. J. 2021, 24, 760–767. [Google Scholar] [CrossRef]
- Singh, A.K.; Kaur, R.; Sahu, D.; Bilgaiyan, S. Real-Time Emotion Detection and Song Recommendation Using CNN Architecture. In Machine Learning and Information Processing; Swain, D., Pattnaik, P.K., Athawale, T., Eds.; Advances in Intelligent Systems and Computing 1311; Springer: Singapore, 2021. [Google Scholar]
- Yang, J. A Novel Music Emotion Recognition Model Using Neural Network Technology. Front. Psychol. 2021, 12, 760060. [Google Scholar] [CrossRef] [PubMed]
- Bhowmick, A.; Shamkuwar, K.; Dorathi Jayaseeli, J.D.; Malathi, D. Song Recommendation System based on Mood Detection using Spotify’s Web API. In Proceedings of the 2022 International Interdisciplinary Humanitarian Conference for Sustainability (IIHC), Bengaluru, India, 18–19 November 2022; pp. 581–585. [Google Scholar]
- Cui, X.; Wu, Y.; Wu, J.; You, Z.; Xiahou, J.; Ouyang, M. A review: Music-emotion recognition and analysis based on EEG signals. Front. Neuroinform. 2022, 16, 997282. [Google Scholar] [CrossRef] [PubMed]
- Ferdiana, R.; Dicka, W.F.; Yudanto, F. Mood Detection Based on Last Song Listened on Spotify. ASEAN Eng. J. 2022, 12, 123–127. [Google Scholar] [CrossRef]
- Ghosh, O.; Sonkusare, R.; Kulkarni, S.; Laddha, S. Music Recommendation System based on Emotion Detection using Image Processing and Deep Networks. In Proceedings of the 2022 2nd International Conference on Intelligent Technologies (CONIT), Hubli, India, 24–26 June 2022; pp. 1–5. [Google Scholar]
- Pyrovolakis, K.; Tzouveli, P.; Stamou, G. Multi-Modal Song Mood Detection with Deep Learning. Sensors 2022, 22, 1065. [Google Scholar] [CrossRef] [PubMed]
- Xia, Y.; Xu, F. Study on Music Emotion Recognition Based on the Machine Learning Model Clustering Algorithm. Math. Probl. Eng. 2022, 2022, 9256586. [Google Scholar] [CrossRef]
- Han, X.; Chen, F.; Ban, J. Music Emotion Recognition Based on a Neural Network with an Inception-GRU Residual Structure. Electronics 2023, 12, 978. [Google Scholar] [CrossRef]
- Rashmi, C.; Akshaya, A.; Sruthi, B.; Lavanya, B.; Lohitha, A. Emotion Detection Model -Based Music Recommendation System. Turk. J. Comput. Math. Educ. (TURCOMAT) 2023, 14, 26–33. [Google Scholar]
- Umadevi, D.; Sowmya Singh, K. Music Recommendation Based on Emotion Detection Using Vocals and Visuals. In Proceedings of the 2nd International Conference on Cognitive and Intelligent Computing. ICCIC 2022, Hyderabad, India, 27–28 December 2023; Cognitive Science and Technology. Kumar, A., Ghinea, G., Merugu, S., Eds.; Springer: Singapore, 2023. [Google Scholar]
- Sujeesha, A.S.; Mala, J.B.; Rajan, R. Automatic Music Mood Classification Using Multi-Modal Attention Framework. Eng. Appl. Artif. Intell. 2024, 128, 107355. [Google Scholar]
- Breiman, L. Random Forests. Mach. Learn. 2001, 45, 5–32. [Google Scholar] [CrossRef]
- Chen, T.; Guestrin, C. XGBoost: A Scalable Tree Boosting System. In Proceedings of the 22nd ACM SIGKDD International Conference on Knowledge Discovery and Data Mining, San Francisco, CA, USA, 13–17 August 2016; pp. 785–794. [Google Scholar]
- Quinlan, J.R. Induction of Decision Trees. Mach. Learn. 1986, 1, 81–106. [Google Scholar] [CrossRef]
- Quinlan, J.R. C4.5: Programs for Machine Learning; Morgan Kaufmann: San Mateo, CA, USA, 1993. [Google Scholar]
- Breiman, L.; Friedman, J.H.; Olshen, R.A.; Stone, C.J. Classification and Regression Trees; Wadsworth International Publishing Company: Belmont, CA, USA, 1984. [Google Scholar]
- Cox, D.R. The Regression Analysis of Binary Sequences. J. R. Stat. Soc. Ser. B (Methodol.) 1958, 20, 215–242. [Google Scholar] [CrossRef]
- Vapnik, V.N. The Nature of Statistical Learning Theory; Springer Science & Business Media: New York, NY, USA, 1995. [Google Scholar]
- Cortes, C.; Vapnik, V. Support-Vector Networks. Mach. Learn. 1995, 20, 273–297. [Google Scholar] [CrossRef]
- Sangnark, S.; Lertwatechakul, M.; Benjangkaprasert, C. Thai Music Emotion Recognition by Linear Regression. In Proceedings of the 2018 2nd International Conference on Automation, Control and Robots (ICACR 2018), Bangkok, Thailand, 12–14 October 2018; Association for Computing Machinery: New York, NY, USA, 2018; pp. 62–66. [Google Scholar]
- Satayarak, N.; Benjangkaprasert, C. On the Study of Thai Music Emotion Recognition Based on Western Music Model. J. Phys. Conf. Ser. 2022, 2261, 012018. [Google Scholar] [CrossRef]
- Sorussa, K.; Choksuriwong, A.; Karnjanadecha, M. Emotion Classification System for Digital Music with a Cascaded Technique. ECTI-CIT Trans. 2020, 14, 53–66. [Google Scholar] [CrossRef]


Disclaimer/Publisher’s Note: The statements, opinions and data contained in all publications are solely those of the individual author(s) and contributor(s) and not of MDPI and/or the editor(s). MDPI and/or the editor(s) disclaim responsibility for any injury to people or property resulting from any ideas, methods, instructions or products referred to in the content. |
© 2025 by the authors. Published by MDPI on behalf of the International Institute of Knowledge Innovation and Invention. Licensee MDPI, Basel, Switzerland. This article is an open access article distributed under the terms and conditions of the Creative Commons Attribution (CC BY) license (https://creativecommons.org/licenses/by/4.0/).