Article

Understanding Visual Attention to Button Design Utilizing Eye-Tracking: An Experimental Investigation

by
Katharina Gleichauf
*,
Verena Wagner-Hartl
,
Gerald J. Ackner
and
Stefan Pfeffer
Department of Industrial Technologies, Campus Tuttlingen, Furtwangen University, 78532 Tuttlingen, Germany
*
Author to whom correspondence should be addressed.
Appl. Syst. Innov. 2025, 8(2), 27; https://doi.org/10.3390/asi8020027
Submission received: 11 December 2024 / Revised: 5 February 2025 / Accepted: 17 February 2025 / Published: 21 February 2025

Abstract

As graphical user interfaces continue to become more complex; it is becoming increasingly important for user interface (UI) and user experience (UX) designers to understand how design elements influence user attention. This study investigates the impact of button shape on user perception, focusing on shape preferences, attention distribution, and perceived pleasantness. To isolate the effect of shape, buttons with five different corner radii (completely angular to completely curved) were presented without contextual influences in a pairwise comparison. The research combined eye-tracking technology with digital questionnaires to collect both objective and subjective data. The results obtained revealed a preference for buttons with moderate corner radii, while buttons with completely angular corners received the least attention and were the least favored. Notably, discrepancies emerged between subjective preferences and objective attention rankings, particularly for wireframe buttons. This research demonstrates the effectiveness of eye-tracking in UI/UX design studies and provides valuable insights into the relationship between attention and preference for abstract design elements. The findings offer fundamental theory for creating more intuitive and effective graphical user interfaces, while also highlighting the limitation and importance of examining design elements within relevant contexts in future studies.

1. Introduction

The number and importance of graphical user interfaces (GUIs) and, thus, user interface (UI) and user experience (UX) design is constantly increasing [1,2]. GUI is defined as the graphical user interface between a human and a machine [3]. It facilitates the operation of interfaces using graphical elements [4]. These include, for example, images, symbols, and color. The aim when designing such GUIs is to make them as usable as possible. Usability is defined as the “Extent to which a system, product or service can be used by specific users in a specific context of use to achieve specific goals effectively, efficiently and satisfactorily.” [5] (p. 9).
As computer technology continues to advance, the range of information that can be displayed in a graphical user interface has expanded, becoming increasingly functional and informative [6]. This presents a challenge for designers, as enriched layouts may lead to overly complicated interfaces, potentially overwhelming users due to the limitations of human attention and cognitive resources [6,7,8]. One potential solution to this issue is to strategically direct users’ attention by manipulating specific design elements [2]. In this context, visual attention and salience are of great importance. The term “design elements”, as used in this work, refers to the fundamental components employed in the development of designs [9]. These components include, but are not limited to, lines, shapes, and colors. Attention is understood as a cognitive process through which individuals select certain information while ignoring other information [10]. The capacity for selective attention enables individuals to prioritize or disregard specific aspects or stimuli [11]. Visual attention can be effectively directed through the application of visual salience [12]. A stimulus is considered visually salient if it stands out in a particular context [13]. The salience of design elements plays a crucial role in emphasizing features within a GUI and guiding users’ focus toward important areas [14,15,16,17]. For example, according to a study by Ebert et al. [18], the visual design of a warning should receive at least as much consideration as the informational content it conveys. Especially for warnings, the research suggests highly visually salient warnings are more likely to be noticed by individuals.
Limitations in human attention can occur particularly when spatial or temporal mechanisms of selective attention are overloaded [19]. For instance, an excess of visual stimuli in a given space has been demonstrated to impede the effective processing of information [20]. In the context of visual search tasks, performance metrics demonstrate a decline when the number of objects is increased or when the objects move more rapidly [21]. This phenomenon suggests inherent limitations in our cognitive ability to track multiple objects concurrently. This raises concerns in both academia and industry, as many catastrophic accidents happen due to inattention [22,23]. It is therefore important to understand the limitations of attention. Processing limitations include, for example, inattentional blindness and change blindness [19]. Inattentional blindness refers to the failure to perceive an object or event in the field of view because the attention of an individual is focused on something else [24]. A perceptual error is said to be the result of a lack of attention to an unexpected element [25]. This is particularly the case if the element does not appear relevant to the current task or if the current task is associated with a high degree of task commitment [23,26]. Change blindness is the phenomenon of not perceiving change in the environment, as the focus of attention is often not on the changing part of the corresponding area [19,27]. Change blindness suggests that the content of the representations in a person’s short-term memory is heavily dependent on selective attention [27]. These phenomena have already been observed in various settings [27,28,29,30]. According to Davies and Beeharee [31], change blindness and inattentional blindness have been observed in the context of mobile device usage. Their findings indicate that the identification of newly inserted objects is consistently higher than that of changes made to existing objects on a screen. These phenomena have already been observed in various settings.
The human visual system is tasked with processing a vast array of information, and its performance is shaped not only by attentional constraints but also by various cognitive biases [32]. A distinction is made here between the attentional bias, selective bias, and salience bias. With the attentional bias, a person tends to focus their attention more strongly on certain stimuli than on others [33]. The perception and interpretation of information can be influenced by previous experiences, emotions, and beliefs [34]. Sequential bias is also referred to as the sequence effect, where decisions are always influenced by previous decisions or experiences [35]. These are sometimes difficult to recognize and eliminate [36]. This is particularly important during study implementations. The salience bias refers to the tendency of people to give more attention to information that is more salient or conspicuous than less salient information [37]. Companies such as Apple Inc. use the salience bias, for example, for the customer experience in their stores and on their website [14].
As users allocate a reduced amount of attentional resources to different elements within a more complex design, it is of advantage to gather information regarding the attention allocated toward individual elements [38,39]. Eye tracking serves as a valuable method for obtaining such data [40,41,42,43,44]. In the context of GUI design, search tasks are particularly pertinent [32]. During the process of searching for information within an interface, users’ eye movements provide objective indicators of attention distribution and information processing [45]. Key metrics in eye tracking include fixation duration, which is defined as the time the eyes remain fixated on a specific target [46]. Fixation duration is regarded as an implicit measure of visual attention. Another important eye tracking metric is the area of interest (AOI) attention ratio, which is defined as the proportion of time an individual spends looking at a designated area of interest during a task relative to the total time spent on the task [47]. Consequently, the AOI attention ratio can be utilized to ascertain which areas of a user interface garner the most attention from users [48]. Given that such data offers reliable insights into how individuals distribute their attention, it finds applications across various research domains, including the automotive industry [49,50]. Furthermore, this information is crucial for the future design of graphical user interfaces [51].
The salience of design elements, such as color, has already been investigated in several research studies [2,52,53,54], with one study also demonstrating that salient stimuli attract more attention than others [55]. According to Heimann and Schuetz [56], when observing a scene or image, people’s eyes naturally linger on and repeatedly return to the parts that contain the most relevant or meaningful information from their perspective. Previous work [57,58,59] has already shown that people look longer at stimuli that they subsequently select. Additionally, preference is reflected in allocated attention [56,58,60,61].
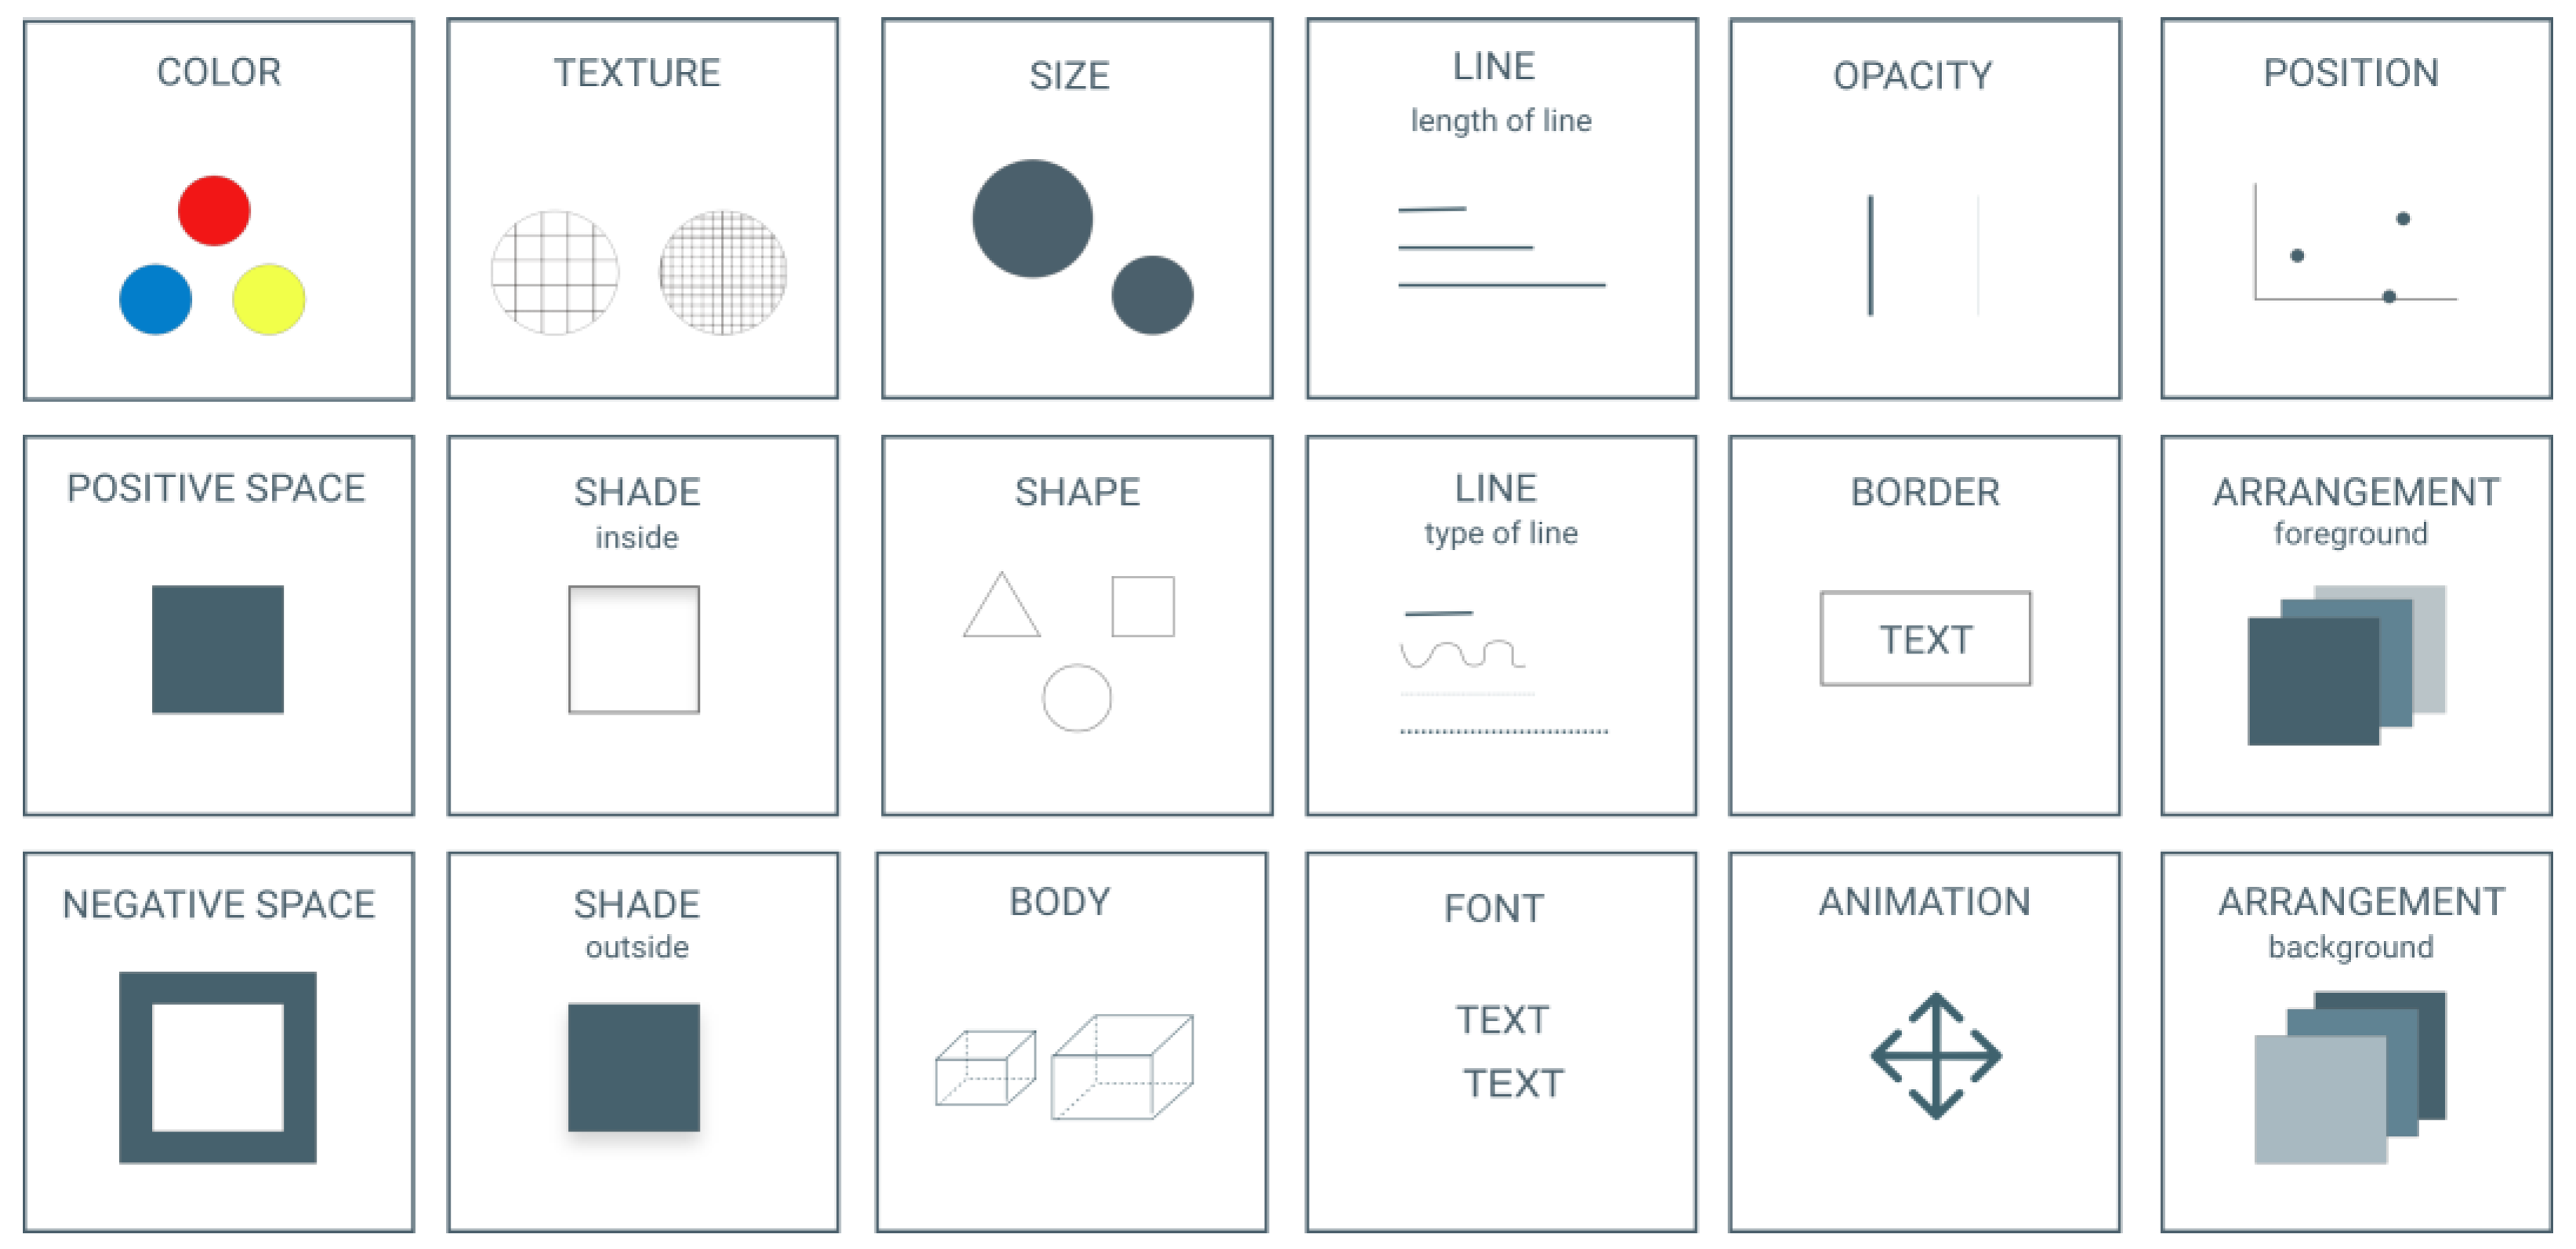
This study was preceded by an comprehensive examination of the topic based on the principle of the design thinking process [62]. Prior to the experimental study, four expert interviews were conducted with professionals in the field of user experience and user interface design. These interviews provided valuable insight into the limitations, challenges and methodologies associated with GUI design. Subsequently, it was considered relevant to define manipulable design elements within a GUI to provide a corresponding overview. In this process, 16 distinct design elements were identified as illustrated in Figure 1. There is already a lot of research on color and its impact in different contexts [46,52,54,63,64]. Among the presented elements in Figure 1, the design element “shape” in the form of a button was selected as a systematically manipulable design feature. This was because buttons are relevant to user interface and user experience design because they are utilized in various contexts and frequently in conjunction with GUIs. A subjective evaluation of buttons has already been made in a study by Becker et al. [65].
This study investigates the relationship between button shape and user perception, isolated from contextual influences. By analyzing shape preferences, attention distribution, and perceived pleasantness, the research aims to translate visual perception theory into practical UI design recommendations. The study bridges psychological principles and user interface design, providing evidence-based insights into fundamental aspects of visual perception. The goal is to support designers by developing more intuitive and effective design recommendations for graphical user interfaces.
The three research questions were:
RQ1: What shape of button do subjects prefer in a pairwise comparison?
RQ2: Is the objective attention distribution reflected in the subjective preference?
RQ3: Which of the presented buttons do subjects find most pleasant?

2. Materials and Methods

2.1. Particpants

The study was conducted with a total of 20 participants. The prerequisite for participation was to be at least 18 years old. No additional requirements or preconditions were necessary for this study. Participation in the study was voluntary and took place without any compensation. All participants provided their informed consent. Participants were recruited at Furtwangen University in Tuttlingen. The final sample consisted of ten (50%) male participants and ten (50%) female participants. The age of the participants was between 22 and 72 years (M = 31.90, SD = 13.39). Due to missing values, the eye-tracking data from 4 of the 20 participants had to be excluded.

2.2. Study Design

Various forms (IV1) of buttons were considered in this study. The different forms of buttons are shown in Table 1. The buttons are presented in 5 variations regarding their corner radii and in two different colors (IV2). The corner radii were incrementally increased through 5 steps, with each radius advancing in 6-unit intervals spanning 0 to 24. The colors used are black and white (BW), as known from a wireframe, and blue. In wireframes highly simplified visual components are common as they are used in the early stages of a user interface design [66]. The blue color was chosen because there was no disturbance by a brighter color intended and blue is associated with calm and relaxation [64]. Blue is also listed as the most preferred color this preference tendency is also shown in the context of display items [65,67].
In line with the logic of pairwise comparisons, the five shape variations are compared individually for each color. The dependent variables (DVs) for the pairwise comparisons include the distribution of attention, measured through the AOI attention ratio data, and subjective preference. Additionally, participants rank the buttons directly based on their preferences using a questionnaire, where the dependent variable is the perceived pleasantness.

2.3. Materials and Method

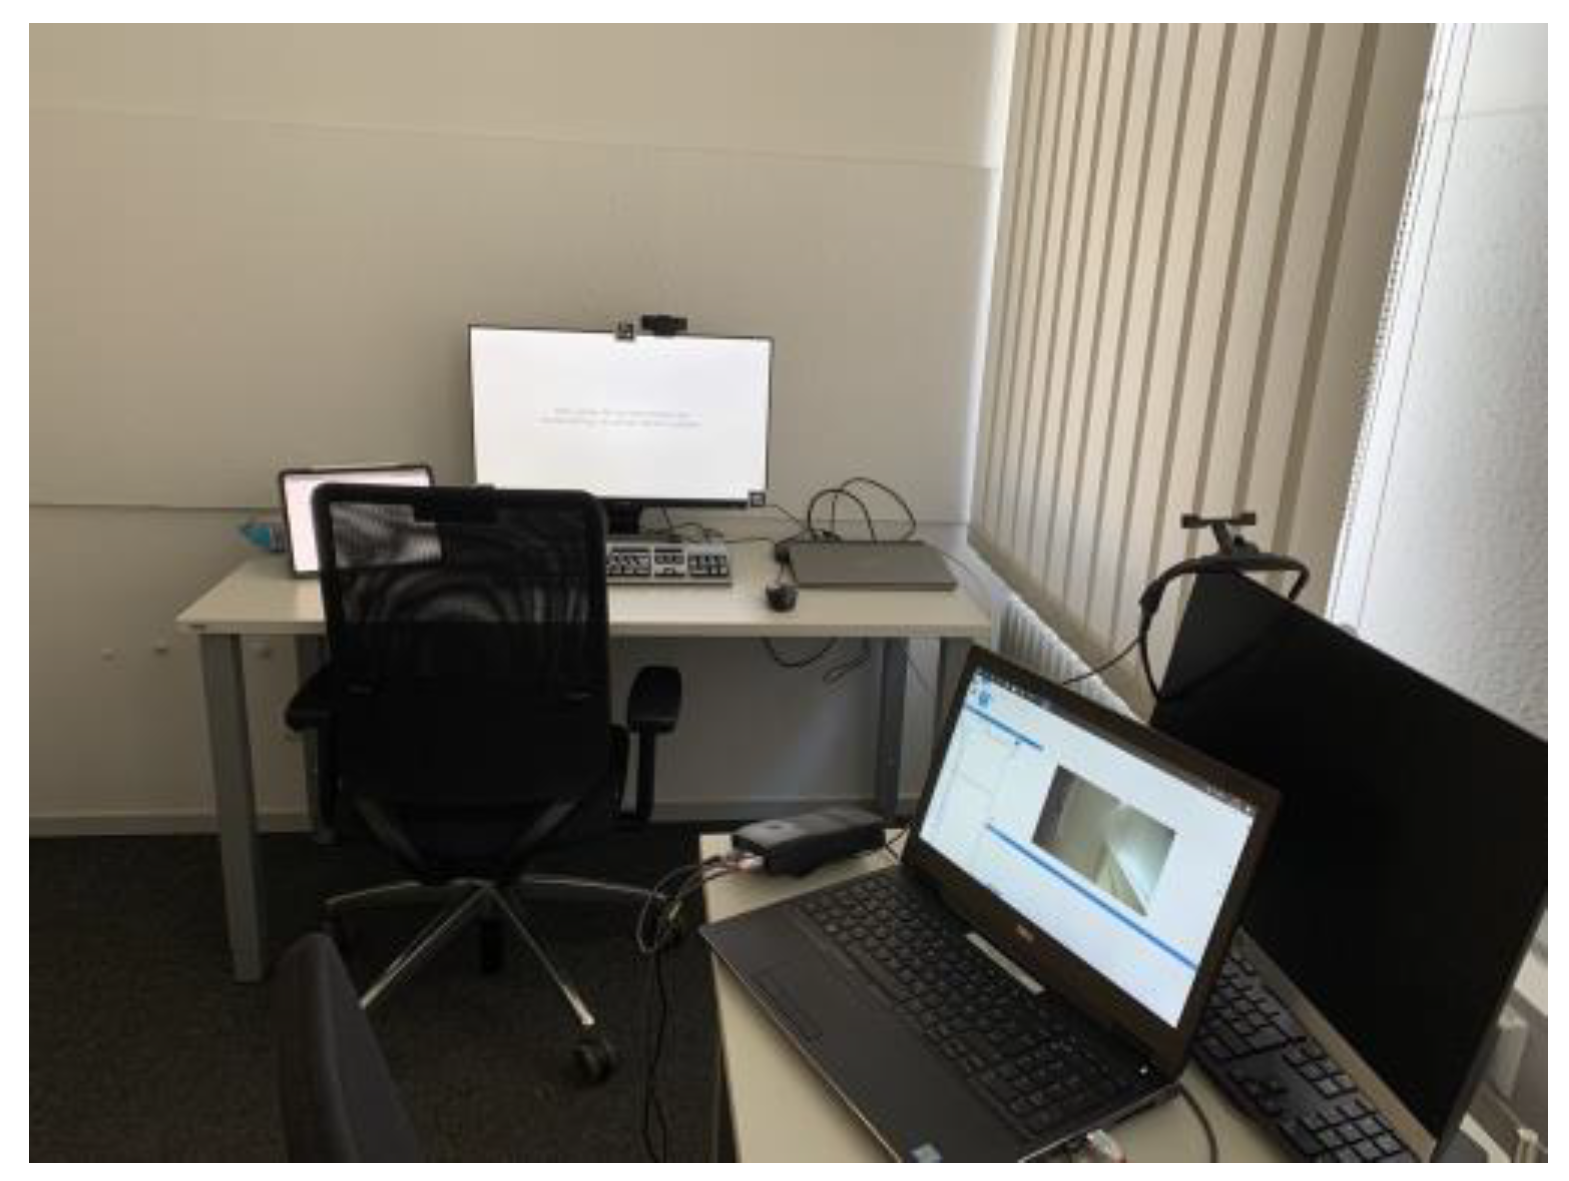
To collect the demographic and subjective data, a questionnaire was created using the questionnaire software Unipark Tivian XI GmbH [68]. The questionnaire was also used to structure the course of the study. This ensured that the study was conducted in a standardized manner. Figure 2 shows the hardware components from the study management perspective. The presentation of the questionnaire was on an Apple iPad Pro 12.9. Participants were sitting in front of a computer monitor. The iPad was placed to their left and used via the built-in touchscreen. The data resulting from the questionnaire was analyzed using the software IBM SPSS Statistics Version 29. In the main part of the study, the participants were equipped with an eye tracker. For the eye-tracking, Dikablis Glasses 3 from the company Ergoneers (Egling, Germany) were used [69]. A series of data was recorded using the eye tracker. The most significant parameter for this evaluation was the area of interest (AOI) attention ratio. The AOI attention ratio in eye tracking is a metric that quantifies the amount of visual attention a specific region of interest receives relative to the total attention given to the entire visual stimulus [40,48]. It is typically expressed as a percentage. The data collected by the eye tracker was recorded, stored, processed and analyzed using the DLab software 3.0 Manual [47]. The data resulting from DLab was then further processed in Microsoft Excel and R. The multiple paired comparison test method was used in conjunction with the eye-tracking [70,71]. There were always two buttons presented at the same time. These two buttons on each presentation were designated as the two AOIs. The participants’ task was to compare the pair of buttons and select the preferred element from the pair (forced choice). It was not possible for participants to abstain. This process was repeated for all possible pairs of buttons. In order to rule out a reading direction effect the pairs were also presented mirrored. A total of 25 pairs of buttons were evaluated per button category. In total, the participants had to choose between 50 pairs of buttons. The pairwise comparison was presented with the help of a 27” BenQ EW2780 LED monitor and implemented using the PsychoPy software version 2021.2.3 [72]. PsychoPy is a library for the Python programming language that offers tools for reliable study control and automatic logging of important time points and inputs made by the study participants. In the context of this study, the choice between the presented buttons could be saved directly through the input in PsychoPy. With the help of a trigger program by Birkle et al. [73], direct communication between PsychoPy and the DLab eye-tracking software was achieved via an Ethernet connection. This made it possible to trigger special PsychoPy triggers in DLab based on the information displayed by PsychoPy. As a result, the randomized representations of the buttons and the inputs from the pairwise comparison were reliable and traceable in real time.

2.4. Study Procedure and Implementation

At the beginning of the study, a general introduction to the purpose and procedure of the study was given. Participants were then asked to read the consent form thoroughly and sign it. After further open questions, if any, were clarified, the demographic data were requested from the participants using the questionnaire on the iPad. Subsequent to the completion of the questionnaire, the eye tracker was configured and calibrated prior to the commencement of the eye-tracking study. Initially, several test runs were conducted. During the actual eye-tracking study, pairs of wireframe buttons were first presented, followed by blue buttons in the second part of the study. The pairwise comparison procedure in the eye-tracking study using the example of the blue buttons is shown in Figure 3.
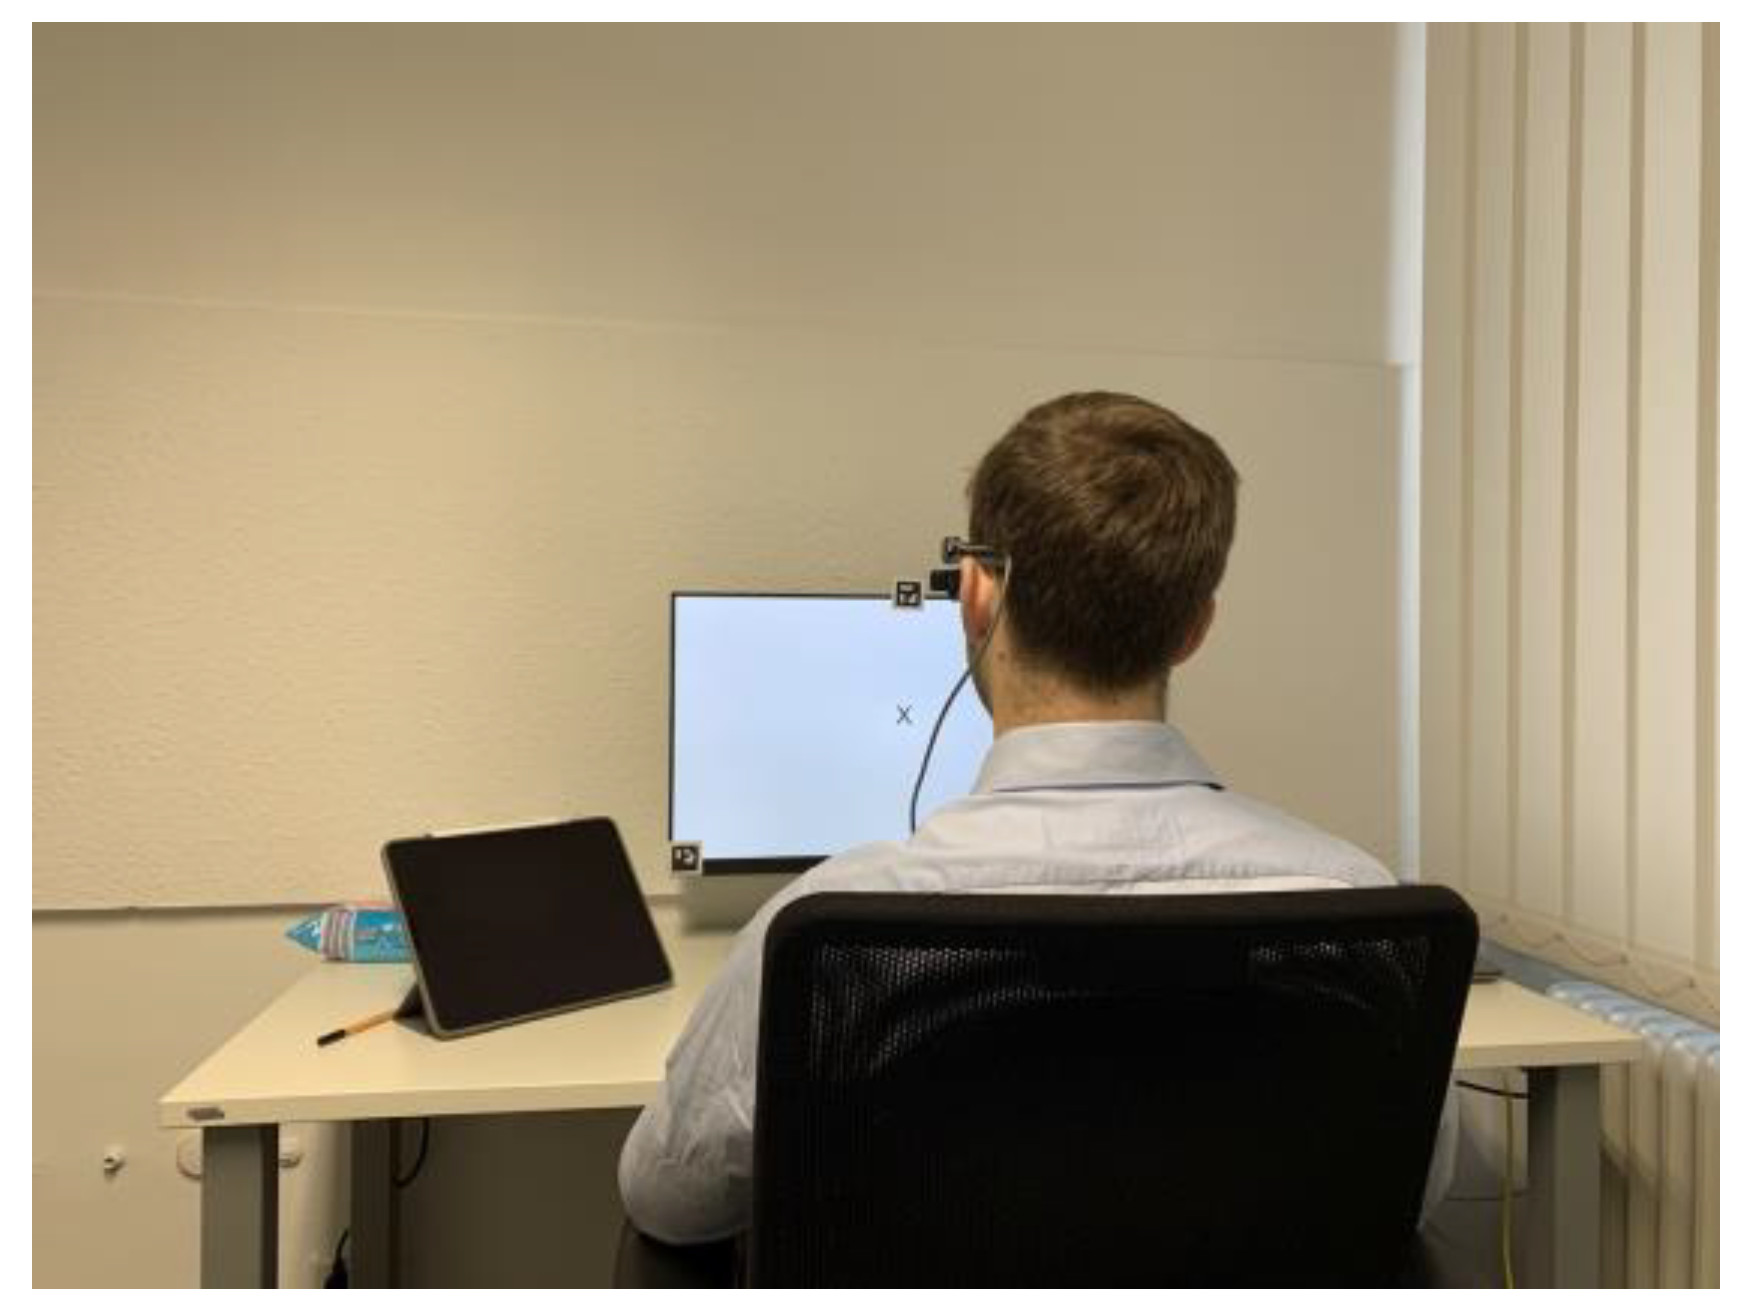
In the experimental phase of the study, study participants were instructed to focus on the fixation “X” for a duration of 10 s. Figure 4 shows a participant at this stage of the study. Subsequently, a randomized pair of buttons was presented for a duration of five seconds. The study participants then had the task to look at the button pairs while they were visible. After five seconds, the buttons disappeared, and the study participants were asked to select the button they preferred. The participants were not informed about the specific context that their preferences should be based on. The text displayed in Figure 3 was presented during the selection phase.
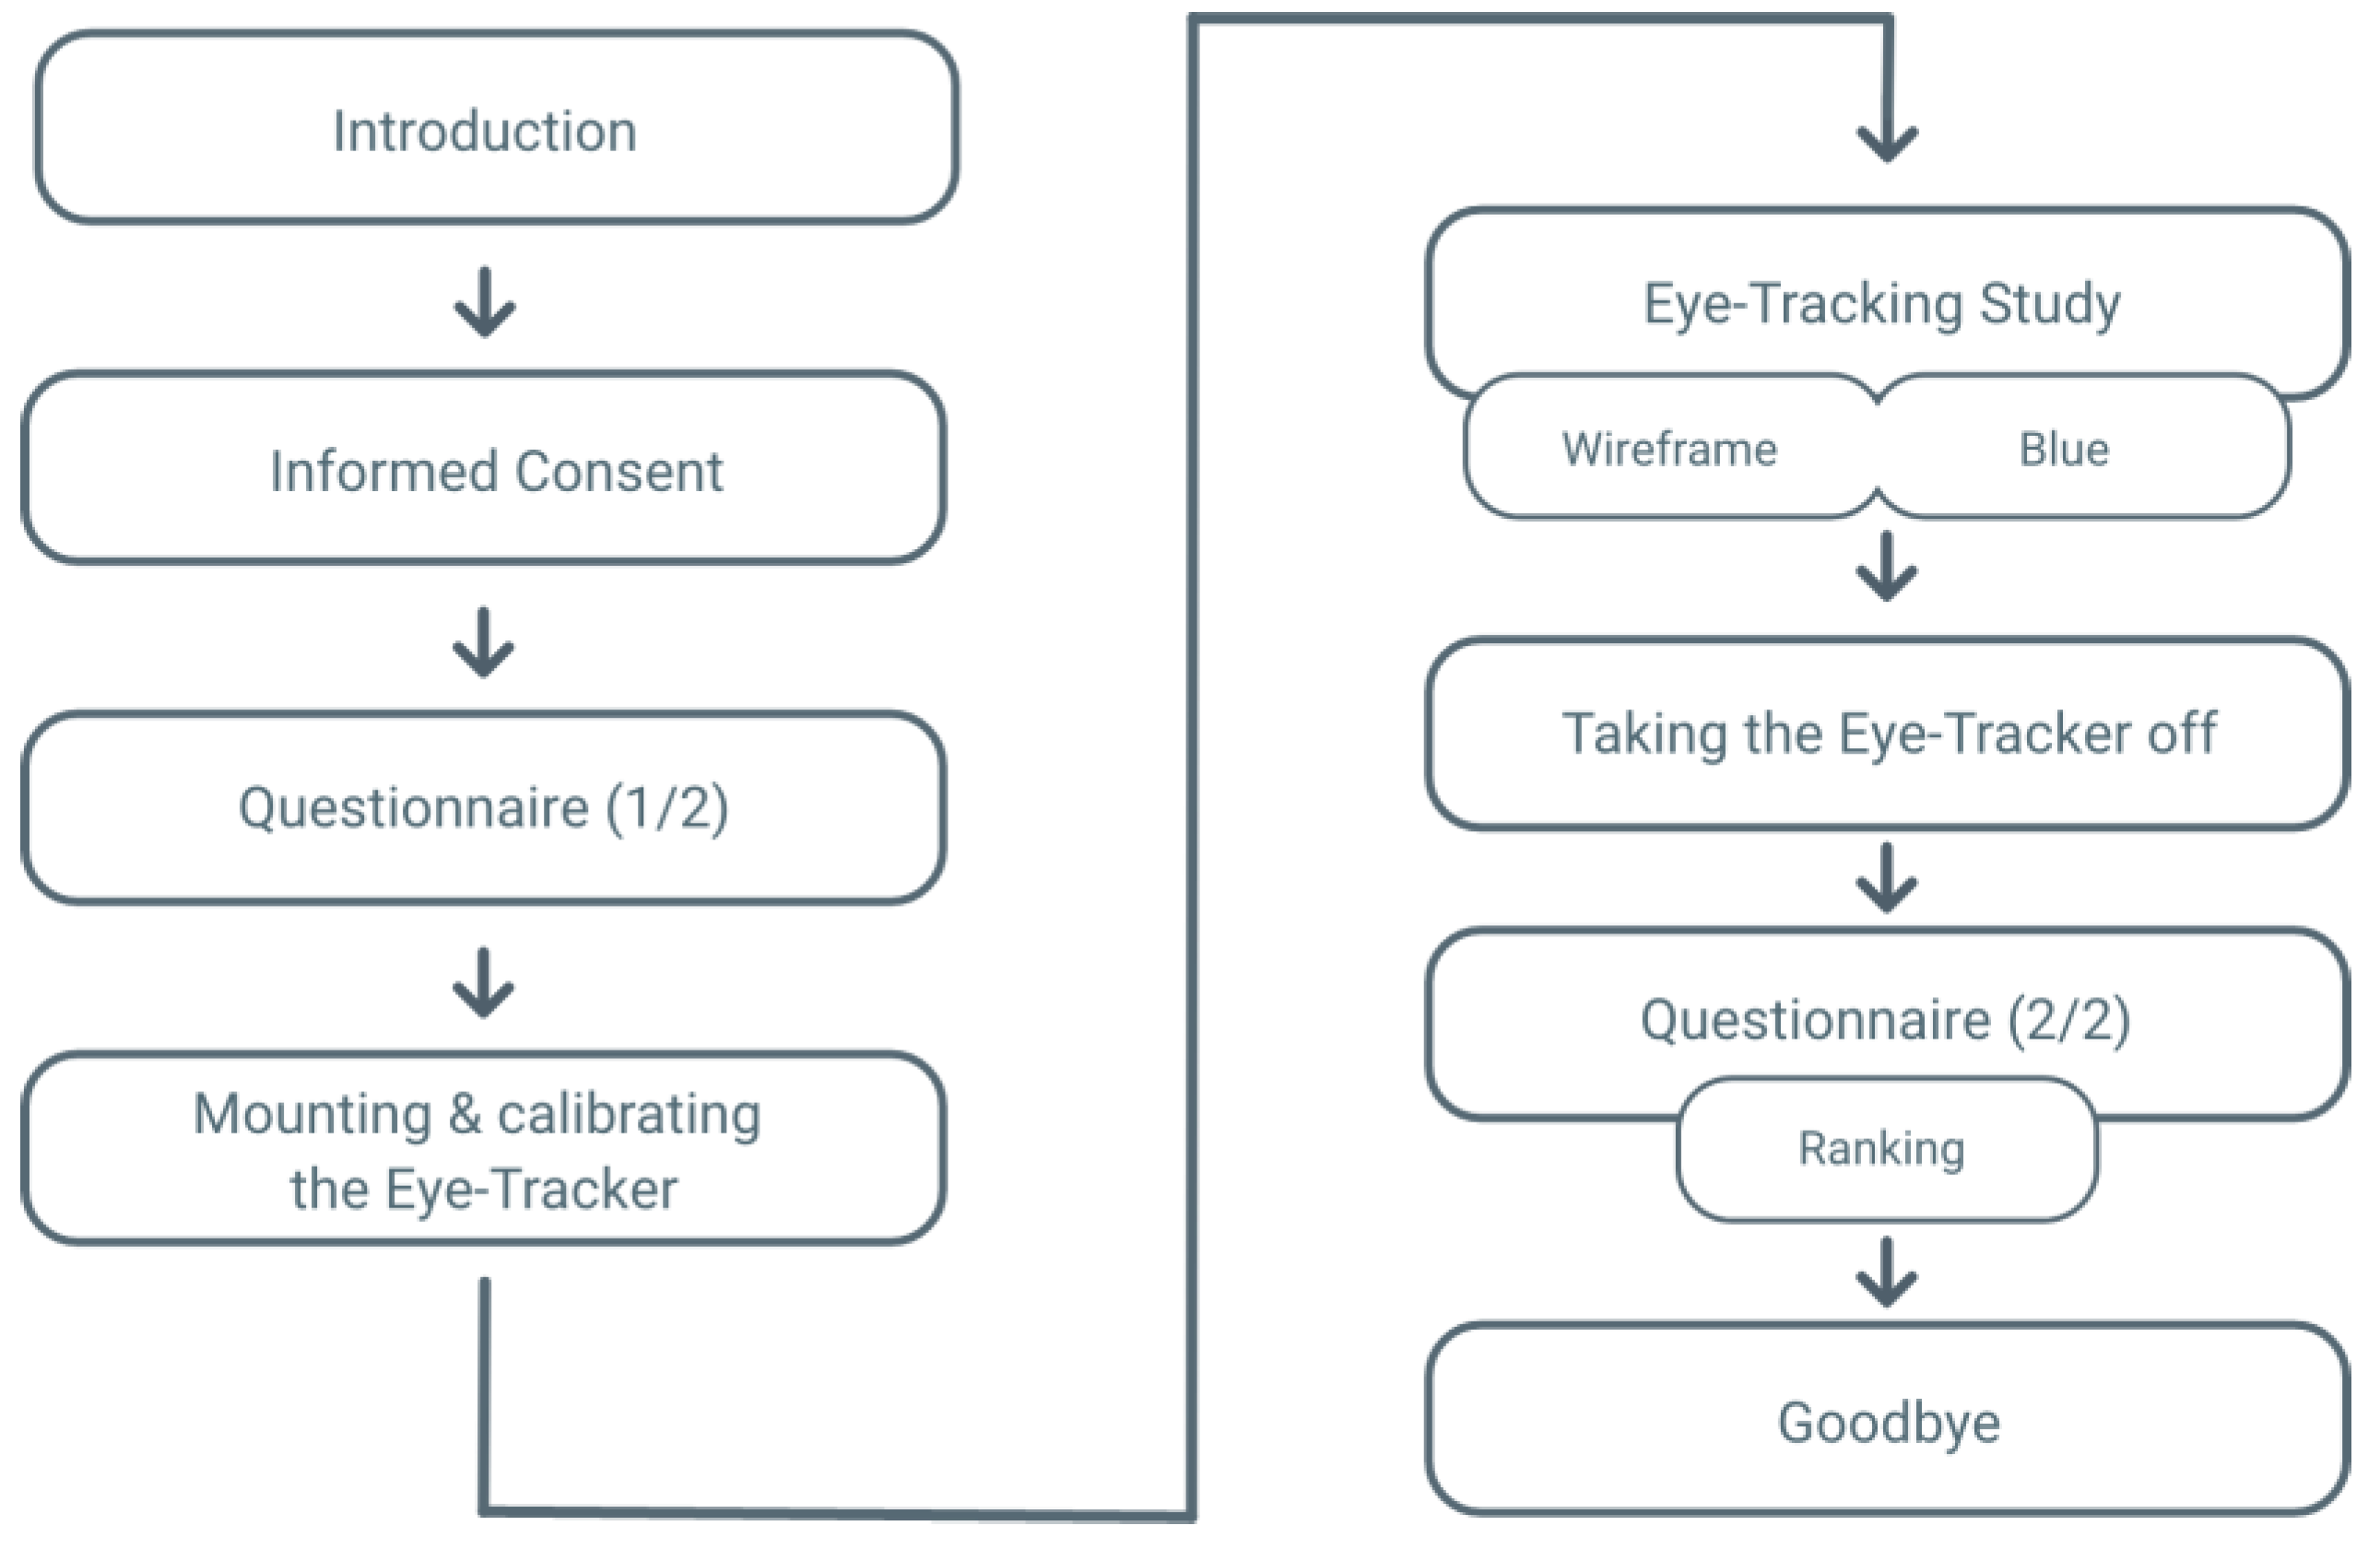
Following the completion of the comparative analysis, the eye-tracker was withdrawn from the study participants, and the second section of the questionnaire was initiated. In this section, the buttons with varying corner radii were to be arranged according to their perceived pleasantness. The presentation of these buttons in the questionnaire was also subjected to randomization, a process that applied to both the wireframe buttons and the blue buttons. Subsequently, the study participants were granted the opportunity to pose open-ended inquiries prior to their dismissal. The course of the study can be seen in Figure 5.

3. Results

The Bradley–Terry model (BT model) was selected for the evaluation of the pairwise comparisons [70,74]. The model predicts the probability of one item winning in a pairwise comparison based on assigned strength parameters. It is based on the assumption that the probability of one item winning over another item in a pairwise comparison is proportional to the ability parameter of the two items. These ability parameters represent the relative strengths of the items being compared. A higher ability parameter for an item indicates a greater likelihood of that item being preferred or winning in pairwise comparisons. The model can, therefore, be used to estimate the relative strengths of the items that are compared and to rank them accordingly. The statistical computing environment R [75] was used for the evaluation. There the “BradleyTerry2” package for calculating corresponding estimates was used [76]. In the following chapters, the results obtained from the eye-tracking data are presented as objective rankings and those from the pairwise comparison with forced selection as subjective rankings. In addition, the resulting frequency tables from the rankings are shown in the questionnaire.

3.1. Eye-Tracking Results of the Pairwise Comparison

The eye-tracking data set contains data from 16 of the 20 study participants. The data are used to determine the objective ranks of the wireframe buttons. The respective winners/losers in the pairwise comparisons were determined via the AOI Attention Ratio in percent. The button with a higher percentage is considered the winner. The results of the wireframe buttons are shown first, followed by those of the blue buttons.

3.1.1. Results of the Wireframe Button

The observed frequencies of the wins and losses of the different wireframe buttons (see Buttons BW) in a pair comparison are shown in Table 2. Table 2 shows that the third version (V3) won the most pairwise comparisons (78 out of a total of 320; see the last column of the sum of wins). This is followed by the fourth version (V4; 76 out of 320), the second version (V2; 65 out of 320), and the fifth version (V5; 57 out of 320). The first version (V1) resulted in the fewest wins (44 out of 320).
After determining the frequencies, the simple Bradley–Terry model was estimated. The estimation of the pair comparison data via generalized linear models provides the effects from the individual pair comparisons of the five button versions. Similarly, the percentage of glances at the AOIs provides a clear ranking. The estimators for the item parameters and the ranks assigned to the wireframe button versions are shown in Table 3.
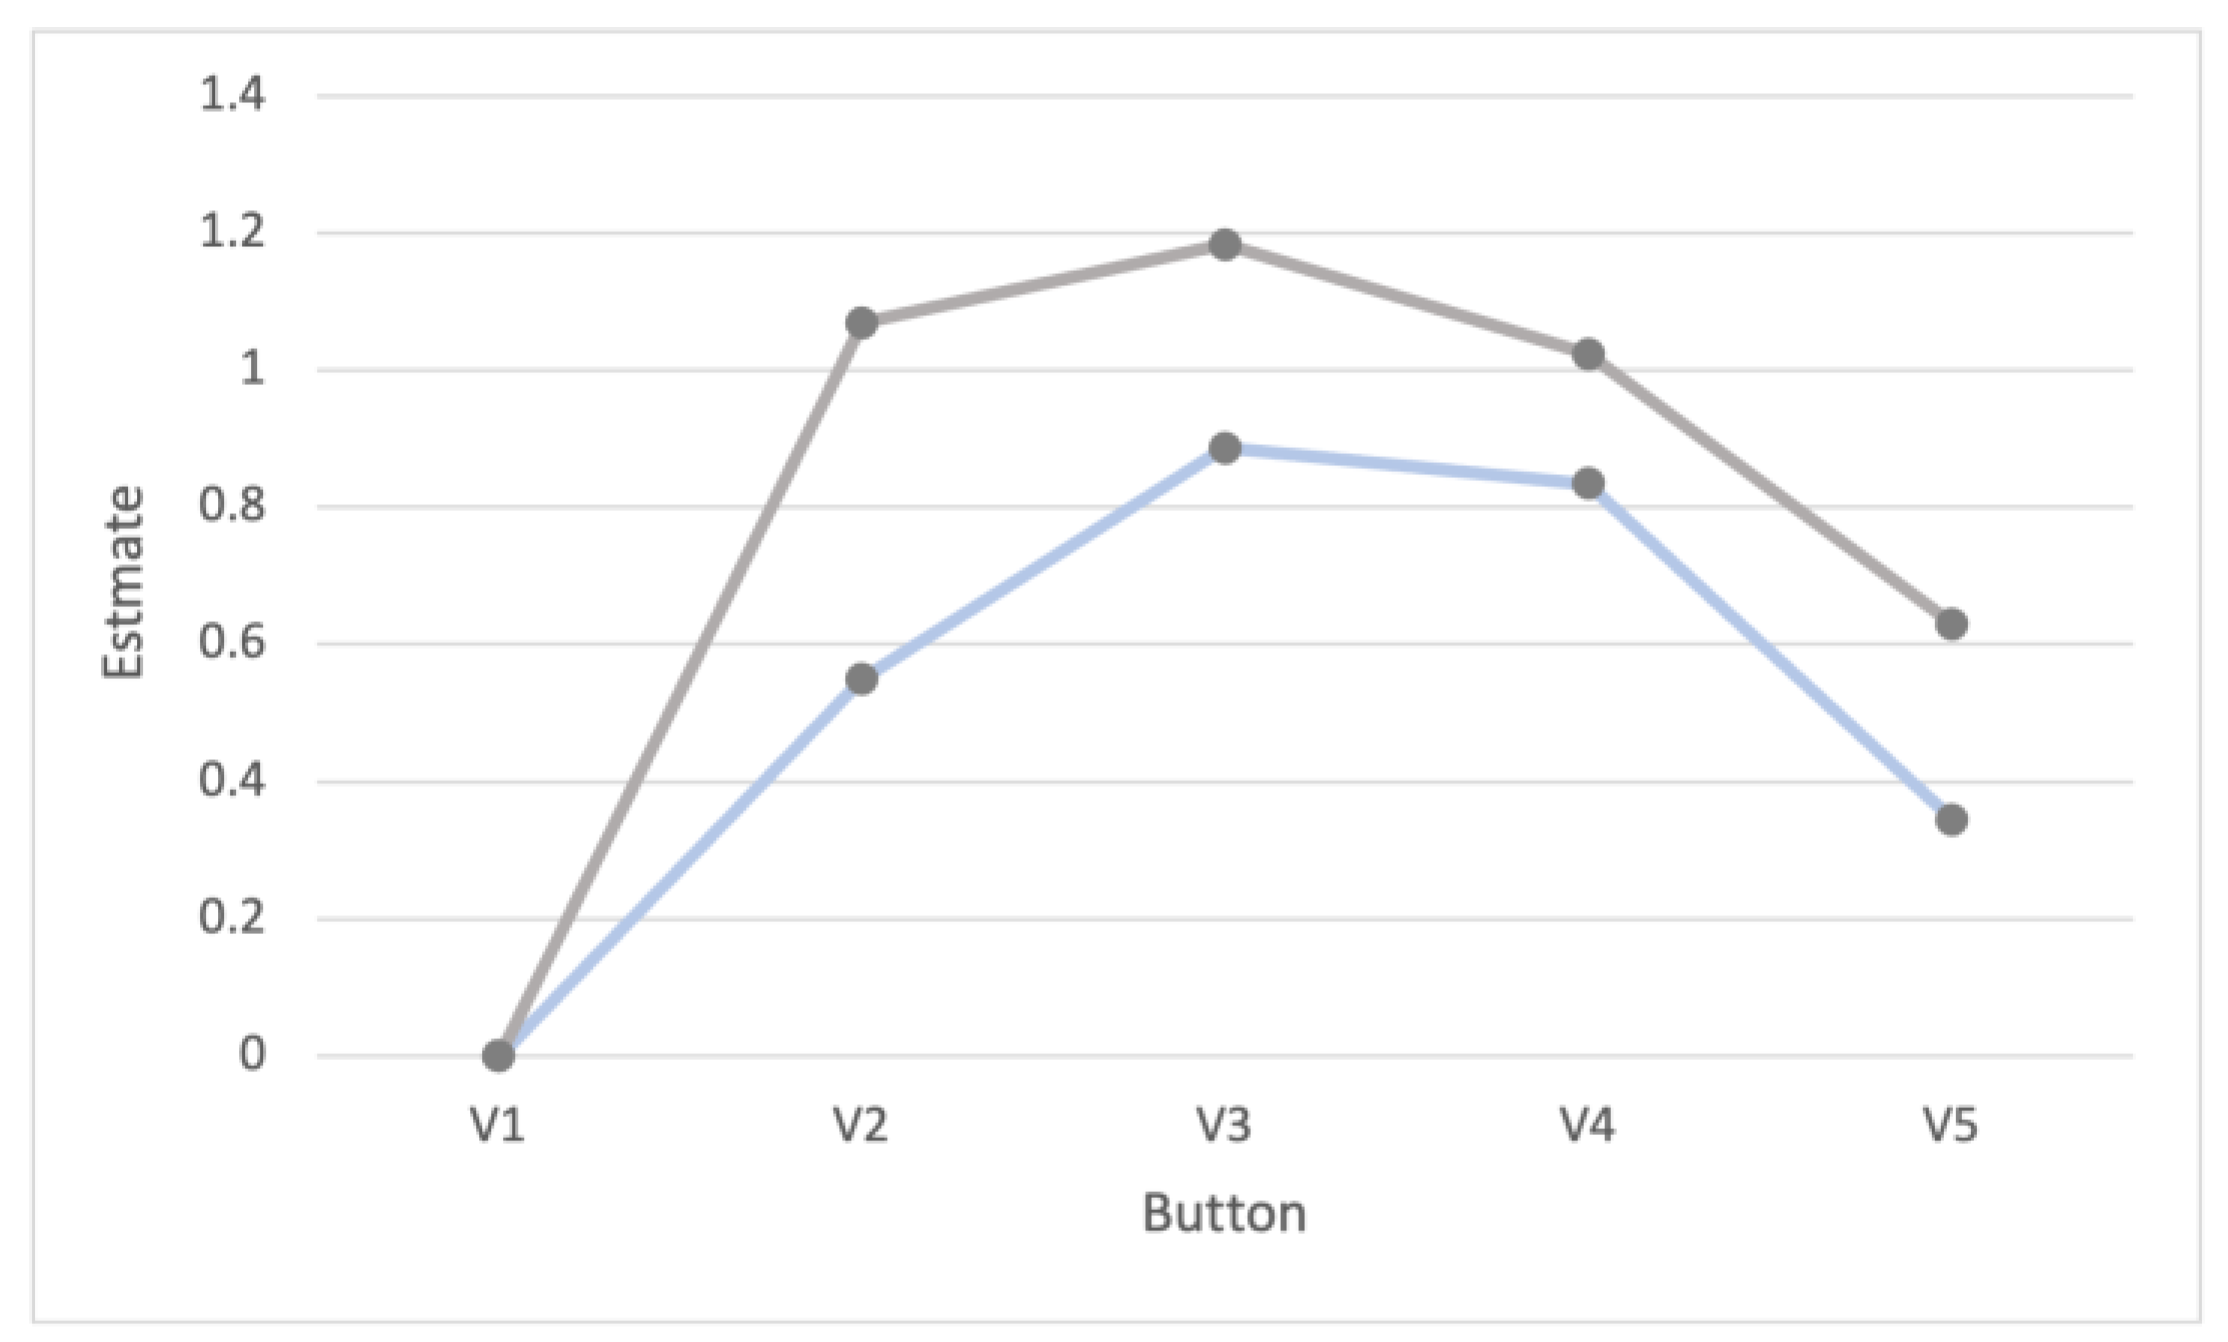
The parameter for the first button version (V1) was set to zero in this case and therefore acts as a reference object. Based on the coefficient estimators, the study participants most frequently preferred the third button version (V3). The fourth button version (V4) is in second place, followed by the second (V2) and fifth (V5) button versions. In last place was the most angular and therefore first button version (V1). For visualization, a graphical representation of the coefficient estimators is shown with the gray line in Figure 6. The first button version (V1) also represents the reference object.

3.1.2. Results of the Blue Buttons

The observed frequencies of the winners and losers of the blue button versions in the pair comparison are shown in Table 4. In the last column, the sum of the wins shows that the third version (V3) won the most pair comparisons (79 out of a total of 320). This is followed in order by the second version (V2; 75 out of 320), the fourth version (V4; 73 out of 320), and the fifth version (V5; 58 out of 320). The first version (V1) resulted in the fewest wins (35 out of 320).
Subsequently, the simple Bradley–Terry model was estimated again. The estimators for the parameters of the items and the ranks assigned to the button versions are shown in Table 5.
The parameter for the first button version (V1) was also set to zero in this case and therefore acts as a reference object. Based on the coefficient estimators, the study participants most frequently preferred the third button version (V3). In second place was the second button version (V2), followed by the fourth (V4) and fifth (V5) button versions. In last place, the most angular and therefore first button version (V1) can be found. The blue line in Figure 6 also shows a graphical representation of the coefficient estimators for the blue buttons. As mentioned before, the first button version (V1) represents the reference object.

3.2. Results of the Pairwise Comparison with Forced-Choice

The data set of the pairwise comparison with forced choice contains the data of 20 study participants. The data are used to determine a subjective ranking of button versions (BW buttons; blue buttons). The respective winners/losers in the pair comparison were determined with the help of the data resulting from PsychoPy. The button that was marked as preferred in the pairwise comparison was considered the winner. Which of the button versions were preferred was determined. The following section presents the results in two parts with the results of the wireframe buttons (BW buttons) presented first, and those of the blue buttons (blue buttons) presented subsequently.

3.2.1. Results of the Wireframe Buttons

The observed frequencies of the winners and losers of the wireframe button versions (Buttons BW) in the pair comparison are shown in Table 6. In Table 6, the sum of the wins in the last column shows that the fourth version (V4) was preferred in most pairwise comparisons (115 out of a total of 400). This is followed in order by the third version (V3; 114 out of 400), the fifth version (V5; 91 out of 400) and the second version (V2; 75 out of 400). The first version (V1) shows the fewest gains (5 out of 400).
After the frequencies were presented, the simple Bradley–Terry model was estimated. The estimators for the parameters of the items and the ranks assigned to the button versions are shown in Table 7.
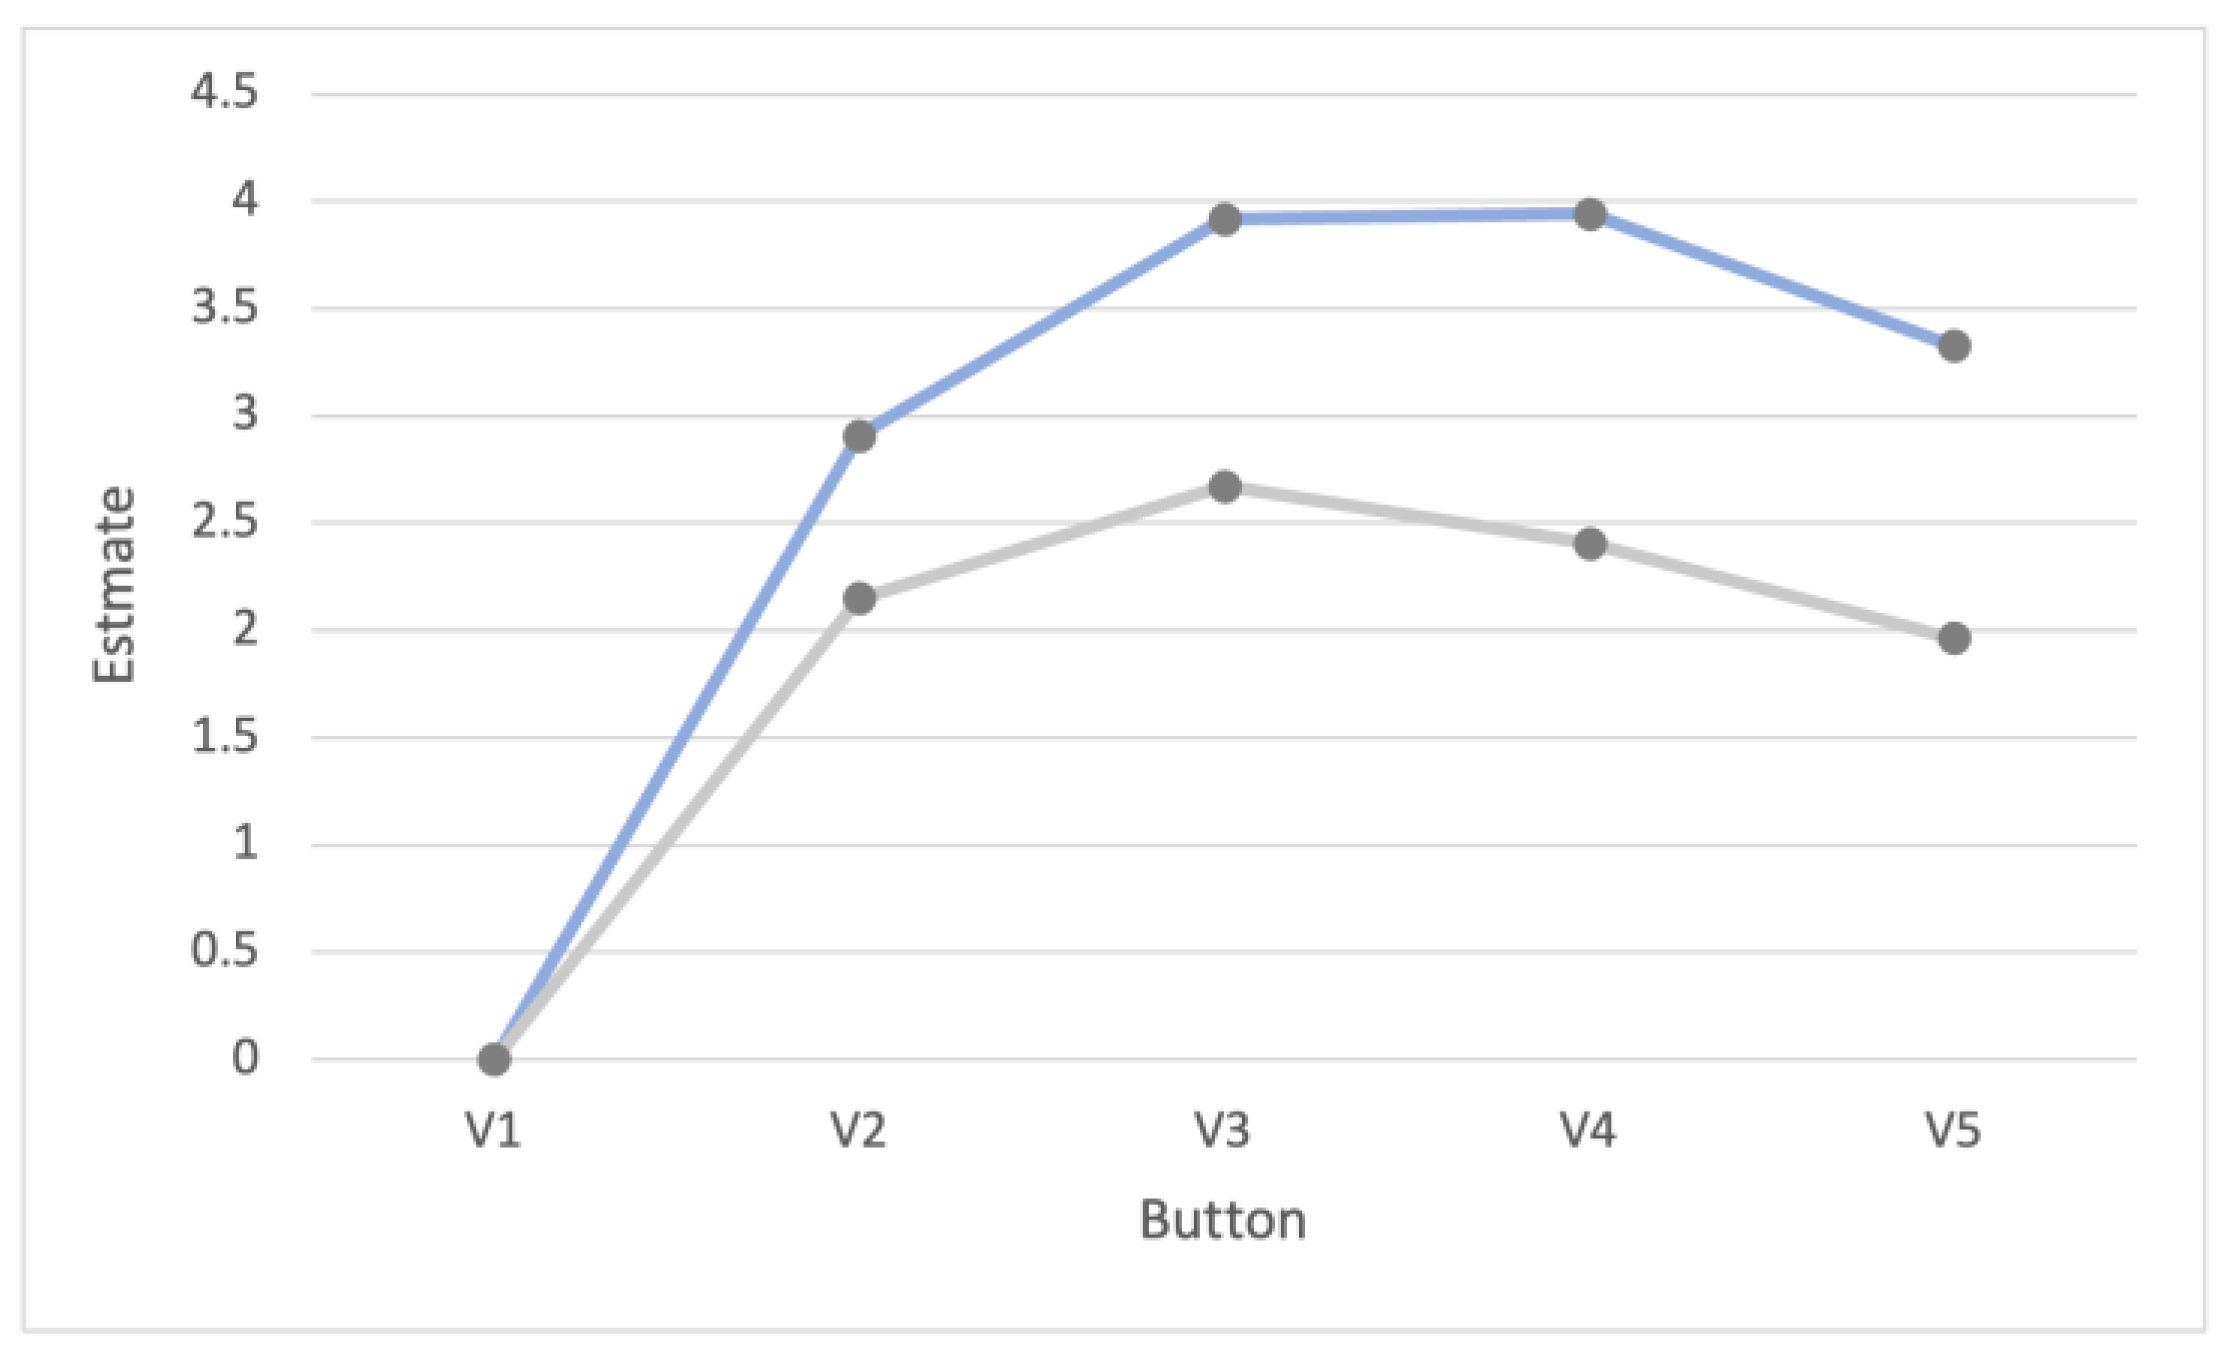
The parameter for the first button version (V1) was also set to zero in this case and thus functions again as a reference object. Based on the coefficient estimators (see Table 8), the study participants most frequently preferred the fourth button version (V4). In second place was the third button version (V3), followed by the fifth (V5) and the second (V2) button version. In last place, the most angular and therefore first button version (V1) can be found. For visualization, a graphical representation of the coefficient estimators is shown with the gray line in Figure 7. The first button version (V1) represents the reference object.

3.2.2. Results of the Blue Buttons

The observed frequencies of the winners and losers of the blue button versions (blue buttons) in the pair comparison are shown in Table 8. Here, the sum of the wins in the last column shows that the third version (V3) was preferred in most pair comparisons (112 out of a total of 400). This is followed in order by the fourth version (V4; 101 out of 400), the second version (V2; 90 out of 400), and the fifth version (V5; 82 out of 400). The first version (V1) shows the fewest gains (15 out of 400).
The simple Bradley–Terry model was estimated again. The estimators for the parameters of the items and the ranks assigned to the button versions are shown in Table 9.
Again, the parameter for the first button version (V1) was set to zero (reference object). Based on the coefficient estimators, the study participants most frequently preferred the third button version (V3). In second place was the second button version (V2), followed by the fourth (V4) and fifth (V5) button versions. The most angular and therefore first button version (V1) can be found in the last place. The blue line in Figure 7 also shows a graphical representation of the coefficient estimators for the blue buttons. The first button version (V1) represents the reference object.

3.3. Comparison of the Ranks

An overview of the ranks of the various buttons resulting from the subjective and objective data in the pair comparison of the presence study is shown in Table 10. The table shows that the ranking of the wireframe buttons resulting from the objective data differs from that resulting from the subjective data. Only the fully square button is in the same position in both rankings. The first and second ranks as well as the third and fourth ranks are swapped in their respective positions. However, the ranking of the blue buttons resulting from the objective data and the ranking resulting from the subjective data do not differ. In both rankings, the ranks for the individual button versions are the same. The rankings of the wireframe buttons and the blue buttons resulting from the objective data differ in the third and fourth rankings. There, the ranks of V2 and V4 are reversed. For the wireframe buttons, V4 is in second place. V2 is in second place for the buttons. The rankings of the wireframe buttons and the blue buttons resulting from the subjective data also differ. Only V1 is in fifth place in both rankings. All other ranks of the button versions are not the same as those of the wireframe buttons.

3.4. Results of the Ranking Assignment in the Questionnaire of the Study

Frequency tables were created to evaluate the ranks of the button versions assigned in the questionnaire. The frequency table for the ranks of the wireframe buttons can be seen in Table 11. The results show that the first button version (V1), which represents the fully square button version, was most frequently assigned to the fifth rank. V1 was never assigned to the first or second rank. No clear allocation can be seen for all other ranks, but it should be mentioned that V3 was never assigned to the fourth or fifth rank and V2 was also never assigned to the fifth rank.
The frequency tables for the ranks of the blue buttons are shown in Table 12. Here, again, you can see that the first button (V1) version was most frequently assigned the fifth rank. V1 was never assigned the first or second rank. No clear allocation can be seen for all other ranks. V3 was never assigned to the fifth rank. For V3 and V4, the most frequent (≥4) assignments are between the first and third rank. For V2, on the other hand, the most frequent assignments (≥4) are between the second and fourth rank.

4. Discussion

The objective of the eye-tracking study was to ascertain the question of which button subjects preferred in a pairwise comparison and whether the objective attention distribution was reflected in the subjective preference. The results of the study are outlined in Table 10, which provides an overview of the ranks resulting from both the objective eye-tracking data and the subjective decisions made in the pairwise comparisons.
The results indicate that for all button types (objective wireframe, objective blue, subjective wireframe, subjective blue), V1, which represents the most angular button version, ranks fifth and last. In contrast, V5, which represents the roundest button version, ranks fourth in all cases except for the subjective evaluation of the wireframe buttons. These findings mainly align with a study by Becker et al. [65], which showed that completely angular and completely curved button corners are the least preferred.
Looking at the rankings resulting from the pairwise comparison, the ranks resulting from objective and subjective data for the wireframe buttons and the blue buttons differ. For the wireframe buttons, there are specifically differences in ranks 1 and 2 as well as in ranks 3 and 4, with each rank being mirrored in its representation. The coefficient estimates indicate that there are only minimal differences between ranks 1 and 2, which correspond to button versions V3 and V4. For the blue buttons, ranks 2 and 3 are mirrored in their representation. The rankings derived from the eye-tracking data (objective) show V3 on the first rank of the wireframe buttons, which is consistent with the ranking of V3 of the blue button versions. A larger sample size or multiple iterations might provide a clearer evaluation of these ranks. The minimal difference in the rankings for the blue buttons suggests that preferences for specific button versions manifest in allocated visual attention. This finding corroborates the literature described in theory [56,58,60,61]. According to Milosavljevic et al. [77], there is a potential for visual saliency biases to influence everyday choices. This raises the question of whether the buttons ranked higher are more salient than those with lower ranks. It is important to acknowledge that the present study exclusively examined the allocation of attention to button shapes in the absence of contextual information.
When comparing the rankings derived from the eye-tracking data, ranks 1, 4, and 5 do not differ from one another. V3 is ranked first, indicating that it received more focal attention than other button versions, both among blue buttons and wireframe buttons. V1 is in the last position, while V5 is ranked fourth. Following the assumption that preference is reflected in allocated attention, the findings align with those of Becker et al. [65], who did not report a ranking between completely angular and completely round buttons. Based on the current results, it can be concluded that completely angular buttons are less preferred than completely round buttons. This is further supported by the rankings from subjective data, where V1 is also ranked last among both blue and wireframe buttons. V5 ranks fourth among blue and the objective ranks of the wireframe buttons and third among the subjective ranks of the wireframe buttons. When comparing the remaining ranks of button versions based on subjective data, it becomes evident that ranks 1–4 differ notably. This prompts the following questions: firstly, to what extent does color influence subjective evaluation, and secondly, if so, why, and what are the underlying mechanisms by which color exerts this influence?
The research question of which buttons are perceived to be the most pleasant by the participants can be answered by examining the frequency distributions shown in Table 11 and Table 12. These distributions are derived from the questionnaire administered during the study and reflect the ranking of button versions based on perceived pleasantness. The results clearly show that V1 frequently occupies the last rank for both wireframe and blue buttons in terms of the pleasantness evaluation. This is also seen in the results from the objective and subjective data of the pairwise comparison. A higher rank for V3 among wireframe buttons is indicated by its never being assigned to either the fourth or fifth rank. These results confirm the preference and greater attention reflected in the previously described rankings from both subjective and objective data shown in Table 10. For blue buttons, V1 was never assigned to the first or second rank, and V2 was assigned once to the first rank. Here, V3 was also never assigned to the fifth rank among the blue buttons, showing a tendency toward higher ranks (ranks 1–4). Button V4 was more often assigned to higher ranks (rank 1–3) than the lower ranks (4–5). It should be noted here that the salience of a button in the pairwise comparison may have influenced the answers of the study participants. The evaluation of the results must be viewed under the influence of a possible salience bias [77].
In summary, V1 received the least attention and was rated least preferable and least pleasant in comparison to the other button versions. In terms of eye-tracking data, V3 ranks first, a result which aligns with the rankings of the blue buttons derived from subjective comparisons. However, this is not the case for wireframe buttons. The frequency distributions in the questionnaire indicate that V1 is also ranked lowest in terms of perceived pleasantness. Furthermore, V3 tends to be assigned ranks 1–3 concerning pleasantness.
The present study is subject to several limitations. Prior to the pairwise comparison task, participants were asked to define the term “preference” for the task themselves. They were not advised on how or in what context to define the word “preference” for selecting the preferred button, which may have influenced the deviating ranks resulting from the subjective data. Additionally, during the eye-tracking study, participants looked at the fixation X for 10 s each. It is possible that this duration was sufficient to ensure that the previously displayed button pairs were forgotten; however, the potential influence of visual memory should be considered. Although the buttons were presented in a randomized order regarding their shape, the order of presentation should be considered, as the wireframe buttons were always presented before the blue buttons.
The present study employed a multidimensional approach, incorporating a pairwise comparison with eye tracking. This approach is regarded as a very useful method, although it should be noted that the results between the subjective preference and the attention distribution are not completely consistent. It is therefore recommended that a multidimensional approach with different eye-tracking parameters, as well as measurement methods, be utilized in future research. Additionally, incorporating a questionnaire with open-ended questions into the study design is deemed to be beneficial. This approach facilitates the collection of feedback regarding both the methodology and the various design elements [78].
A further significant limitation pertains to the quality of the eye-tracking data, specifically the discarding of four sets of eye-tracking data from the final sample. The duration of the two runs of the pair comparison was limited to a maximum of 15 min, and a thorough examination revealed indications of participant fatigue, as well as issues related to inaccurate calibration and the use of make-up, which resulted in poor data quality. The issue of fatigue was evidenced by prolonged periods during which participants exhibited closed eyes. Such factors must be considered in future investigations.
Another limitation of the study was the presentation of the buttons in isolation from any contextual framework. The buttons were solely presented as shapes and lacked any labels. This was because an abstract initial study of attentional allocation without distraction was to be conducted. It is conceivable that the evaluation of these buttons might vary if they were to be labeled or viewed within a contextual framework, as is usually the case with graphical user interfaces. This is a possibility that will be examined in subsequent research. It is noteworthy that Becker et al. [65] presented their buttons in the context of a radio screen of a multimedia display in a vehicle and obtained similar results. At this point it is worth noting that Becker et al. [65] presented their buttons in the context of a radio screen of a multimedia display in a vehicle and obtained similar results.
The measurement of salience also constitutes a limitation of this study. Preference and the visual attention distribution were measured. Based on the results presented and the existing literature, it can be inferred that the rankings may also reflect the salience of the buttons, as visually salient objects are more likely to be chosen [77]. However, this assumption should be validated through a more detailed analysis of the eye-tracking data. The initial gaze could serve as a useful metric for this purpose, as demonstrated in the work by Weber et al. [2]. Additionally, it is advantageous to evaluate the salience of design elements subjectively. The findings of this study may provide valuable insights for the future design of graphical user interfaces (GUIs). Notably, clear results were observed for the fifth-ranked version of the completely square button. This button version did not receive the highest visual attention, nor was it preferred or perceived as particularly aesthetically pleasing compared to other button designs. However, these results should be interpreted with caution, as the button versions need to be tested in an appropriate context before specific design recommendations for GUIs can be made. Future research will extend this work to include an analysis of the salience of design elements in relevant contexts.
In the context of future research, the utilization of a combination of pairwise comparisons, eye-tracking, and interviews emerges as a promising avenue for exploration. This approach would facilitate the selection of two GUIs, each characterized by distinct design elements, by users. Moreover, the integration of eye-tracking data and interview responses would enable the extraction of insights into the rationale underlying user decisions. Additionally, it is imperative to undertake a comprehensive examination of the influence of both primary and secondary tasks in conjunction with GUIs, with a view to elucidating the salience of design elements.
5. Conclusions

The present study set out to investigate the relationship between button shape and user perception, isolated from contextual influences. Shape preferences, attention distribution, and perceived pleasantness were evaluated. The study contributes to UX design by investigating the fundamentals of human visual perception and interaction patterns to promote design strategies and interfaces that are both aesthetically pleasing and highly usable.
While the study provides valuable insights into the topics of attention and preference in the context of the design element “button”, isolated from contextual influences, several questions remain unanswered. It is essential to recognize that the field of visual perception is both complex and expansive, and a thorough understanding of the various influences on vision, perception, and stimulus processing is critical for advancing knowledge in this area.
As discussed in this paper, as technology advances, it is of great relevance to create user interfaces that are intuitive and pleasant to use while also offering designers hands-on tools to simplify the work for designers. Employing a range of methodologies can enhance our understanding of underlying human processes in relation to the use of digital surfaces. For future research, it is crucial to evaluate the salience of buttons more precisely by examining initial gaze patterns. In addition, further investigation into the other design elements depicted in Figure 1 is required, as are studies of the implications of overlapping design elements and the influence of established design principles. Other pertinent questions to be explored include whether preferences for button versions change over time during pairwise comparisons and how the graphical user interfaces of commonly used digital devices impact preferences for button designs. Further research in this area is recommended.

Author Contributions

Conceptualization, K.G.; methodology, K.G., S.P. and V.W.-H.; software, K.G.; validation, K.G., S.P. and V.W.-H.; formal analysis, G.J.A. and K.G.; investigation, K.G.; resources, G.J.A., K.G., S.P. and V.W.-H.; data curation, K.G.; writing—original draft preparation, K.G.; writing—review and editing, G.J.A., K.G., S.P. and V.W.-H.; visualization, K.G.; supervision, S.P. and V.W.-H. All authors have read and agreed to the published version of the manuscript.

Funding

This research received no external funding.

Institutional Review Board Statement

Our study was an exploratory approach. An informed consent was obtained from all subjects involved in the study. The study was conducted in accordance with the Declaration of Helsinki.

Informed Consent Statement

Informed consent was obtained from all participants involved in the study.

Data Availability Statement

The original contributions presented in the study are included in the article, further inquiries can be directed to the corresponding author.

Acknowledgments

The research acknowledges the technical support of Jonas Birkle from Furtwangen University as well as the support from all participants of the study.

Conflicts of Interest

The authors declare no conflicts of interest.

References

  1. Paneru, B.; Paneru, B.; Poudyal, R.; Bikram Shah, K. Exploring the Nexus of User Interface (UI) and User Experience (UX) in the Context of Emerging Trends and Customer Experience, Human Computer Interaction, Applications of Artificial Intelligence. Int. J. Inform. Inf. Syst. Comput. Eng. INJIISCOM 2024, 5, 102–113. [Google Scholar] [CrossRef]
  2. Weber, A.; Schopp, M.; Wirth, T. Untersuchung der Salienz von Visuellen Anzeigen bei GUIs und Erarbeitung von Gestaltungshinweisen; Hochschule Furtwangen University: Furtwangen, Germany, 2022; (Unpublished Work). [Google Scholar]
  3. Cambridge Dictionary Graphical User Interface. Available online: https://dictionary.cambridge.org/dictionary/english/graphical-user-interface (accessed on 4 December 2024).
  4. Martinez, W.L. Graphical User Interfaces: Graphical User Interfaces. Wiley Interdiscip. Rev. Comput. Stat. 2011, 3, 119–133. [Google Scholar] [CrossRef]
  5. DIN EN ISO 9241-11:2018-11; Ergonomie der Mensch-System-Interaktion. Deutsches Institut für Normung: Berlin, Germany, 2018.
  6. Zhang, N.; Zhang, J.; Jiang, S.; Ge, W. The Effects of Layout Order on Interface Complexity: An Eye-Tracking Study for Dashboard Design. Sensors 2024, 24, 5966. [Google Scholar] [CrossRef]
  7. Kortschot, S.W.; Jamieson, G.A.; Prasad, A. Detecting and Responding to Information Overload With an Adaptive User Interface. Hum. Factors J. Hum. Factors Ergon. Soc. 2022, 64, 675–693. [Google Scholar] [CrossRef]
  8. Shrivastav, H.; Hiltz, S.R. Information Overload in Technology-Based Education: A Meta-Analysis. In Proceedings of the Nineteenth Americas Conference on Information Systems, Chicago, IL, USA, 15–17 August 2013. [Google Scholar]
  9. McClurg-Genevese, J.D. Digital Web Magazine; 2005. Available online: https://www.digital-web.com/articles/elements_of_design/ (accessed on 16 February 2025).
  10. Huestegge, L. Top-Down-Verarbeitung. Available online: https://dorsch.hogrefe.com/stichwort/top-down-verarbeitung (accessed on 4 December 2024).
  11. Kendra, C. What Attention Means in Psychology. Available online: https://www.verywellmind.com/what-is-attention-2795009 (accessed on 4 December 2024).
  12. Erb, H.-P.; Balzukat, J. Salienz Und Aufmerksamkeit. Available online: https://www.hsu-hh.de/salienz-und-aufmerksamkeit (accessed on 4 December 2024).
  13. Fransworth, B. Saliency in Human Behavior Research. Available online: https://imotions.com/blog/learning/research-fundamentals/saliency/ (accessed on 4 December 2024).
  14. Clinehens, J. What Is Salience? The Science of Being Unignorable. Available online: https://www.choicehacking.com/2020/09/11/what-is-salience-bias/ (accessed on 4 December 2024).
  15. Silvennoinen, J.M.; Jokinen, J.P.P. Appraisals of Salient Visual Elements in Web Page Design. Adv. Hum.-Comput. Interact. 2016, 2016, 3676704. [Google Scholar] [CrossRef]
  16. Emami, P.; Jiang, Y.; Guo, Z.; Leiva, L.A. Impact of Design Decisions in Scanpath Modeling. Proc. ACM Hum.-Comput. Interact. 2024, 8, 1–16. [Google Scholar] [CrossRef]
  17. Leiva, L.A.; Xue, Y.; Bansal, A.; Tavakoli, H.R.; Köroðlu, T.; Du, J.; Dayama, N.R.; Oulasvirta, A. Understanding Visual Saliency in Mobile User Interfaces. In Proceedings of the 22nd International Conference on Human-Computer Interaction with Mobile Devices and Services, Oldenburg, Germany, 5–8 October 2020; ACM: New York, NY, USA, 2020; pp. 1–12. [Google Scholar]
  18. Ebert, N.; Ackermann, K.A.; Bearth, A. When Information Security Depends on Font Size: How the Saliency of Warnings Affects Protection Behavior. J. Risk Res. 2023, 26, 233–255. [Google Scholar] [CrossRef]
  19. Müsseler, J.; Rieger, M. (Eds.) Allgemeine Psychologie; Springer: Berlin/Heidelberg, Germany, 2017; ISBN 978-3-642-53897-1. [Google Scholar]
  20. Palmieri, H.; Carrasco, M. Task Demand Mediates the Interaction of Spatial and Temporal Attention. Sci. Rep. 2024, 14, 9228. [Google Scholar] [CrossRef] [PubMed]
  21. Evans, K.K.; Horowitz, T.S.; Howe, P.; Pedersini, R.; Reijnen, E.; Pinto, Y.; Kuzmova, Y.; Wolfe, J.M. Visual Attention. WIREs Cogn. Sci. 2011, 2, 503–514. [Google Scholar] [CrossRef] [PubMed]
  22. Lee, H.-S.; Oh, S.; Jo, D.; Kang, B.-Y. Estimation of Driver’s Danger Level When Accessing the Center Console for Safe Driving. Sensors 2018, 18, 3392. [Google Scholar] [CrossRef] [PubMed]
  23. Park, J.; Park, J.; Shin, D.; Choi, Y. A BCI Based Alerting System for Attention Recovery of UAV Operators. Sensors 2021, 21, 2447. [Google Scholar] [CrossRef] [PubMed]
  24. Inattentional Blindness. Available online: https://dictionary.apa.org/inattentional-blindness (accessed on 22 January 2023).
  25. Kahneman, D. Thinking, Fast and Slow; Penguin psychology; Penguin Books: London, UK, 2012; ISBN 978-0-14-103357-0. [Google Scholar]
  26. Grissinger, M. “Inattentional Blindness”: What Captures Your Attention? P T Peer-Rev. J. Formul. Manag. 2012, 37, 542–555. [Google Scholar]
  27. Attwood, J.E.; Kennard, C.; Harris, J.; Humphreys, G.; Antoniades, C.A. A Comparison of Change Blindness in Real-World and On-Screen Viewing of Museum Artefacts. Front. Psychol. 2018, 9, 151. [Google Scholar] [CrossRef] [PubMed]
  28. Saeed, S.; Cook, A.; Mackie, V.; Hayward, D.A. Looks Can Be Deceiving: Investigating Change Blindness in an Online Setting. Can. J. Exp. Psychol. Rev. Can. Psychol. Exp. 2024, 78, 1–8. [Google Scholar] [CrossRef] [PubMed]
  29. Apfelbaum, H.L.; Apfelbaum, D.H.; Woods, R.L.; Peli, E. Inattentional Blindness and Augmented-vision Displays: Effects of Cartoon-like Filtering and Attended Scene. Ophthalmic Physiol. Opt. 2008, 28, 204–217. [Google Scholar] [CrossRef]
  30. Hirsch, L.; Schneegass, C.; Welsch, R.; Butz, A. To See or Not to See: Exploring Inattentional Blindness for the Design of Unobtrusive Interfaces in Shared Public Places. Proc. ACM Interact. Mob. Wearable Ubiquitous Technol. 2021, 5, 1–25. [Google Scholar] [CrossRef]
  31. Davies, T.; Beeharee, A. The Case of the Missed Icon: Change Blindness on Mobile Devices. In Proceedings of the SIGCHI Conference on Human Factors in Computing Systems, Austin, TX, USA, 5–10 May 2012; ACM: New York, NY, USA, 2012; pp. 1451–1460. [Google Scholar]
  32. Clarke, A.D.F.; Nowakowska, A.; Hunt, A.R. Seeing Beyond Salience and Guidance: The Role of Bias and Decision in Visual Search. Vision 2019, 3, 46. [Google Scholar] [CrossRef] [PubMed]
  33. The Decision Lab Why Do We Focus More on Some Things than Others? Available online: https://thedecisionlab.com/biases/attentional-bias (accessed on 19 February 2023).
  34. Nummenmaa, L.; Hietanen, J.K.; Calvo, M.G.; Hyönä, J. Food Catches the Eye but Not for Everyone: A BMI–Contingent Attentional Bias in Rapid Detection of Nutriments. PLoS ONE 2011, 6, e19215. [Google Scholar] [CrossRef]
  35. Huang, J.; He, X.; Ma, X.; Ren, Y.; Zhao, T.; Zeng, X.; Li, H.; Chen, Y. Sequential Biases on Subjective Judgments: Evidence from Face Attractiveness and Ringtone Agreeableness Judgment. PLoS ONE 2018, 13, e0198723. [Google Scholar] [CrossRef] [PubMed]
  36. Echterhoff, J.M.; Yarmand, M.; McAuley, J. AI-Moderated Decision-Making: Capturing and Balancing Anchoring Bias in Sequential Decision Tasks. In Proceedings of the CHI Conference on Human Factors in Computing Systems, New Orleans, LA, USA, 29 April–5 May 2022; ACM: New York, NY, USA, 2022; pp. 1–9. [Google Scholar]
  37. The Decision Lab What Is the Salience Bias? Available online: https://thedecisionlab.com/biases/salience-bias (accessed on 4 December 2024).
  38. Huynh Cong, S.; Kerzel, D. Allocation of Resources in Working Memory: Theoretical and Empirical Implications for Visual Search. Psychon. Bull. Rev. 2021, 28, 1093–1111. [Google Scholar] [CrossRef]
  39. Kerzel, D.; Witzel, C. The Allocation of Resources in Visual Working Memory and Multiple Attentional Templates. J. Exp. Psychol. Hum. Percept. Perform. 2019, 45, 645–658. [Google Scholar] [CrossRef]
  40. Holmqvist, K.; Dewhurst, R.; Jarodzka, H.; Nyström, M.; Andersson, R.; de van Weijer, J.C. Eye Tracking: A Comprehensive Guide to Methods and Measures, 1st ed.; Oxford University Press: Oxford, UK, 2015; ISBN 978-0-19-969708-3. [Google Scholar]
  41. Glaholt, M.G.; Reingold, E.M. Eye Movement Monitoring as a Process Tracing Methodology in Decision Making Research. J. Neurosci. Psychol. Econ. 2011, 4, 125–146. [Google Scholar] [CrossRef]
  42. Glaholt, M.G.; Reingold, E.M. Stimulus Exposure and Gaze Bias: A Further Test of the Gaze Cascade Model. Atten. Percept. Psychophys. 2009, 71, 445–450. [Google Scholar] [CrossRef]
  43. Wedel, M.; Pieters, R. A Review of Eye-Tracking Research in Marketing. Rev. Mark. Res. 2008, 4, 123–147. [Google Scholar] [CrossRef]
  44. Wedel, M.; Pieters, R.; Van Der Lans, R. Modeling Eye Movements During Decision Making: A Review. Psychometrika 2023, 88, 697–729. [Google Scholar] [CrossRef]
  45. Pei, H.; Huang, X.; Ding, M. Image Visualization: Dynamic and Static Images Generate Users’ Visual Cognitive Experience Using Eye-Tracking Technology. Displays 2022, 73, 102175. [Google Scholar] [CrossRef]
  46. Tovillo, G.; Rapuano, M.; Milite, A.; Ruggiero, G. Perceived Quality in the Automotive Industry: Do Car Exterior and Interior Color Combinations Have an Impact? Appl. Syst. Innov. 2024, 7, 79. [Google Scholar] [CrossRef]
  47. Ergoneers Group. D-Lab: 3.0 Manual; Ergoneers Group: Egling, Germany, 2014. [Google Scholar]
  48. Kovesdi, C.; Spielman, Z.; LeBlanc, K.; Rice, B. Application of Eye Tracking for Measurement and Evaluation in Human Factors Studies in Control Room Modernization. Nucl. Technol. 2018, 202, 220–229. [Google Scholar] [CrossRef]
  49. Kurpiers, C.; Biebl, B.; Mejia Hernandez, J.; Raisch, F. Mode Awareness and Automated Driving—What Is It and How Can It Be Measured? Information 2020, 11, 277. [Google Scholar] [CrossRef]
  50. Feierle, A.; Danner, S.; Steininger, S.; Bengler, K. Information Needs and Visual Attention during Urban, Highly Automated Driving—An Investigation of Potential Influencing Factors. Information 2020, 11, 62. [Google Scholar] [CrossRef]
  51. DIN EN ISO 15007-1 2015; Road Vehicles—Measurement of Driver Visual Behaviour with Respect to Transport Information and Control Systems. DIN Deutsches Institut für Normung: Berlin, Germany, 2015.
  52. Shen, Z.; Xue, C.; Li, J.; Zhou, X. Effect of Icon Density and Color Contrast on Users’ Visual Perception in Human Computer Interaction. In Engineering Psychology and Cognitive Ergonomics; Harris, D., Ed.; Lecture Notes in Computer Science; Springer International Publishing: Cham, Switzerland, 2015; Volume 9174, pp. 66–76. ISBN 978-3-319-20372-0. [Google Scholar]
  53. Näsänen, R.; Ojanpää, H.; Kojo, I. Effect of Stimulus Contrast on Performance and Eye Movements in Visual Search. Vis. Res. 2001, 41, 1817–1824. [Google Scholar] [CrossRef] [PubMed]
  54. Li, J.; Xue, C.; Tang, W.; Wu, X. Color Saliency Research on Visual Perceptual Layering Method. In Human-Computer Interaction. Theories, Methods, and Tools; Kurosu, M., Ed.; Lecture Notes in Computer Science; Springer International Publishing: Cham, Switzerland, 2014; Volume 8510, pp. 86–97. ISBN 978-3-319-07232-6. [Google Scholar]
  55. Alós-Ferrer, C.; Ritschel, A. Attention and Salience in Preference Reversals. Exp. Econ. 2022, 25, 1024–1051. [Google Scholar] [CrossRef]
  56. Heimann, M.; Schütz, M. Wie Design Wirkt: Psychologische Prinzipien Erfolgreicher Gestaltung, 1st ed.; 5th updated reprint; Rheinwerk Design; Rheinwerk Verlag GmbH: Bonn, Germany, 2021; ISBN 978-3-8362-3858-8. [Google Scholar]
  57. Simion, C.; Shimojo, S. Early Interactions between Orienting, Visual Sampling and Decision Making in Facial Preference. Vis. Res. 2006, 46, 3331–3335. [Google Scholar] [CrossRef] [PubMed]
  58. Shimojo, S.; Simion, C.; Shimojo, E.; Scheier, C. Gaze Bias Both Reflects and Influences Preference. Nat. Neurosci. 2003, 6, 1317–1322. [Google Scholar] [CrossRef] [PubMed]
  59. Simion, C.; Shimojo, S. Interrupting the Cascade: Orienting Contributes to Decision Making Even in the Absence of Visual Stimulation. Percept. Psychophys. 2007, 69, 591–595. [Google Scholar] [CrossRef] [PubMed]
  60. Armel, K.C.; Beaumel, A.; Rangel, A. Biasing Simple Choices by Manipulating Relative Visual Attention. Judgm. Decis. Mak. 2008, 3, 396–403. [Google Scholar] [CrossRef]
  61. Krajbich, I.; Smith, S.M. Modeling Eye Movements and Response Times in Consumer Choice. J. Agric. Food Ind. Organ. 2015, 13, 55–72. [Google Scholar] [CrossRef]
  62. Design Thinking (DT). Available online: https://www.interaction-design.org/literature/topics/design-thinking#:~:text=Design%20thinking%20is%20a%20non,%2C%20Ideate%2C%20Prototype%20and%20Test. (accessed on 4 December 2024).
  63. Swasty, W.; Adriyanto, A.R. Does Color Matter on Web User Interface Design. CommIT Commun. Inf. Technol. J. 2017, 11, 17. [Google Scholar] [CrossRef]
  64. Khandelwal, P.; Chaudhary, N. The Psychology of Colors in UI/UX Design. In PRATIBODH, NCDSNS; Pratibodh: Jaipur, India, 2023. [Google Scholar]
  65. Becker, S.; Mariet, R.; Menrath, I.; Wagner, V.; Sarma, V.; Xiong, A. One Ford—One HMI? Human Machine Interface in Between Global Brand Identity and Regional Customer Requirements; VDI: Düsseldorf, Germany, 2011. [Google Scholar]
  66. Chen, J.; Chen, C.; Xing, Z.; Xia, X.; Zhu, L.; Grundy, J.; Wang, J. Wireframe-Based UI Design Search through Image Autoencoder. ACM Trans. Softw. Eng. Methodol. 2020, 29, 1–31. [Google Scholar] [CrossRef]
  67. The Meaning of Colors. Available online: https://blocs.xtec.cat/gemmasalvia1617/files/2017/02/the-meaning-of-colors-book.pdf (accessed on 16 February 2025).
  68. Tivian XI GmbH. Unipark. Available online: https://ww2.unipark.de/www/front.php?controller=login&act=index&code= (accessed on 16 February 2025).
  69. Ergoneers Group. Dikablis Glasses 3. Available online: https://ergoneers.com/faq-downloads/manuals/Dikablis-Glasses-3/QS-Guide-DG3_Cable-and-Wireless.pdf (accessed on 16 February 2025).
  70. Yang, Q.; Ng, M.L. Paired Comparison/Directional Difference Test/2-Alternative Forced Choice (2-AFC) Test, Simple Difference Test/Same-Different Test. In Discrimination Testing in Sensory Science; Elsevier: Amsterdam, The Netherlands, 2017; pp. 109–134. ISBN 978-0-08-101009-9. [Google Scholar]
  71. Meilgaard, M.C.; Carr, B.T.; Carr, B.T. Sensory Evaluation Techniques; CRC Press: Boca Raton, FL, USA, 2006; ISBN 978-0-429-19514-3. [Google Scholar]
  72. Peirce, J.; Gray, J.R.; Simpson, S.; MacAskill, M.; Höchenberger, R.; Sogo, H.; Kastman, E.; Lindeløv, J.K. PsychoPy2: Experiments in Behavior Made Easy. Behav. Res. Methods 2019, 51, 195–203. [Google Scholar] [CrossRef]
  73. Birkle, J.; Weber, R.; Möller, K.; Wagner-Hartl, V. Psychophysiological Parameters for Emotion Recognition—Conception and First Evaluation of a Measurement Environment. In Intelligent Human Systems Integration (IHSI 2022): Integrating People and Intelligent Systems. AHFE (2022) International Conference. AHFE Open Access; Ahram, T., Karwowski, W., Di Bucchianico, P., Taiar, R., Casarotto, L., Costa, P., Eds.; AHFE International: Orlando, FL, USA, 2022; Volume 22. [Google Scholar] [CrossRef]
  74. Bradley, R.A.; Terry, M.E. Rank Analysis of Incomplete Block Designs; Oxford University Press: Oxford, UK, 1952. [Google Scholar]
  75. The R Foundation R 2022. Available online: https://www.r-project.org/about.html (accessed on 16 February 2025).
  76. Turner, H.; Firth, D. Bradley-Terry Models in R: The BradleyTerry2 Package. J. Stat. Softw. 2012, 48, 1–21. [Google Scholar] [CrossRef]
  77. Milosavljevic, M.; Navalpakkam, V.; Koch, C.; Rangel, A. Relative Visual Saliency Differences Induce Sizable Bias in Consumer Choice. J. Consum. Psychol. 2012, 22, 67–74. [Google Scholar] [CrossRef]
  78. Kauer-Franz, M.; Franz, B. Usability und User Experience Design: Das umfassende Handbuch, 1st ed.; Rheinwerk Computing; Rheinwerk: Bonn, Germany, 2022; ISBN 978-3-8362-8720-3. [Google Scholar]
Figure 1. The 16 design elements.
Asi 08 00027 g001
Figure 2. Hardware components from the perspective of the study management.
Asi 08 00027 g002
Figure 3. Study procedure in the PsychoPy project.
Asi 08 00027 g003
Figure 4. A participant in the study wearing the eye tracker.
Asi 08 00027 g004
Figure 5. Course of the study from the participants’ perspective.
Asi 08 00027 g005
Figure 6. Graphical representation of the coefficient estimators of the BT model for the eye tracking data of the wireframe buttons and the blue buttons. The gray line refers to the wireframe buttons and the blue line to the blue buttons.
Asi 08 00027 g006
Figure 7. Graphical representation of the coefficient estimators of the BT model for the data resulting from the pairwise comparison of the wireframe buttons and the blue buttons. The gray line refers to the wireframe buttons and the blue line to the blue buttons.
Asi 08 00027 g007
Table 1. The different blue buttons and wireframe buttons.
V1 V2 V3 V4 V5
radius (wireframe)Asi 08 00027 i001Asi 08 00027 i002Asi 08 00027 i003Asi 08 00027 i004Asi 08 00027 i005
radius (blue)Asi 08 00027 i006Asi 08 00027 i007Asi 08 00027 i008Asi 08 00027 i009Asi 08 00027 i010
Table 2. The observed frequencies of the wins and losses of the different wireframe buttons.
Buttons BWV1V2V3V4V5Wins
V1 121191244
V220 12132065
V32120 162178
V4231916 1876
V520121114 57
Losses8463505271320
Table 3. The estimators for the item parameters and the ranks assigned to the wireframe buttons.
V1 *V2V3V4V5
estimate00.55000.88720.83460.3442
rank53124
* V1 acts as the reference object.
Table 4. The observed frequencies of the wins and losses of the different blue buttons.
Buttons BlueV1V2V3V4V5Wins
V1 10491235
V222 11192375
V32821 131779
V4231319 1873
V52091514 58
Losses9353495570320
Table 5. The estimators for the item parameters and the ranks assigned to the blue buttons.
V1 *V2V3V4V5
estimate01.06961.18341.02340.6302
rank52134
* V1 acts as the reference object.
Table 6. The observed frequencies of the wins and losses of the different wireframe buttons.
Buttons BWV1V2V3V4V5Wins
V1 10045
V239 9101775
V34031 2320114
V4403017 28115
V536232012 91
Losses15585464569400
Table 7. The estimators for the item parameters and the ranks assigned to the wireframe buttons.
V1 *V2V3V4V5
estimate02.90833.91633.94283.3256
rank54213
* V1 acts as the reference object.
Table 8. The observed frequencies of the wins and losses of the different blue buttons.
Buttons BlueV1V2V3V4V5Wins
V1 033915
V240 12191990
V33728 2324112
V4372117 26101
V531211614 82
Losses14570485978400
Table 9. The estimators for the item parameters and the ranks assigned to the blue buttons.
V1 *V2V3V4V5
estimate02.14902.67202.40701.9620
rank53124
* V1 acts as the reference object.
Table 10. Comparison of the ranks in the subjective and objective pairwise comparison.
RankObjective BWObjective
Blue
Subjective BWSubjective Blue
1Asi 08 00027 i011Asi 08 00027 i012Asi 08 00027 i013Asi 08 00027 i014
2Asi 08 00027 i015Asi 08 00027 i016Asi 08 00027 i017Asi 08 00027 i018
3Asi 08 00027 i019Asi 08 00027 i020Asi 08 00027 i021Asi 08 00027 i022
4Asi 08 00027 i023Asi 08 00027 i024Asi 08 00027 i025Asi 08 00027 i026
5Asi 08 00027 i027Asi 08 00027 i028Asi 08 00027 i029Asi 08 00027 i030
Table 11. The frequency table for the ranks of the wireframe buttons.
Buttons BWV1V2V3V4V5
Rank 105537
Rank 204772
Rank 313862
Rank 428037
Rank 5170012
Table 12. The frequency tables for the ranks of the blue buttons.
Buttons BlueV1V2V3V4V5
Rank 101765
Rank 207544
Rank 314663
Rank 446226
Rank 5142022
Disclaimer/Publisher’s Note: The statements, opinions and data contained in all publications are solely those of the individual author(s) and contributor(s) and not of MDPI and/or the editor(s). MDPI and/or the editor(s) disclaim responsibility for any injury to people or property resulting from any ideas, methods, instructions or products referred to in the content.