1. Introduction
Spare parts evaluation studies and the Spare Parts and Interchangeability Record (SPIR) ensure spare part recommendations for projects, modifications, and operations. The SPIR process consists of activities from operators, contractors, and suppliers and must be delivered to support the maintenance strategy for equipment units. Several standards, such as NORSOK Z-008 [
1], highlight the evaluation of spare parts as a strategic decision that should be studied during the project phase. It recommends that the evaluation be based on the consequence of the unavailability and demand rates of spare parts. Most of these SPIR analyses and related standards are dominant for physical storage [
2]. The advent of Industry 4.0 has significantly transformed spare part management and warehousing and introduced new challenges and novel spare part inventory cases [
3,
4,
5,
6,
7]. Additive manufacturing, due to its shorter lead time, offers another way to stock physical spare parts. It offers to stock 3D files instead of physical parts and manufactures them on demand. The storage of 3D files and the manufacture on demand is often referred to in the literature as a digital warehouse [
8]. Both additive manufacturing technology and digital warehouse concepts offer a new way for industries to manage and maintain their spare parts inventory by enabling on-demand production, reducing lead times, allowing customization, simplifying inventory, and enhancing supply chain resilience [
9]. The chemical industry [
10] and the oil and gas sector [
11,
12,
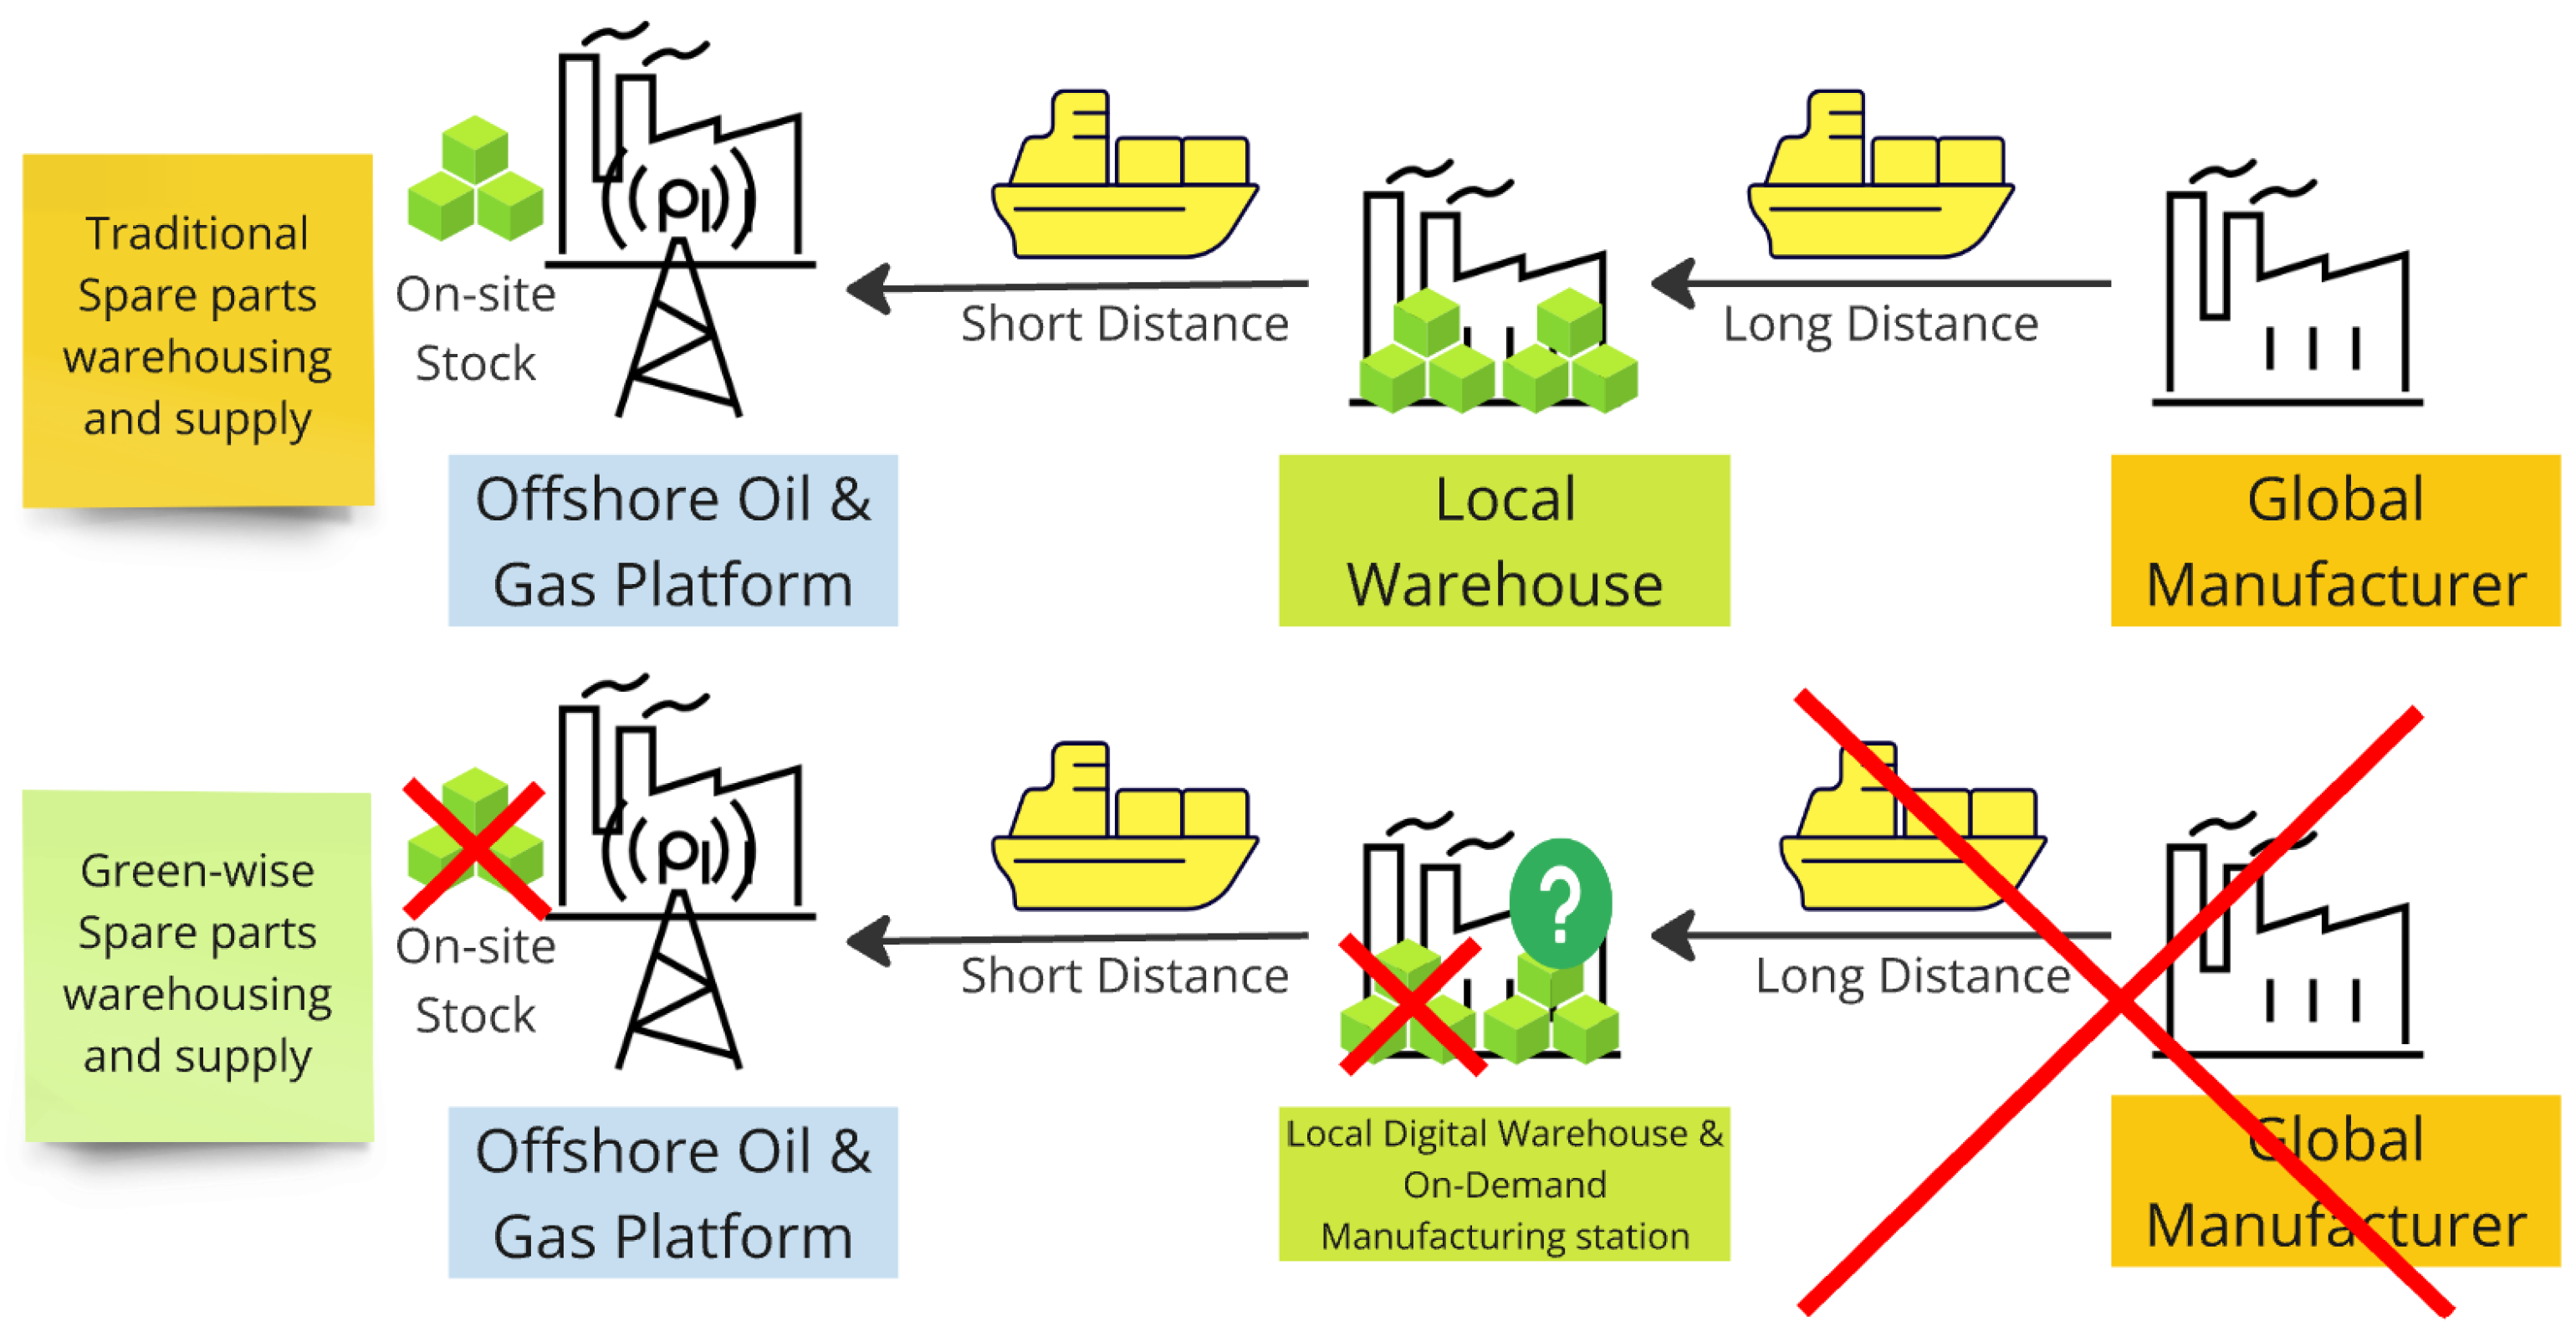
13] are expected to have great potential to use additive manufacturing and digital storage. For example, the offshore oil and gas sector aims to take advantage of additive manufacturing and digital storage, mainly by reducing on-site stock, stock in local warehouses, and transportation and emissions related to the global supply process.
Figure 1 illustrates the green spare parts storage and supply option compared to transnational physical storage and supply. Therefore, it is necessary to upgrade the current SPIR process to consider both physical and digital storage options to allow further green spare parts storage and supply.
There are significant contributions to helping SPIR engineers select spare parts suitable for additive manufacturing [
14,
15]. These spare parts selection models shall also be supported with models to help SPIR engineers design the entire spare parts inventory system. In the latest review paper on the management of spare parts inventory [
16], around 86 studies were reviewed where different deterministic, heuristic and simulation models were explored. Spare parts inventory analysis has evolved with a variety of advanced methodologies and models aimed at optimizing spare parts inventory to reduce costs and improve system availability. These approaches integrate predictive [
17,
18], optimization [
19,
20], and prescriptive analytics [
21,
22] to address the complexities of spare part management, which is crucial for maintenance and operational efficiency. Afifi et al. [
17] introduced a Hybrid Memetic Algorithm that optimizes preventive maintenance scheduling and inventory costs. Elhadaf et al. [
19] highlight the use of (s,S) policies and genetic algorithms to minimize management expenses and maximize service levels within a variable periodic demand inventory model. Tao and Zhou [
21] applied multi-agent hierarchical reinforcement learning to dynamically control inventory levels, offering greater efficiency in calculation time compared to neural network-based algorithms. Ruiz et al. [
20] used Bayesian degradation modeling to minimize expected costs by ensuring that prior information about component degradation is accurate. Liao et al. [
18] applied Long Short-Term Memory (LSTM) to predict spare parts inventory, addressing the challenges posed by large data and short replacement cycles. Statistical models, including the frailty model and the Schoenfeld residual test, capture the variability in failure and repair data due to environmental factors [
23]. Godoy Ramos [
24] proposed an interesting framework that bridges the areas of condition-based maintenance, outsourcing coordination, and joint decisions on reliability engineering and stockholding policies. Supply chain disruptions are crucial for ensuring the timely availability of spare parts and minimizing operational disruptions [
25]. Although these advances represent significant progress in spare parts inventory analytics toward a more data-driven approach, challenges remain, such as data availability, accuracy, and quality.
A model-based approach can effectively address situations where data are scarce or cases are novel, leveraging theoretical knowledge and domain expertise for informed predictions [
26]. Chen et al. [
27], Labadi et al. [
28], and Bounou et al. [
29] applied Batch Deterministic and Stochastic Petri Nets (BDSPNs) into spare parts management to simulate inventory policies and optimize performance, incorporating batch tokens for information flow and operational policies. Bin and Wan-Hua [
30] presented a generalized stochastic Petri net (GSPN) model to capture the complexities of a three-echelon repair structure and a two-echelon inventory system. Xu et al. [
31] proposed a hybrid simulation approach to investigate how the adoption of 3D printing technologies to manufacture spare parts for maintenance operations will improve operational efficiency and effectiveness [
31]. On the other hand, Zhang [
32] and Sgarbossa [
33] highlighted that digital warehouse and on-demand manufacturing may not always be cost-effective, especially for larger parts or when demand is highly variable. Faster processing times are expected to positively affect spare part supply, which can lead to better service levels and shorter lead times for customers [
34]. Therefore, careful consideration of the technical capabilities and production constraints of on-demand manufacturing is required [
35]. In addition, there is a lack of exploration of the hybrid warehouse option, in which physical and digital warehouses are considered. In the real world, choosing either a physical or digital warehouse might not ensure the highest or desired production availability, whereas combining both might lead to achieving the desired value at optimal cost.
From an asset management point of view, spare parts evaluation is a strategic analysis that plans spare parts inventories and supplies for the commissioning phase and operational lifetime. Adapting the asset management approach means that the value of choosing or combining physical and digital warehouses should be explored throughout the lifecycle, together with the consequences of having or not having spare parts stocks and supply chain risks. There are several options or scenarios to explore; for example, spare parts could be supplied directly from global manufacturers in the best-cost countries (BCCs) or by having central warehouses or on-site stocks (e.g., on an oil platform). Moreover, digital warehousing and local on-demand manufacturing (additive and subtraction methods) offer either no warehouse stock options or minimal warehouse stock as a hybrid option (physical and digital warehousing). All these options have different consequences (production losses) and operating expenses (holding cost, CO2 emission cost, transportation cost) because they have different supply lead times. Therefore, SPIR engineers need more insight-driven information to enable them to build a strategic spare part management plan rather than managing spare parts for short-term periods.
The purpose of this paper is to upgrade the spare parts evaluation process to consider digital warehousing and to offer a strategic, insight-driven approach to SPIR engineers. A case asset is purposefully selected and four spare part management concepts are modeled and simulated: (1) global supply with long lead time, (2) digital warehouse supply with on-demand manufacturing, (3) limited on-site stock and global supply, and (4) limited on-site stock and digital warehouse supply. A simulation modeling approach is used to model the asset availability and spare part supply process.
In the following section, the spare part evaluation process and the asset management approach are explained. Later, a case study and the simulation model are described. Then, in
Section 3, the results of the simulated case study and its four scenarios are presented and discussed. The paper ends with conclusions on novel practices to update SPIR analysis and create a more strategic spare part management plan.
2. Materials and Methods
2.1. Spare Parts Evaluation
Spare parts evaluation refers to the process of evaluating and determining the quantity, location, and lead time of spare parts. Several standards such as NORSOK Z-008 recommend that spare parts evaluation studies be performed in the project phase in what is commonly known as the spare parts interchangeability record (SPIR) [
1]. Complex assets such as oil and gas platforms must have a spare parts inventory plan and SPIR documents [
2]. The NORSOK Z-008 standard [
1] provides a workflow to determine the optimal location to store spare parts, based on a risk matrix (shown in
Figure 2) that considers both the consequences of not having spare parts in place and the demand rate. The ideal location should minimize both the risk and the cost associated with the inaccessibility of spare parts. Potential locations may vary from stocking (1) via stock at the site, (2) in a central warehouse, or (3) no stock at all. In other words, the standards help SPIR engineers determine what and how many spare parts should be on-site to ensure the desired production uptime, and what and how many spare parts should be stocked at the central warehouse. It is clear that all these recommendations and stocking options are related to physical warehousing, whereas the digital warehousing option has not been considered yet. Digital warehousing supported by on-demand manufacturing could impact stocks on-site or at the central warehouse if it is used.
The second important issue to determine is the number of spare parts. To keep the spare parts stock at a certain level, the quantity of orders and the reorder point must be determined. If the demand rate and supply lead time are constant, the Economic Order Quantity (EOQ) model can be used. It is a model used in inventory management to determine the optimal order quantity that minimizes total inventory costs (ordering and holding costs). However, asset failure rates are not constant and the supply lead times also vary from time to time. Therefore, stochastic models can be used to determine the preferable order quantity and reorder point considering the variability of demand rates and lead times.
2.2. Physical and Digital Warehouses
Maintaining a substantial inventory of spare parts is crucial to address failures or replacement needs quickly, especially if the supply lead time is long and the consequence of not having spare parts is very high. On the other hand, having a physical spare parts inventory results in tying up significant capital, adding holding costs to operational costs, adding carbon emissions due to long lead times, and producing waste as some portion of these spare parts often remain untouched [
36,
37].
Additive manufacturing, often known as 3D printing, significantly affects digital warehousing by transforming the way inventory is managed, produced, and stored [
11]. It enables the creation of spare parts or products on demand, reducing the need for extensive physical inventory storage. Digital warehouses can store 3D models instead of physical parts, allowing for immediate production when needed. Therefore, it minimizes the space required for storage and decreases the risk of having unused inventory that is tying up capital. In addition, this technology allows for local or in-house production, mitigating the risks associated with supply chain disruptions. Digital warehouses are designed to handle multiple manufacturing processes, including both additive manufacturing and subtractive manufacturing methods such as machining. On-demand warehousing facilitates quick adjustments to inventory levels and adapts to fluctuating customer demands without overcommitting resources [
38].
Deciding whether to invest in a physical or digital warehouse involves evaluating various factors to align with business objectives and needs. First, upfront and ongoing costs associated with physical versus digital warehouses shall be analyzed, including expenses like real estate, construction or technology investment, maintenance, staffing, and operational costs and considering the long-term financial implications of each option. Second, the impacts of unavailability of spare parts on operational efficiency should be estimated and compared for both physical and digital warehouses.
2.3. Case Study
A new oil and gas platform is planned in the North Sea and the asset operator is working on an SPIR analysis to determine the locations and quantities of the spare parts inventory. The SPIR engineers utilize their experience and historical SPIR records from previous similar platforms. SPIR engineers follow the recommendations of the NORSOK Z-008 standard to determine the criticality and consequence of not having spare parts to define the location and minimum quantity at each location. They have three options to stock spare parts: on-site stock (on the platform), which is very limited, central warehouse stock onshore, and no stock. SPIR engineers have three issues to consider. First, the platform is planned to be unmanned, where maintenance workers visit the platform every three months to perform the required maintenance work, so it may not be worth having on-site spare parts stock (as maintenance workers are not available on-site outside of the planned maintenance intervals). Second, the idea of a digital warehouse is worth exploring, especially since the onshore central warehouse contractor is planning to offer this option with subscription fees, so the asset operator is not going to invest capital in building a digital warehouse. Third, previous SPIR studies and actual records (during the operation phase) indicate that SPIR studies are dominant with deterministic values (spare part quantity and delivery time); however, demand rates and supply times are stochastic in reality. Operationally, this means that they had some spare parts that were stocked and became obsolete before they were used, and some spare parts were needed more than what was stocked, which had severe consequences on production. In reality, the delivery time or the lead time of the supply is very stochastic and is influenced by several uncertainties that are not considered in the SPIR studies. In fact, SPIR studies do not evaluate whether the delivery time matches the demand rate. The demand rate is used in current SPIR studies to determine the criticality and define the location of the stock, but not the quantity and the consequences on production. The SPIR engineers noticed that sometimes the demand rate is higher than the stock and the delivery time is then prolonged with supply lead time from the original manufacturer (usually best-cost countries). In some cases, to keep the delivery time as contracted, the cost is significantly increased to obtain parts on time.
SPIR engineers believe that digital warehousing is a good option to explore, as it first makes the delivery time more resilient. It fits the purpose and operational needs more, as it offers on-demand supply rather than stocking supply, preventing unnecessary stock and holding expenses for entire stocks. However, SPIR engineers have technical and economical concerns with regard to digital warehousing. The technical concern is related to whether the spare parts contractor is technically capable of manufacturing and can supply the required spare parts. The asset operator is willing to outsource rather than invest in building their own digital warehouse system and local manufacturing stations. Therefore, the second concern is the economics behind the digital warehouse, and whether it will cost the asset operator more than conventional warehousing or not. The digital warehouse contractor is offering a subscription fee or “pay-as-you-use” option and it is difficult to determine which one is more economical. The SPIR study is a strategic work document that leads to capital investment to buy spare part stock and inventory locations or to contract on-demand services. Therefore, SPIR engineers must select the spare part policy for the entire life of the asset.
The SPIR engineers had five questions in mind: (1) If no stock policy is applied with a conventional supply process, what will the consequence on production uptime be? (2) If the highest production uptime is targeted with a conventional supply process, what will the optimal safety stock be? (3) If the no-stock policy is applied with a digital warehousing process, what will the consequence on production uptime be? (4) If the highest production uptime is targeted with a digital warehousing process, what will the optimal safety stock be? (5) If the digital warehousing process is more beneficial in terms of consequences, is it more beneficial cost-wise, and what is the threshold for the subscription fee? To answer these questions, four scenarios are formulated and modeled. SPIR engineers select some critical spare parts that can technically be manufactured using a digital warehouse and a local manufacturing station. The demand rate is 1.5 orders per month and follows an exponential distribution.
2.4. Simulation Model and Scenario Modeling
The modeling project started with an existing scenario (naive evaluation of spare parts without finding an optimal solution or using a digital warehouse); the second scenario was to find the optimal solution that matched the demand; the third scenario was to consider only a digital warehouse and local on-demand manufacturing; and finally, the fourth scenario considered both a digital warehouse and limited physical inventory.
Based on the input of SPIR engineers, four scenarios need to be explored. Scenario 1 is the one recommended by the current SPIR analysis, where it is recommended that three spare parts be kept on site. Scenario 1 totally depends on the physical warehouse with delivery time from the original manufacturer that has a triangle distribution (Min 20 days, Mean 30 days, Max 50 days). Cost-wise, scenario 1 is based on spare parts cost and inventory holding cost. Scenario 2 aims to understand how the digital warehouse option works alone. Scenario 2 totally depends on a digital warehouse and on-demand manufacturing with delivery times based on a triangle distribution (Min 5 days, Mean 7 days, Max 14 days) and no safety stock. Cost-wise, scenario 2 is based on subscription fees and has no inventory holding cost. Scenario 3 is preferable in terms of production availability, where the supply of spare parts should meet the highest availability target. Scenario 3 totally depends on the physical warehouse with the delivery time from the original manufacturer which has a triangle distribution (Min 20 days, Mean 30 days, Max 50 days) and no safety stock. Cost-wise, scenario 2 is based on spare parts cost and inventory holding cost. Scenario 4 is another preferable scenario to keep production availability as high as possible by using hybrid warehousing. Scenario 4 is dependent on a digital warehouse with minimal physical stock and delivery times based on a triangle distribution (Min 5 days, Mean 7 days, Max 14 days). Cost-wise, scenario 4 is based on subscription fees that include the inventory holding cost for the minimal stock items.
The considered lifetime for these scenarios is 20 years (175,200 h). The replacement time is 8 h and is the same for all scenarios. As shown in
Table 1, the four scenarios differ in the amount of safety stock and the lead time of supply. Regarding CO
2 points, it is assumed that any spare part that is delivered from the original manufacturer outside of Norway will receive two points of CO
2, while spare parts delivered within Norway will be counted as zero CO
2 points. These CO
2 points can be converted to cost figures once the CO
2 fee and associated taxes are determined. Regarding the holding cost, it is assumed that there is a constant holding cost rate per spare part item per hour, which will be multiplied by the number of spares in stock to get the total holding cost.
The developed simulation model aims to represent the asset availability and spare part supply process as shown in
Figure 3.
The state chart represents the asset agent, where it has several states; it should usually be in the working state (“Asset Working” in the figure) unless a failure is triggered or a spare part is demanded (demand transition in the figure). Once a spare part is requested, a quick check (illustrated as a diamond symbol in
Figure 3) of the on-site stock will be performed to determine whether a spare part is available or should be ordered. If a spare part is available in the stock, a “direct replacement” task will be carried out in 8 h, and then the asset will return to the “Working” state. However, if there are no spare parts in stock, the spare parts shall be ordered and supplied by a “supply” agent. The supply agent is modeled as a discrete event process, as shown at the bottom of
Figure 3, which starts with an “order” and ends with a specific batch size of spare parts. It has a specific supply lead time; the triangular distributions are described in
Table 1.
The availability rate is basically estimated as the total time spent in the “Asset Working” state divided by the total time. The mean supply lead time is estimated using the timers in the discrete event model (timeMeasureStart and timeMeasureEnd in
Figure 3). The transportation cost is estimated as a multiplication of number of shipments by the transportation fee, on average 3000 Norwegian krone (NOK) per shipment for the spare part of interest. The CO
2 emissions in kg, for the cargo ship, can be estimated by multiplying the total operating hours by the weight and emission rate [tonne/h], as expressed in Equation (
1).
The sea route from the best-cost country to Norway (for example, Stavanger) is approximately 20,000 km and the shipment weight for the selected spare part is 100 kg (0.02 tonnes). CO
2 emissions for cargo ships can vary, but an average emission rate is approximately 10 g of CO
2 per tonne-kilometer (g CO
2/tonne-km) [
39]. The estimated CO
2 emissions per shipment for the selected spare part are as follow:
It is worth mentioning that the transportation cost and emission count for local logistics (between the local warehouse and the offshore platfrom) is not considered in this model, as it is similar for all scenarios.
2.5. Validation Process
The model comprises three components: input, logic, and output. The inputs were chosen on the basis of historical data and expert involvement to ensure their validity. The logic behind each logistics scenario was derived from the case study and was confirmed by experts for accuracy. The results were partially validated. The results of the simulated scenarios were qualitatively validated by the case study experts, as these scenarios have not yet been implemented and no data have been collected.
3. Results and Discussion
This section presents and illustrates the results of the four scenarios. The results will then be used to support SPIR engineers in the worksheet and determine the most value-driven spare parts policy. It is worth noting that all-time plots in this section are in hours and for the entire lifetime (20 years, which is 175,200 h), and all cost figures are in Norwegian krone (NOK). The results of the simulated scenarios are summarized in
Table 2. The mean availability as a percentage and the total up-time hours are listed.
Looking at
Table 2, it can be observed that scenario 1 provides the lowest availability and highest emissions, since it depends on long distance and supply lead time. The low spare parts stock policy applied in this scenario reduced the holding cost; however, it also reduced the availability. Scenario 2, with a digital warehouse and no physical stock, achieved the best results in terms of holding cost (zero stock) and emissions credits; however, the availability did not reach the desired target. Scenario 3 has perfectly improved availability and reached the desired target of 98.5%; however, this was at the expense of a high holding cost (NOK 1,309,577) and a considerable amount of emissions (1020 kg CO
2). Scenario 4 has managed to keep availability at the desired target, while reducing the holding cost (from 1.3 to 0.899 MNOK) and reduce supply emissions to a minimal amount.
Regarding green activity, the digital warehouse scenario managed to completely reduce all emissions related to global spare parts supply; however, this was at the expense of reducing availability by 15.1%. However, the hybrid warehouse scenario managed to increase availability by 11.5% while completely reducing all emissions related to global spare parts supply. Cost-wise, the digital warehouse scenario had the lowest operating expenses; however, this was at the expense of the availability. In this case, the hybrid warehouse scenario provides the highest operating expenses due to the estimated subscription fees, which are still open for discount negotiations. This high operating expense can still be justified, as this scenario provides the highest availability and emission reduction. It is worth mentioning that the cost estimation in this study is naive and requires better cost estimates and coverage of the cost categories. However, the intention behind this study was to provide a model that quantifies the technical KPIs such as availability, supply lead time, number of holden spares, number of shipment, and emission amount, and to enable SPIR engineers to use their own economic models to quantify the economic KPIs and evaluate the expenses against availability and emission figures.
3.1. Observations on Asset Availability and Supply Lead Time
The asset availability is the most important performance indicator from the point of view of the asset operator. The mean availability rate under naive physical warehouse conditions (scenario 1) is about 87%, which means that the asset was unavailable and required waiting for spare parts having a long supply lead time. The supply lead time for this scenario is on average about 799.79 h. However, the supply lead time histogram in
Figure 4 illustrates the lead time distribution and categories. It can be seen that there are four categories with different supply lead times of 600, 700, 800–1000, and 1100 h, indicating that the lead time is scattered and not resilient.
The mean availability rate under the digital warehouse conditions (scenario 2) is about 72%, which means that the asset was unavailable and waiting for spare parts. In this case, although the supply lead time is shorter than in scenario 1, the no-stock condition made the situation of asset availability worse. The supply lead time histogram in
Figure 5 illustrates the lead time distribution, which is almost uniform and resilient (between 150 and 300 h). The mean availability rate under the enhanced physical warehouse conditions (scenario 3) is about 98.4%. This high availability rate was secured by a higher level of safety stock. In this case, although the supply lead time is longer than in scenario 2, the high safety stock condition made the situation of asset availability much better. The supply lead time histogram, shown in
Figure 6, illustrates that the values are almost scattered and not resilient (between 450 and 1100 h).
The mean availability rate under the hybrid warehouse conditions (scenario 4) is about 98.5%. This high availability rate was secured by a higher level of safety stock and a short supply lead time. The supply lead time histogram in
Figure 7 illustrates an almost normal and resilient distribution (between 150 and 300 h).
Comparing
Figure 4 and
Figure 5, one can observe that ad hoc stock with a long supply lead time (799 h) provides better availability than on-demand manufacturing with a shorter supply lead time (209 h). Asset availability with the on-demand manufactured spare parts policy and no stock dropped to 71.9%, whereas it was 87% for ad hoc stocking with a long supply lead time. In addition, comparing
Figure 4 and
Figure 6, one can observe that minimal stocking is much better than ad hoc stocking to match the desired asset availability—it has the potential to increase availability from 87% to 98.4%. However, with minimal stock options, the number of spare parts in stock increases from three (ad hoc stock) to seven spare parts. Increasing the number of stocks will definitely have an impact on the holding cost; in this case, the cost of holding increases almost three times. The increase in holding costs is not just due to the increase in the stock, but also because increasing the stock leads to better availability and more operating hours, which may lead to more failures and more spares. Furthermore, comparing
Figure 6 and
Figure 7, one can observe that on-demand manufacturing reduces the minimal stock while keeping the asset availability as high as possible. In addition, on-demand manufacturing cut off the CO
2 emissions related to global logistic operations.
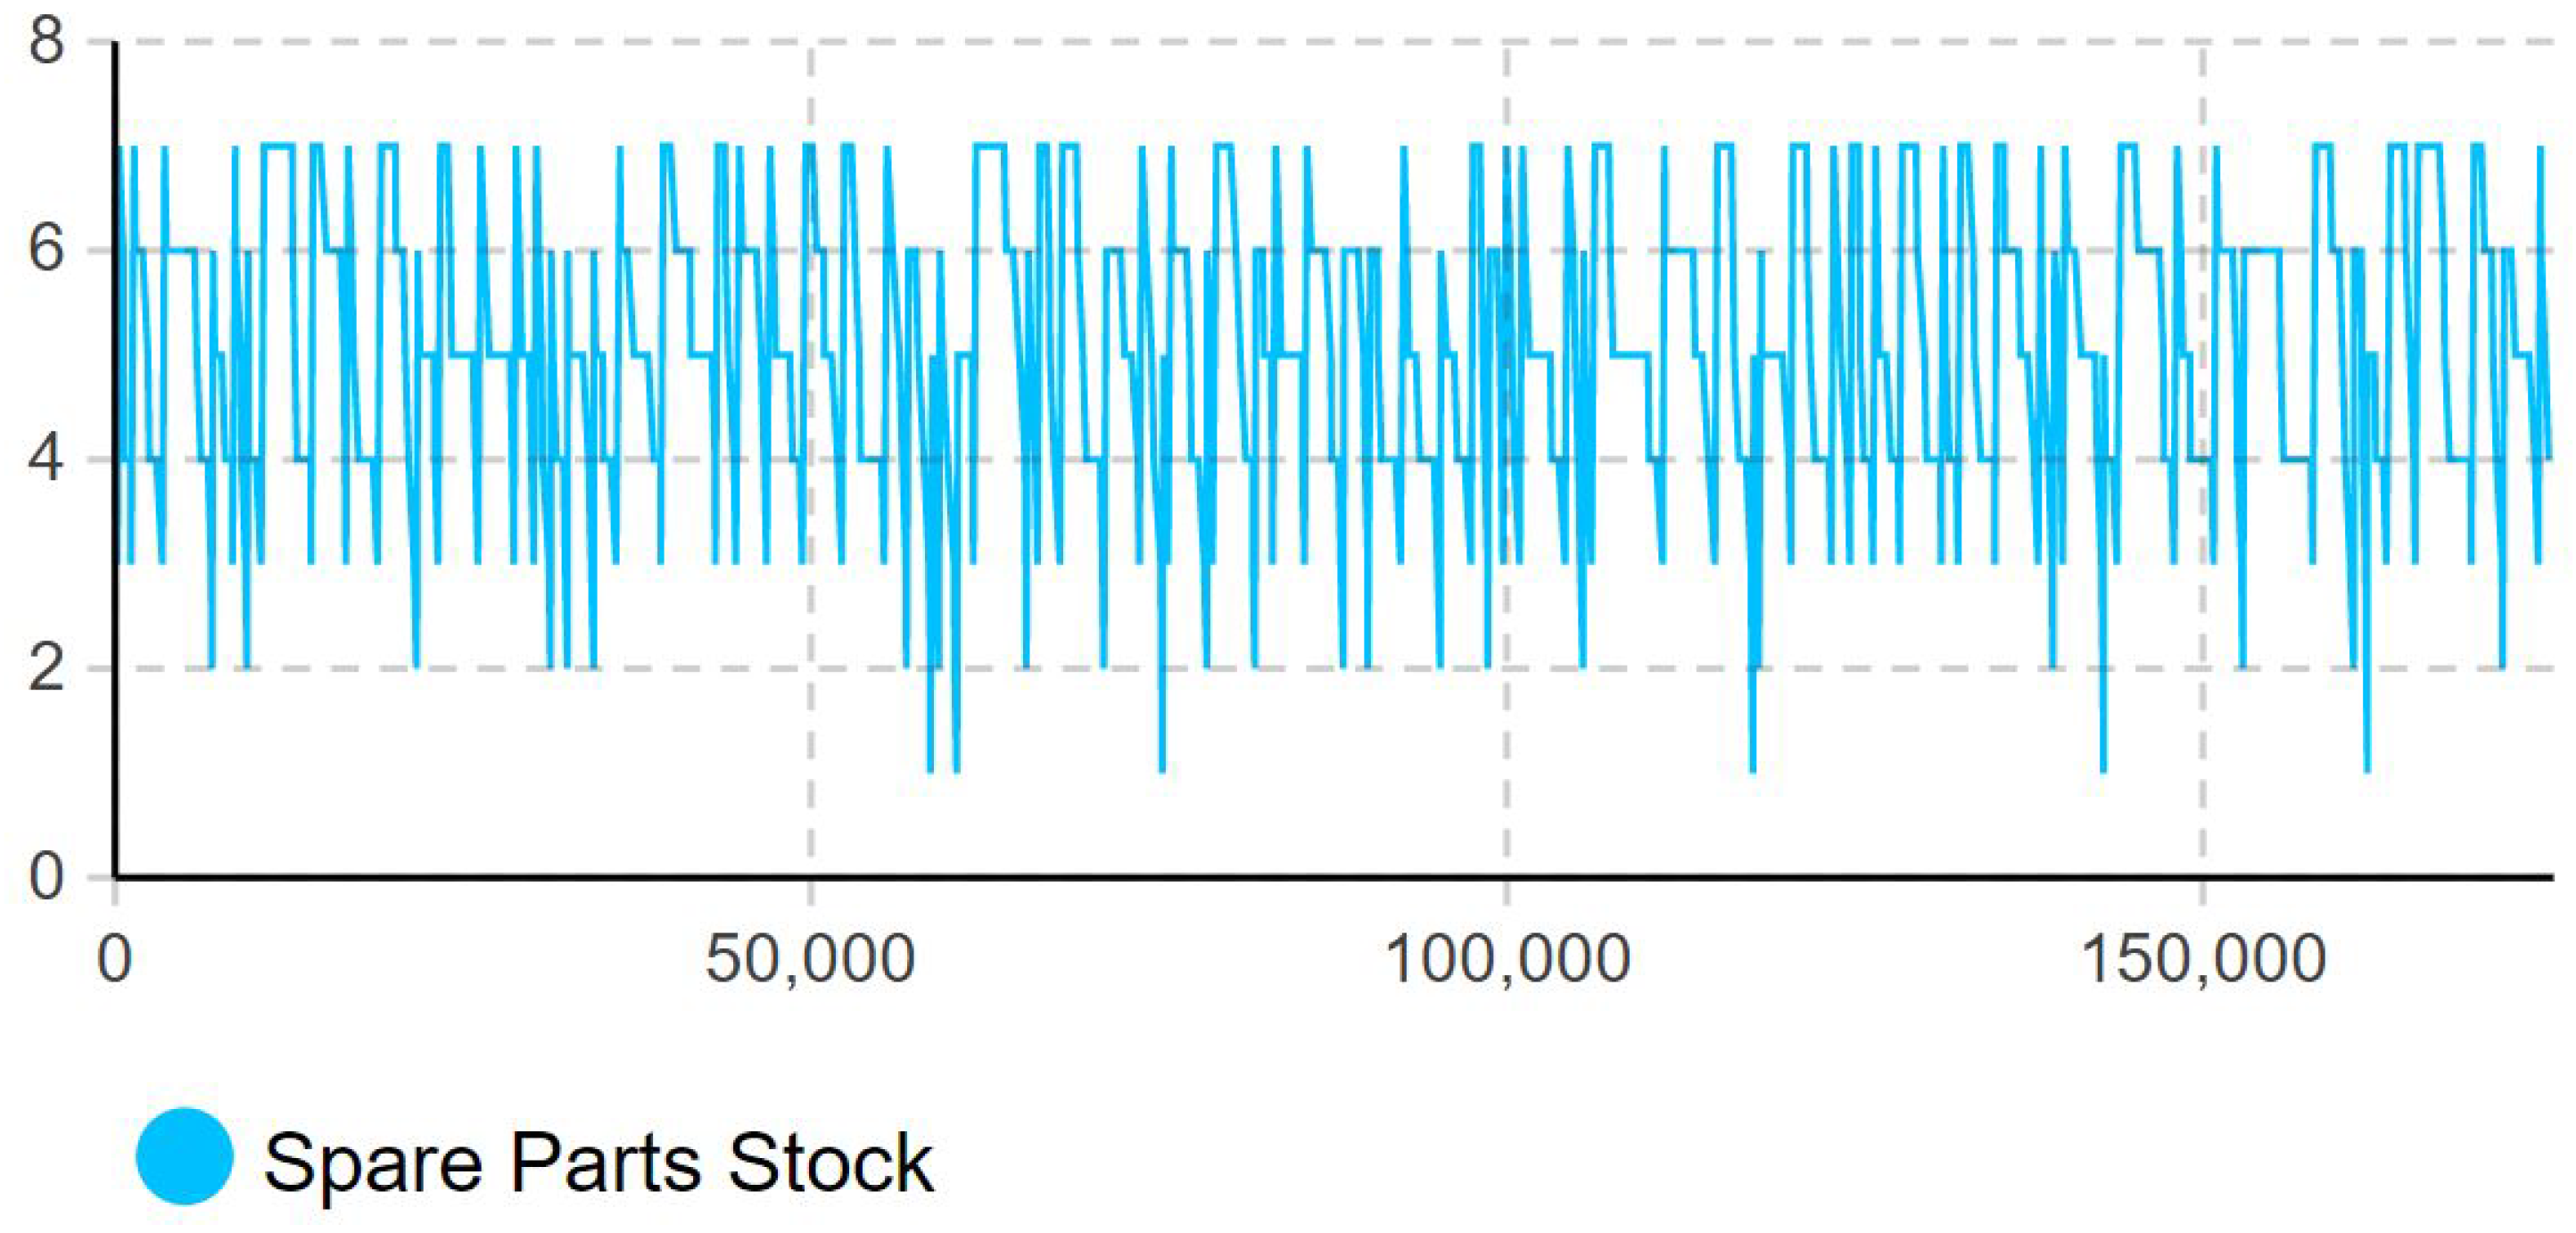
3.2. Observations on Spare Parts Stock
Lee et al. [
38] highlighted that on-demand warehousing facilitates quick adjustments to inventory levels and adapts to fluctuating customer demands without overcommitting resources. Let us examine the inventory or stock time plot for each scenario.
The inventory stock time plot for the physical warehouse (scenario 1), as illustrated in
Figure 8, represents approximately 25 times when the asset was unavailable and the spare part was due. The inventory stock time plot for the enhanced physical warehouse (scenario 3), as illustrated in
Figure 9, shows a good match between the spare parts stock and the demand rate and no events where spares were lacking.
When comparing the inventory stock time plots for the enhanced physical warehouse (scenario 3,
Figure 9) with the inventory stock time plots for the hybrid warehouse (scenario 4,
Figure 10), one can observe that both provide a good match between the spare parts stock and the demand rate given the specified supply lead time; however, the hybrid warehouse reduced the level of safety stock compared to scenario 3.
3.3. Spare Parts Cost and Subscription Pricing
As mentioned in
Table 1, the pricing of digitally stored spare parts is given as a subscription fee. SPIR engineers need to be able to estimate the optimal subscription fee and decide whether to go for physical or digital warehousing. In physical warehousing options, the asset operator will be responsible for purchasing the spare parts and covering the holding cost. However, for digital warehousing options, the subscription fee usually covers the spare parts and holding costs. In this case study, SPIR engineers wanted to exclude the holding cost and only compare the spare part cost against the subscription fee. In
Figure 11, the total cost of two subscription options for the digital warehouse is estimated and illustrated, together with the total cost of spare parts under the physical warehouse option. Such an analysis helps SPIR engineers to determine whether to go for physical or digital warehouse and what subscription fee is cost-effective once the digital or hybrid warehouse option is considered.
3.4. Proposed SPIR Framework for Digital and Hybrid Warehouse
After analyzing several scenarios for physical, digital, and hybrid warehouse options, SPIR engineers should have enough information to determine the relevant concept of spare parts inventory and complete the SPIR worksheet with the required specifications. As mentioned earlier, the current worksheet for SPIR studies is mainly for the physical warehouse option (scenario 1). In addition, the spare parts risk matrix, as illustrated in
Figure 2, is also mainly for the physical warehouse option (scenario 1). The digital and hybrid warehouse can also affect the spare parts risk matrix, as illustrated in
Table 3. The digital warehouse can replace the central warehouse stocks and it can also replace the at-site stock for low-consequence items. The hybrid warehouse option is very helpful for high-consequence items to minimize the stock level. The new emerging matrix in
Table 3 can be helpful for SPIR engineers in determining the location of each spare parts group, considering the options of digital and hybrid warehouse. It is worth mentioning that the spare part risk matrix that the NORSOK Z-008 standard and the case company use are not complex. It is used only to determine the location of each spare parts group (on-site, local warehouse, global warehouse) based on the risk of not having the required spare parts. It is not meant to be used to determine the quantity of spare parts.
To determine the optimal quantity of spare parts stock and the reorder point, SPIR engineers are recommended to use the developed simulation model and customize it for their purposes and case. The model is helpful for enabling SPIR engineers to select from the warehouse options, whether the optimal warehouse is physical, digital, or hybrid. Certainly, an ad hoc or naive physical warehouse (like scenario 1) that is not based on demand rate and supply lead time should be avoided. The simulation method used in this paper, together with the methods mentioned in the introduction section, e.g., BDSPNs, can handle stochastic demand rates and stochastic supply lead times, which is essential for cost-effective spare part management. SPIR engineers are also advised to use the data-driven approach, improve their estimate of demand rates and supply lead times, and reinforce them in simulation models and worksheets. The last recommended step is to revise the SPIR worksheet. If SPIR engineers decide to go for a hybrid warehouse (scenario 4), which is the most cost-effective scenario based on simulation analysis, they need an upgraded SPIR worksheet as shown in
Table 4.
In summary, the upgraded SPIR study framework recommends the following steps:
Use statistical modeling and machine learning techniques to better estimate demand rates and supply lead times.
Use simulation modeling approach to predict the KPIs and find the best warehouse option and optimal stock level and reorder point.
Use the updated spare parts risk matrix to determine the location of the spare parts.
Fill in the SPIR sheet and the detailed specification.
4. Conclusions
The results obtained by the simulation model help us to conclude that the hybrid warehouse can offer a green and cost-effective option to manage critical spare parts. Physical or digital warehouse options alone may not offer this, which is in line with other studies [
32,
33]. Hybrid warehousing offers better availability rates, shorter and more resilient supply lead times, and smoother and less crowded inventory stocks. Although this study has not covered the social benefits of reinforcing local manufacturing with the digital warehouse option and the ability to deal with the global supply crisis, these are benefits that must always be highlighted.
The spare parts evaluation analysis for several simulated scenarios indicates that the digital warehouse is not sufficient by itself to maintain production availability at the highest levels; however, it is effective in reducing the amount of stock, simplifying inventory management, and making the supply process more resilient. Although digital warehousing without physical stock has lower production availability than other scenarios, it can be the best scenario (in terms of operating cost and CO2 emissions) for spare parts that do not directly affect production availability. In addition, this study demonstrates how simulation modeling can be useful for SPIR engineers in determining reasonable subscription fees for digital warehoused items.
This study highlights the need to update the SPIR analysis to consider the option of digital warehousing and on-demand manufacturing during the project phase. From an asset management point of view, considering digital warehousing and on-demand manufacturing options in the project phase is a cost-effective option compared to modifications and changes in inventory concept in the utilization phase. Moreover, early consideration at the project phase also allows warehouse stakeholders to establish resources (manufacturing rights and contracts with local manufacturers) to be able to offer a digital warehouse and on-demand manufacturing. Switching physical warehouses to offer digital warehousing and on-demand spares requires considerable investment, effort, and time.
This paper contributes to the field of spare parts analysis and offers valuable information on the benefits and implications of digital warehousing, on-demand manufacturing, and hybrid warehousing. It provides a model that helps SPIR engineers quantify the impacts of considering digital and hybrid warehousing. The developed simulation model handles several conflicting key performance indicators (e.g., availability against holding cost) and enables trade-off analysis. The paper proposes upgrading the existing SPIR process by incorporating the simulation model developed to enable evaluating the options for digital and hybrid warehouses. The findings underscore the potential to improve availability and create a green spare parts inventory and supply, particularly under the hybrid warehousing option. The study also recommends updating the spare part risk matrix and SPIR worksheets.
Simulation analytics using various assumptions and simplifications such as those that were used as a tool to illustrate the effect of spare parts policy on asset availability, operating expenses, and CO2 emissions is still better than performing SPIR analysis in the current naive way. Demand rates and supply lead times should not only be used to classify the criticality of spare parts and their location; they should also be heavily used to determine safety stock and order quantity.
Several scenarios under demand fluctuations and more complex supply-time distributions should be further studied. In this study, SPIR engineers requested exploration of digital warehousing in normal conditions and with limited fluctuation (only an exponential distribution of 1.5 per month). The applied limited demand fluctuation was to allow for a fair comparison between the four scenarios. Therefore, it is recommended to perform further simulation experiments with demand fluctuations, especially for the best scenario (hybrid warehouse) to test it under several demand conditions. As for supply time distributions, specific supply time distributions (such as triangular distributions) may not be flexible enough to reflect the complexity of actual operations (such as seasonal demand changes, unexpected events, etc.). Thus, it is also recommended to consider more complex stochastic models, such as bimodal distributions, the Gaussian mixture model, kernel density estimation, the finite mixture model, Petri net, or state machine models, to improve the applicability of the models in the real world.
The simulation model developed covers limited safety stock dynamics related to the order point and the batch size. They are almost considered fixed variables for the entire lifetime; however, in practice, they are dynamically adjusted to keep the safety stocks at the optimal level, considering seasonal operations and conditions. It is recommended to introduce and explore the dynamic inventory management strategy to adjust inventory levels based on real-time data to better respond to fluctuations in demand. It may end up with finding the most optimal hybrid scenario that also further minimizes the safety stock. Moreover, condition-based spare part management is promising, where a more dynamic inventory management strategy is required and should be explored.
In comparing the economics of physical and digital warehouses, this study focuses on spare parts, holding, transportation expenses, and subscription fees, without estimating expenses related to unavailability (production losses due to supply delays) and emissions. In the context of offshore oil production, since the selected equipment and spare parts are classified as critical, the costs associated with unavailability are significantly higher than all other expenses, especially the emission costs. Emissions are important not only because of their direct costs but also because of their broader environmental and regulatory impacts and public perception. Therefore, it is important to prioritize availability and emissions as key performance indicators for comparison, while understanding that estimating their economic figures can be complex and highly context specific. For example, if the case is related to offshore wind farm, the associated costs of unavailability and emissions will be weighed totally differently.
In this study, the focus was on conducting direct comparison scenarios, which had well-defined and fixed conditions. The primary interest was in the outcomes under specific conditions rather than in exploring the range of possible outcomes due to variations in inputs. Sensitivity analysis for demand rate, reorder point, and batch size will provide further insight, especially in uncertain environments such as increasing lead times due to harsh weather, increasing order rates during maintenance campaigns, and increases in emission tax rates. Another significant recommendation for future work is to perform a comprehensive economic analysis, where more cost categories are covered, and better and recent cost estimates are considered, based on the technical KPI results obtained in this study. Furthermore, it is also recommended that the scope of the case study be extended to cover different asset classes and other industries to verify the general applicability of the findings.


