
Heat and Flow Study of the Internally Finned Tubes with Different Fin Geometries


Abstract
:1. Introduction
2. Material and Methods
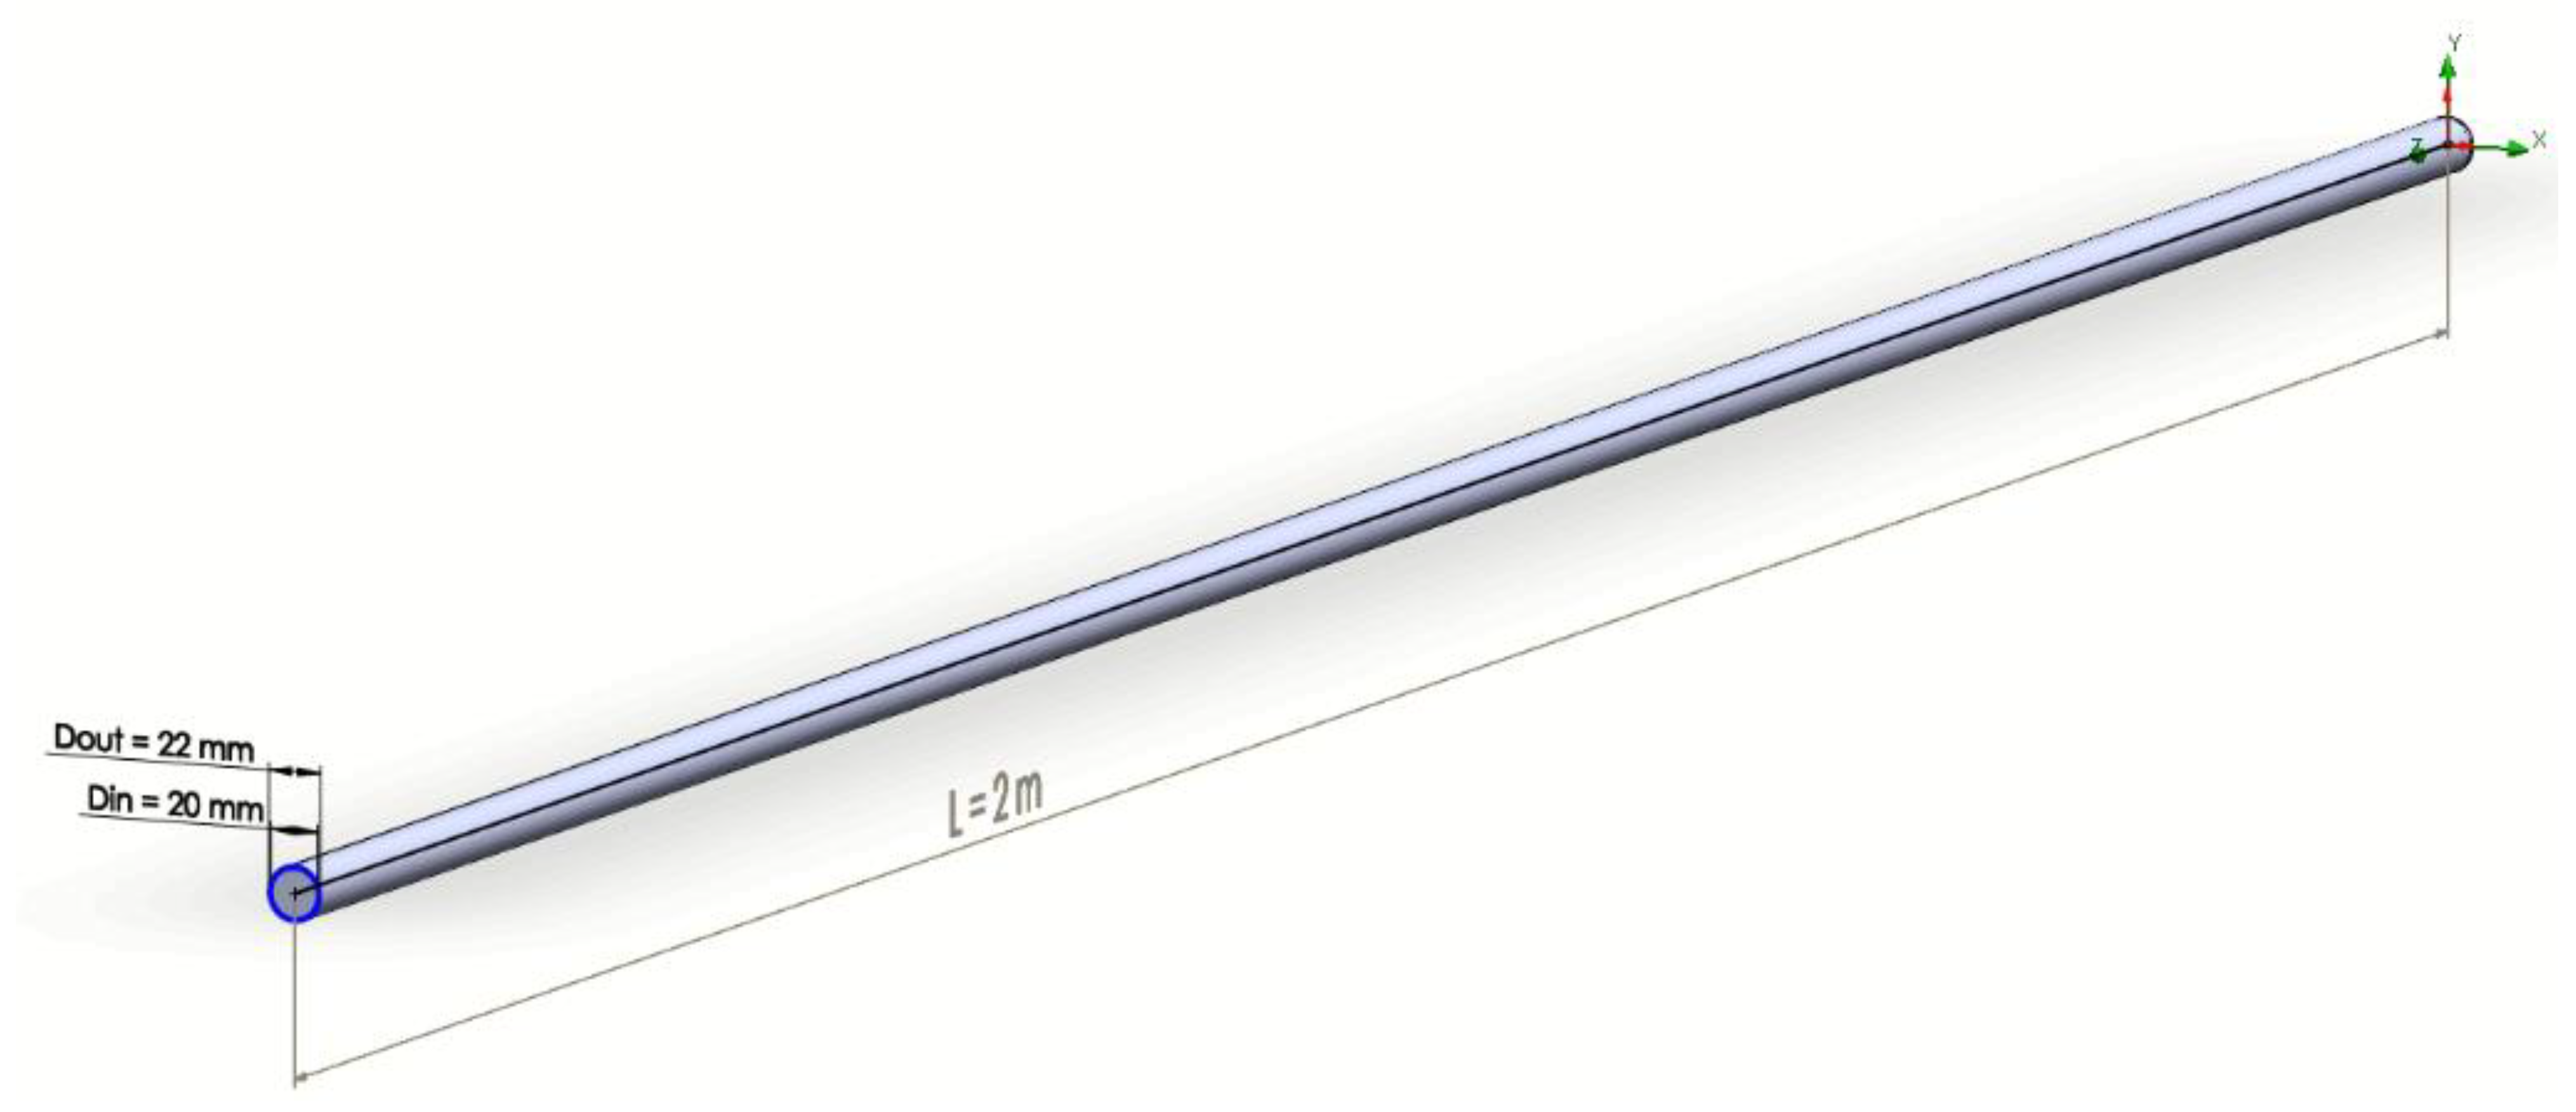
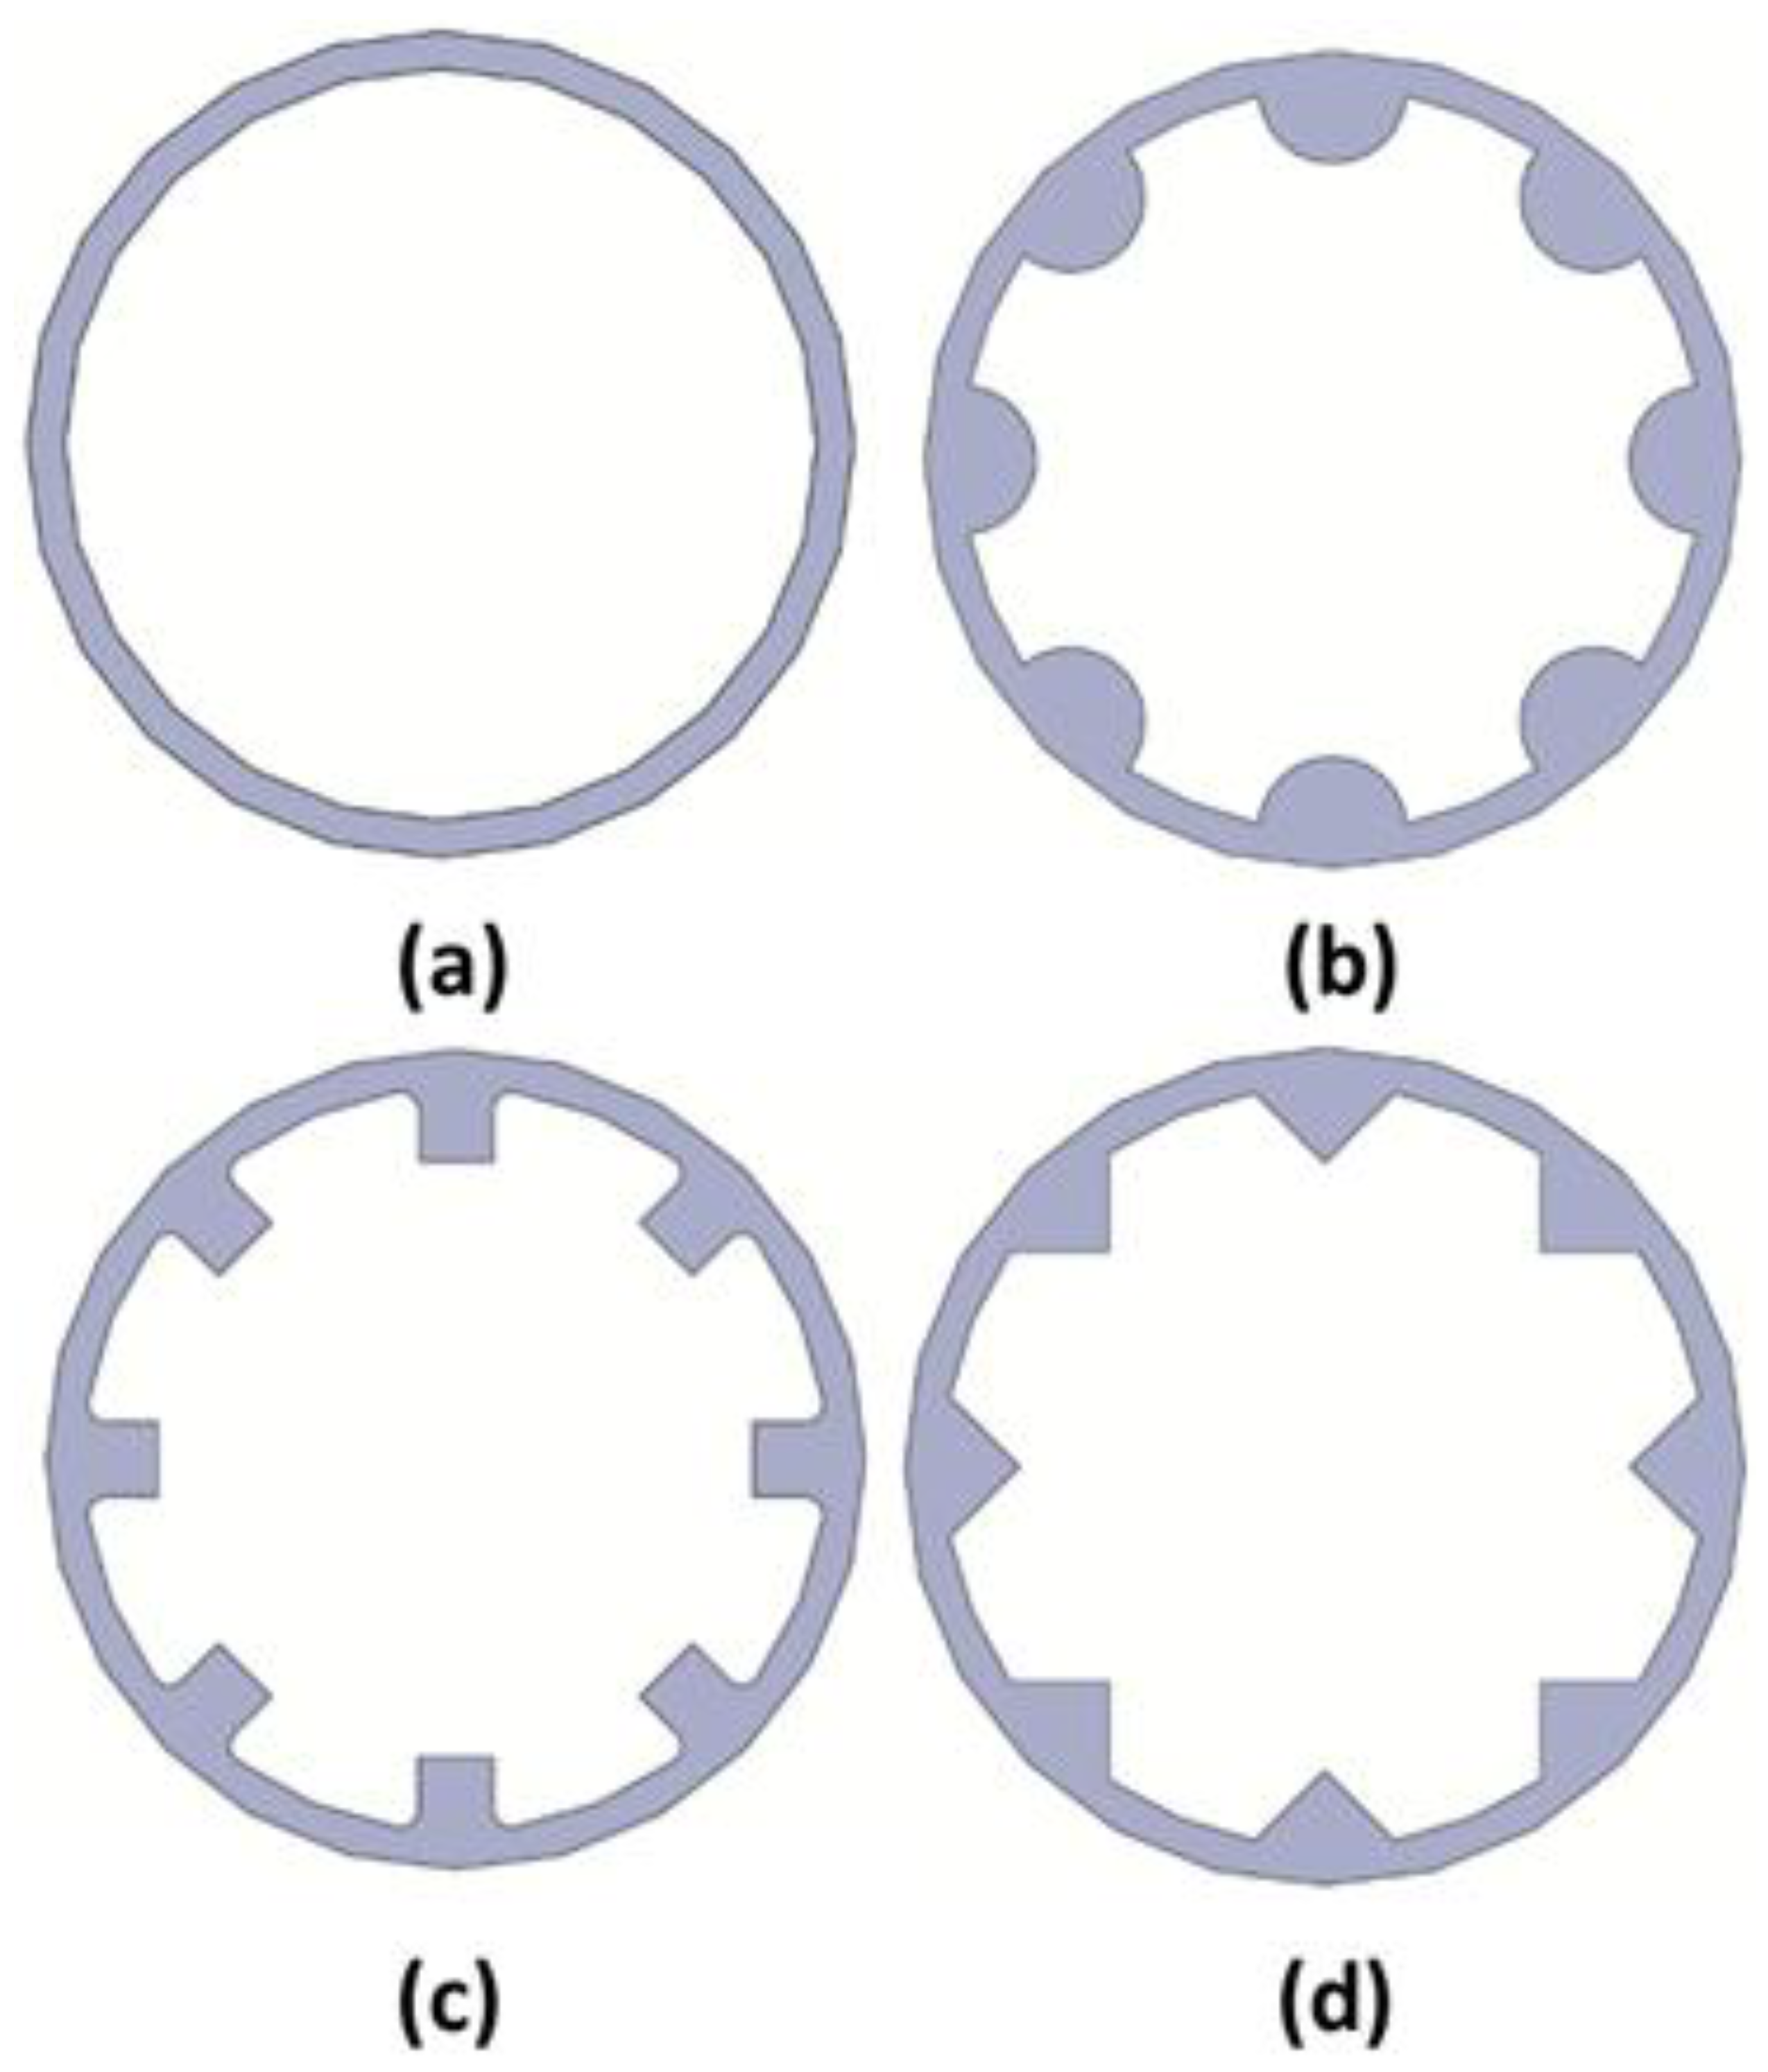
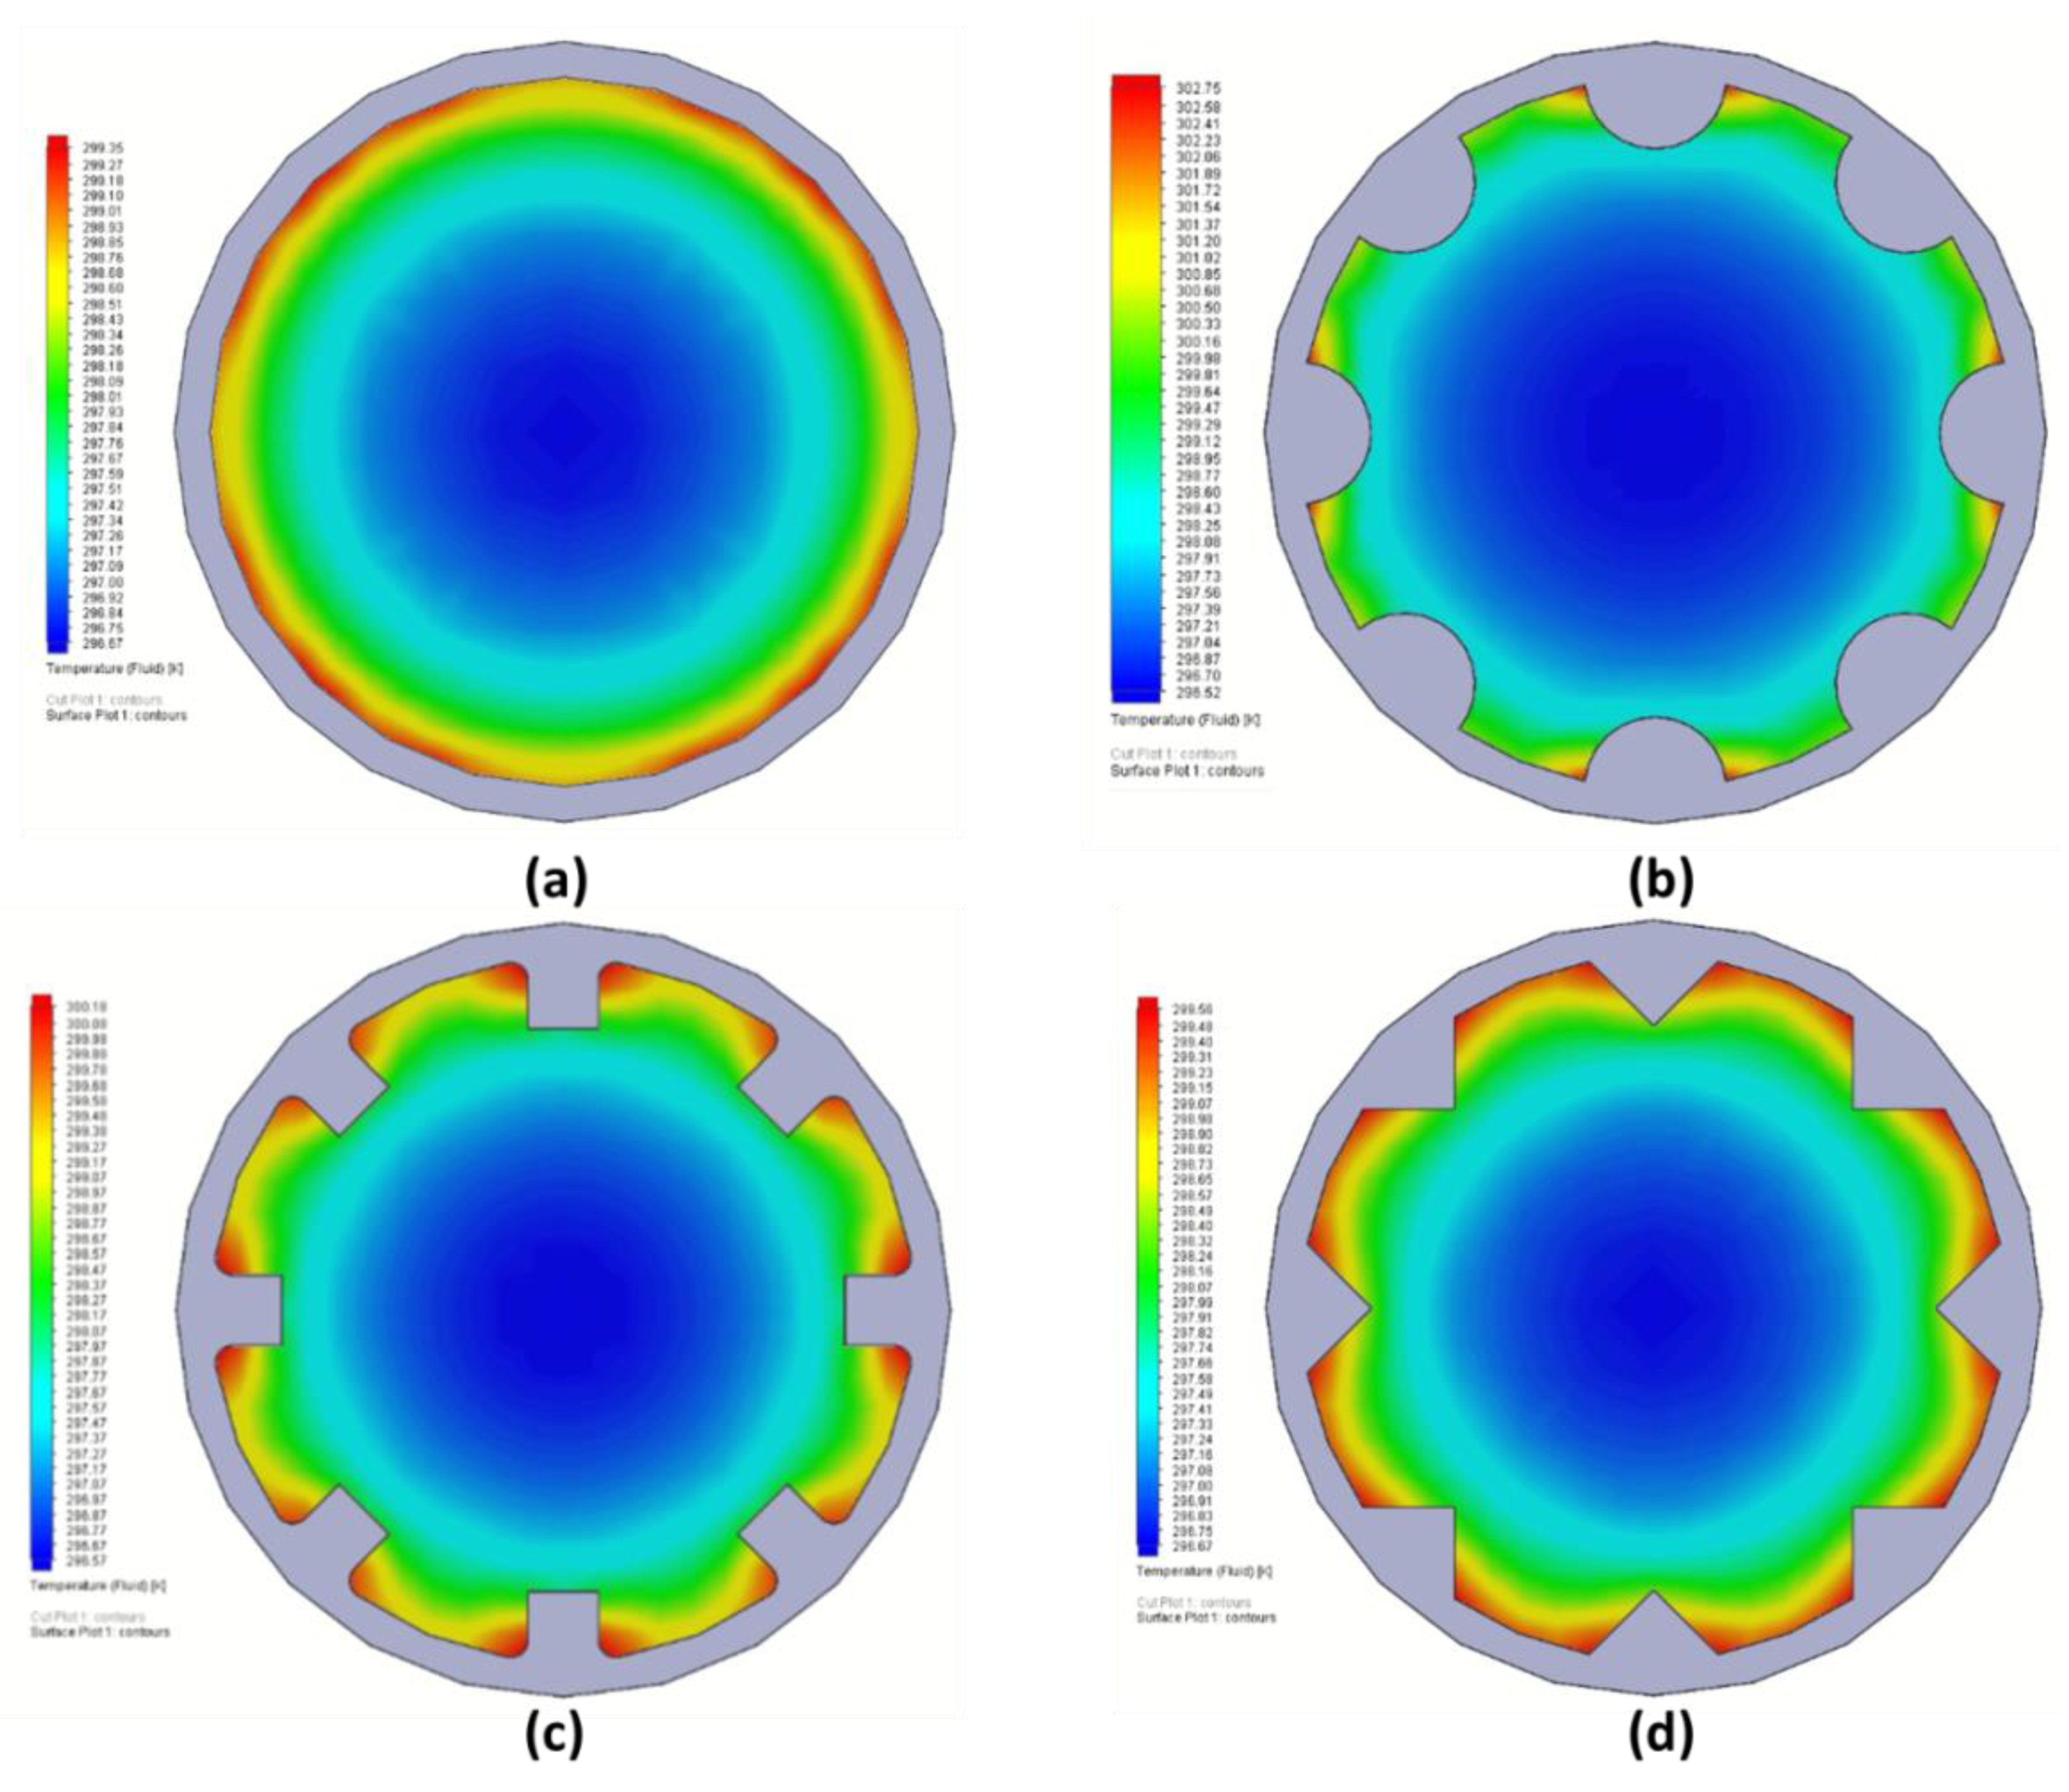
2.1. The Investigated Cases
2.2. Mathematical Formulation
2.3. Developed Model
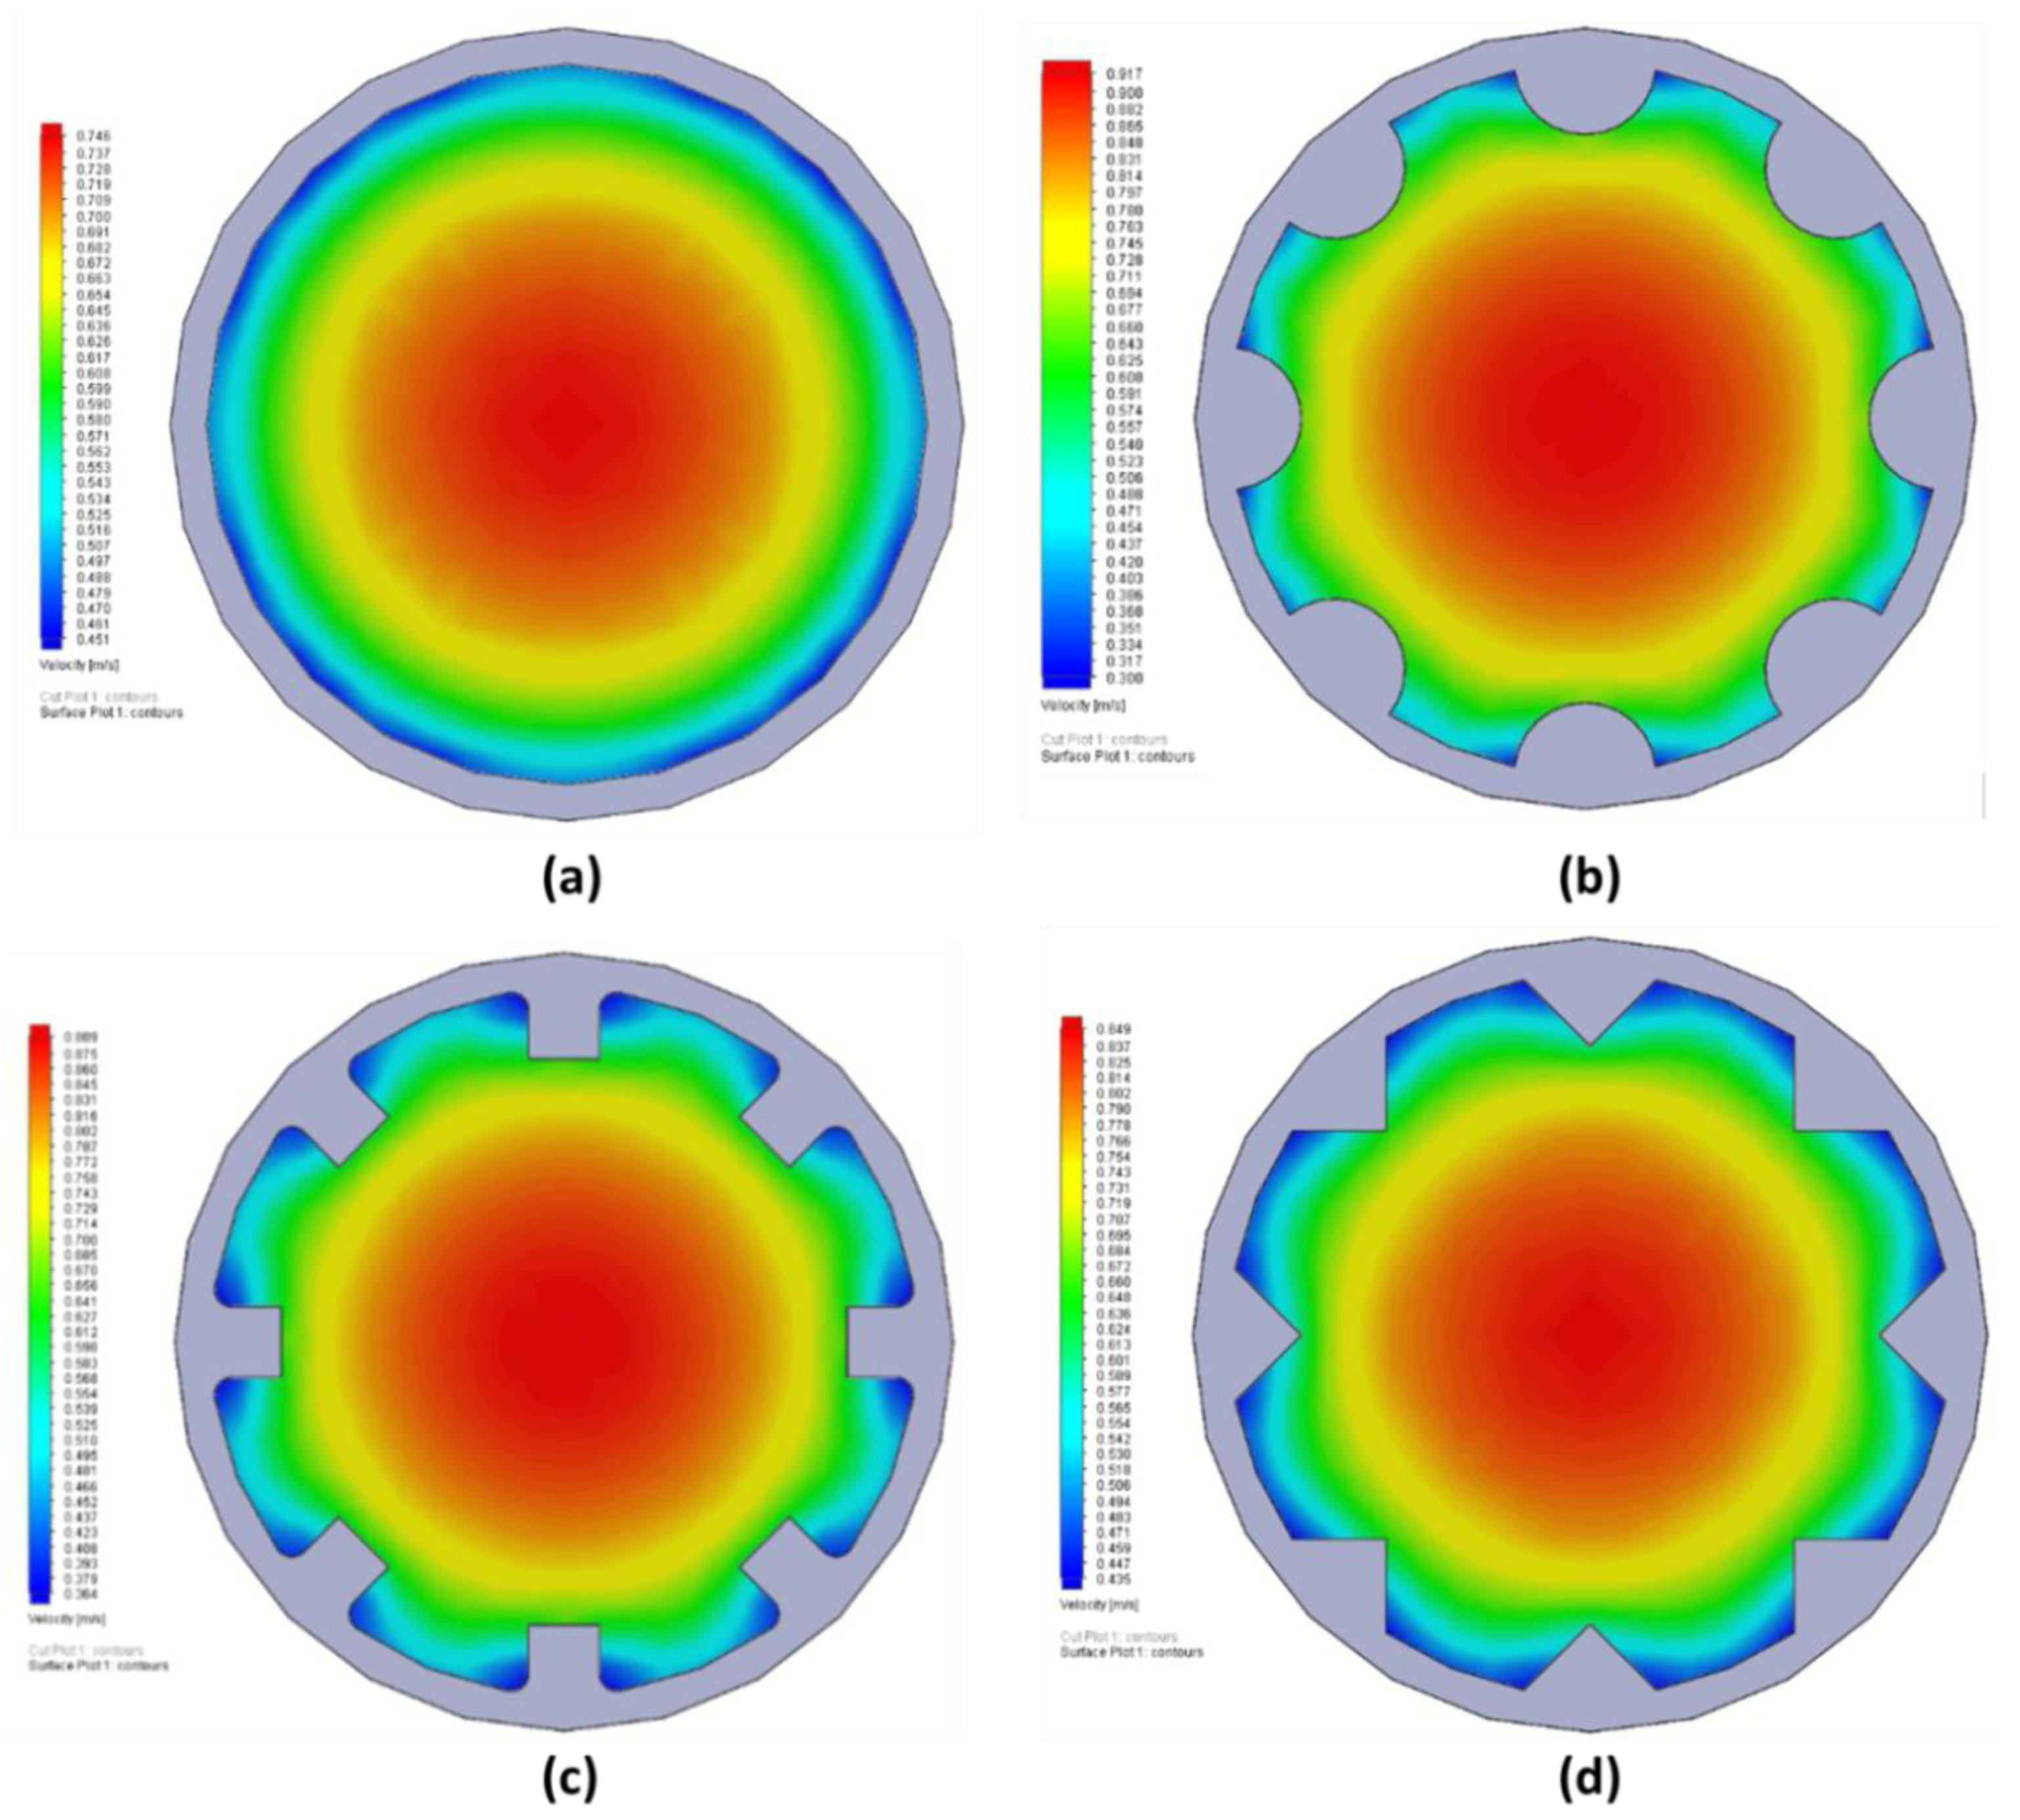
- (a)
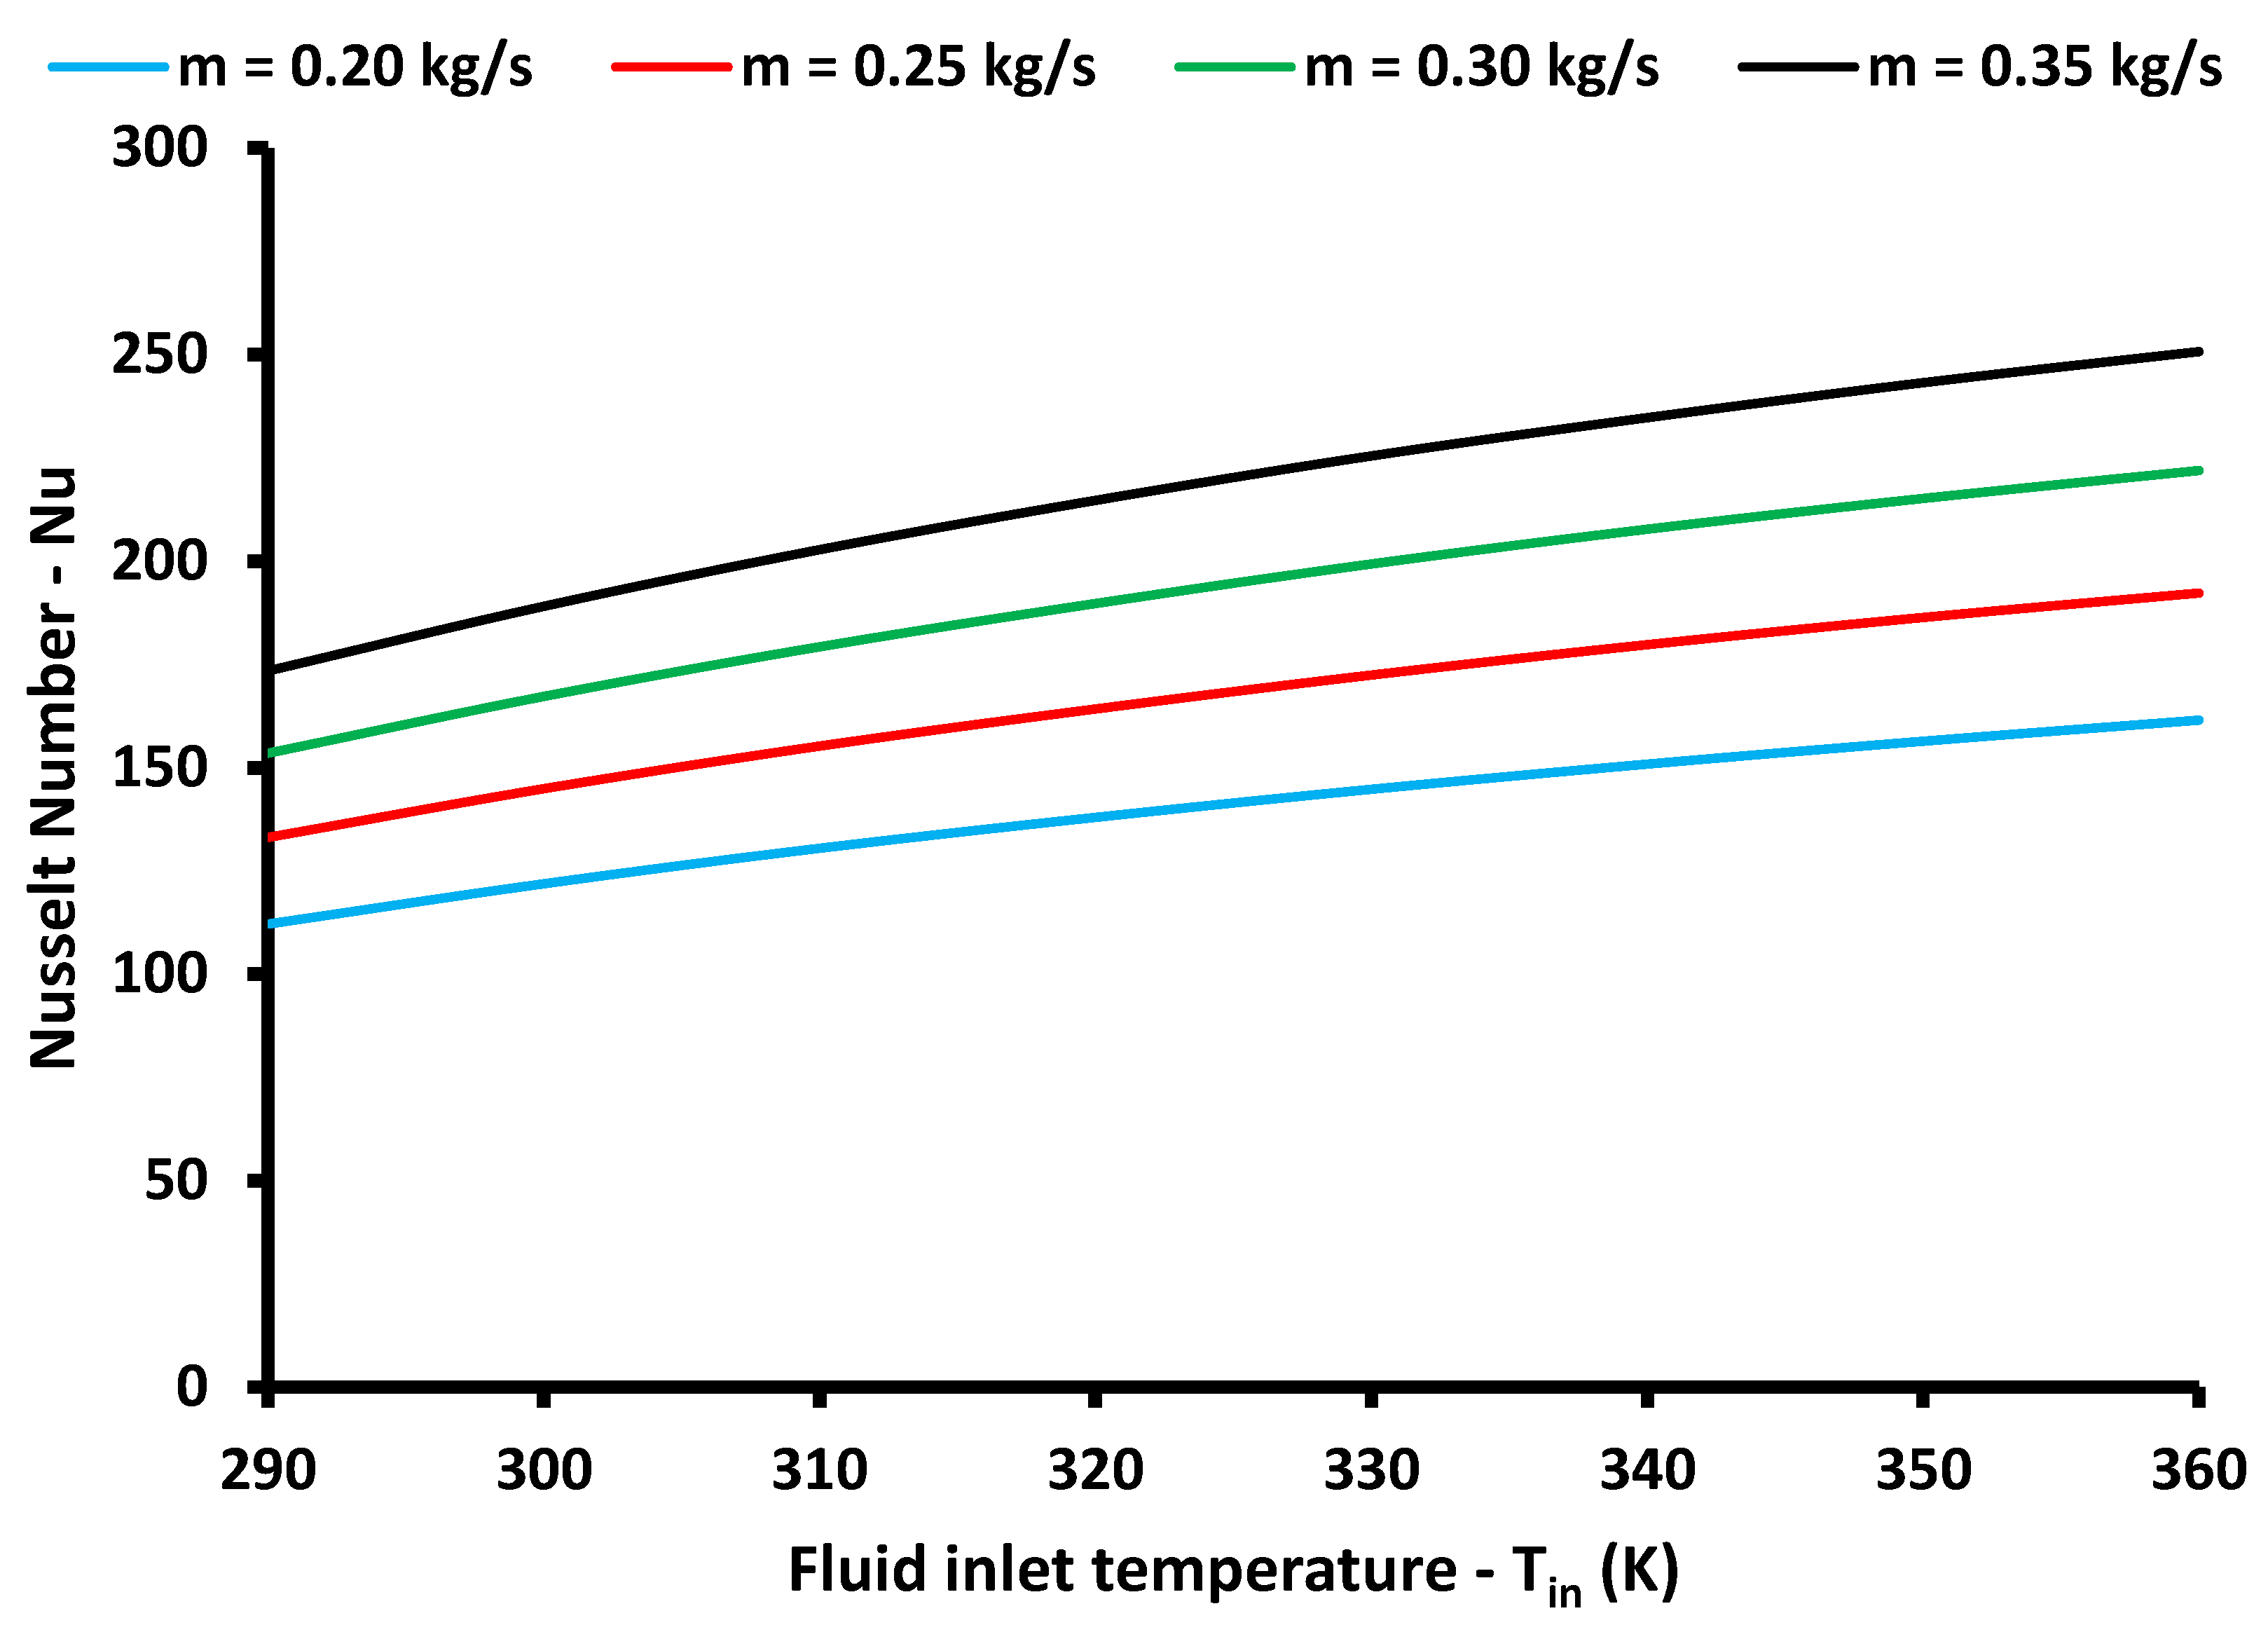
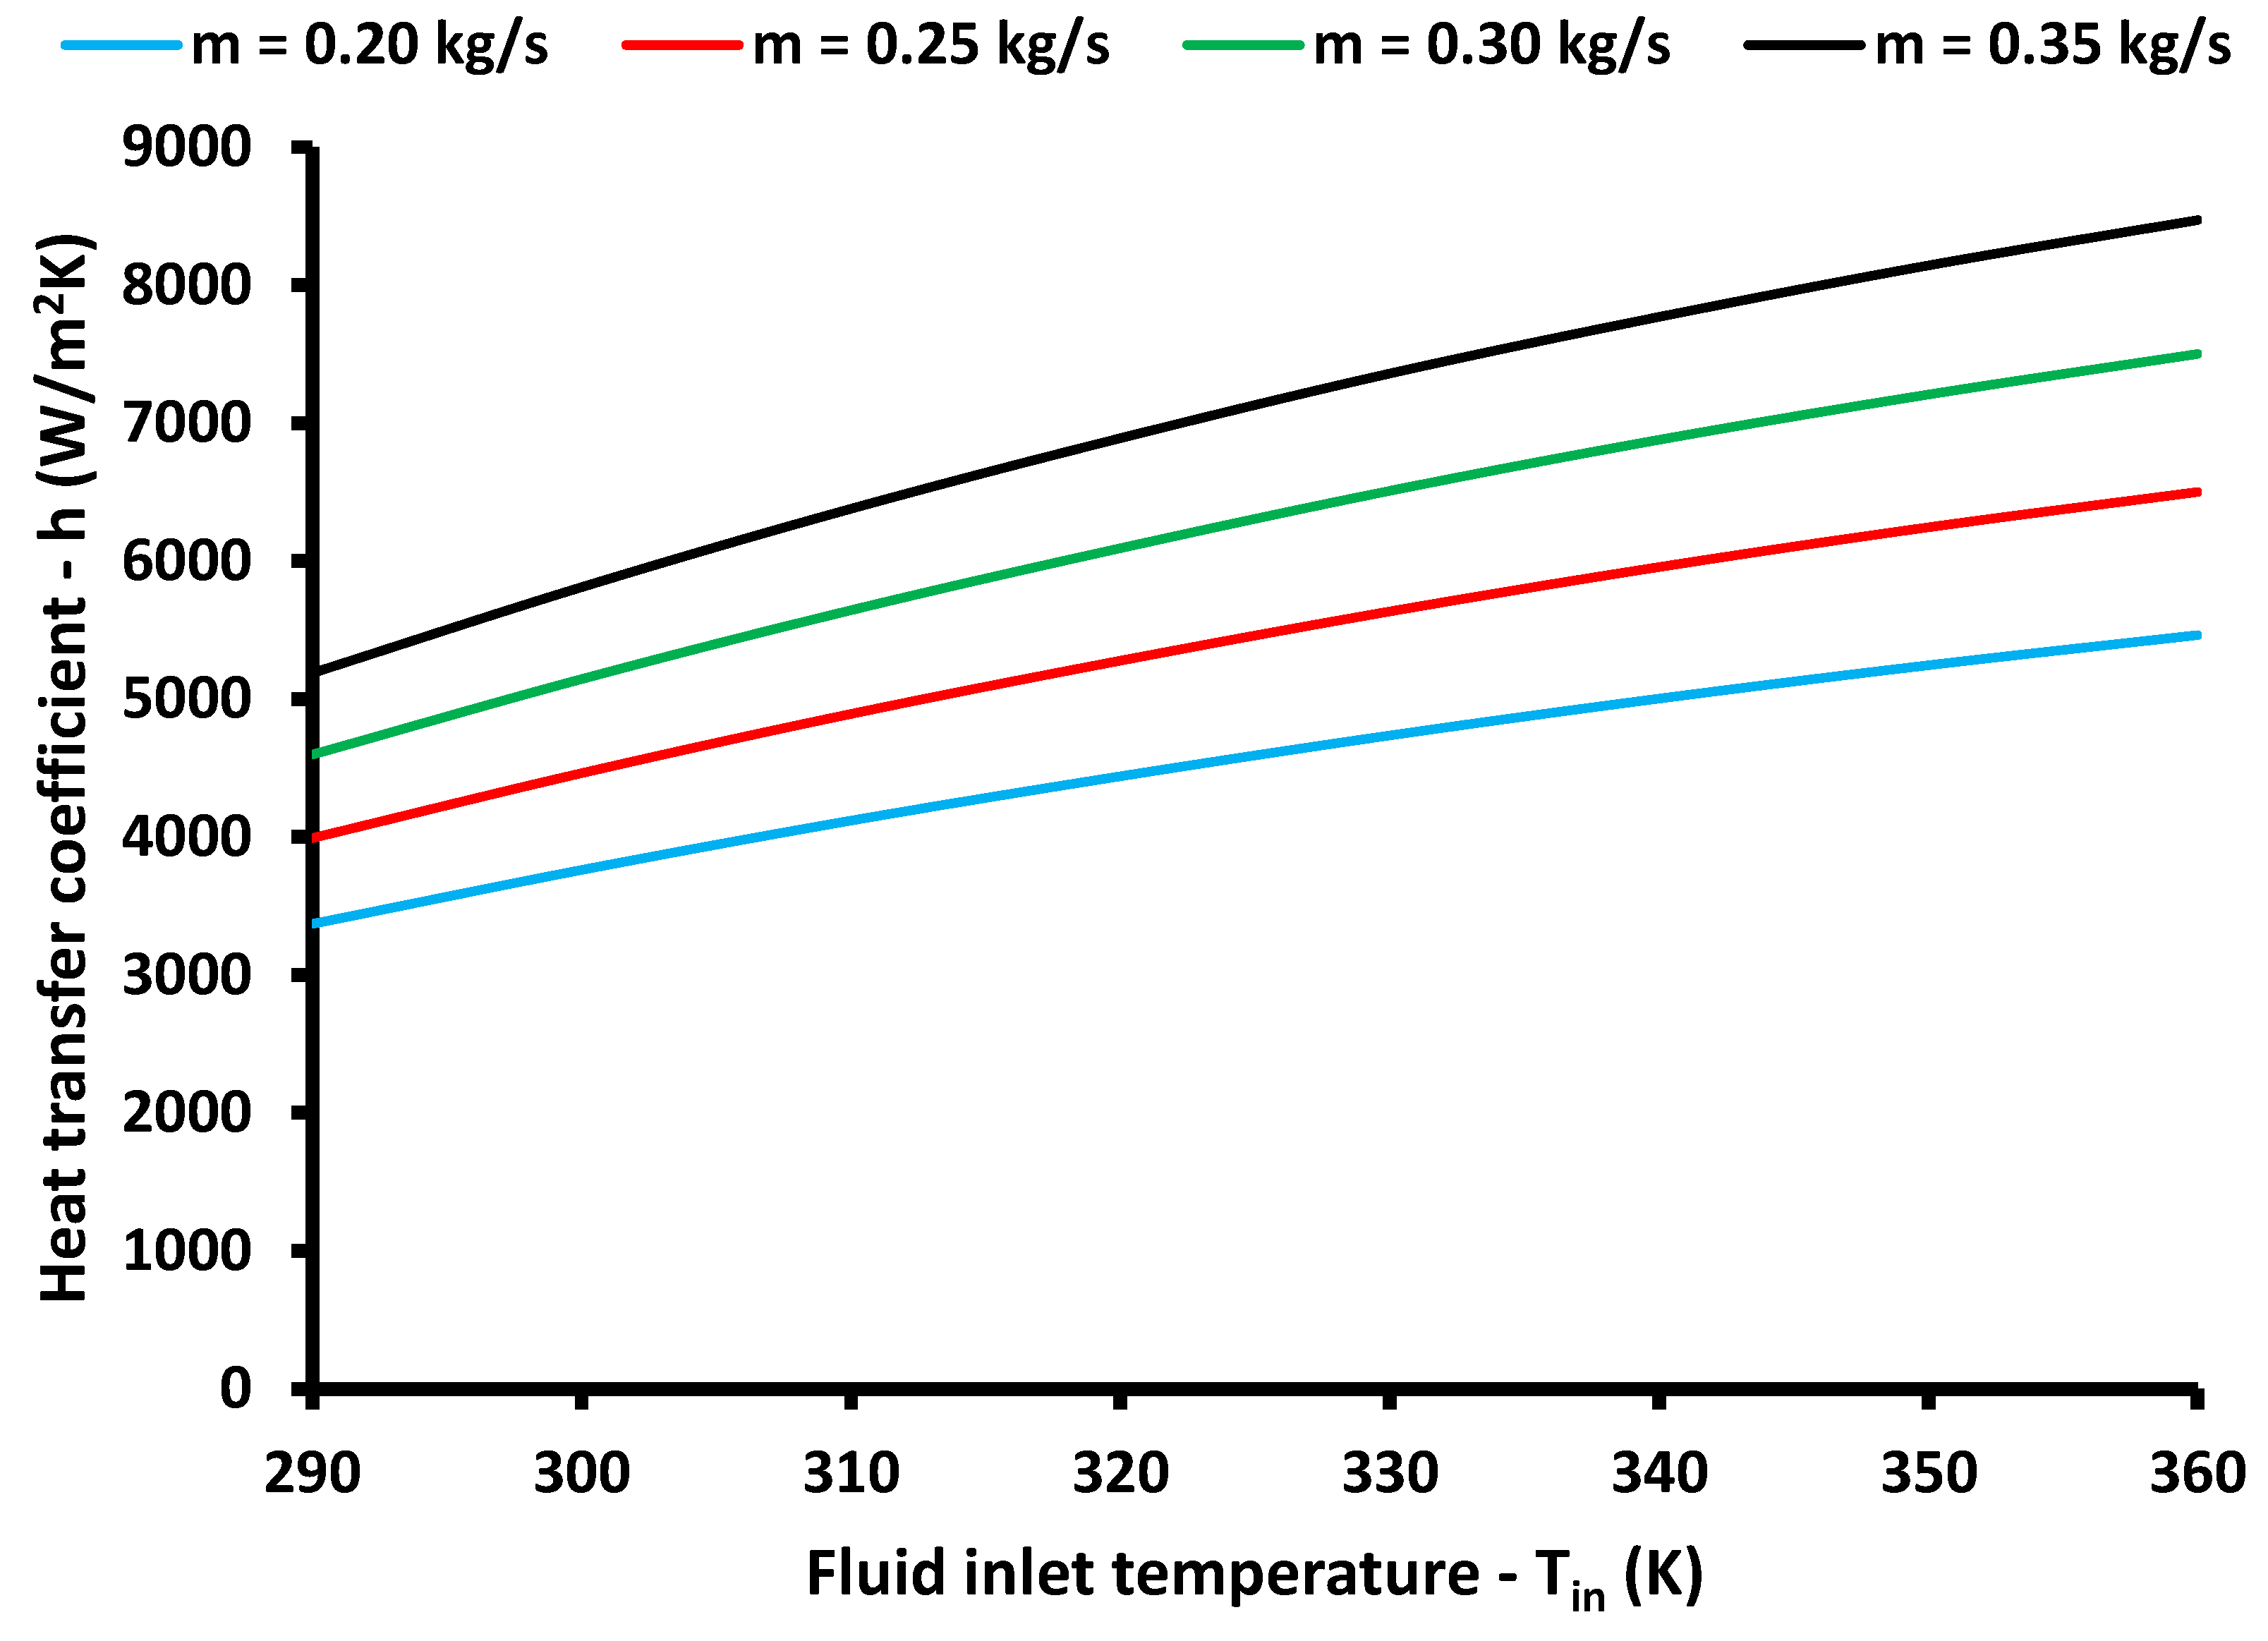
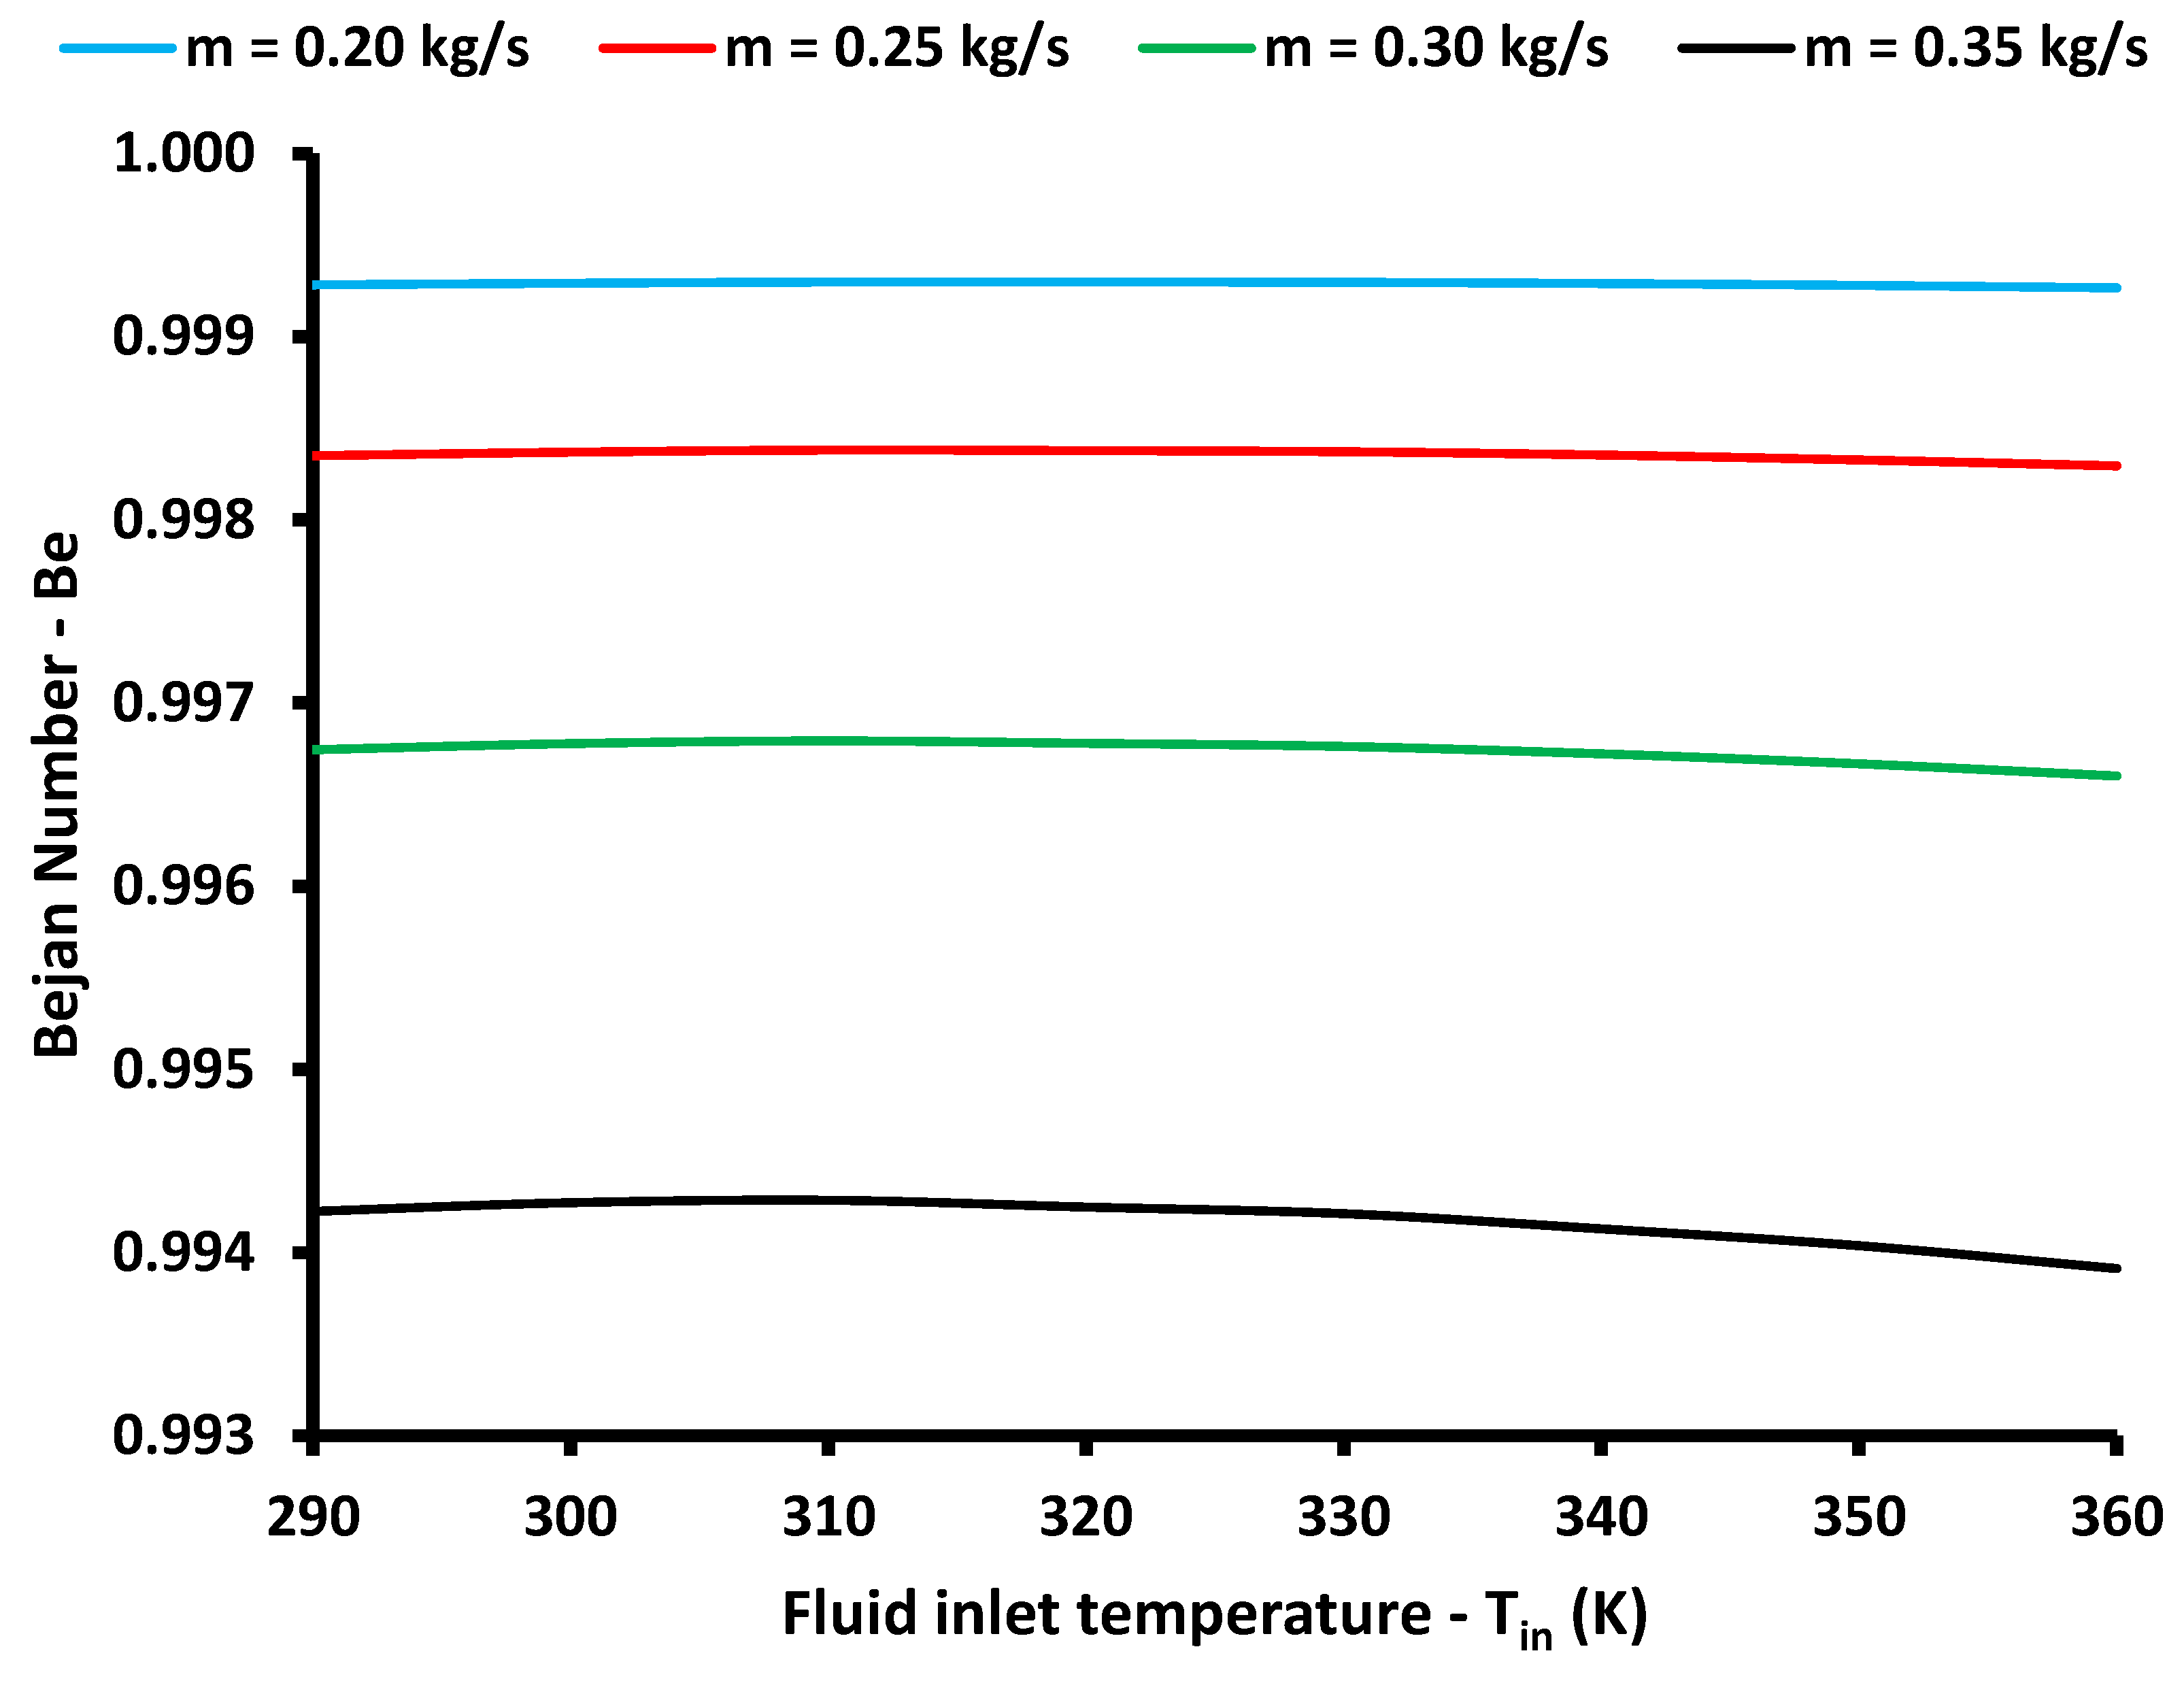
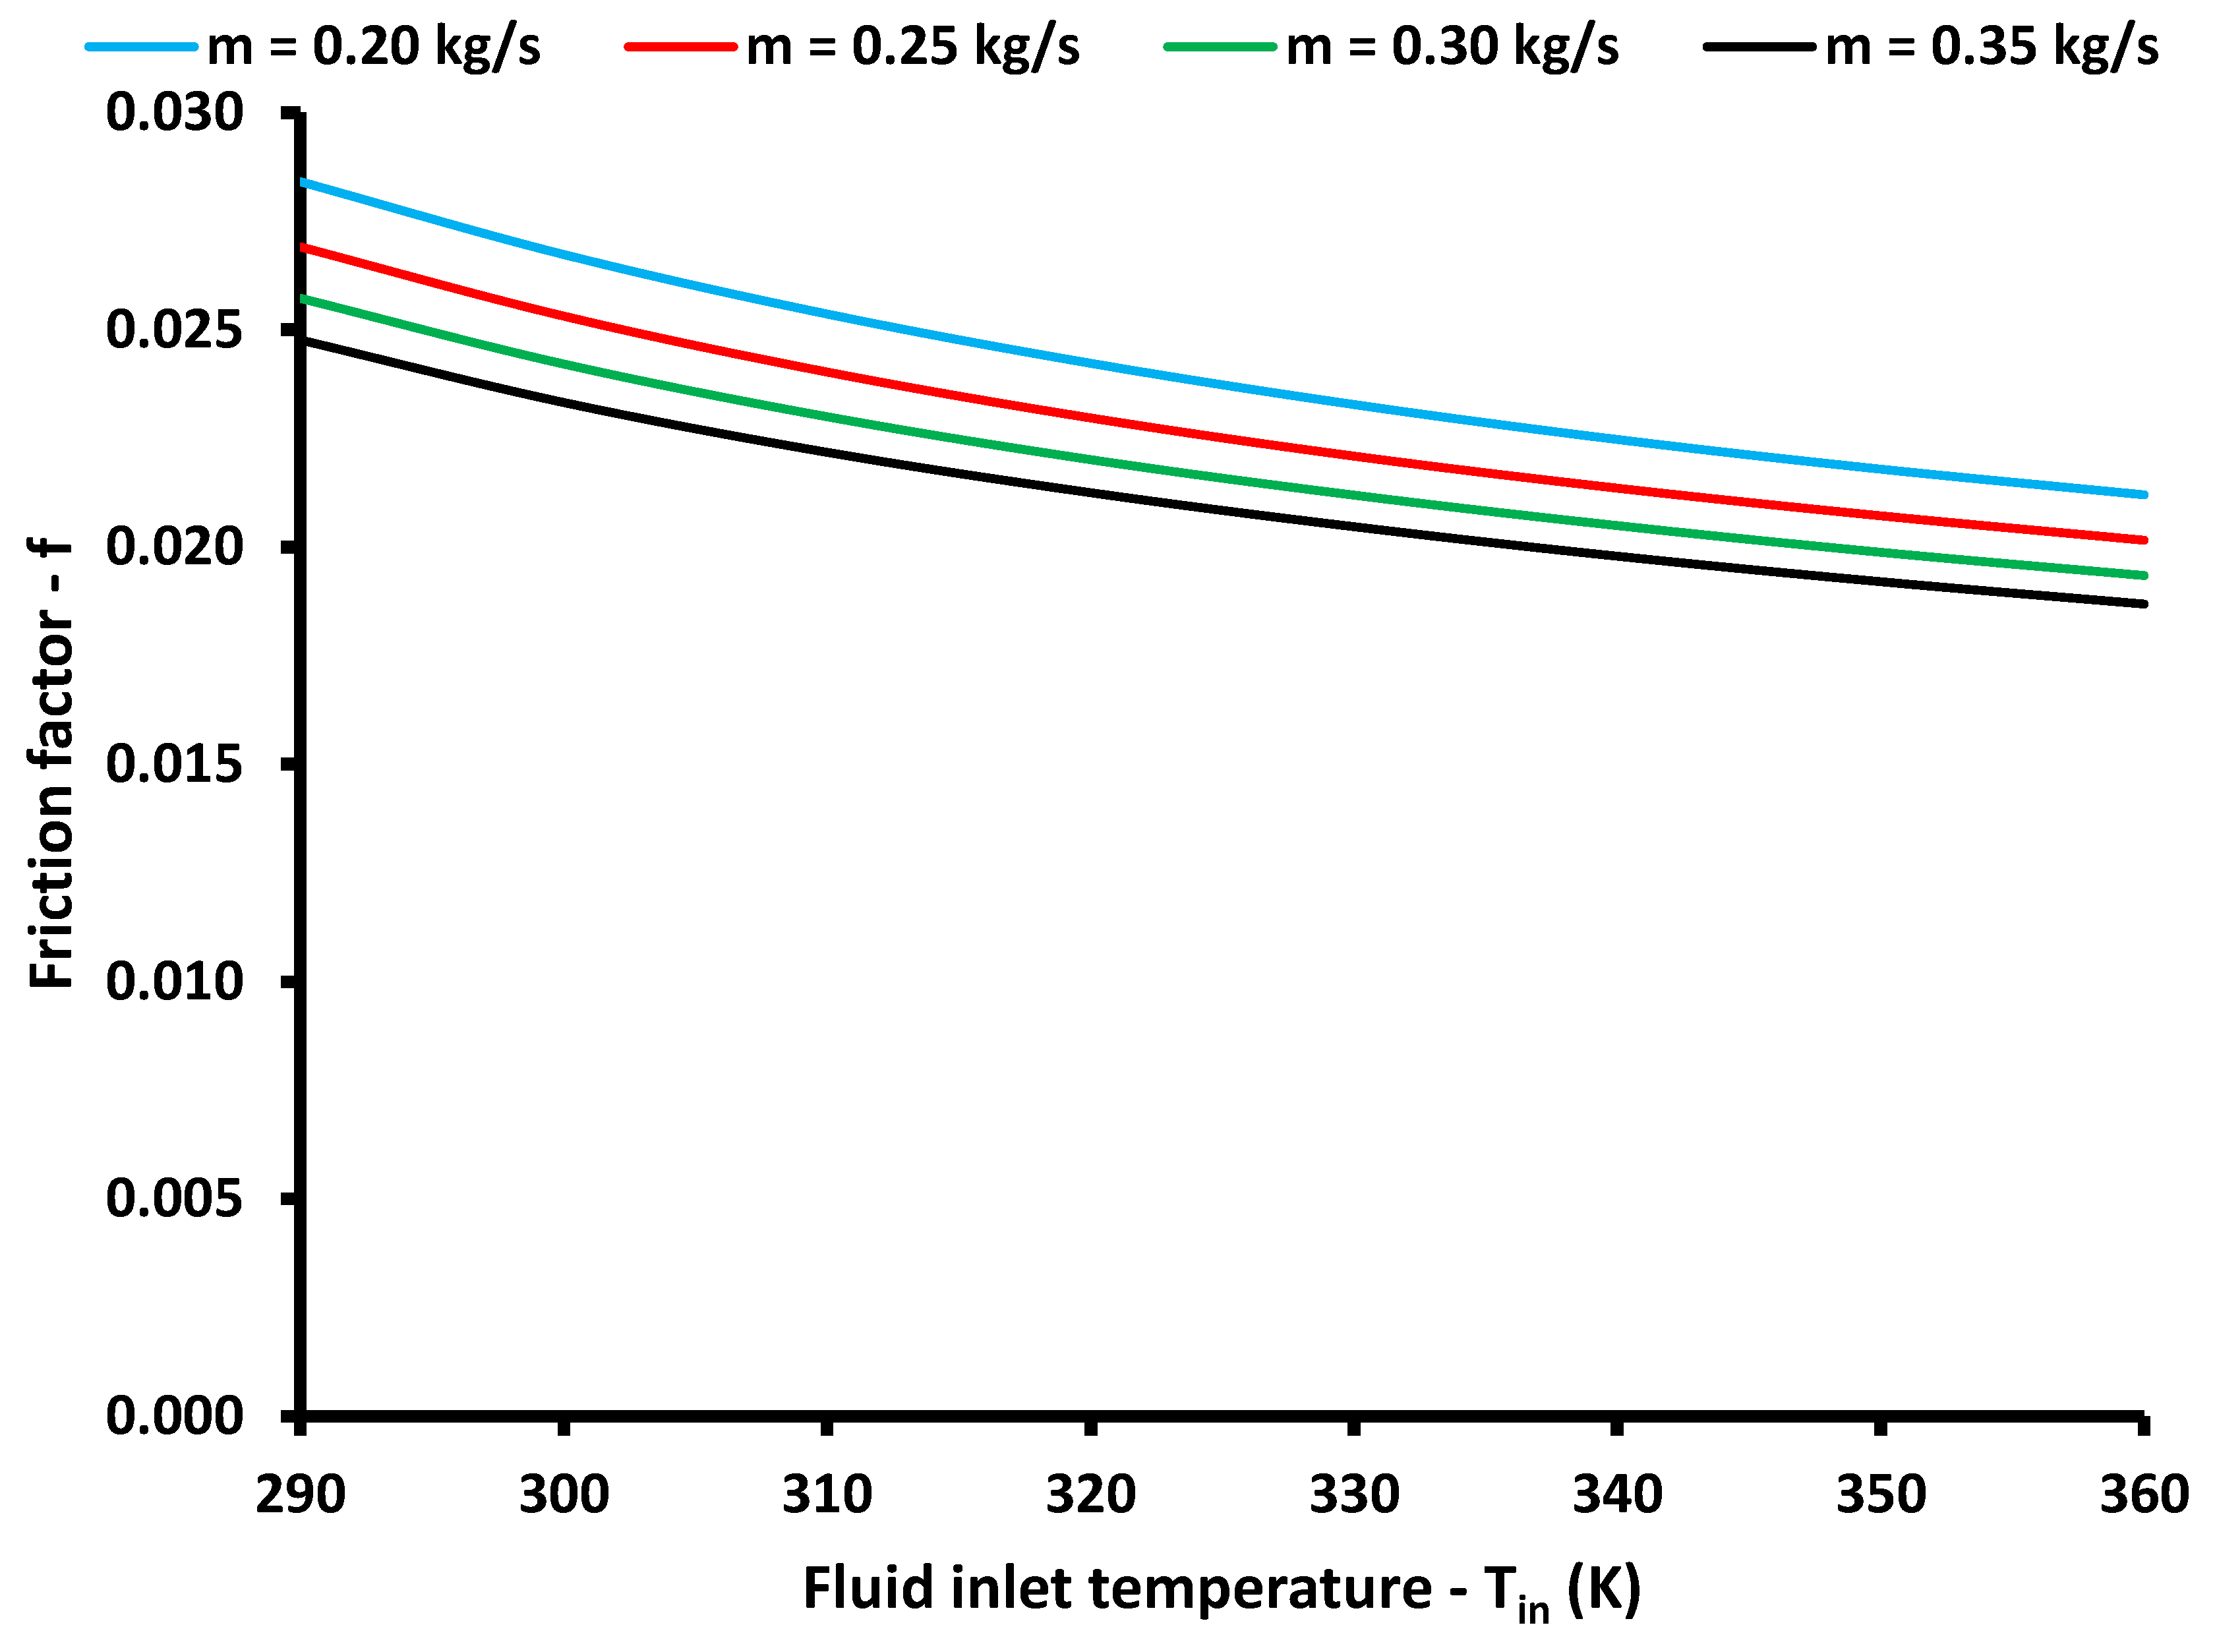
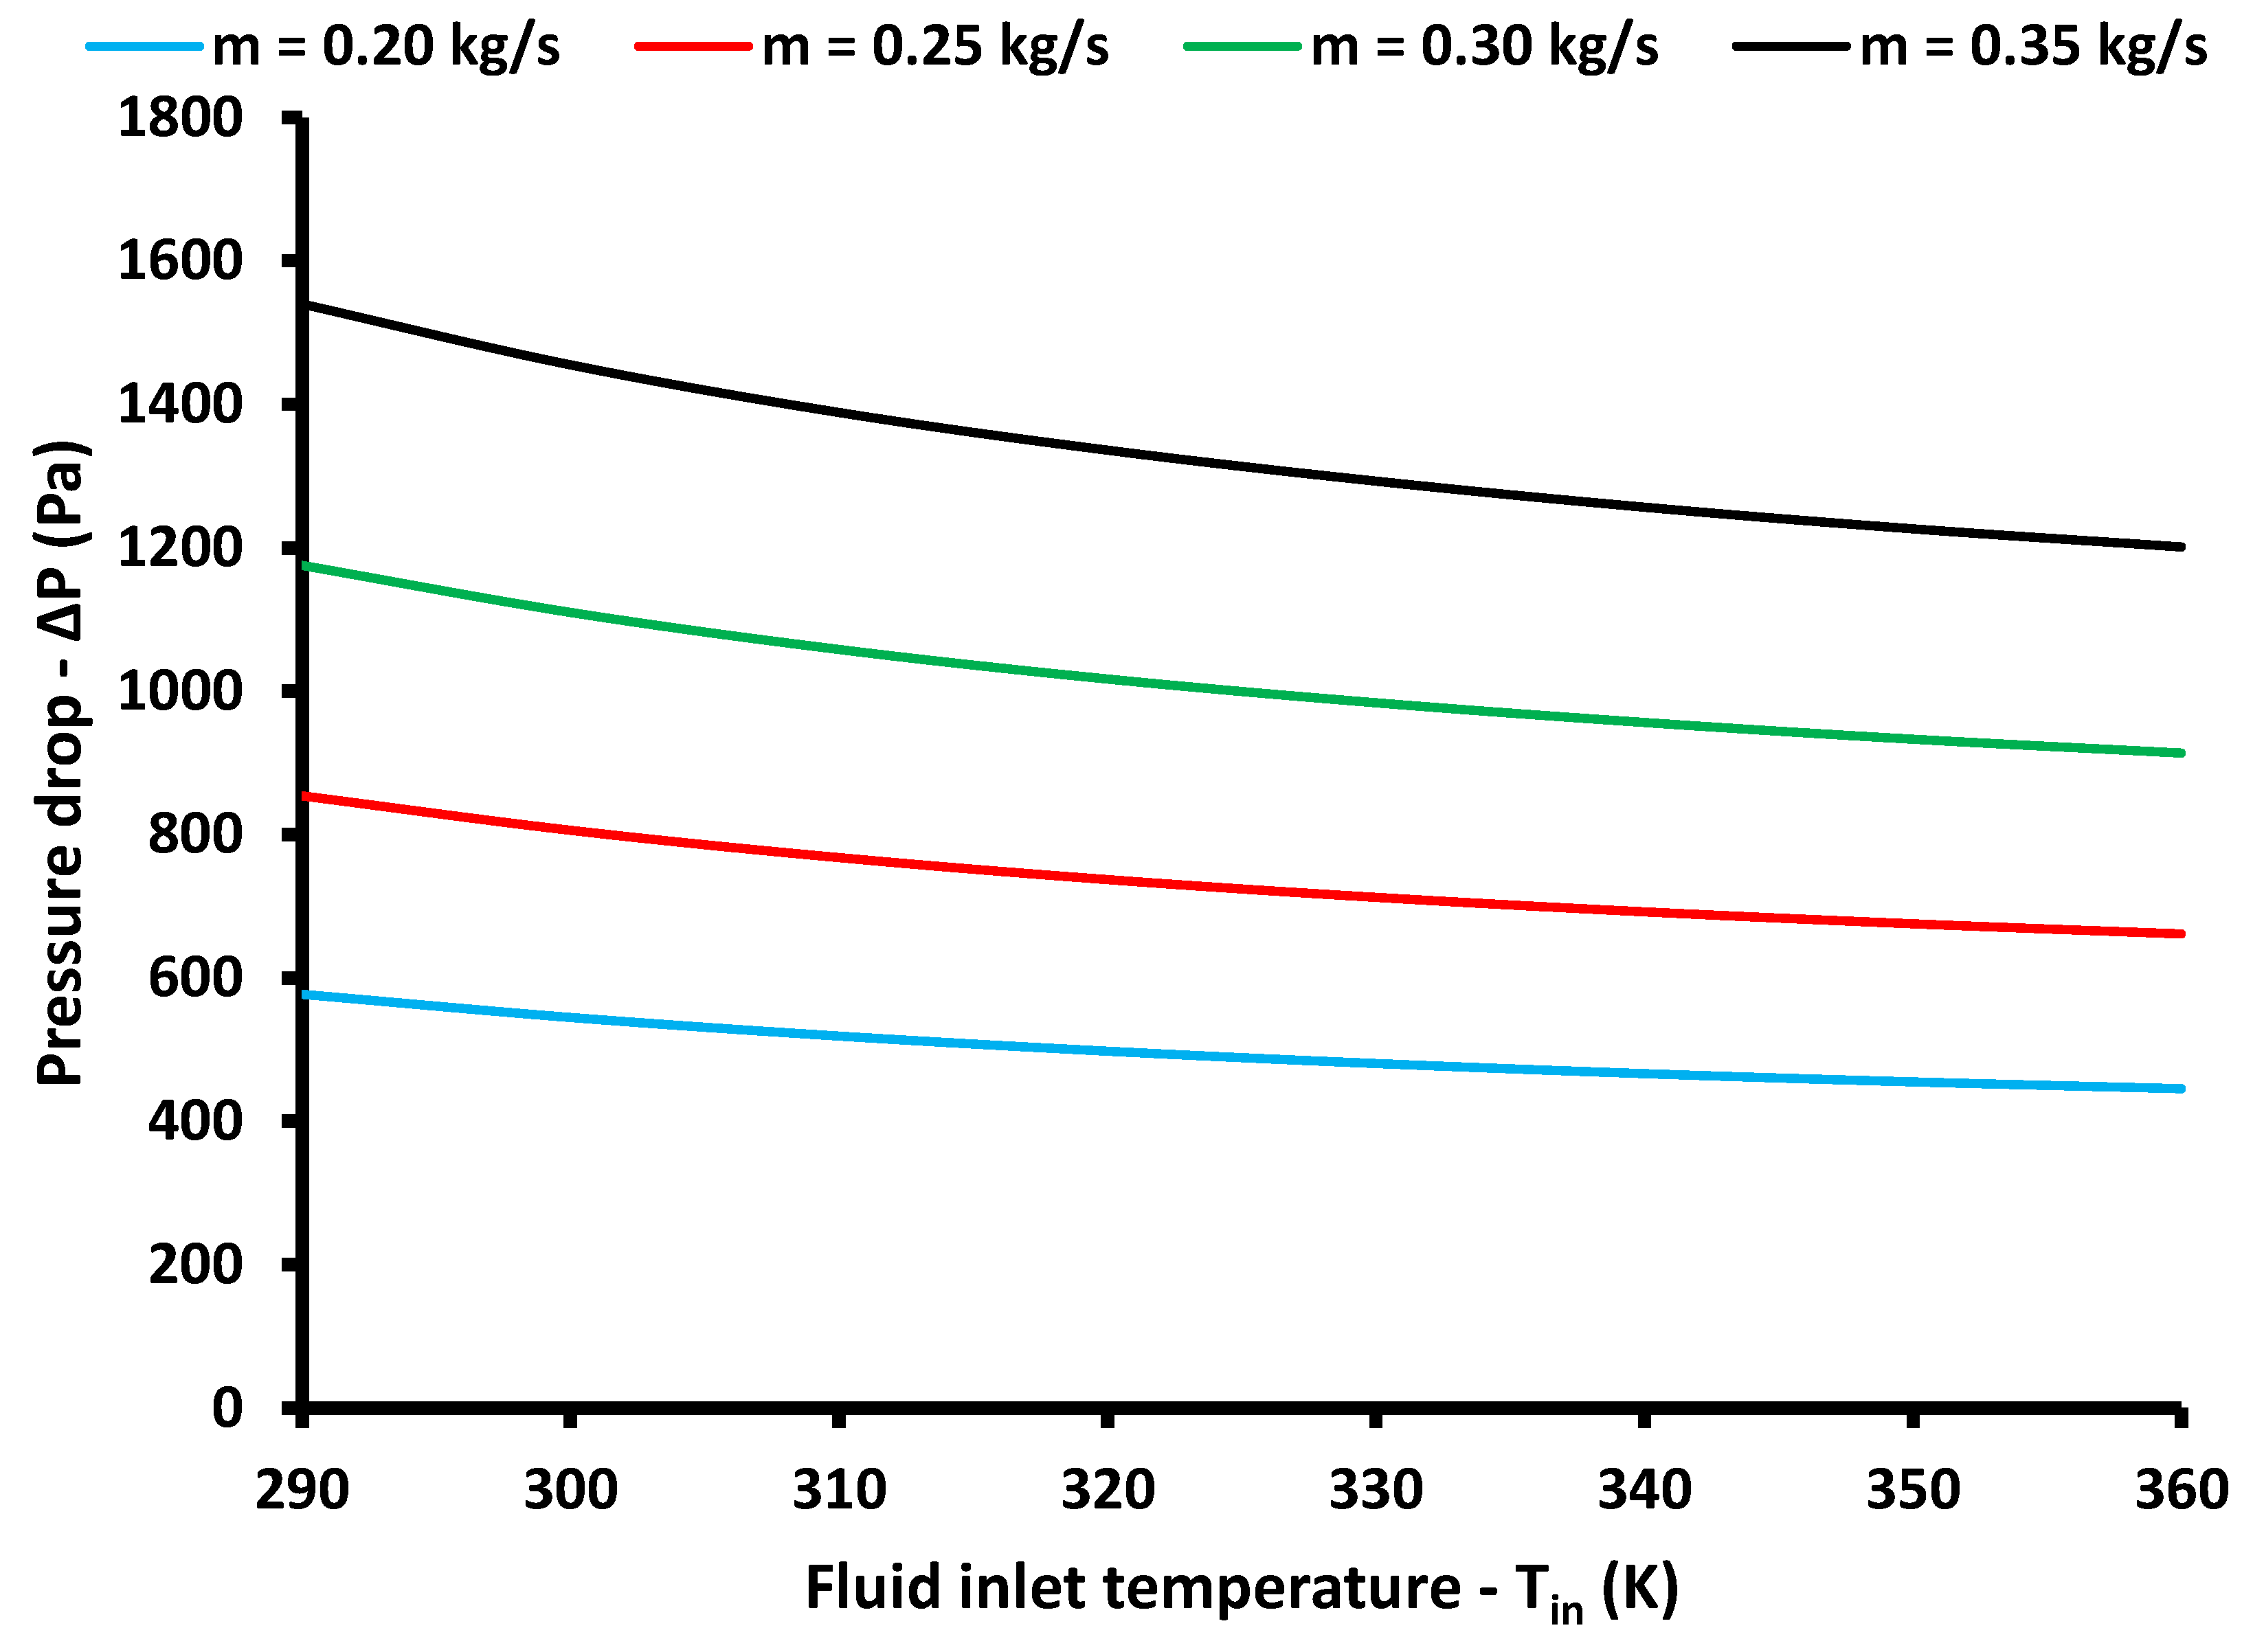
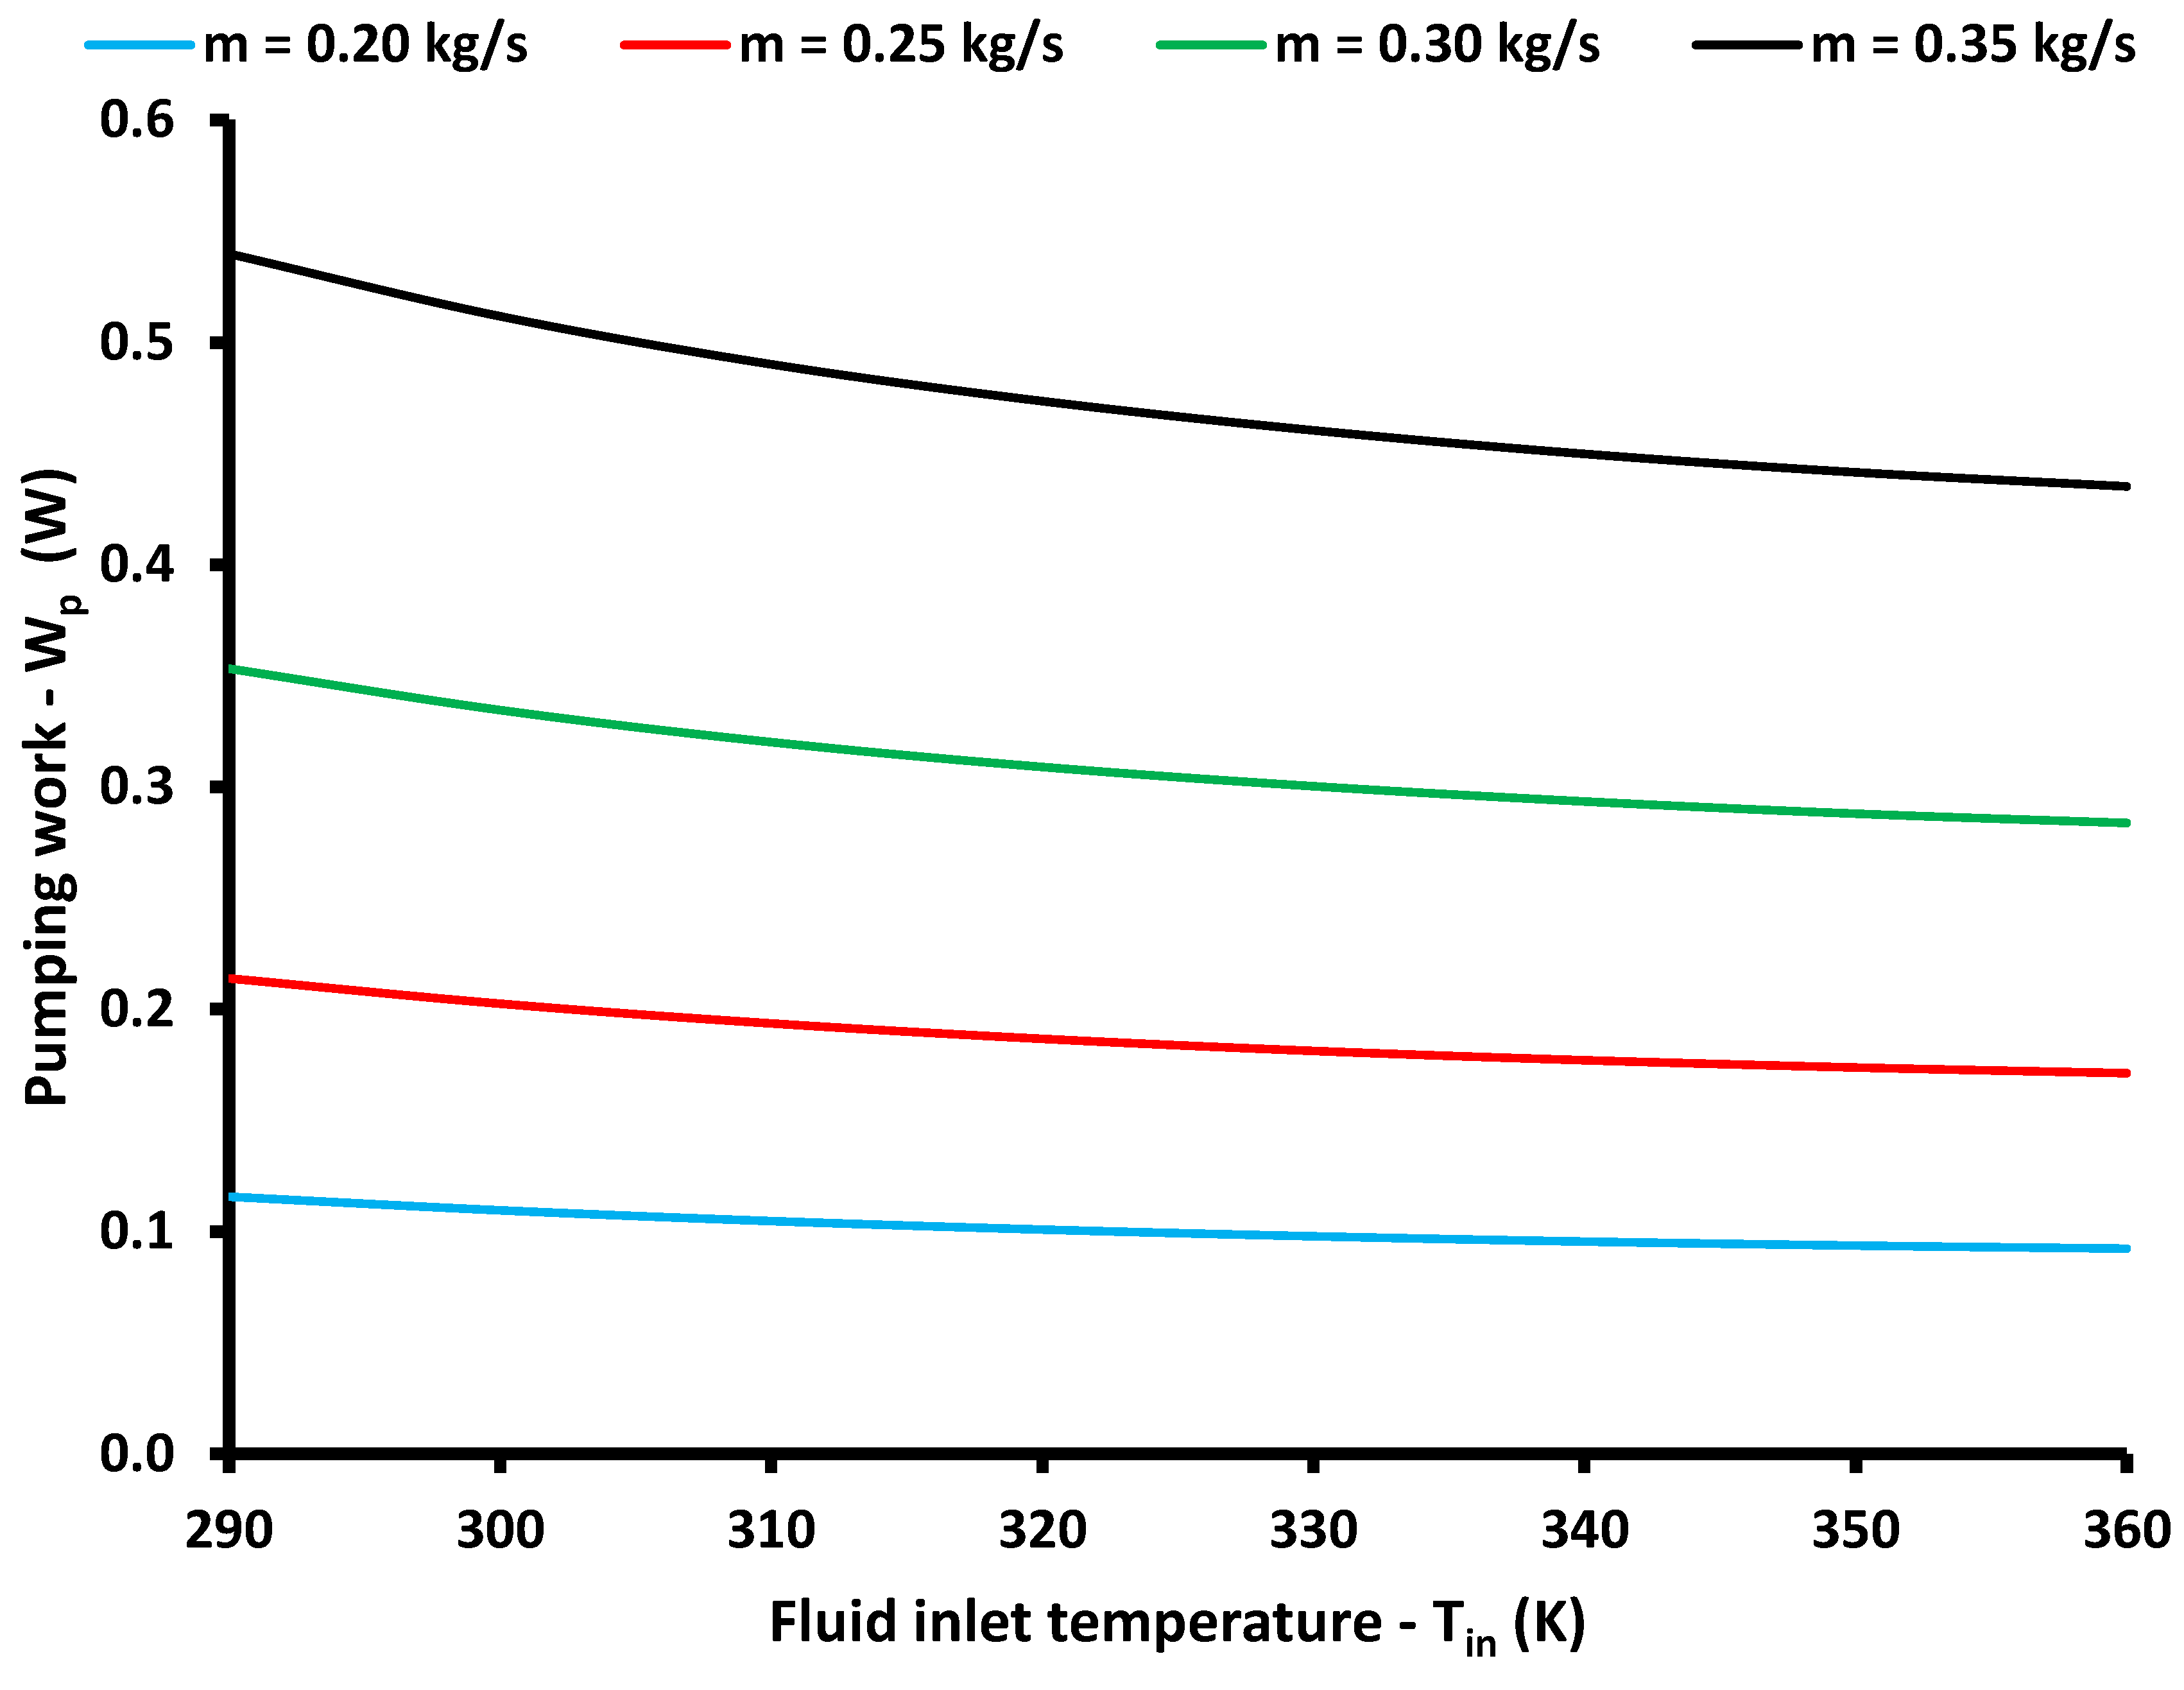
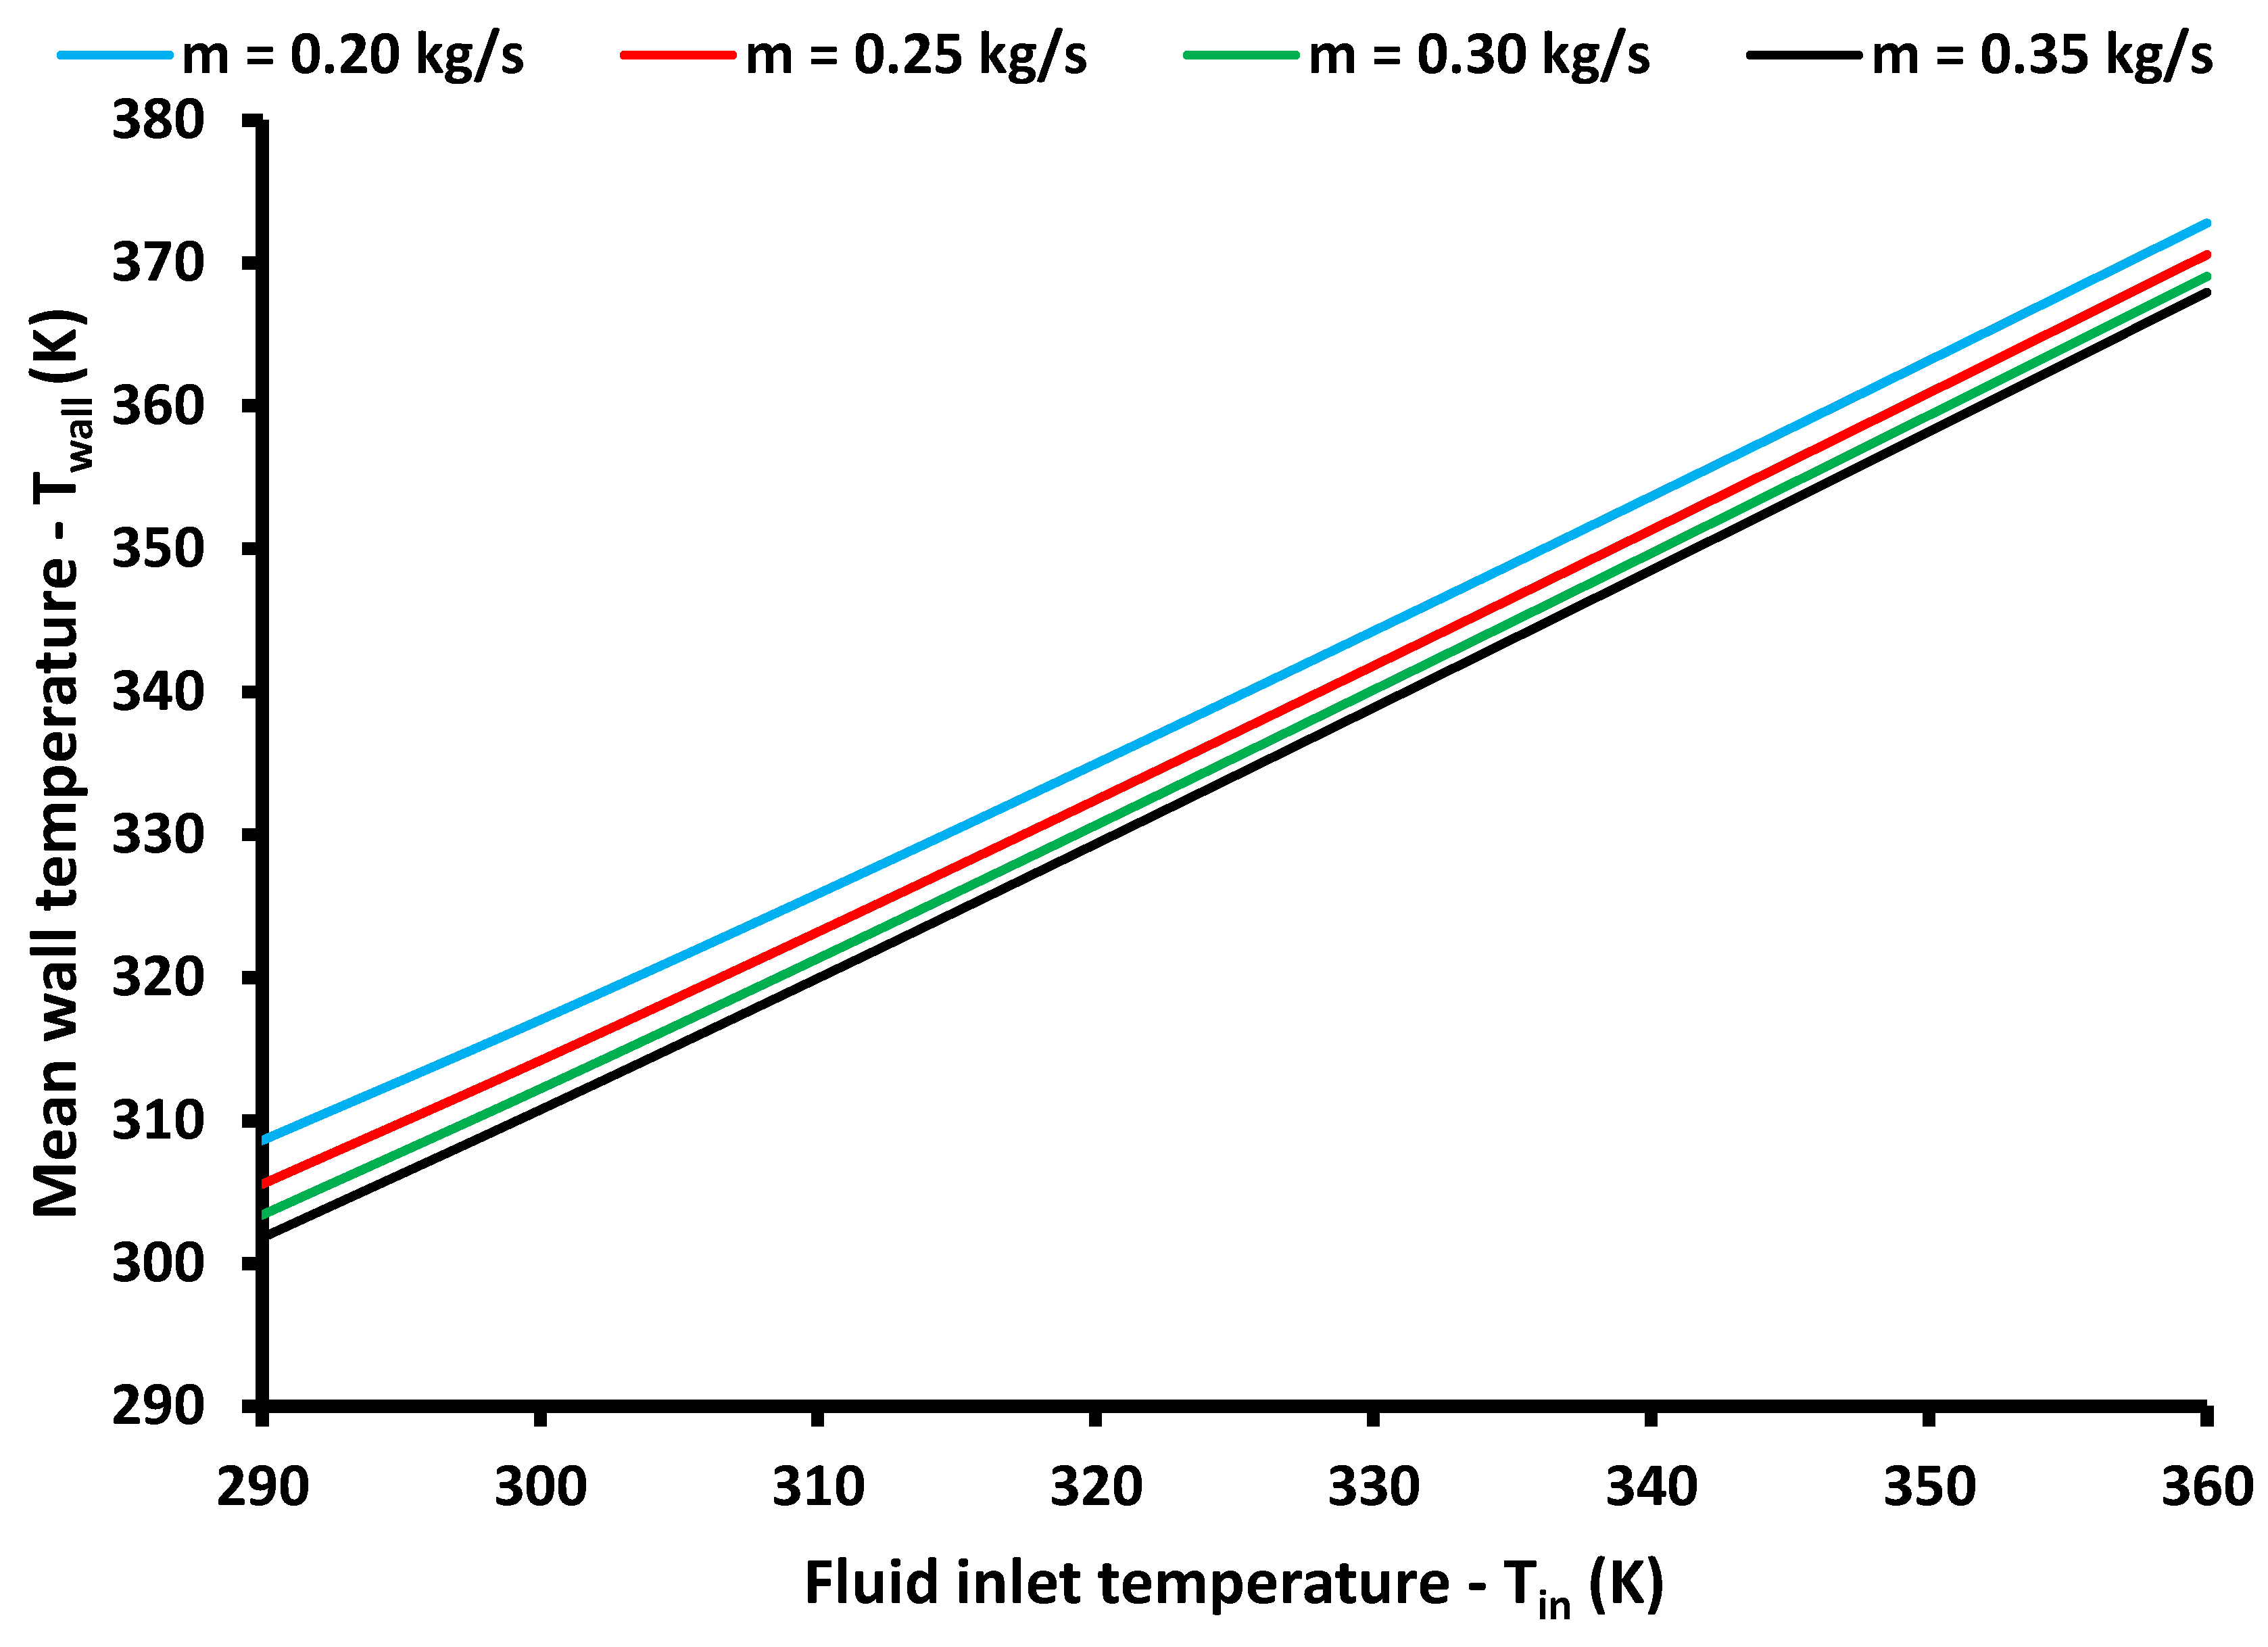
- The mass flow rate in the inlet () was set from 0.20 kg/s up to 0.35 kg/s with step 0.05 kg/s. Moreover, the flow is selected to be fully developed.
- (b)
- The inlet fluid temperature (Tin) was selected to be ranged from 290 K up to 360 K with a step of 10 K.
- (c)
- The outlet pressure was set at 4 bar.
- (d)
- The heat input in the internal surface of the tube was set at 6281 W.
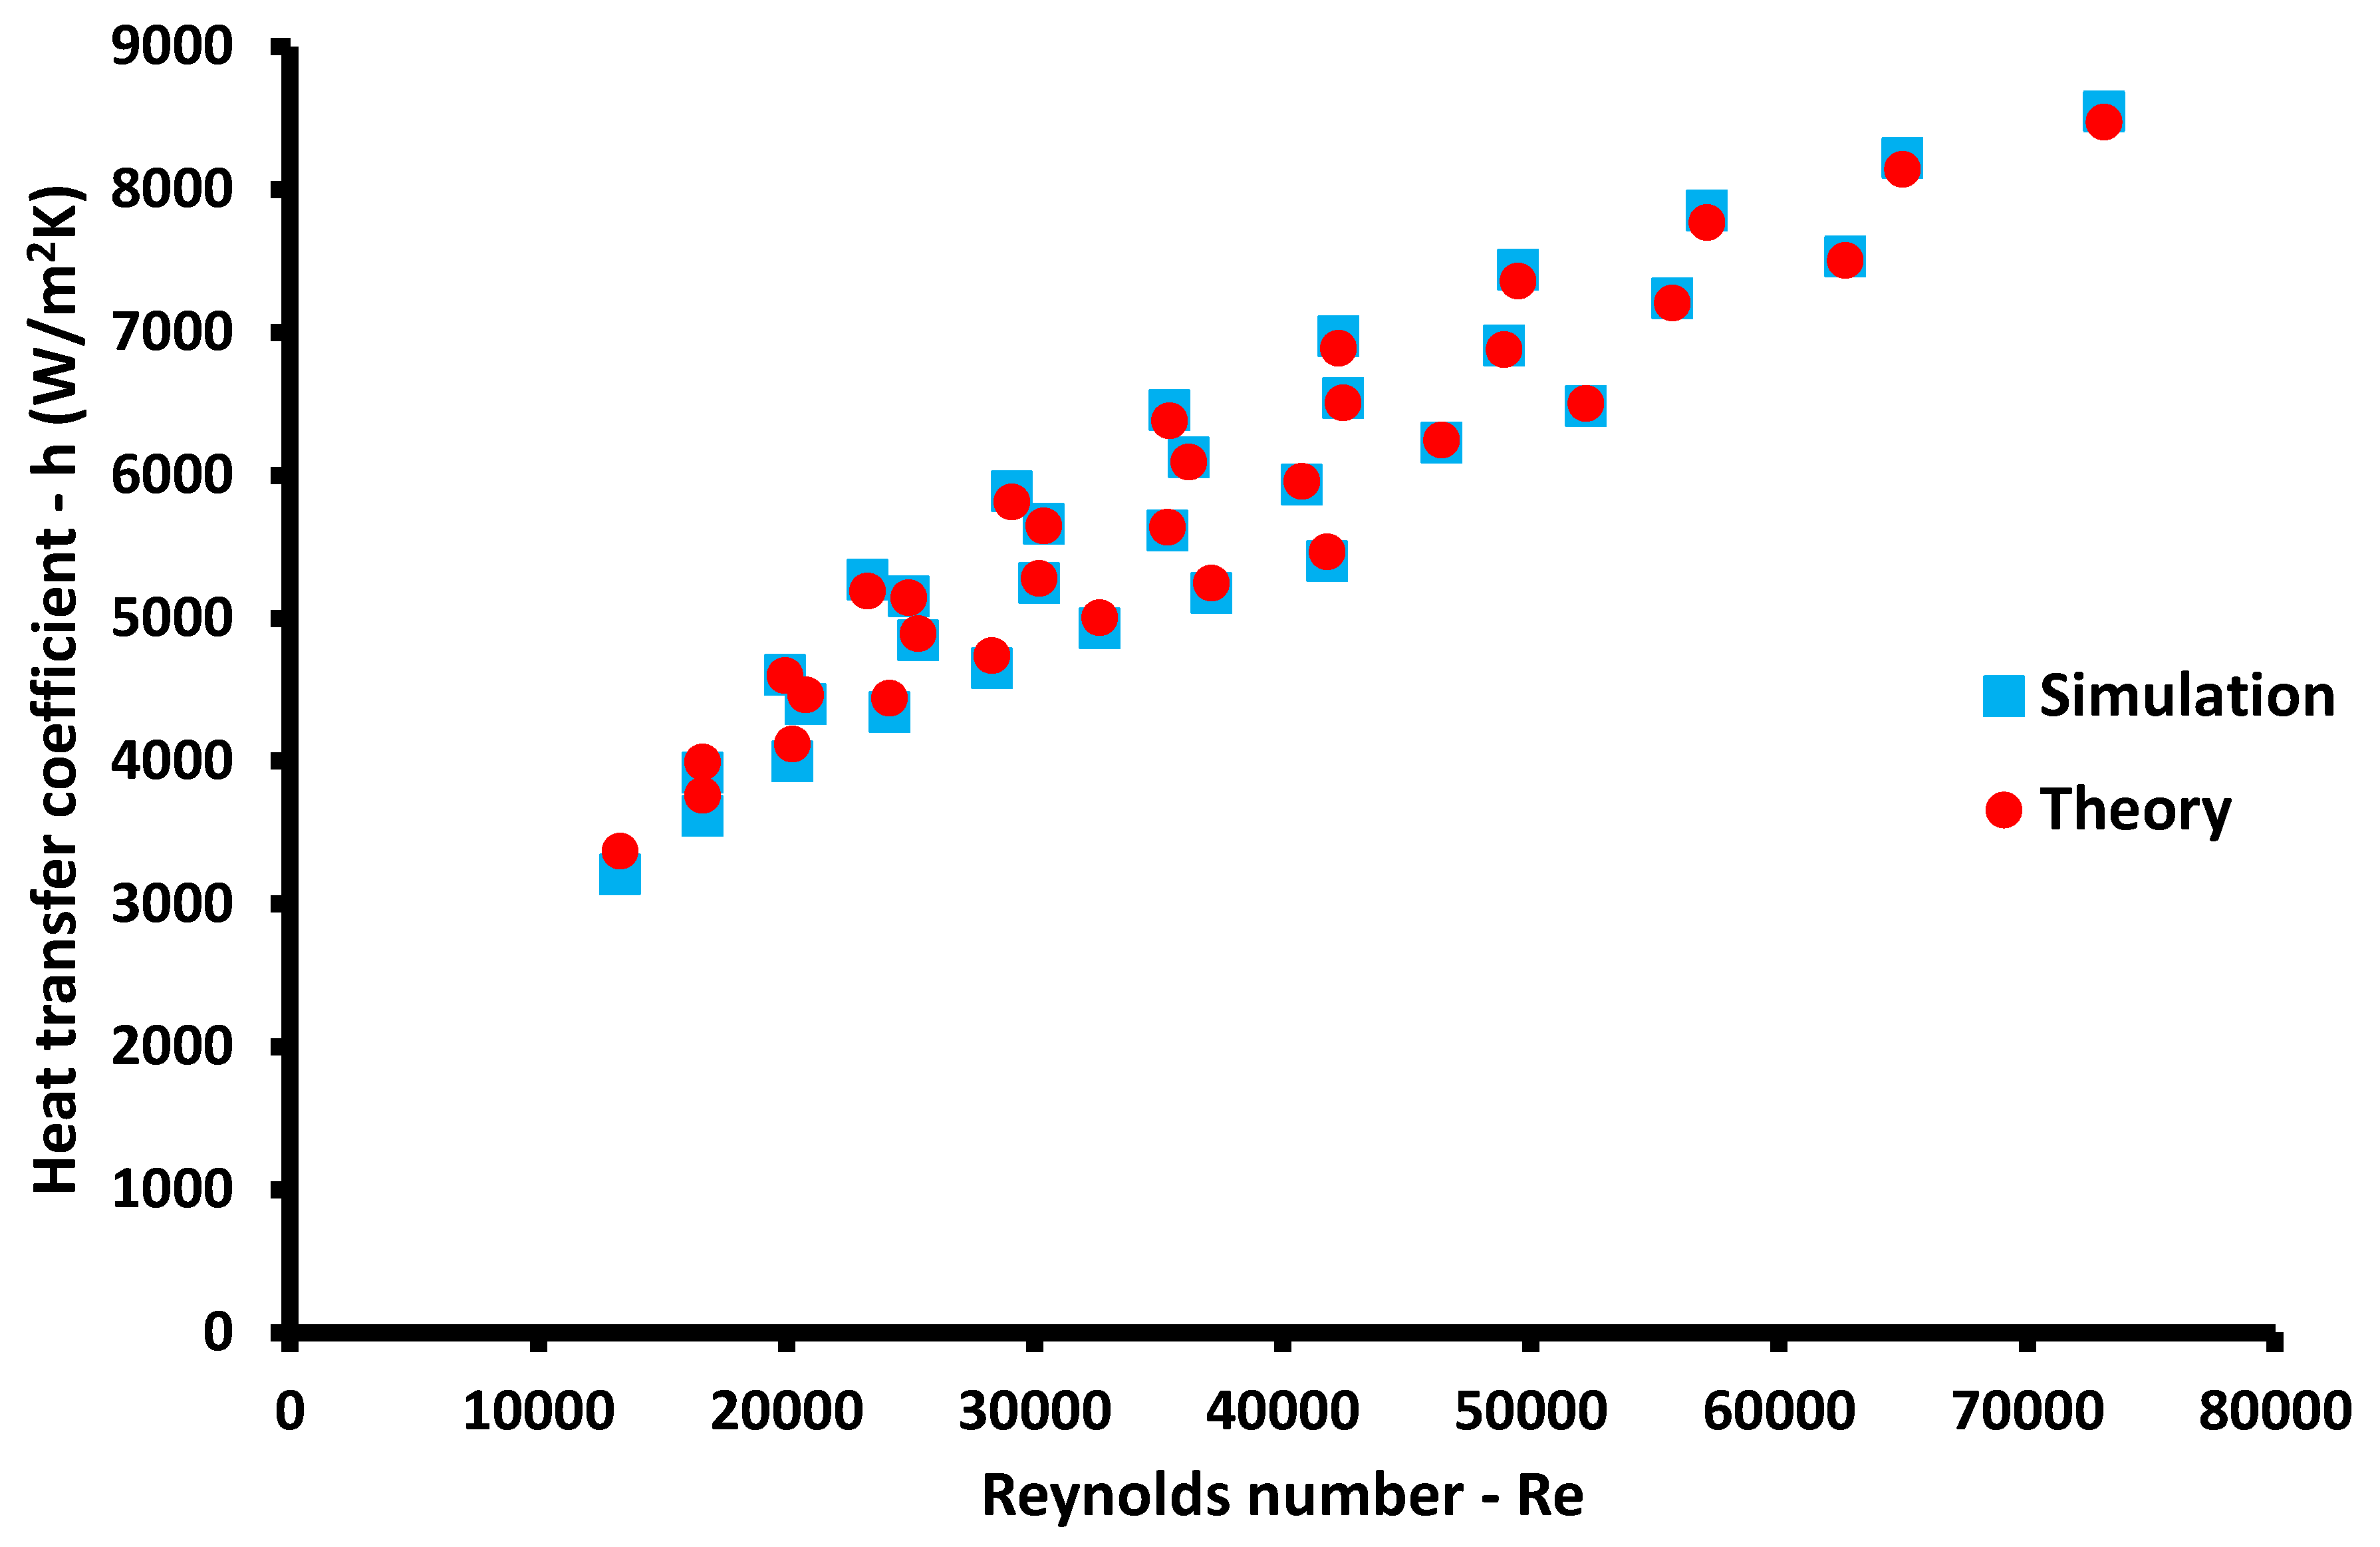
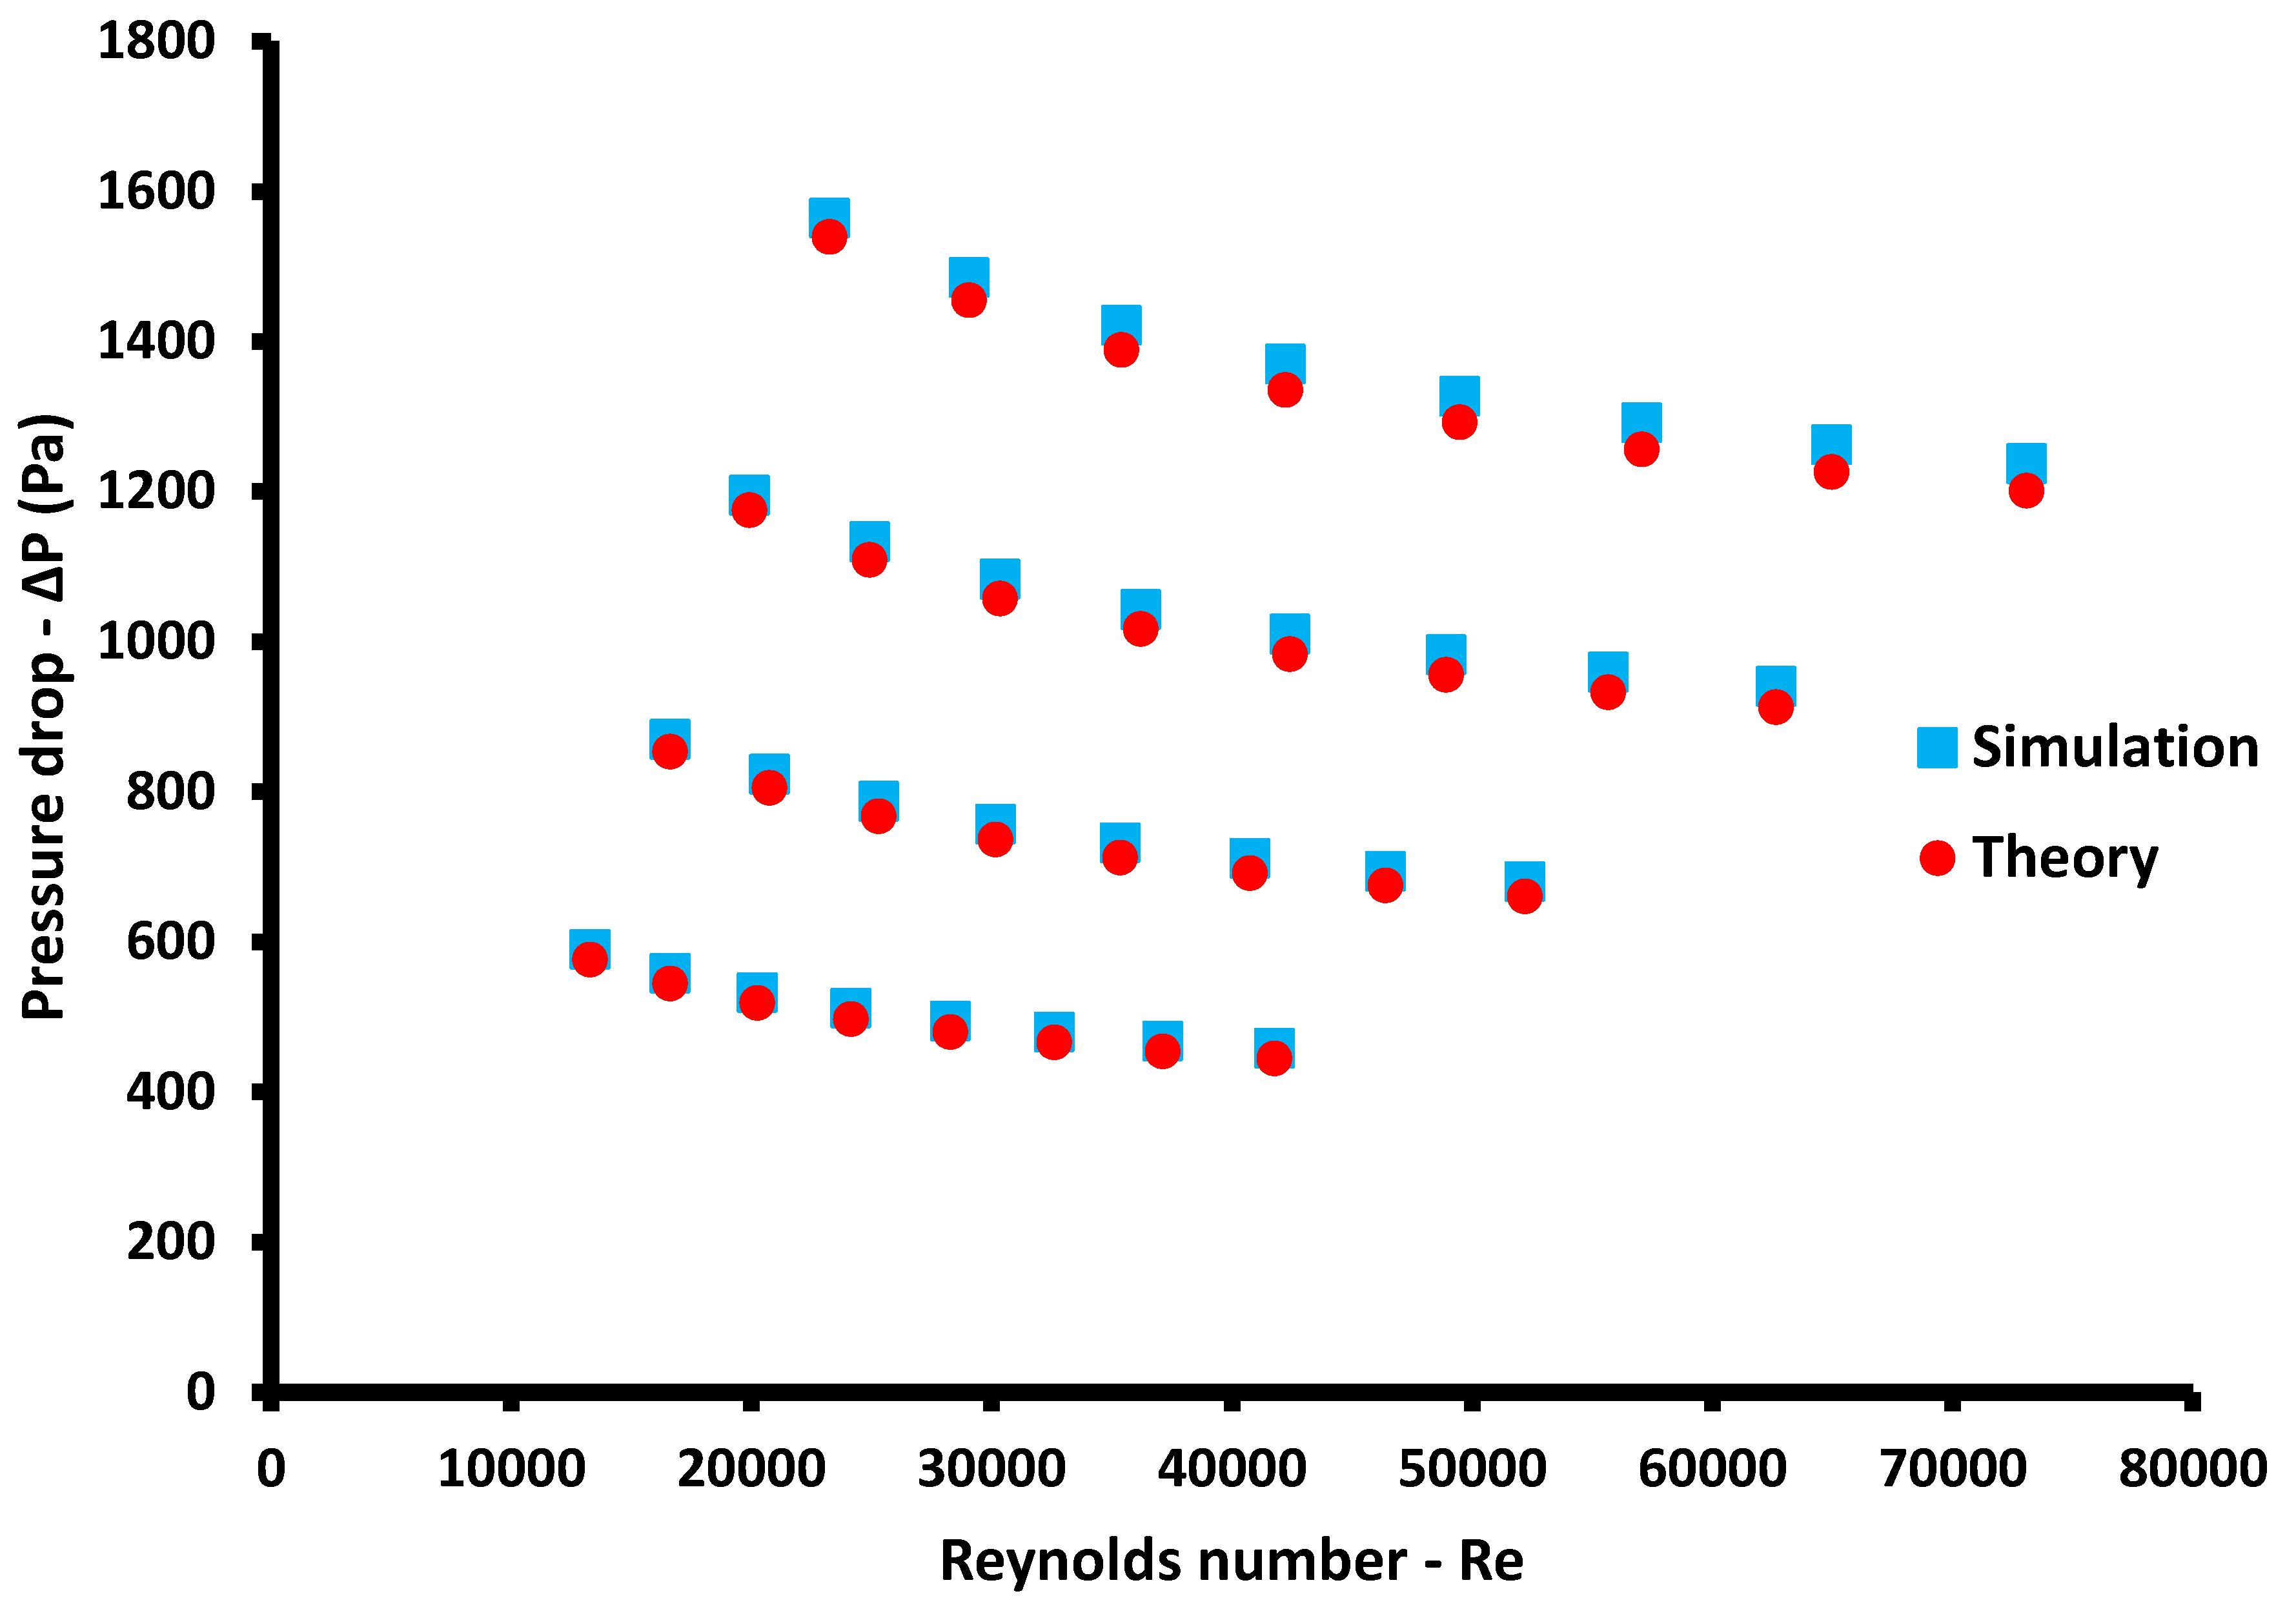
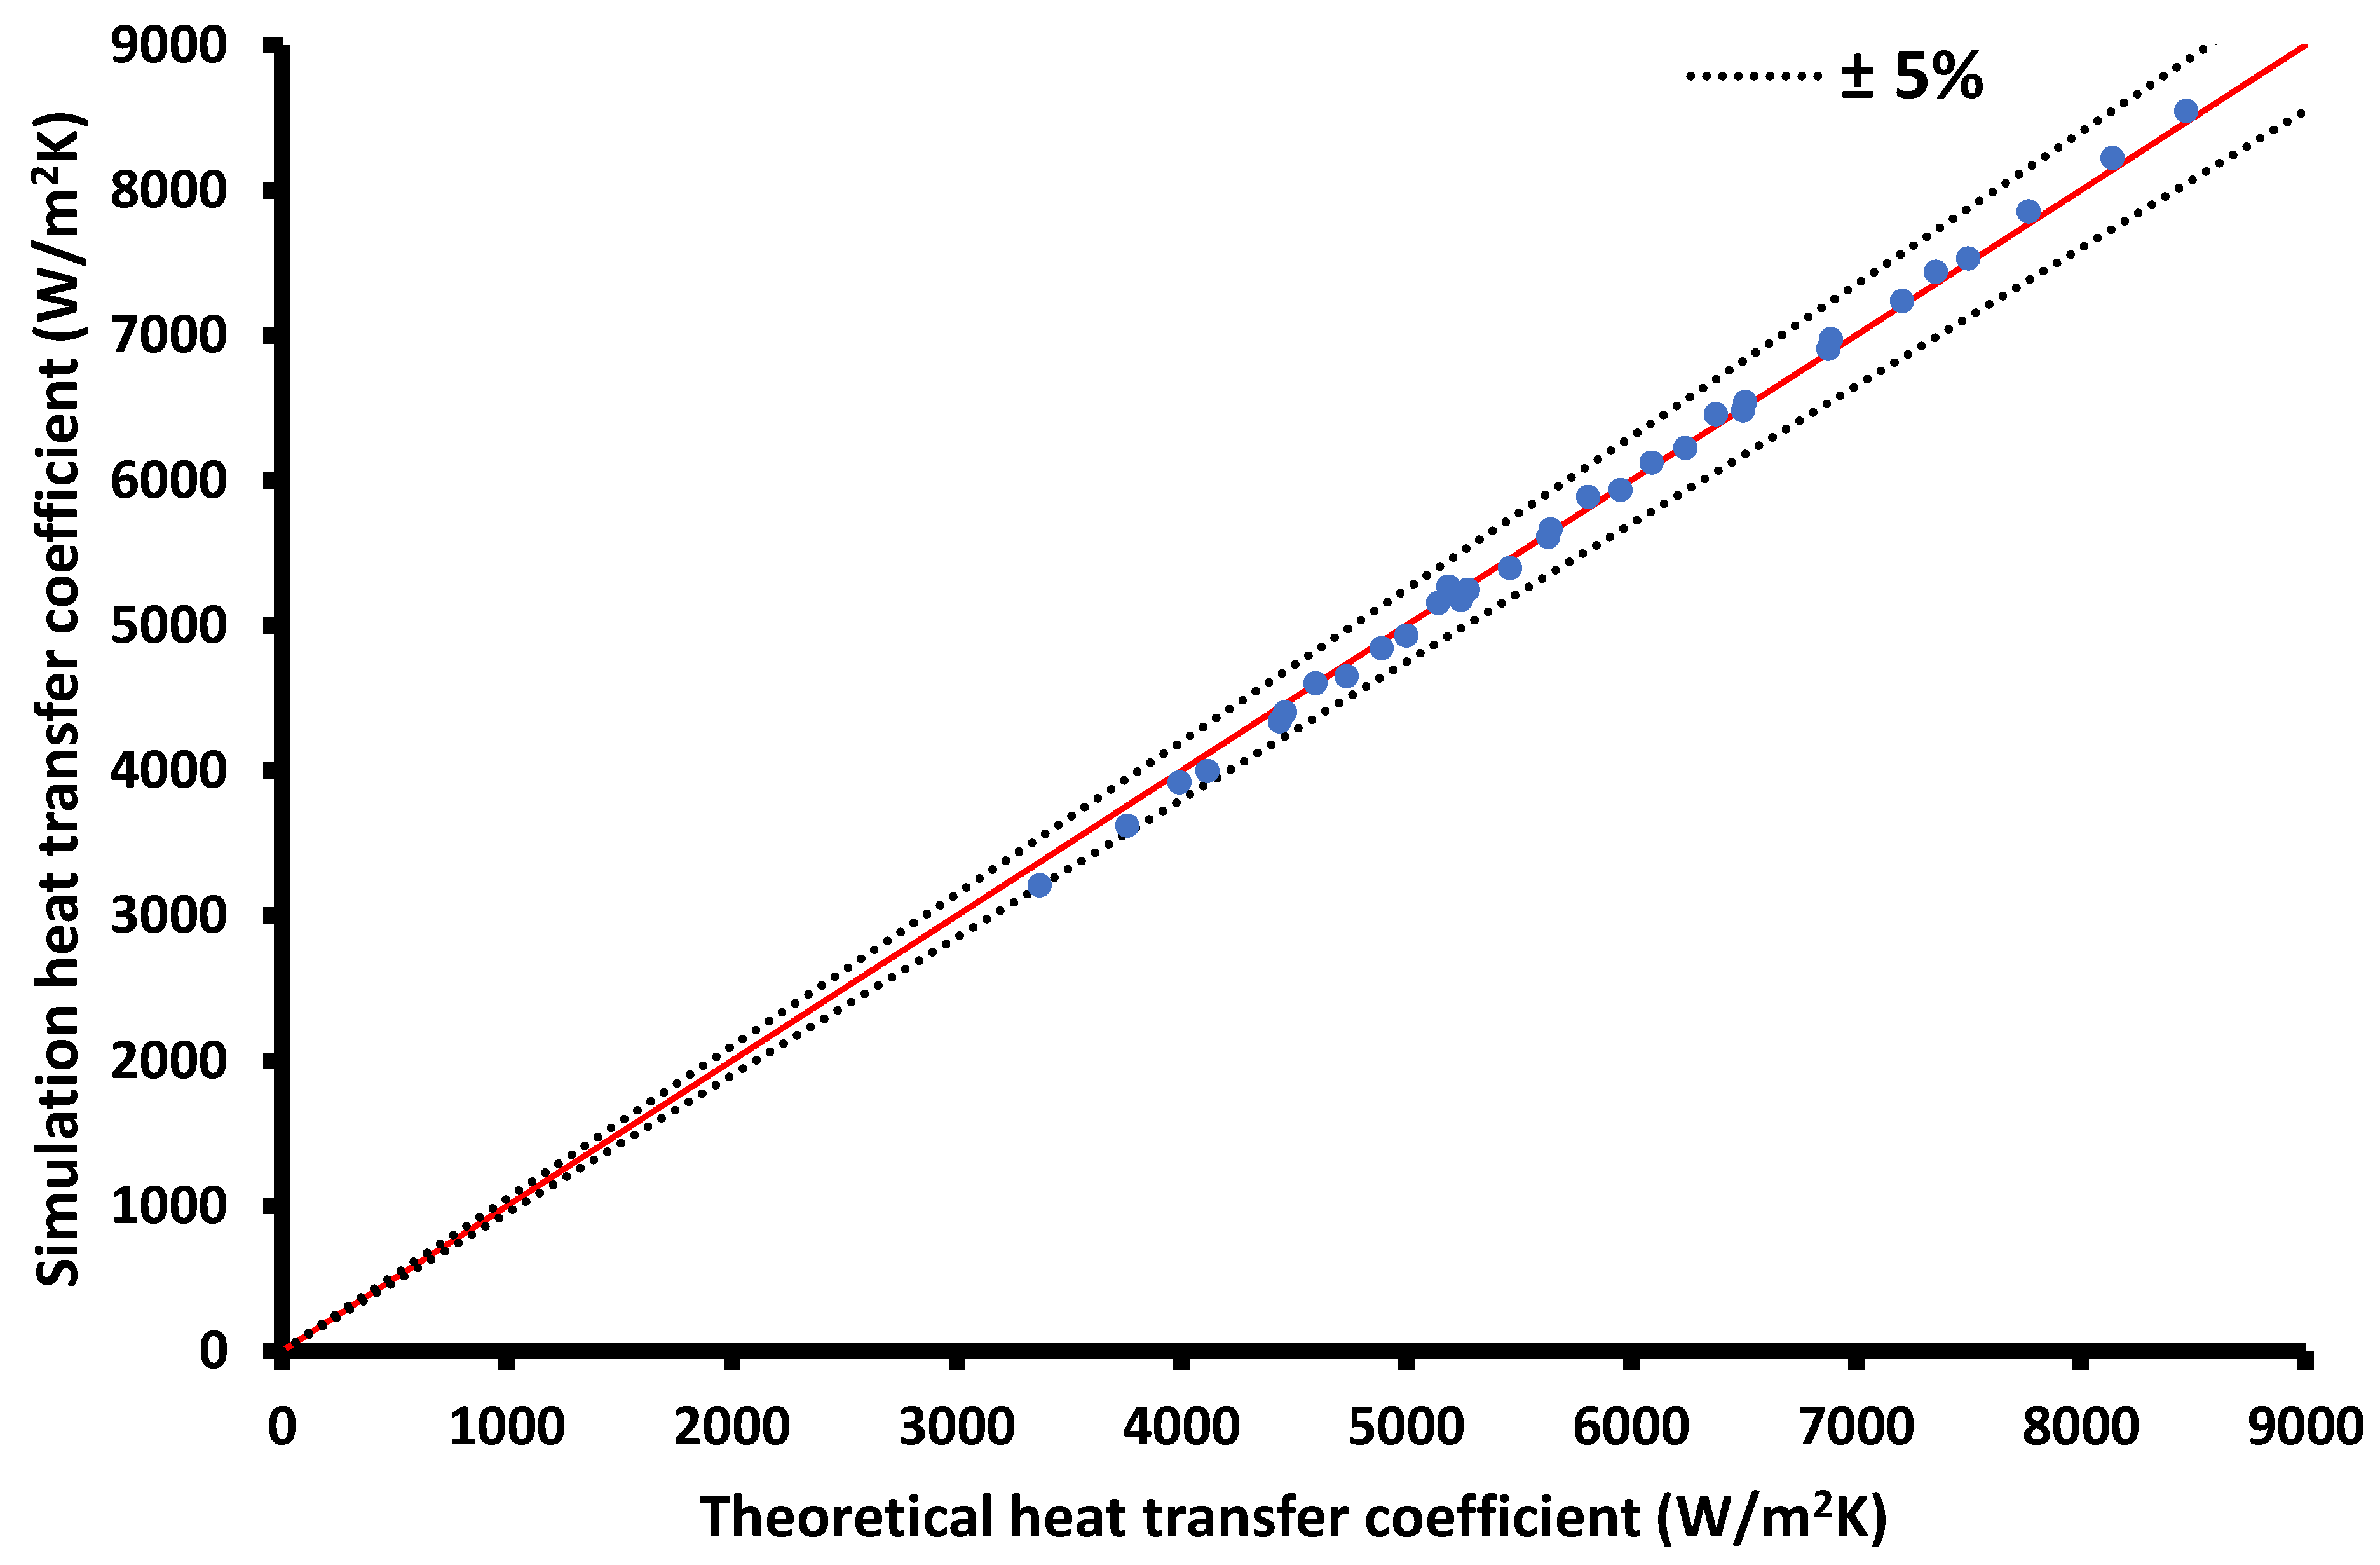
2.4. Model Validation
3. Results and Discussion
3.1. Parametric Analysis for the Reference Case
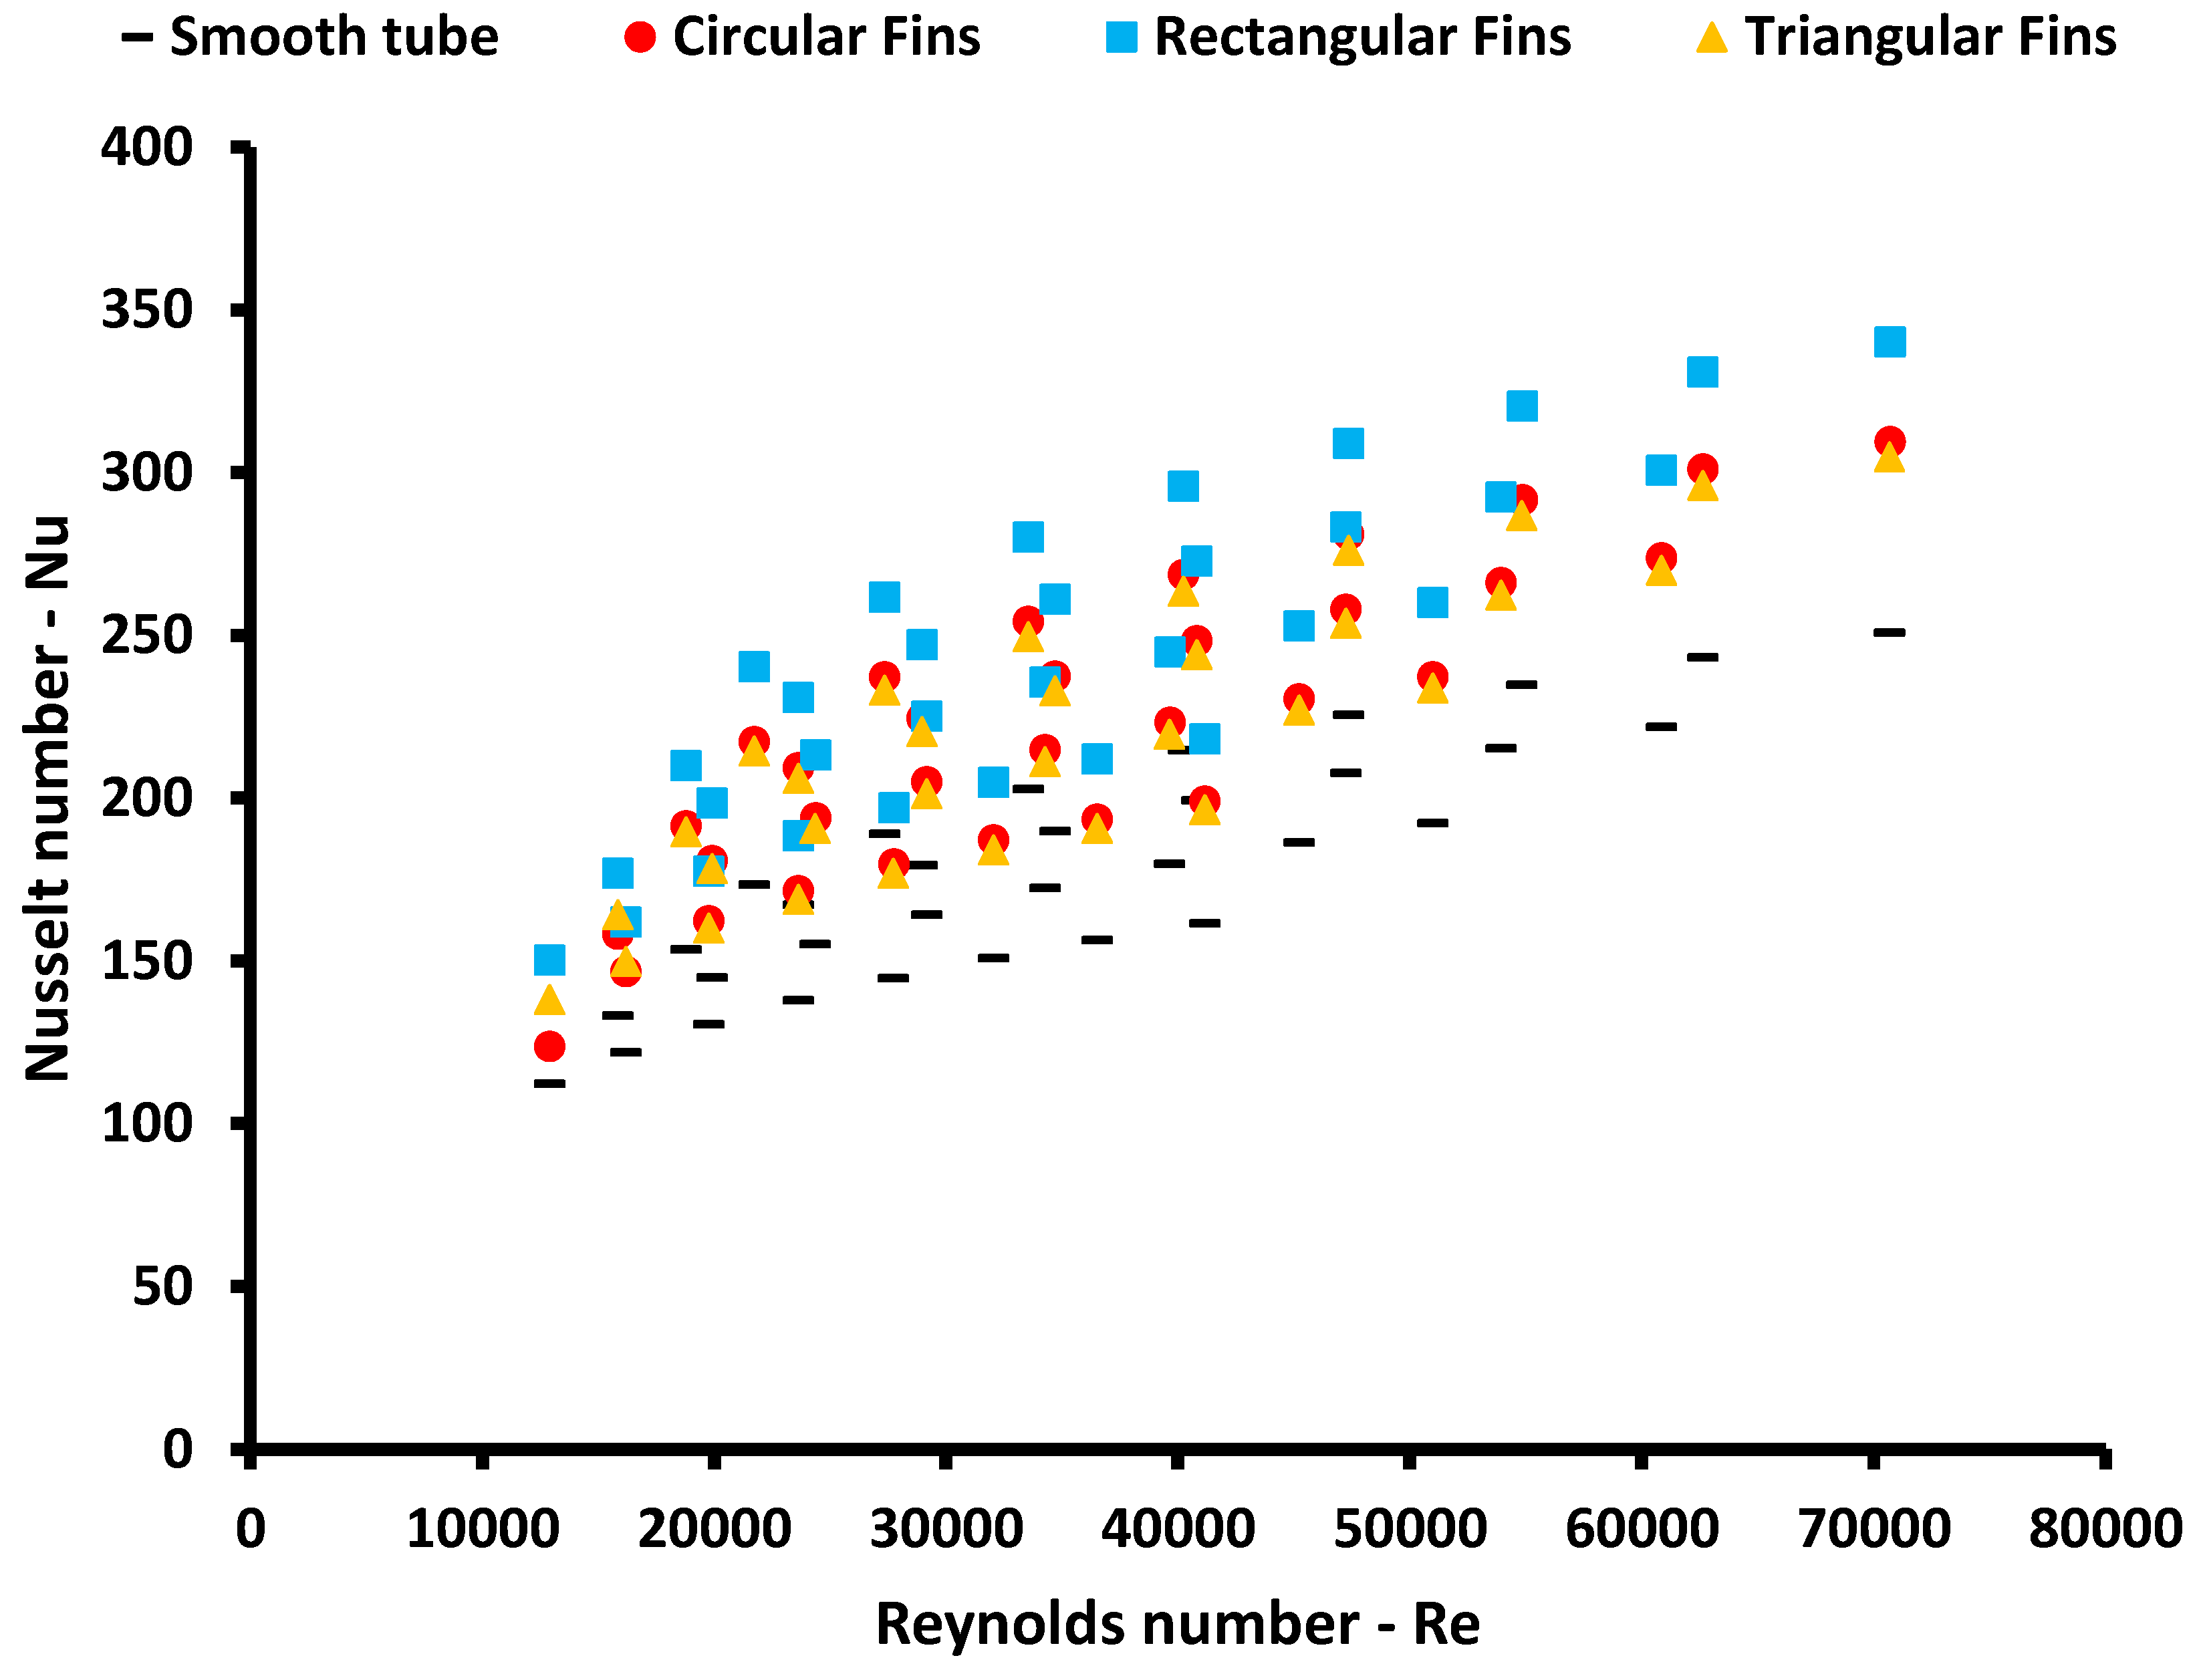
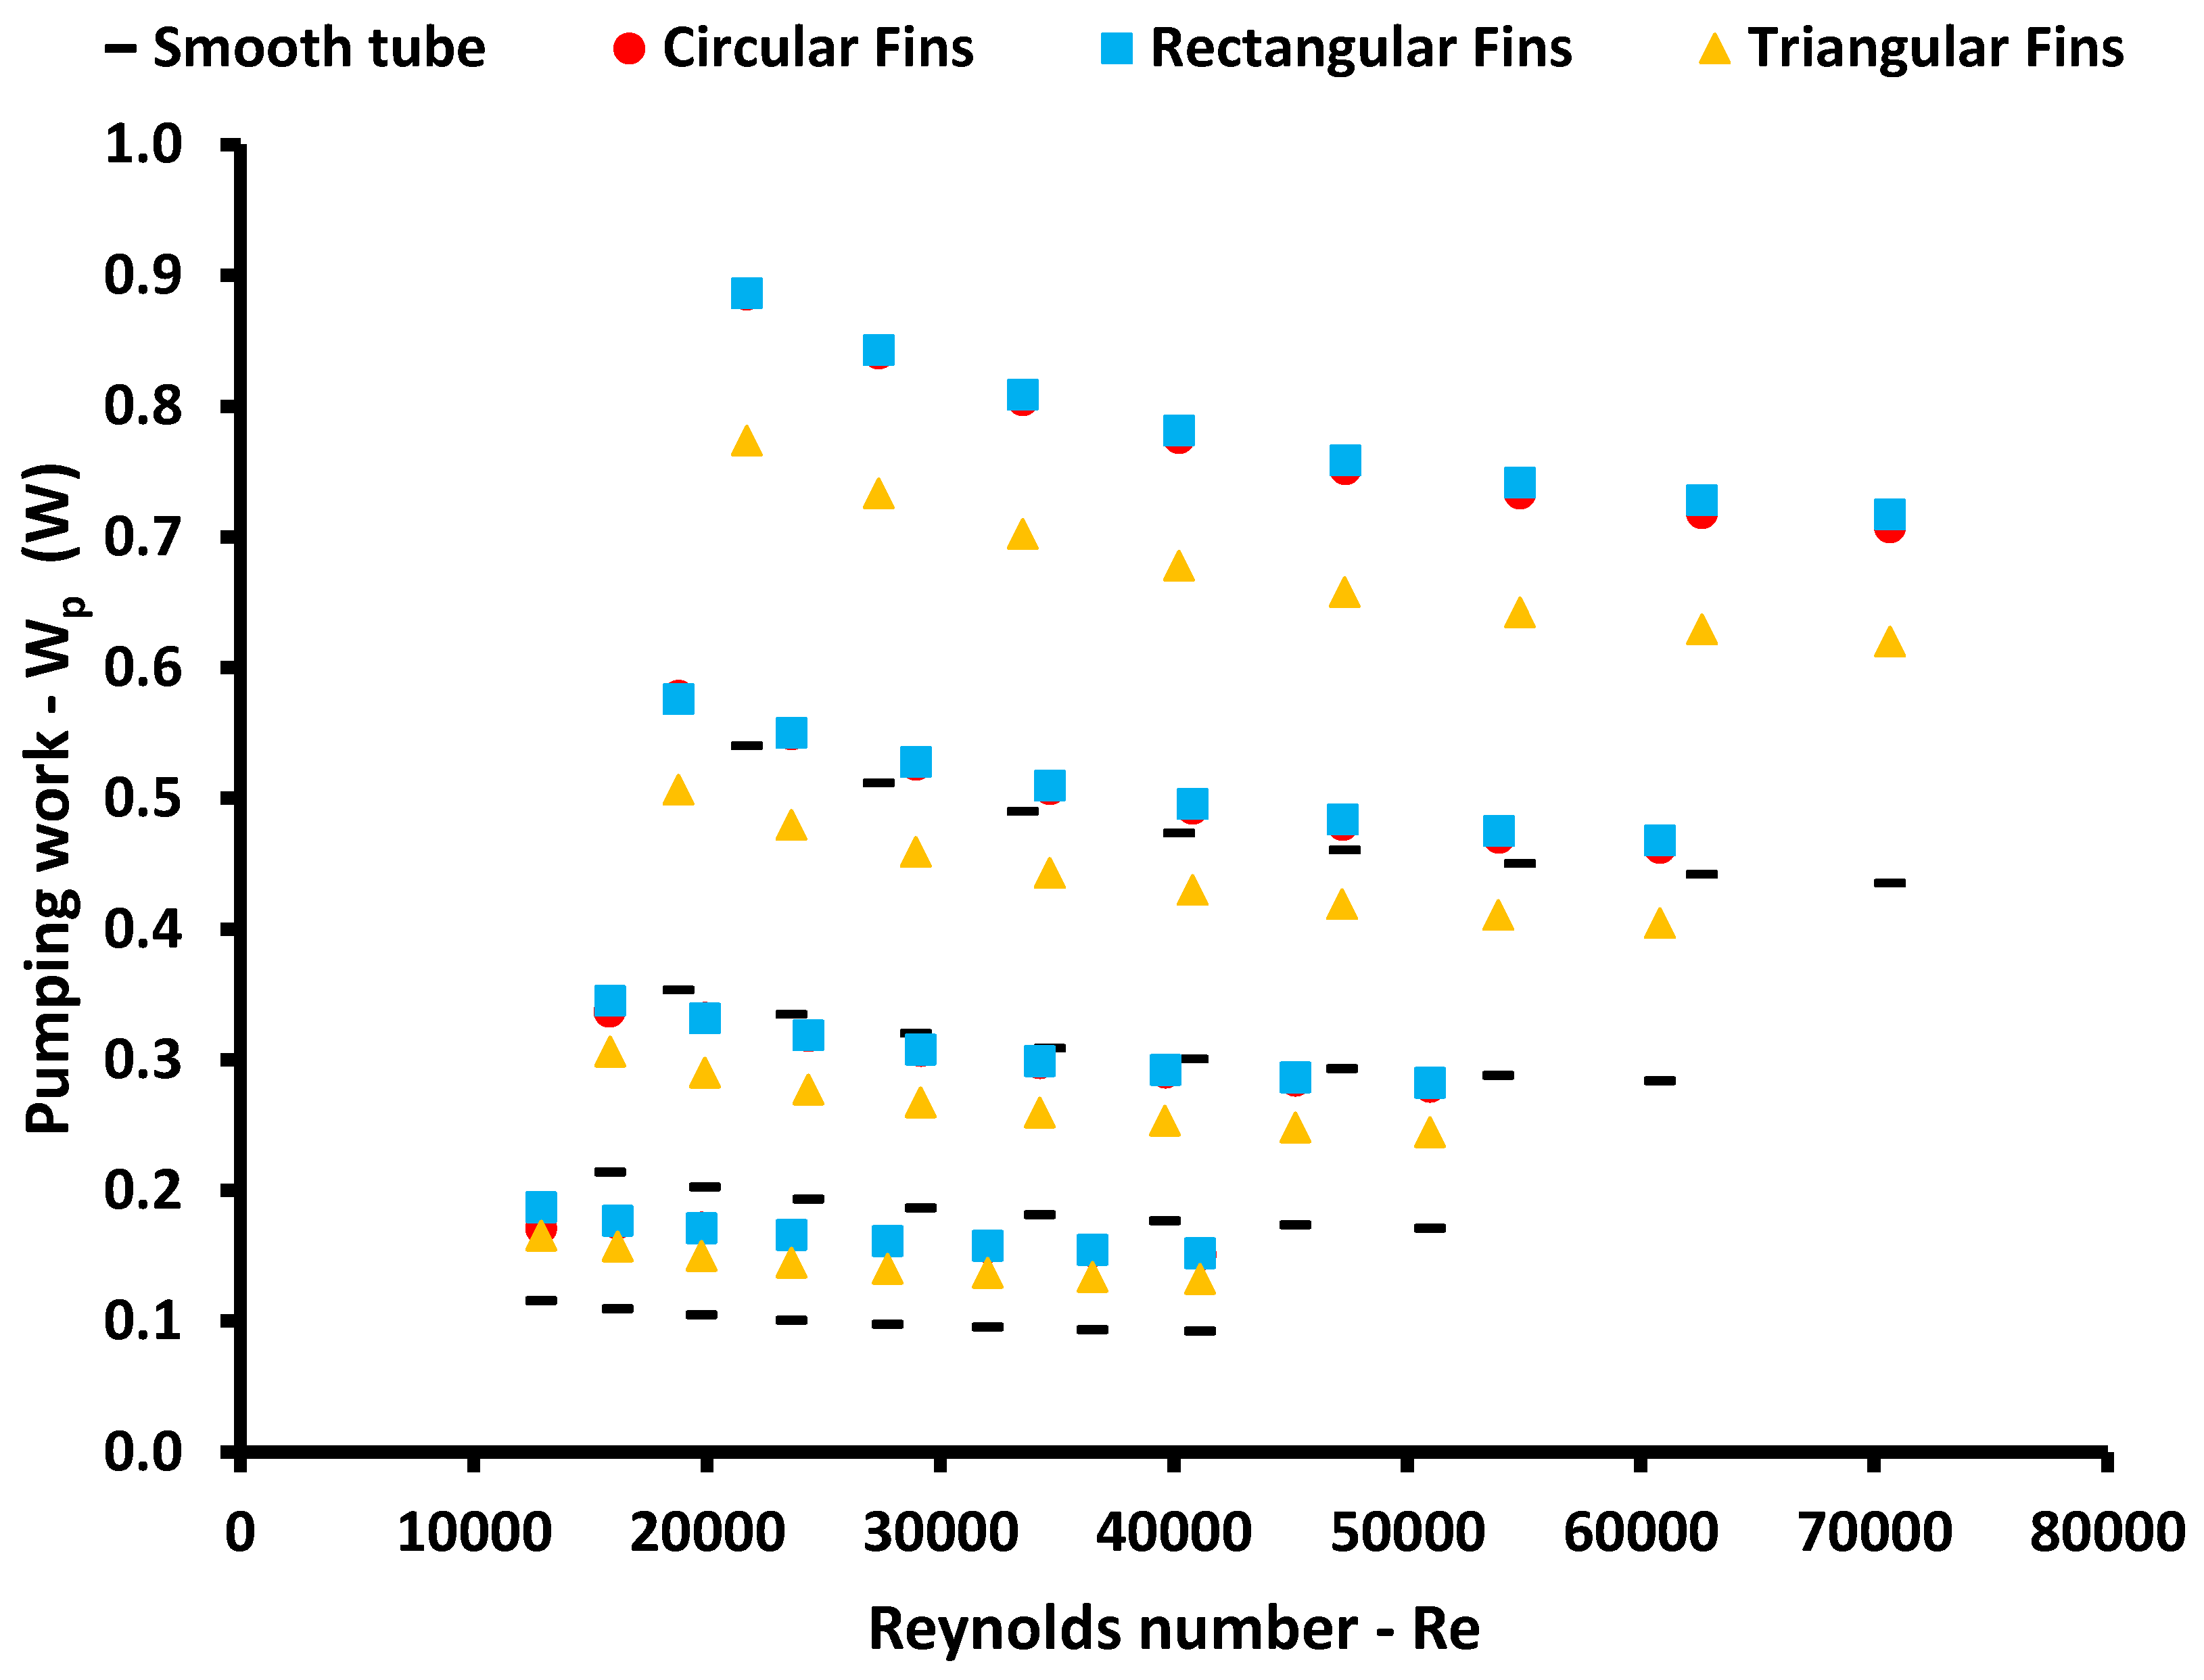
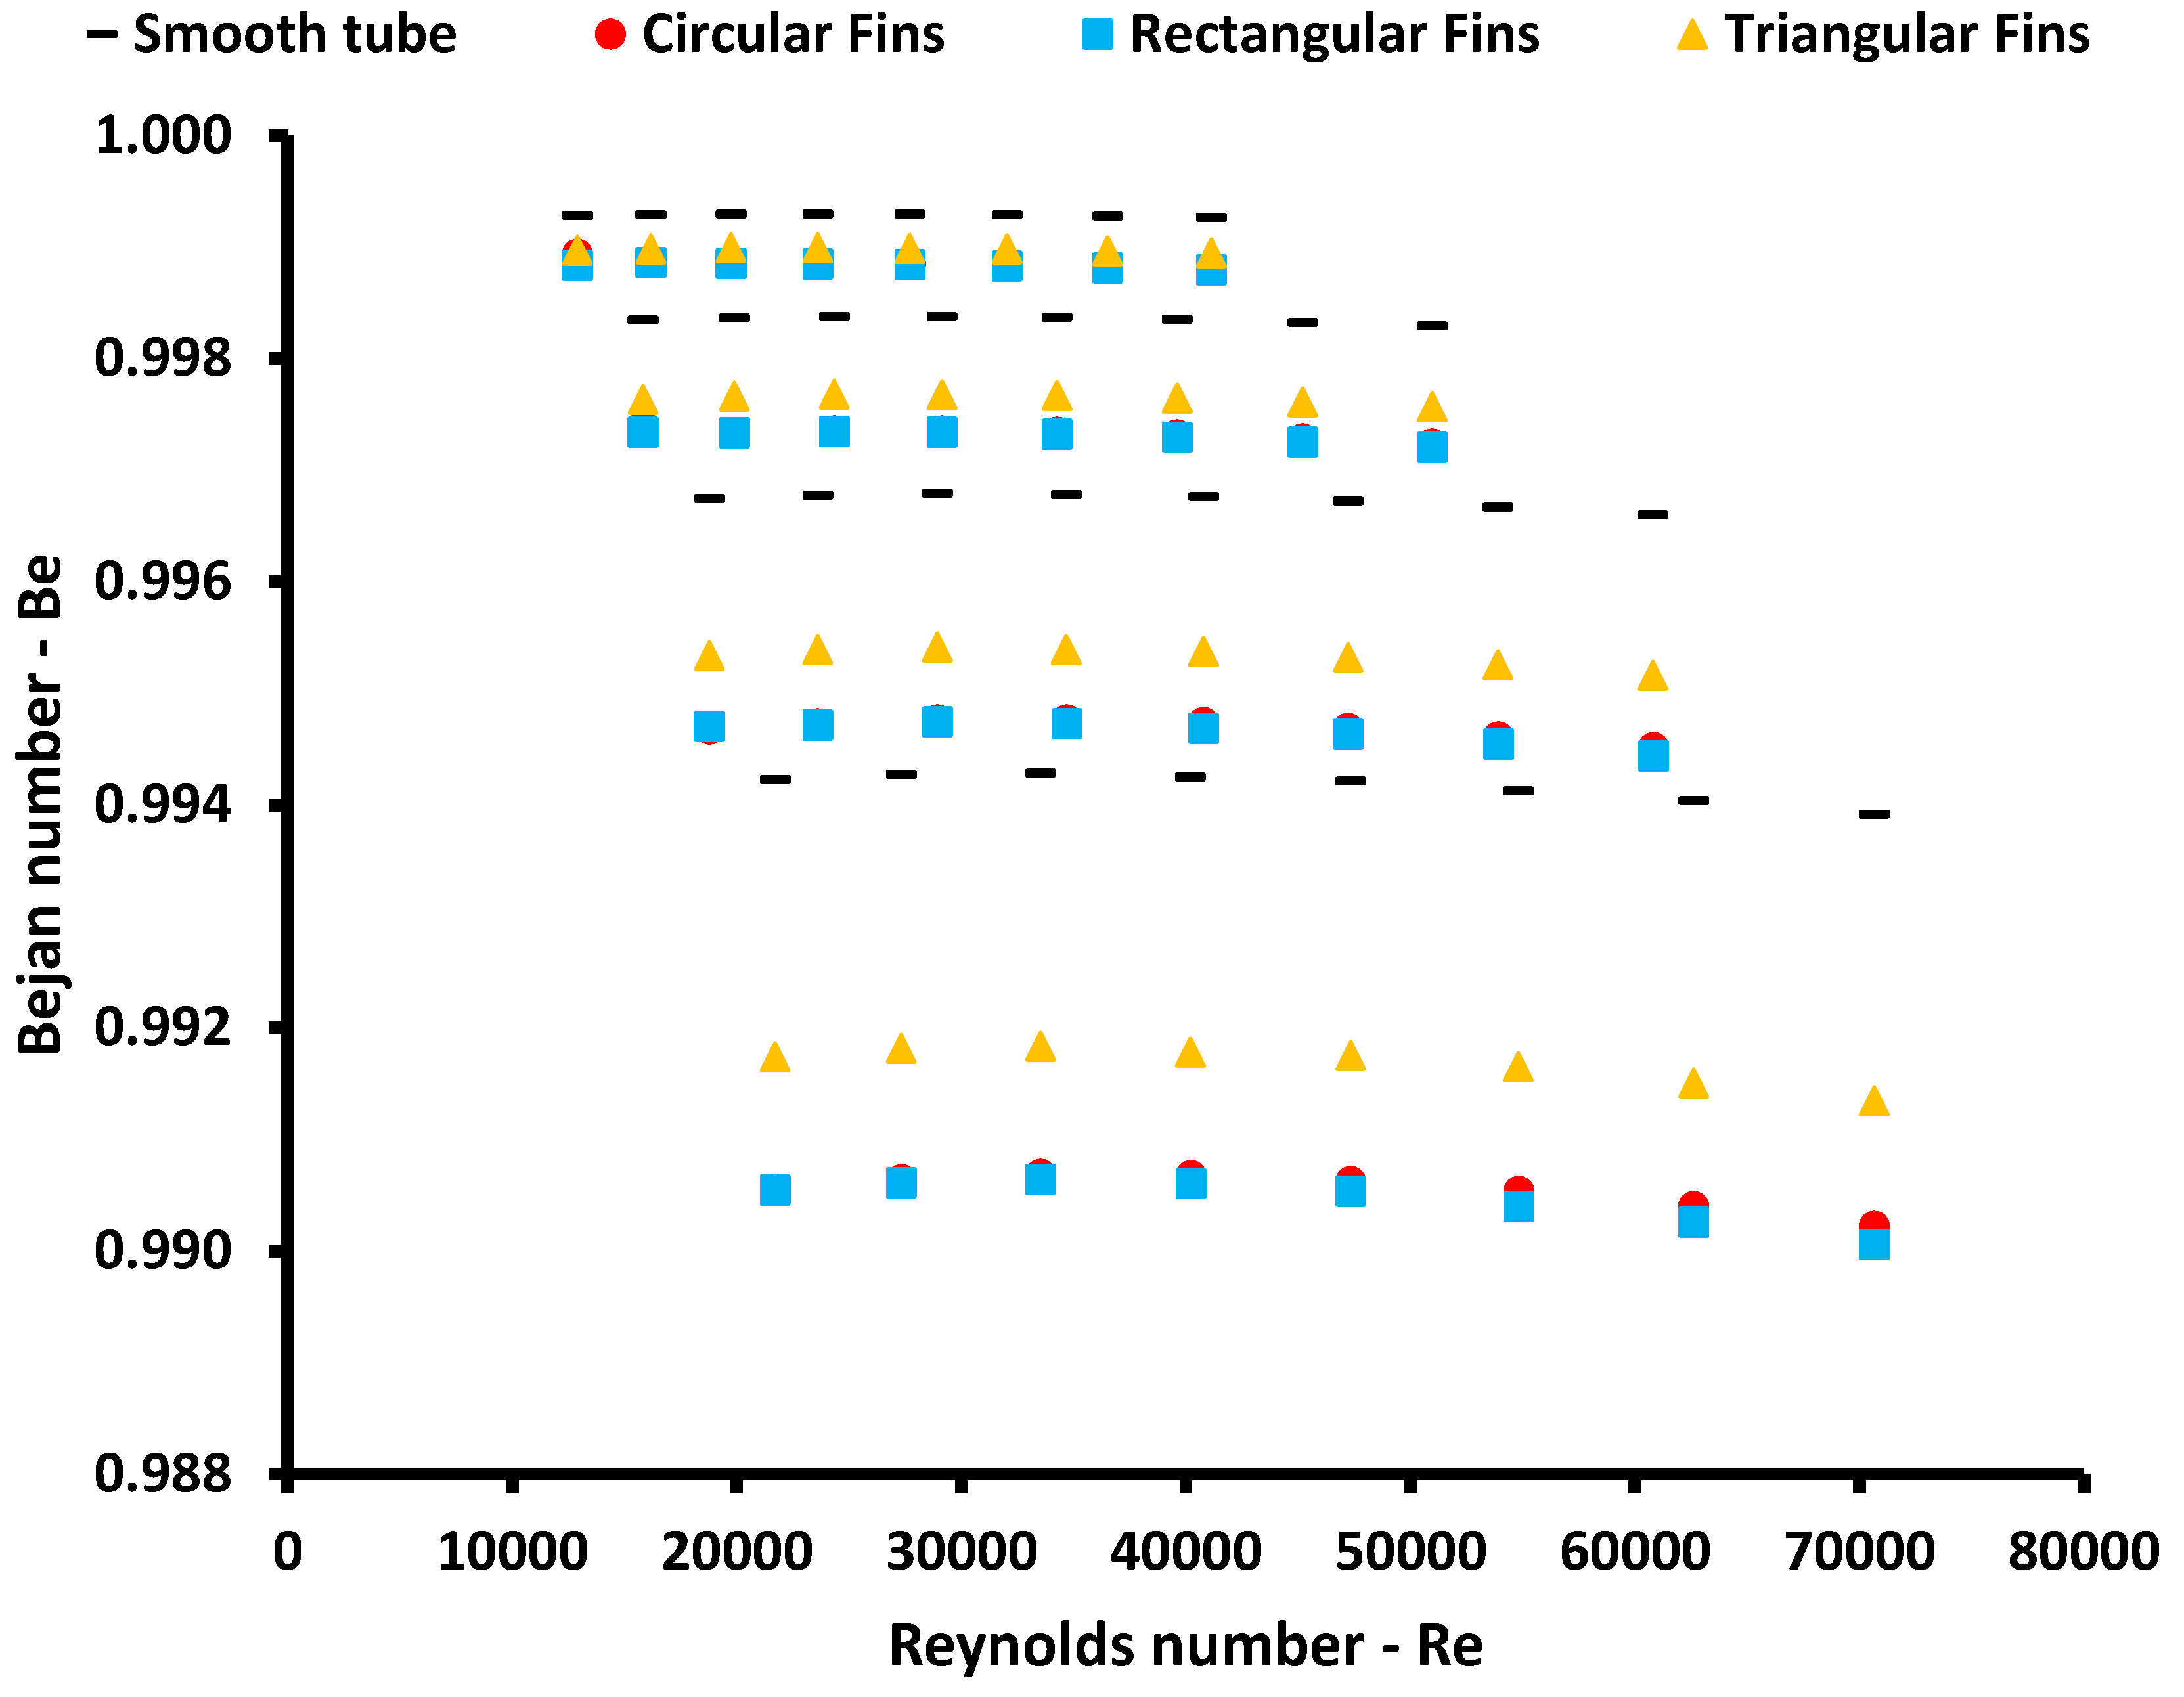
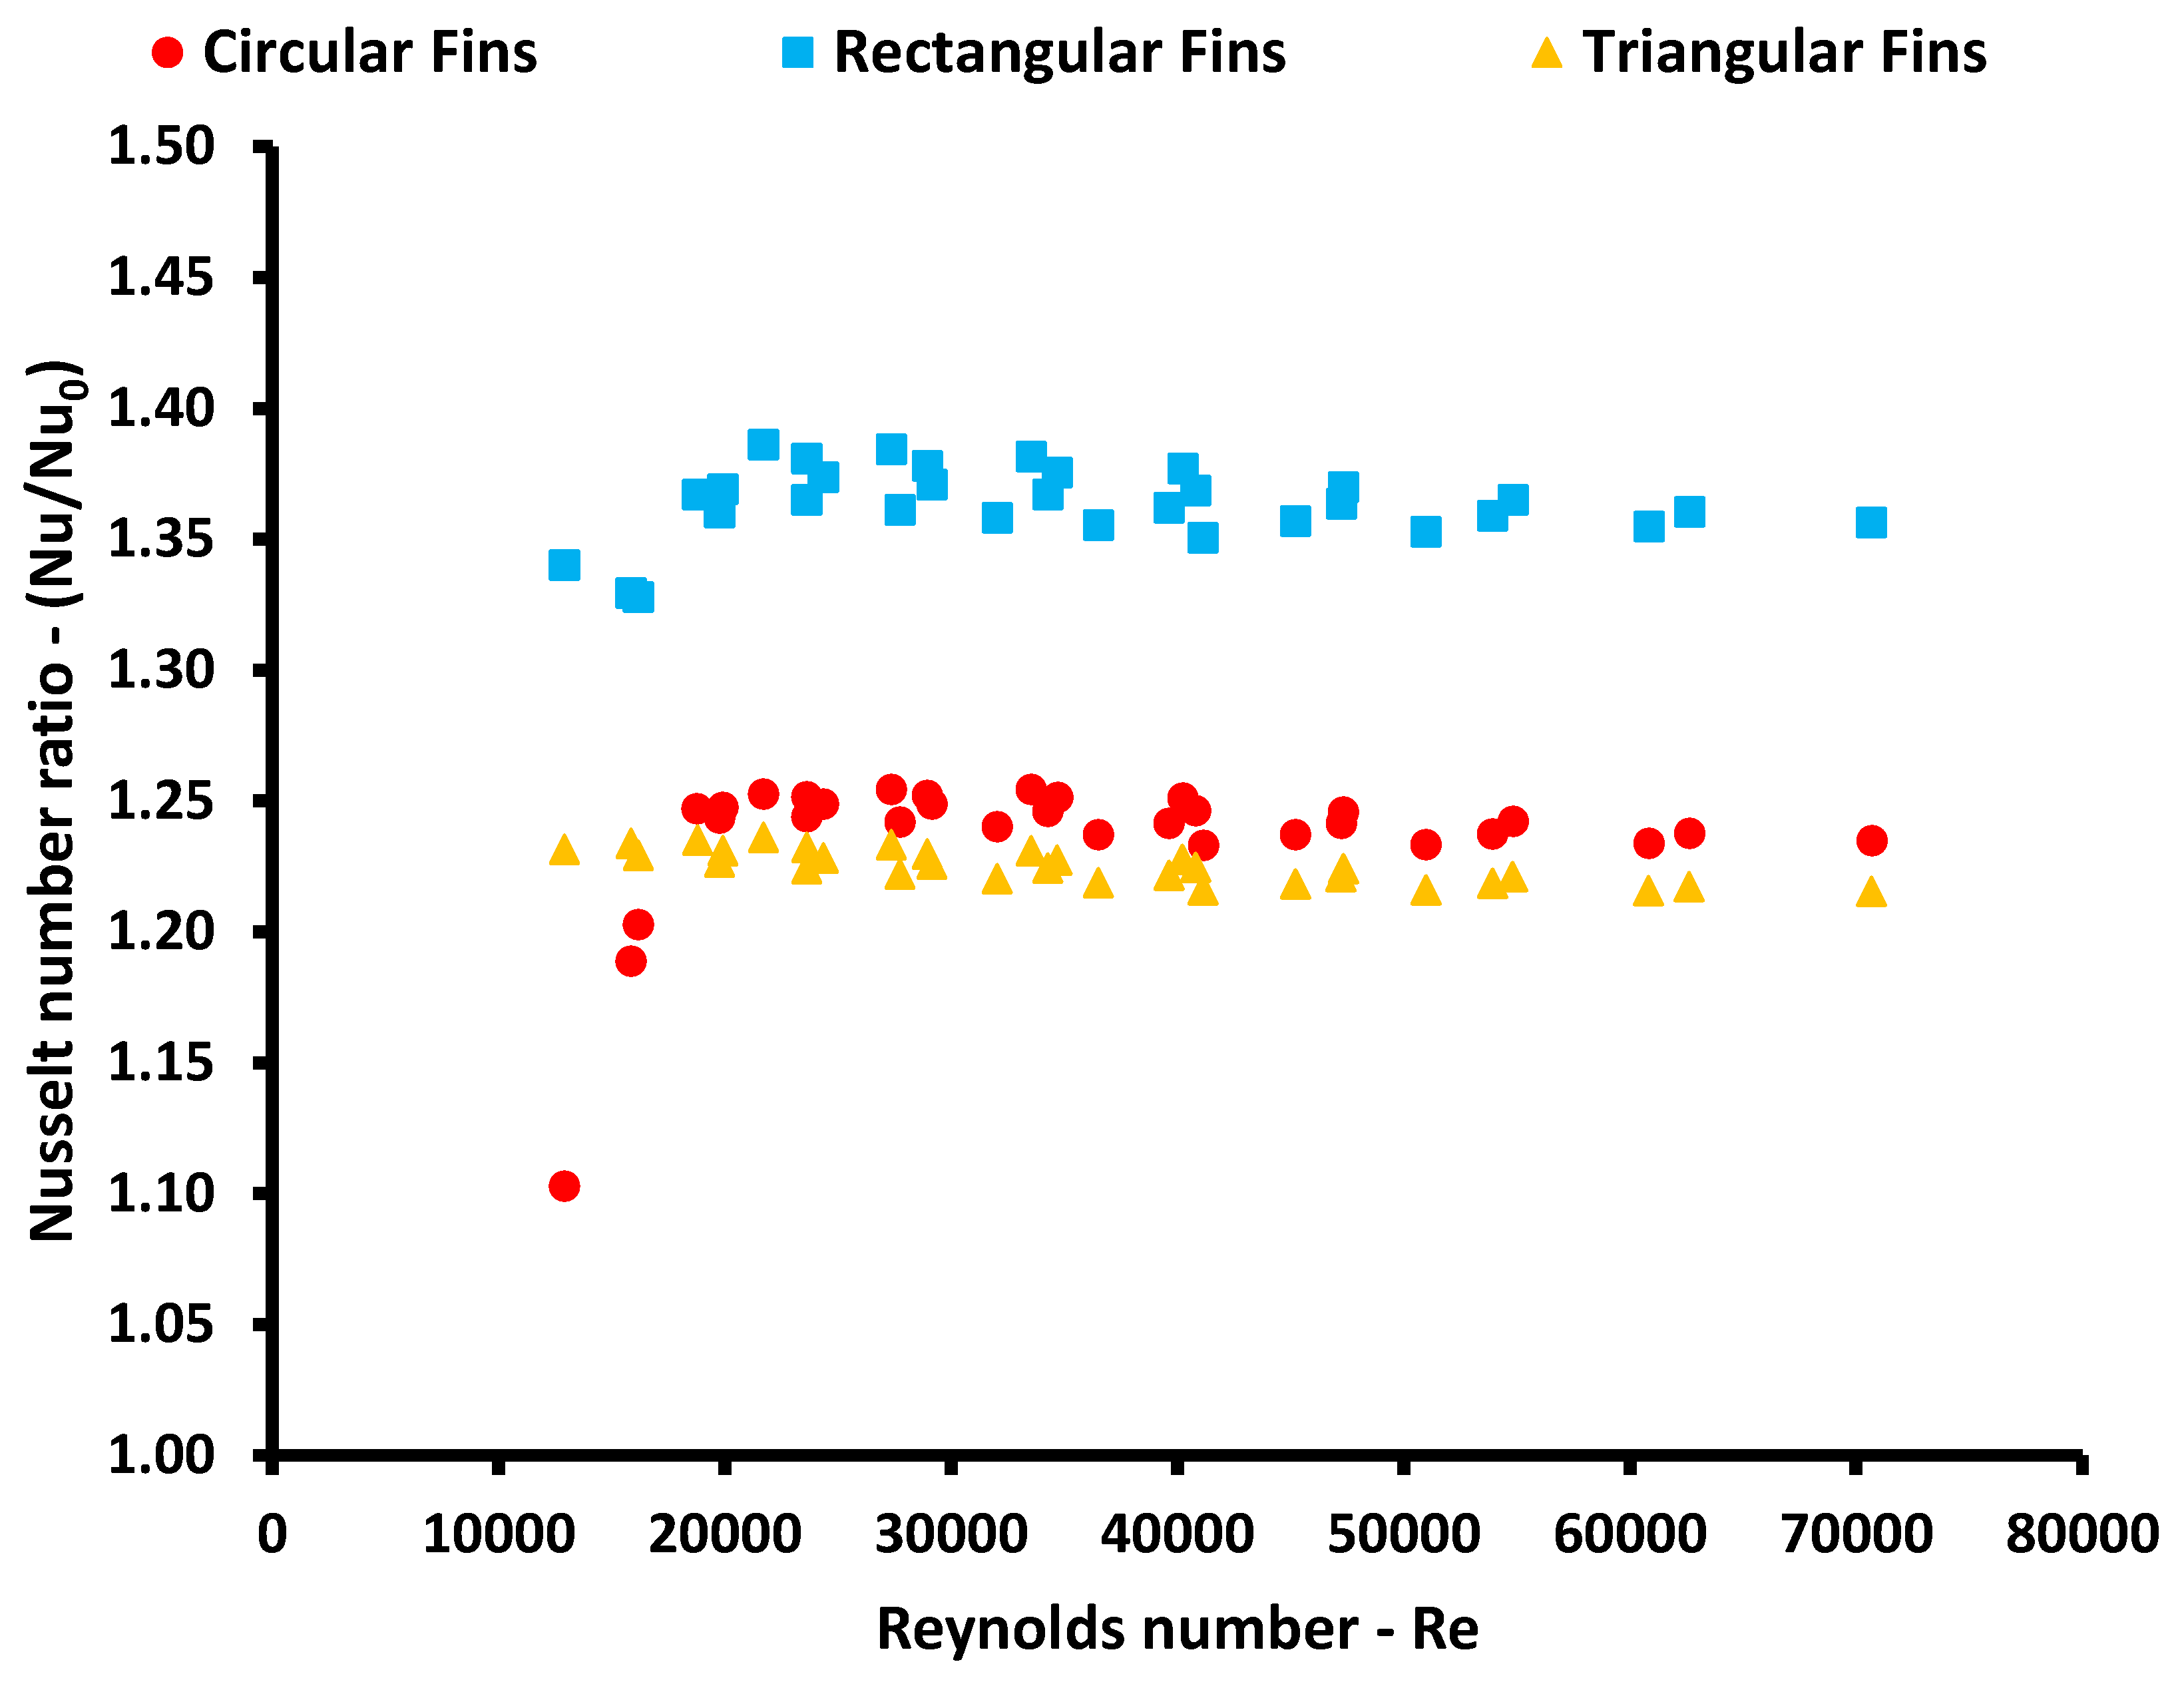
3.2. Comparison of the Different Tubes
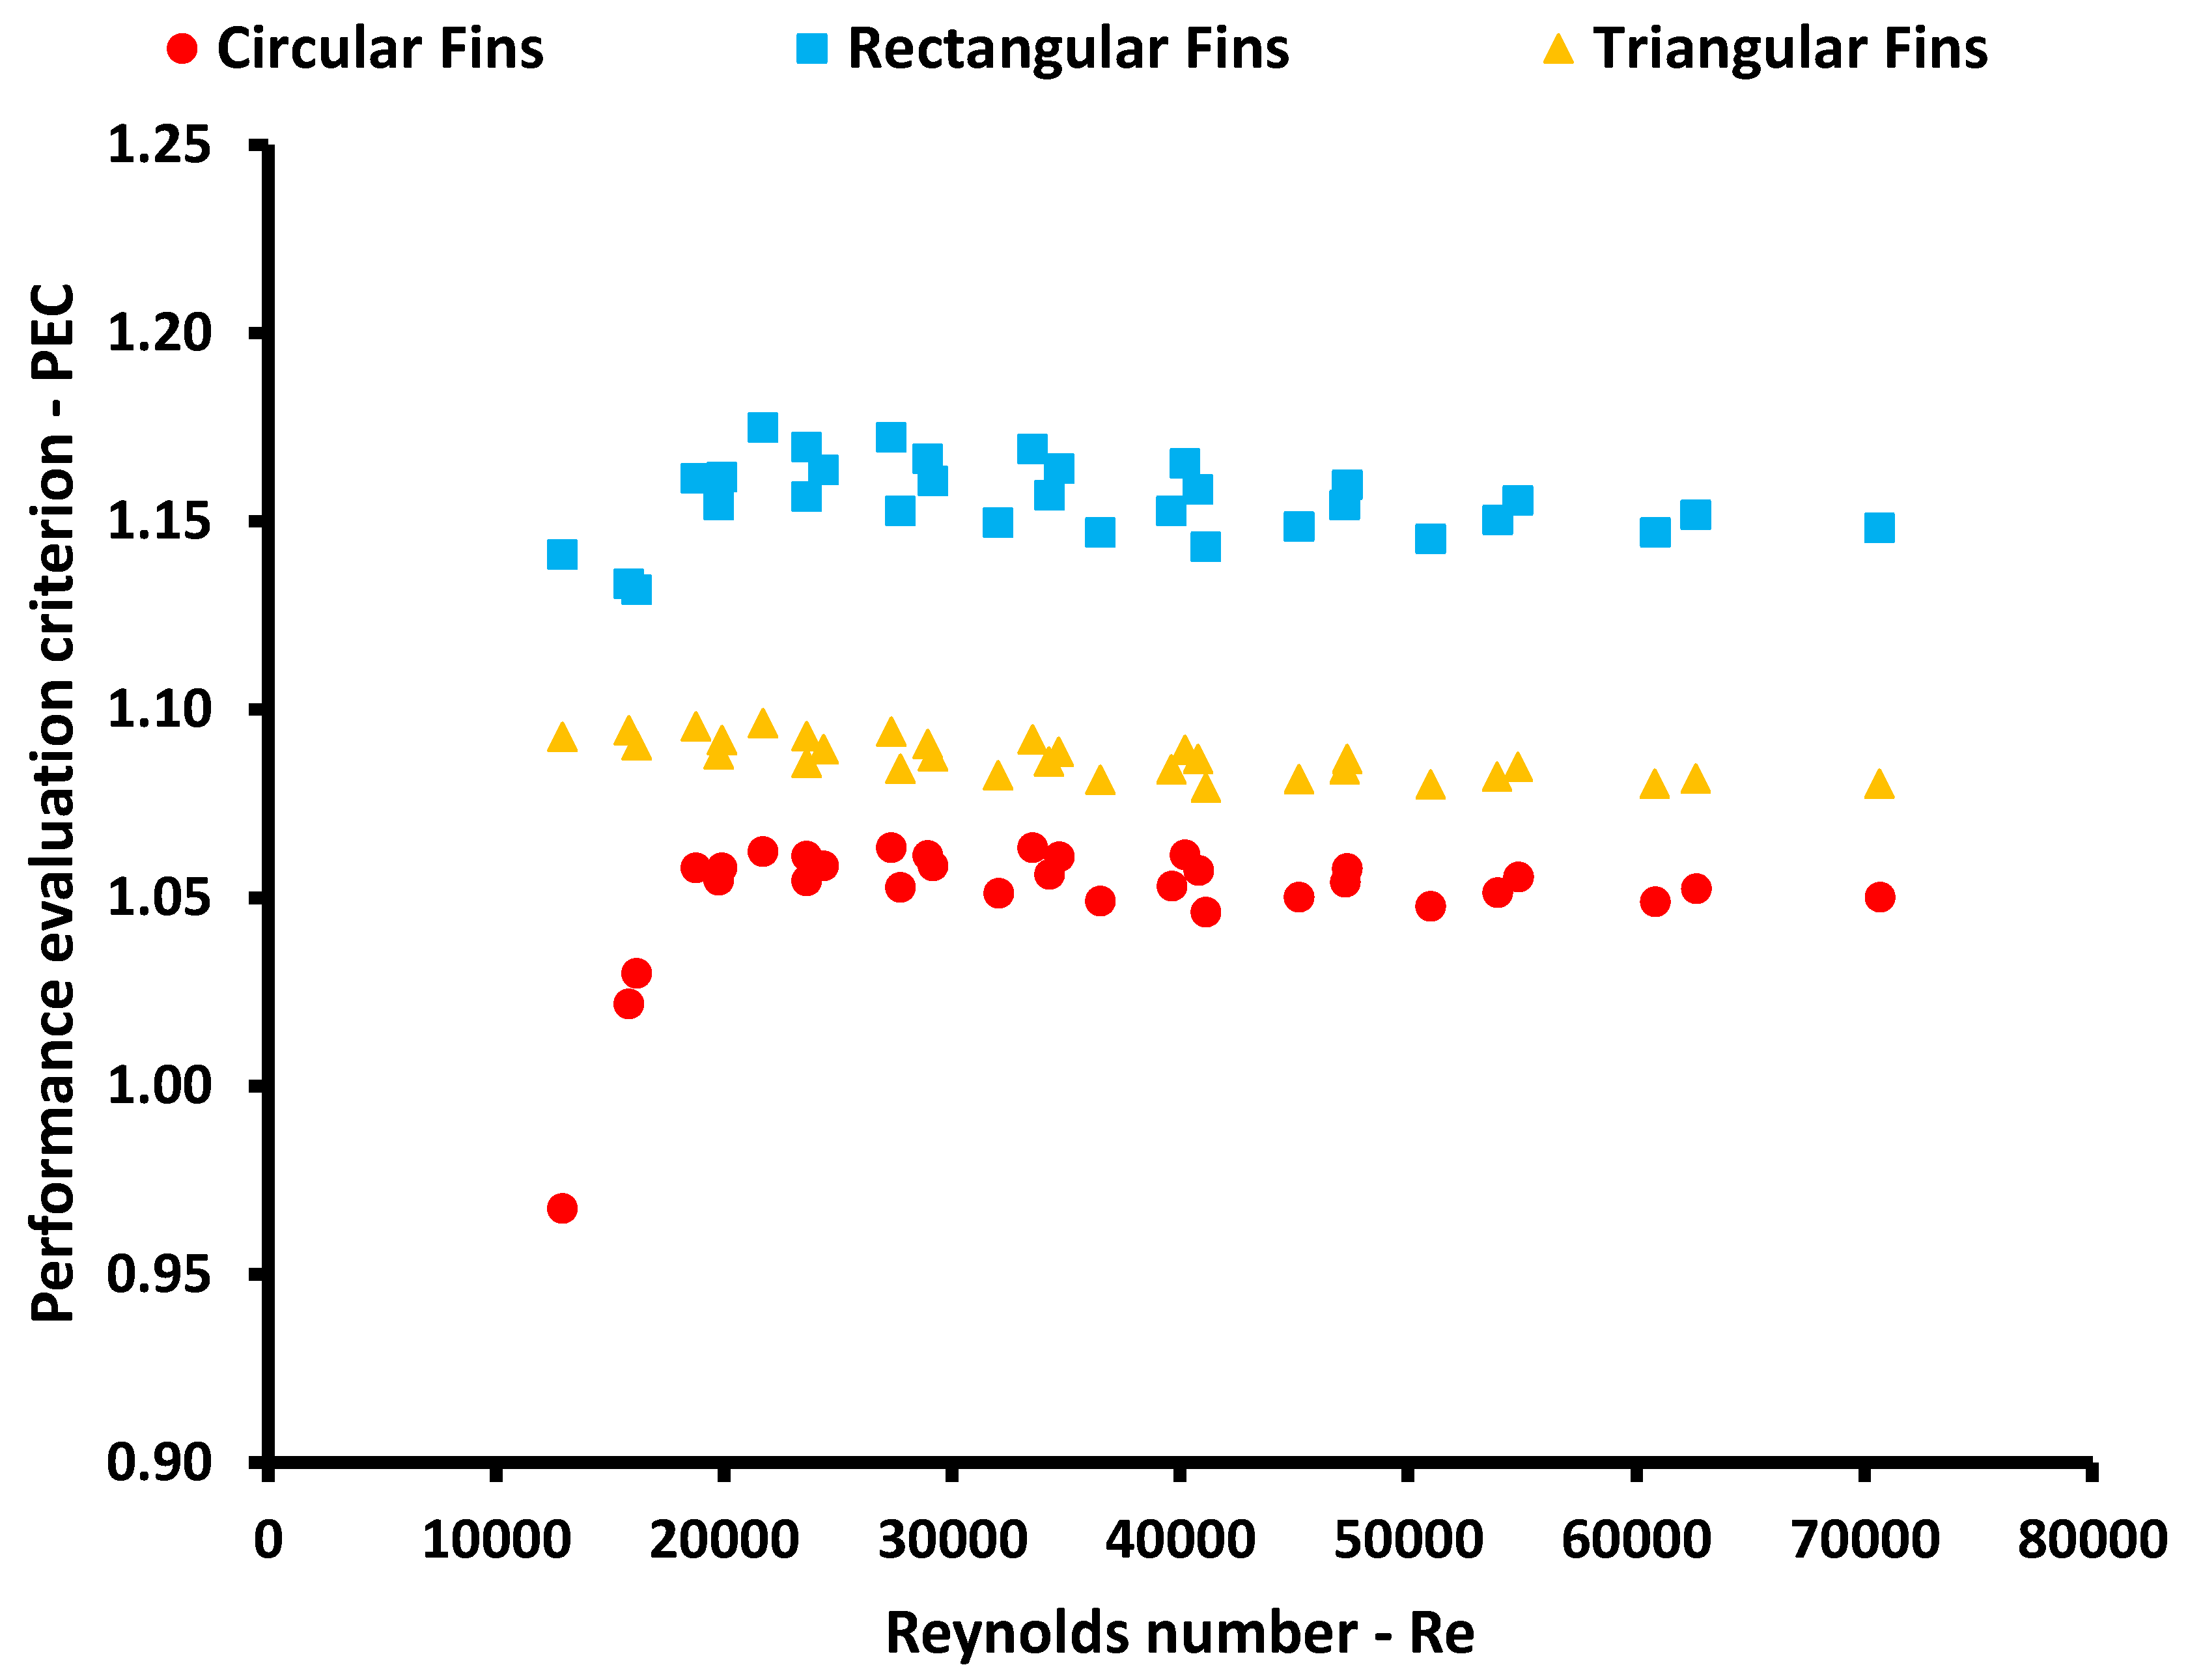
3.3. Final Evaluation of the Different Cases
4. Conclusions
- -
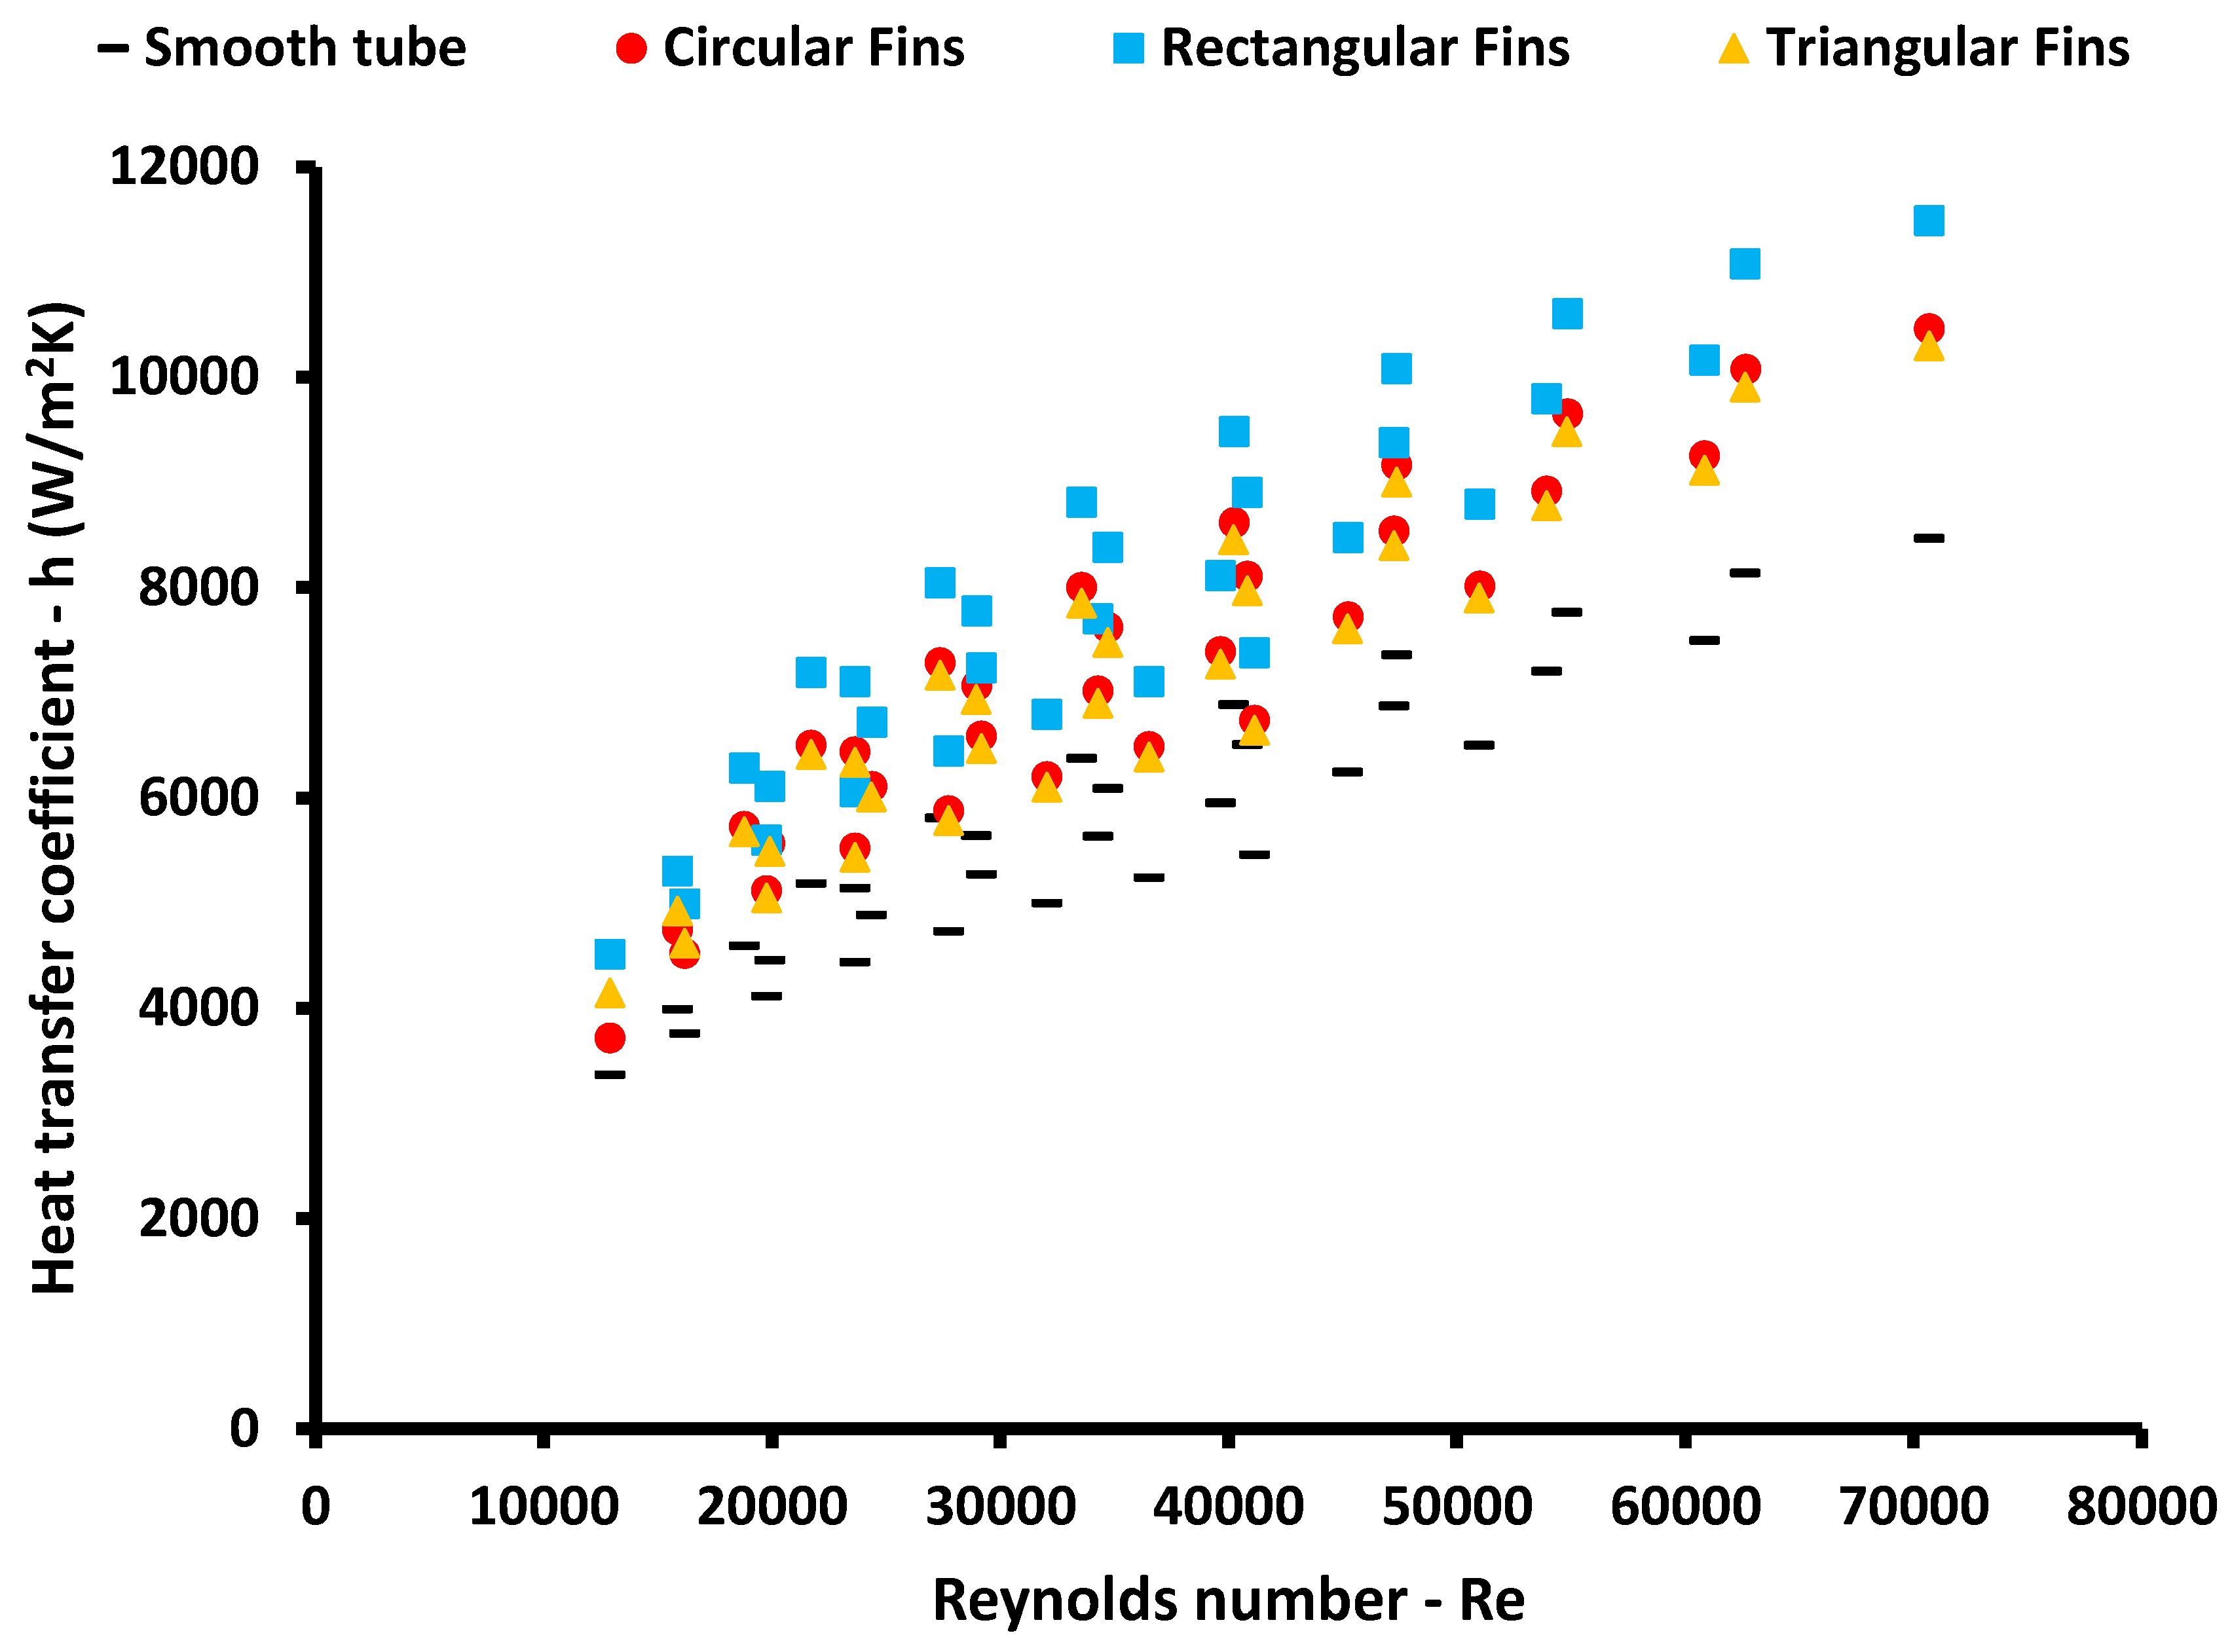
- All the examined finned tubes lead to significant improvement in the heat transfer. The rectangular fins lead to 36% enhancement, circular fins to 25% enhancement, and triangular fins to 23% enhancement, approximately, compared to the reference tube.
- -
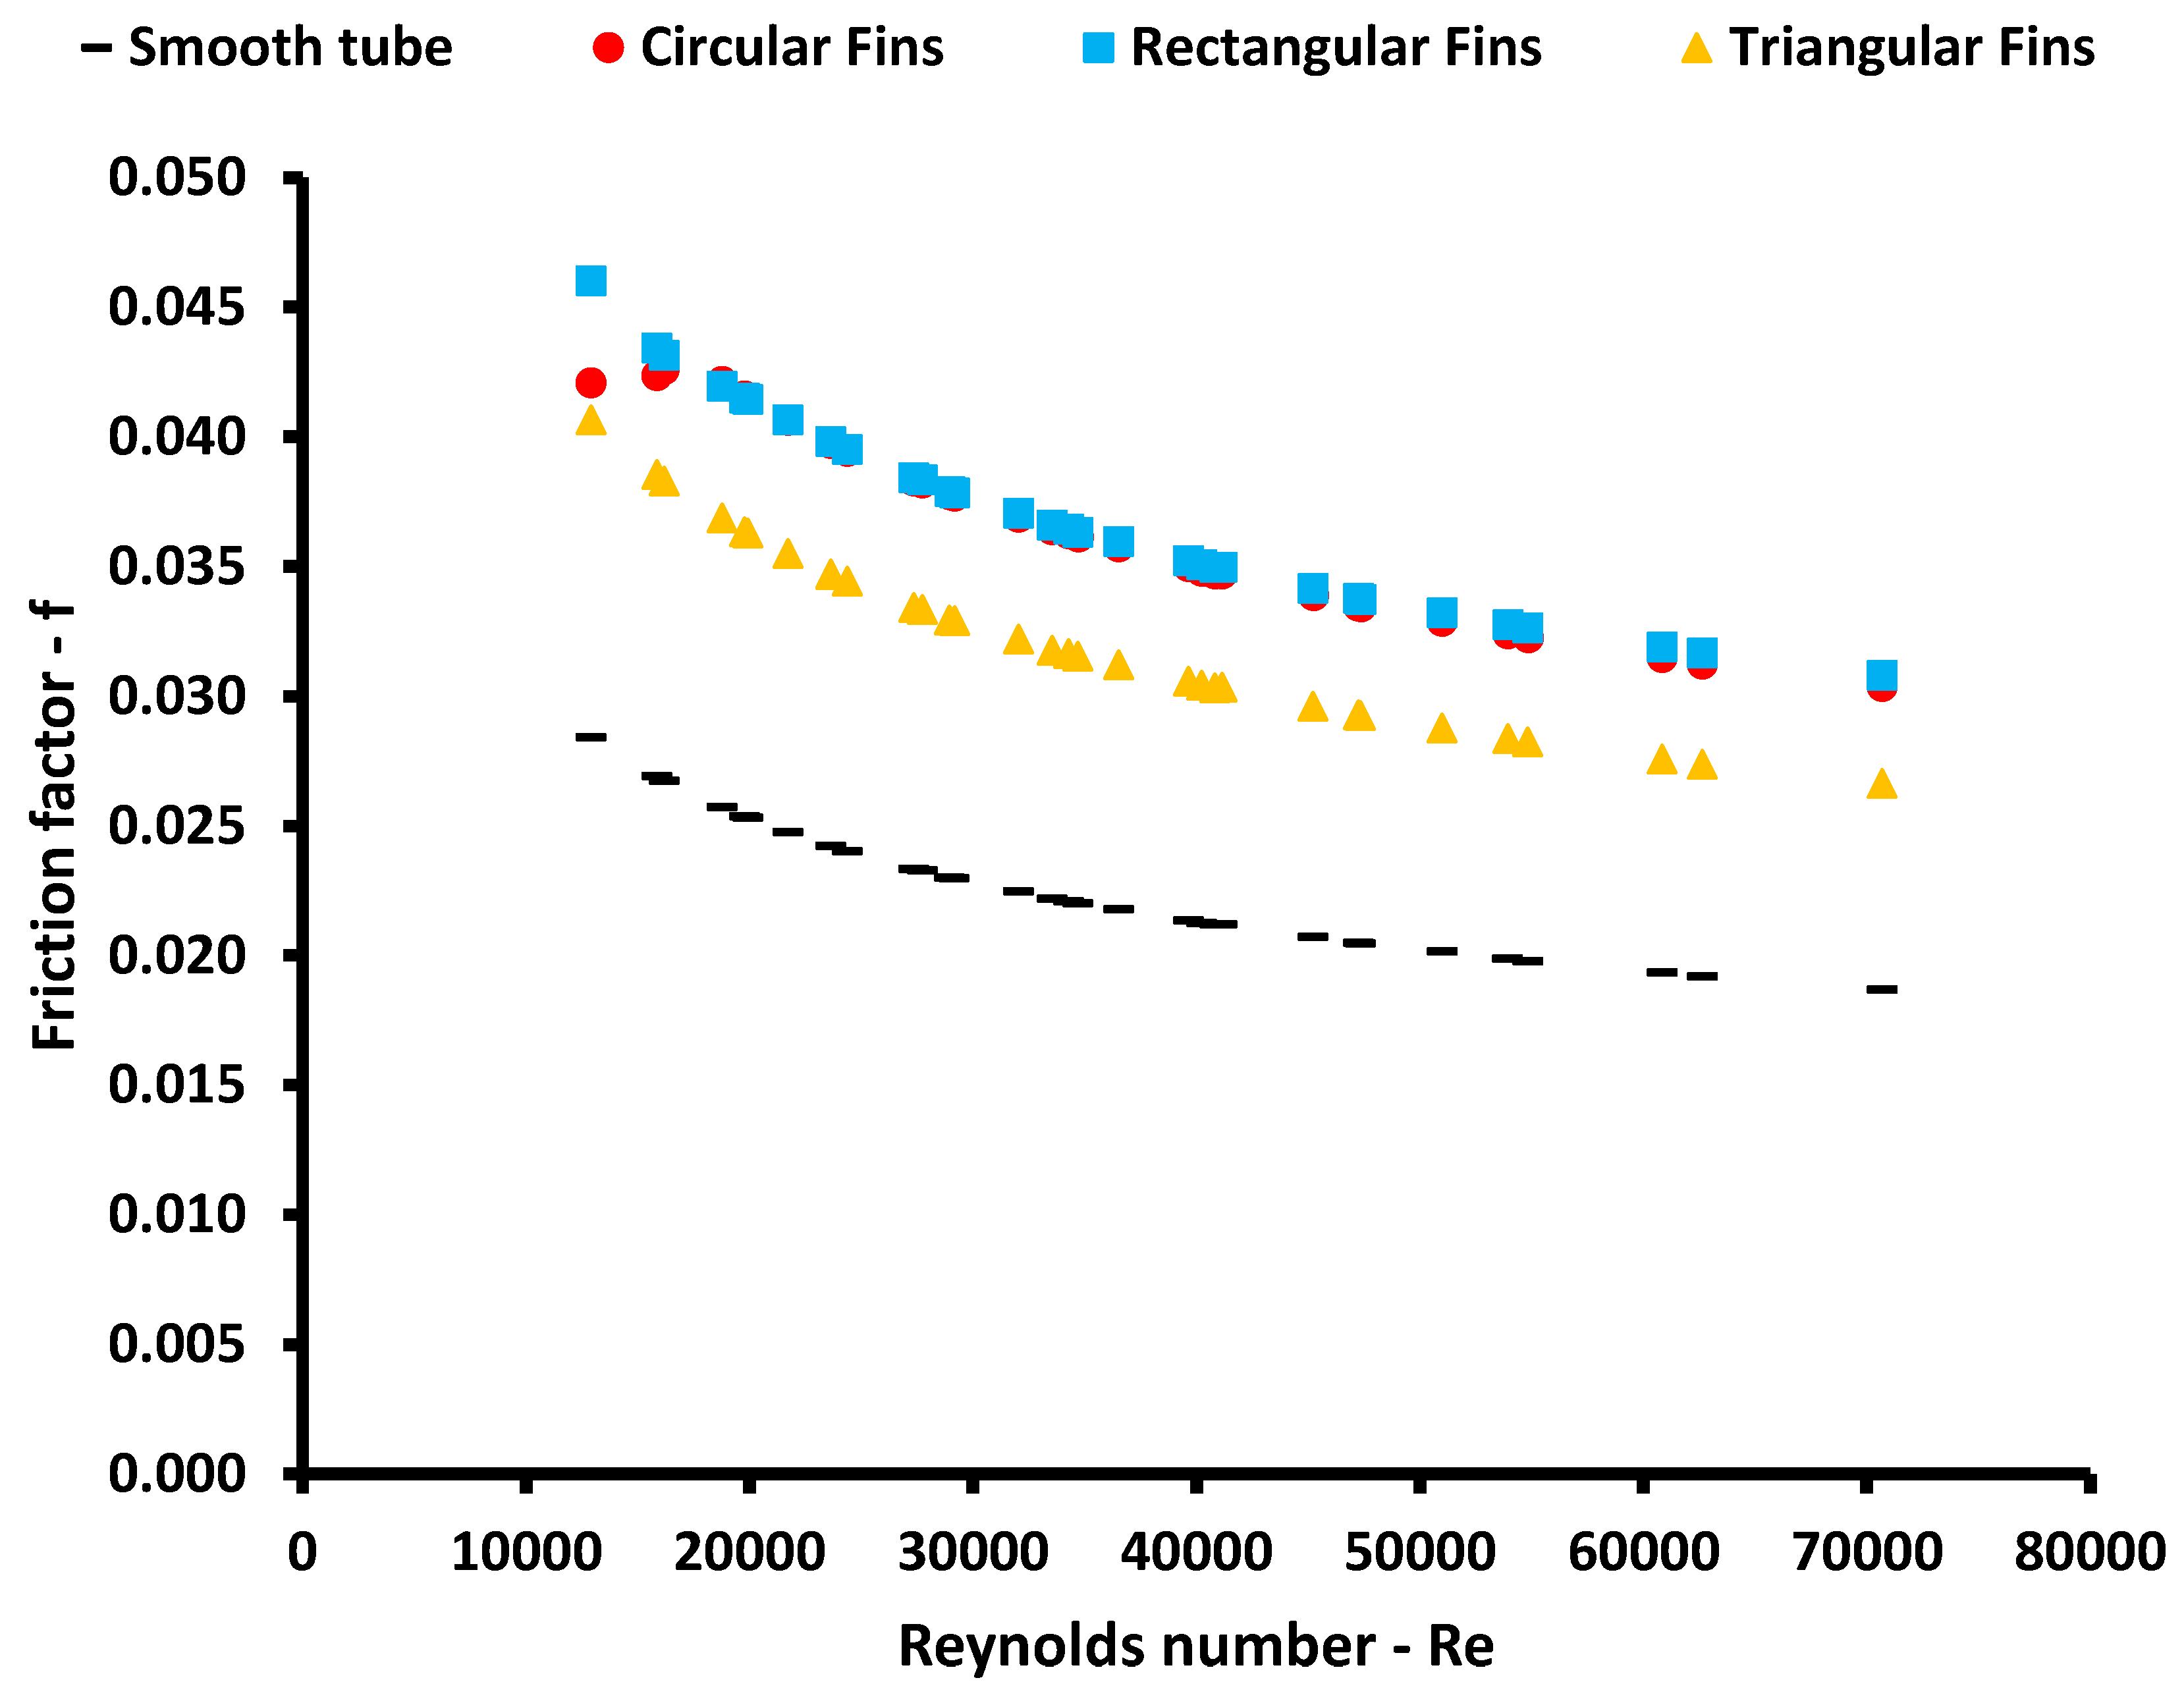
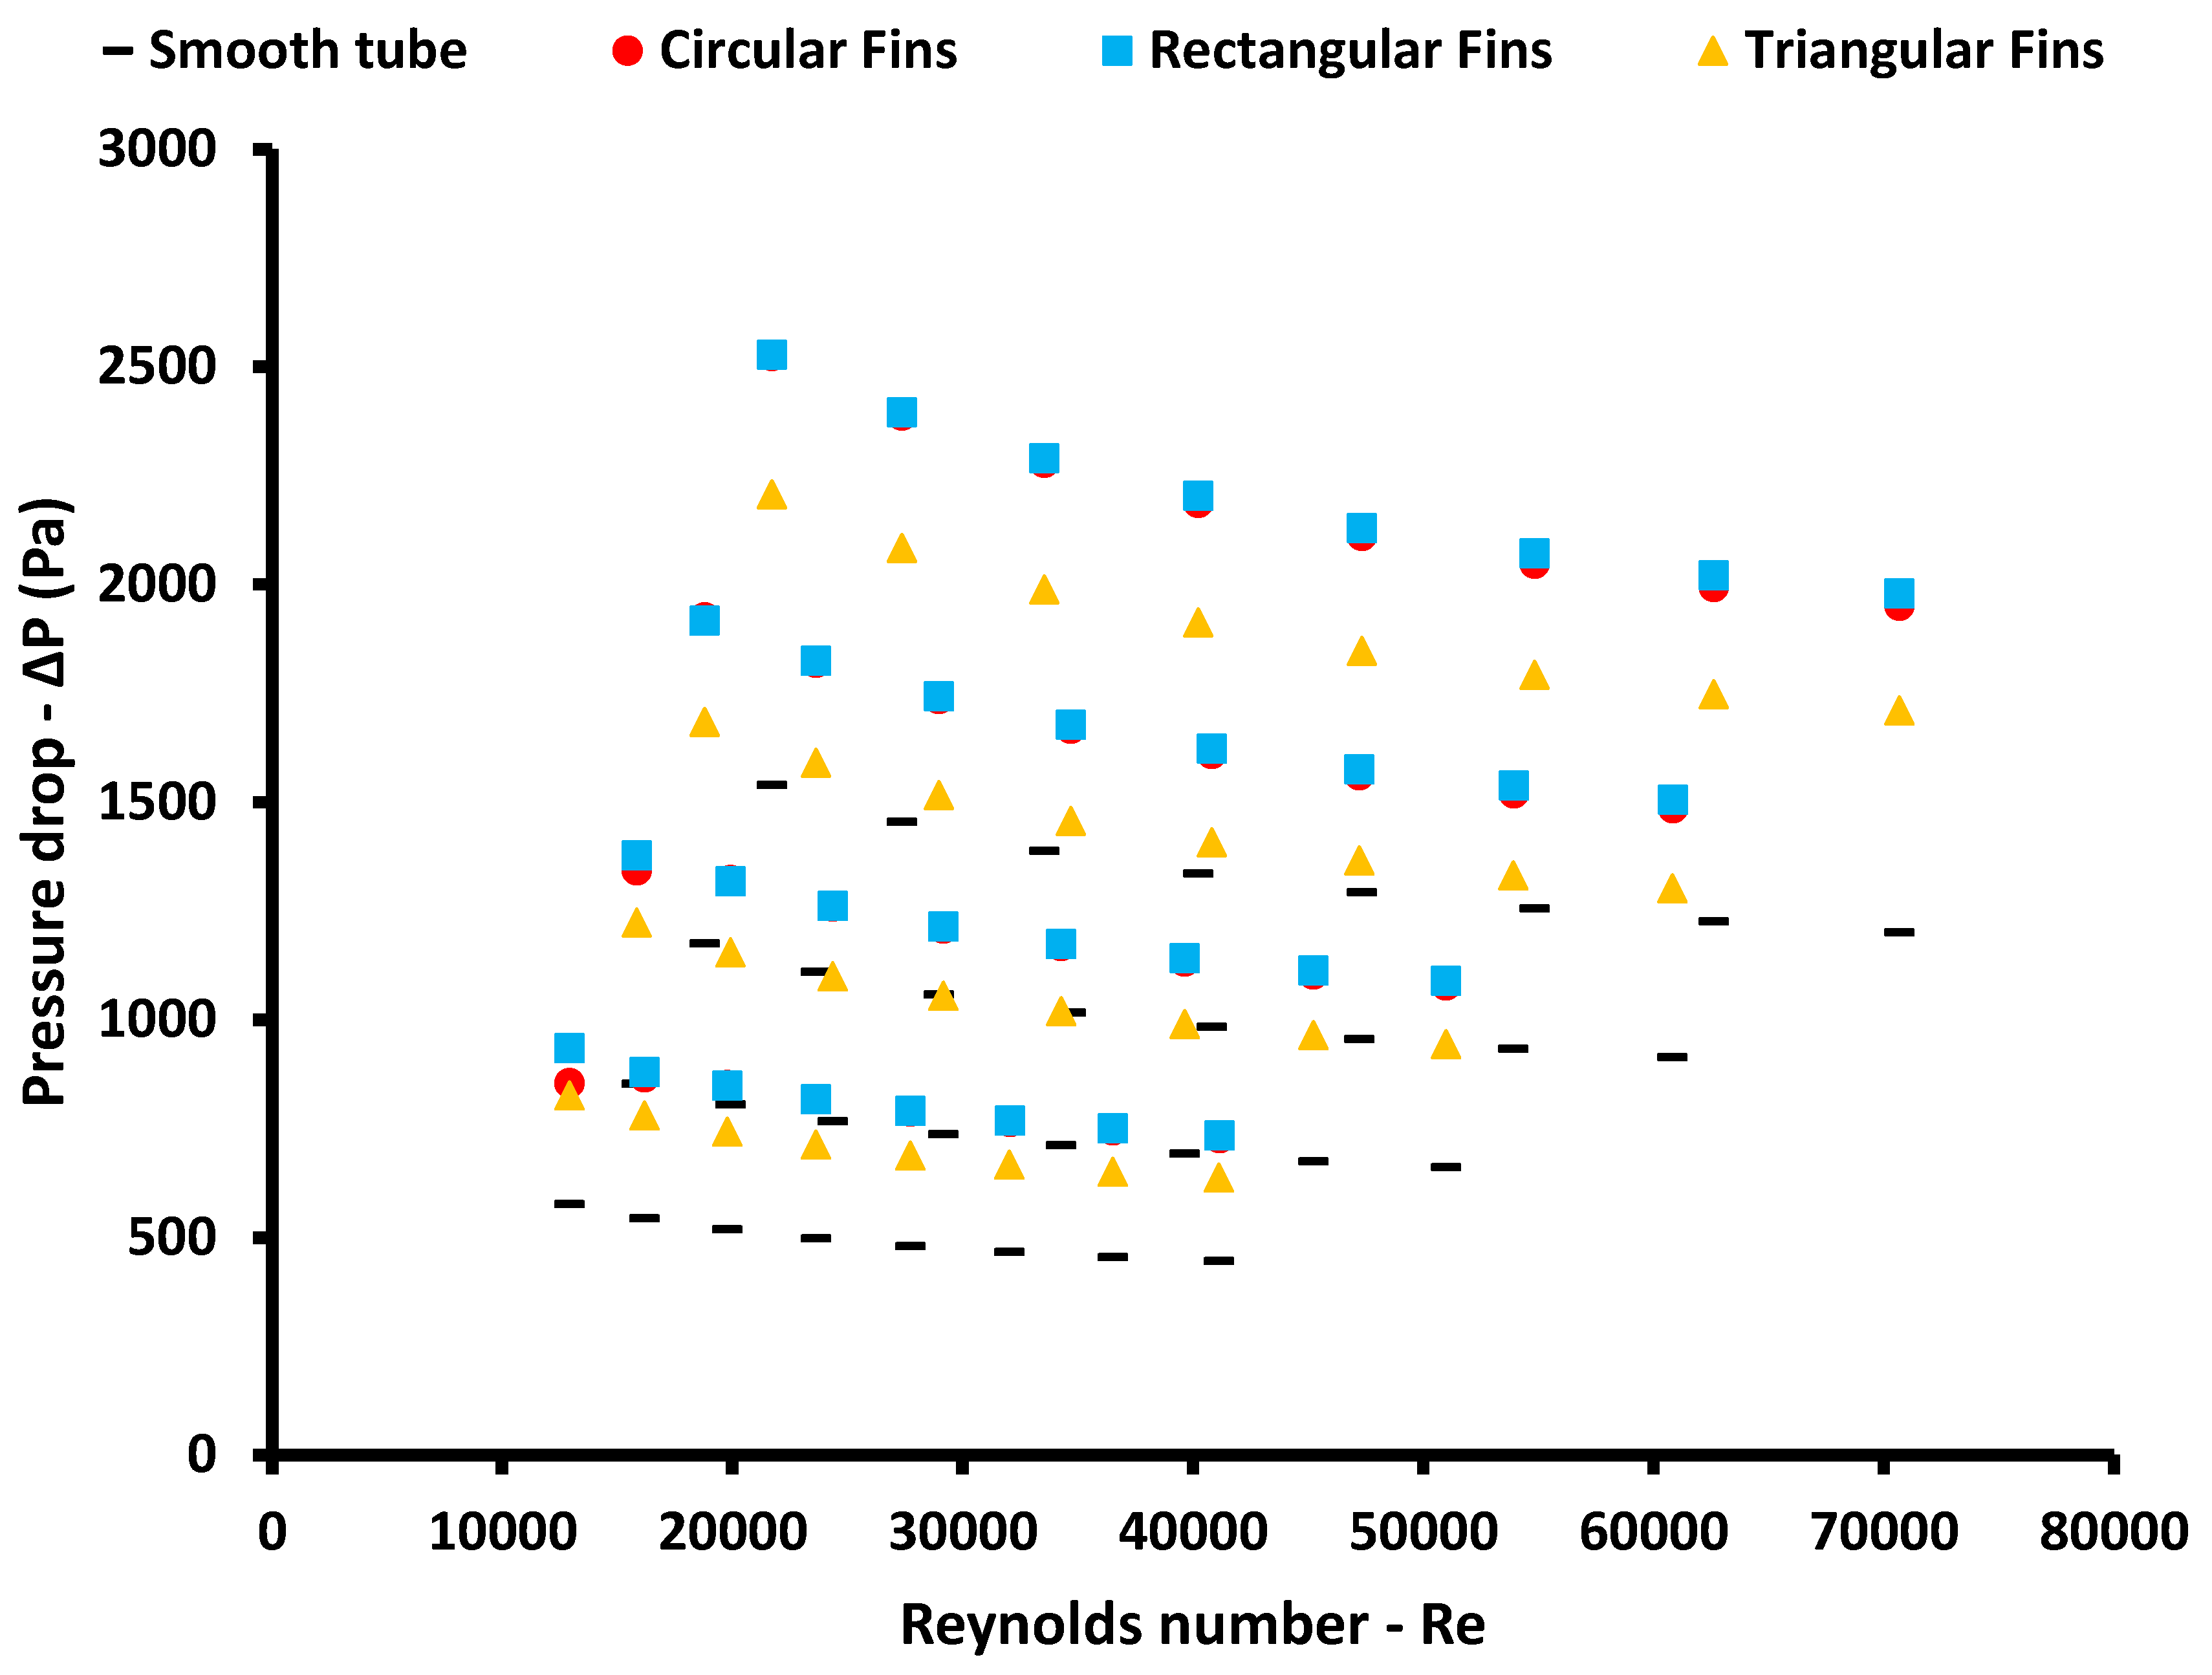
- All the examined finned tubes lead to an increase in the pressure drop. The rectangular fins lead to a 65% increase, circular fins to a 63% increase, and triangular fins to a 43% increase, approximately, compared to the reference tube.
- -
- The performance evaluation criterion (PEC) is calculated over 1 in all the finned tubes, and thus, all the examined designs lead to significant flow enhancement. More specifically, the PEC is around 1.16 for the rectangular finned tube, 1.09 for the triangular finned tube, and 1.06 for the circular finned tube.
- -
- The most suitable design is the tube with the rectangular fins; the second one is the design with the triangular fins, while the use of circular fins is the less effective design.
- -
- The pumping work demand takes very small values, which indicates that it is not an obstacle in the system operation. Moreover, the Bejan number takes values over 99%. Τhis fact proves that the entropy is mainly generated due to the temperature increase, and the pressure drop does not generate an important amount of entropy in the system.
Author Contributions
Funding
Informed Consent Statement
Data Availability Statement
Conflicts of Interest
Nomenclature
| Be | Bejan number |
| cp | Specific heat capacity, J/kgK |
| Din | Inner tube diameter, m |
| Dout | Outer tube diameter, m |
| f | Friction factor |
| h | Heat convection coefficient, W/m2K |
| k | Thermal conductivity, W/mK |
| L | Tube length, m |
| M | Mass flow rate, kg/s |
| N | Points of approximation |
| Nu | Nusselt Number |
| PEC | Performance Evaluation Criterion |
| Pr | Prandtl Number |
| Q | Heat rate, W |
| q | Heat flux, W/m2 |
| Re | Reynolds Number |
| Tin | Fluid inlet bulk temperature, K |
| Tm | Fluid mean temperature, K |
| Tout | Fluid outlet bulk temperature, K |
| Twall | Mean wall temperature, K |
| u | Mean fluid velocity, m/s |
| Wp | Pumping work demand, W |
| X | Parameter of approximation |
| Greek Symbols | |
| ΔP | Pressure drop, Pa |
| ΔSP | Generated entropy due to pressure drop, W/K |
| ΔST | Generated entropy due to temperature increase, W/K |
| μ | Dynamic viscosity, Pa s |
| ρ | Density, kg/m3 |
| Subscripts and Superscripts | |
| circ | Circular fins |
| fluid | Mean fluid |
| rect | Rectangular fins |
| ref | Reference tube |
| th | Theoretical |
| tri | Triangular tube |
| wall | Mean wall |
| 0 | Reference case |
References
- The 17 Goals. Department of Economic and Social Affairs, Sustainable Development, United Nations. Available online: https://sdgs.un.org/goals (accessed on 1 February 2022).
- Yang, X.; Chen, P. Heat transfer enhancement strategies for eco-friendly dry hobbing considering the heat exchange capacity of chips. Case Stud. Therm. Eng. 2021, 29, 101716. [Google Scholar] [CrossRef]
- Mahian, O.; Bellos, E.; Markides, C.N.; Taylor, R.A.; Alagumalai, A.; Yang, L.; Qin, C.; Lee, B.J.; Ahmadi, G.; Safaei, M.R.; et al. Recent advances in using nanofluids in renewable energy systems and the environmental implications of their uptake. Nano Energy 2021, 86, 106069. [Google Scholar] [CrossRef]
- Akbarzadeh, S.; Valipour, M.S. Heat transfer enhancement in parabolic trough collectors: A comprehensive review. Renew. Sustain. Energy Rev. 2018, 92, 198–218. [Google Scholar] [CrossRef]
- Bellos, E.; Tzivanidis, C.; Tsimpoukis, D. Enhancing the performance of parabolic trough collectors using nanofluids and turbulators. Renew. Sustain. Energy Rev. 2018, 91, 358–375. [Google Scholar] [CrossRef]
- Said, Z.; Sundar, L.S.; Tiwari, A.K.; Ali, H.M.; Sheikholeslami, M.; Bellos, E.; Babar, H. Recent advances on the fundamental physical phenomena behind stability, dynamic motion, thermophysical properties, heat transport, applications, and challenges of nanofluids. Phys. Rep. 2021, 946, 1–94. [Google Scholar] [CrossRef]
- Hasanpour, A.; Farhadi, M.; Sedighi, K. A review study on twisted tape inserts on turbulent flow heat exchangers: The overall enhancement ratio criteria. Int. Commun. Heat Mass Transf. 2014, 55, 53–62. [Google Scholar] [CrossRef]
- Kumar, A.; Chamoli, S.; Kumar, M. Experimental investigation on thermal performance and fluid flow characteristics in heat exchanger tube with solid hollow circular disk inserts. Appl. Therm. Eng. 2016, 100, 227–236. [Google Scholar] [CrossRef]
- Eiamsa-Ard, S.; Promvonge, P. Experimental investigation of heat transfer and friction characteristics in a circular tube fitted with V-nozzle turbulators. Int. Commun. Heat Mass Transf. 2006, 33, 591–600. [Google Scholar] [CrossRef]
- Promvonge, P. Thermal performance in circular tube fitted with coiled square wires. Energy Convers. Manag. 2008, 49, 980–987. [Google Scholar] [CrossRef]
- Eiamsa-Ard, S.; Wongcharee, K.; Eiamsa-Ard, P.; Thianpong, C. Heat transfer enhancement in a tube using delta-winglet twisted tape inserts. Appl. Therm. Eng. 2010, 30, 310–318. [Google Scholar] [CrossRef]
- Fan, A.; Deng, J.; Nakayama, A.; Liu, W. Parametric study on turbulent heat transfer and flow characteristics in a circular tube fitted with louvered strip inserts. Int. J. Heat Mass Transf. 2012, 55, 5205–5213. [Google Scholar] [CrossRef]
- Bhuiya, M.; Chowdhury, M.; Ahamed, J.; Khan, M.; Sarkar, M.; Kalam, M.; Masjuki, H.; Shahabuddin, M. Heat transfer performance for turbulent flow through a tube using double helical tape inserts. Int. Commun. Heat Mass Transf. 2012, 39, 818–825. [Google Scholar] [CrossRef]
- Zhang, X.; Liu, Z.; Liu, W. Numerical studies on heat transfer and flow characteristics for laminar flow in a tube with multiple regularly spaced twisted tapes. Int. J. Therm. Sci. 2012, 58, 157–167. [Google Scholar] [CrossRef]
- Liu, L.; Cao, Z.; Shen, T.; Zhang, L. Experimental and numerical investigation on flow and heat transfer characteristics of a multi-waves internally spiral finned tube. Int. J. Heat Mass Transf. 2021, 172, 121104. [Google Scholar] [CrossRef]
- Pai, Y.-W.; Yeh, R.-H. Experimental investigation of heat transfer and pressure drop characteristics of internal finned tubes. Int. J. Heat Mass Transf. 2021, 183, 122183. [Google Scholar] [CrossRef]
- Bejan, A. Advanced Engineering Thermodynamics, 3rd ed.; John Wiley & Sons Inc.: Hoboken, NJ, USA, 2006. [Google Scholar]
- Gnielinski, V. New Equations for Heat and Mass Transfer in Turbulent Pipe and Channel Flow. Int. Chem. Eng. 1976, 16, 359–363. [Google Scholar]
- Dassault Systèmes SolidWorks Corporation. SolidWorks Flow Simulation. Available online: https://www.solidworks.com/product/solidworks-flow-simulation (accessed on 1 February 2022).
- Mwesigye, A.; Bello-Ochende, T.; Meyer, J.P. Heat transfer and thermodynamic performance of a parabolic trough receiver with centrally placed perforated plate inserts. Appl. Energy 2014, 136, 989–1003. [Google Scholar] [CrossRef] [Green Version]
- Jensen, M.K.; Vlakancic, A. Technical Note Experimental investigation of turbulent heat transfer and fluid flow in internally finned tubes. Int. J. Heat Mass Transf. 1999, 42, 1343–1351. [Google Scholar] [CrossRef]


| Mesh 1 | Mesh 2 | Mesh 3 | Mesh 4 | |
|---|---|---|---|---|
| Total cells | 12,200 | 72,664 | 715,641 | 1,359,609 |
| Fluid cells | 4864 | 36,120 | 333,921 | 743,585 |
| Solid cells | 7336 | 36,544 | 381,720 | 616,024 |
| u (m/s) | 0.5054 | 0.4889 | 0.4819 | 0.4827 |
| Tout (K) | 309.62 | 309.95 | 309.96 | 309.98 |
| Twall (K) | 325.02 | 322.11 | 321.71 | 321.68 |
| ΔP (Pa) | 351.4 | 321.0 | 323.3 | 323.6 |
Publisher’s Note: MDPI stays neutral with regard to jurisdictional claims in published maps and institutional affiliations. |
© 2022 by the authors. Licensee MDPI, Basel, Switzerland. This article is an open access article distributed under the terms and conditions of the Creative Commons Attribution (CC BY) license (https://creativecommons.org/licenses/by/4.0/).
Share and Cite
Bellos, E.; Lykas, P.; Tzivanidis, C. Heat and Flow Study of the Internally Finned Tubes with Different Fin Geometries. Appl. Syst. Innov. 2022, 5, 50. https://doi.org/10.3390/asi5030050
Bellos E, Lykas P, Tzivanidis C. Heat and Flow Study of the Internally Finned Tubes with Different Fin Geometries. Applied System Innovation. 2022; 5(3):50. https://doi.org/10.3390/asi5030050
Chicago/Turabian StyleBellos, Evangelos, Panagiotis Lykas, and Christos Tzivanidis. 2022. "Heat and Flow Study of the Internally Finned Tubes with Different Fin Geometries" Applied System Innovation 5, no. 3: 50. https://doi.org/10.3390/asi5030050
APA StyleBellos, E., Lykas, P., & Tzivanidis, C. (2022). Heat and Flow Study of the Internally Finned Tubes with Different Fin Geometries. Applied System Innovation, 5(3), 50. https://doi.org/10.3390/asi5030050