1. Introduction
The novel coronavirus pandemic is a continuous pandemic (COVID-19) caused by a severe acute respiratory syndrome coronavirus [
1,
2,
3]. The epidemic was discovered in Wuhan, China, in December 2019, and announced to be a public health emergency of international concern on 30 January 2020 [
1,
2,
3]. The ability to detect disease outbreaks in the early stages is a key component of efficient disease control and prevention. Increased availability of healthcare data has facilitated the development of algorithms that allow more effective disease surveillance. The research focuses on the development of tools for outbreak data collection, distribution, analysis, and simulation. This paper describes the geographic information system (GIS) that we developed to identify and monitor disease outbreaks, considering the strengths and limitations of data collection instruments, facility of location data collection, and relevant attributes for understanding disease risk. By using such information, it is quite easy for authorities to locate the specific area and take appropriate actions. However, GIS techniques, resources, and methods can be used for more effective investigation of epidemic, demographic, and environmental data.
Early detection of disease outbreaks is crucial for the effective control of infectious diseases. Spatial data are currently being collected but are often underused in routine surveillance of infectious diseases, especially in developing countries. As the outbreak is often characterized by the degree of spatial diffusion of cases, spatial-temporal surveillance algorithms are being developed in many countries. These algorithms aim to facilitate the early detection of disease outbreaks that show spatial groupings, such as those associated with person-to-person disease transmission or a localized source of infection. An example is a COVID-19 exposure notification system or digital contact tracing system launched by Apple and Google for public health departments [
4].
The use of GIS tools to control the pandemic is widespread, especially in terms of spatiotemporal analysis and web-based mapping [
5,
6]. In the fight against COVID-19, GIS have played an important role in many aspects, including the rapid aggregation of multi-source data, the rapid visualization of epidemic information, the spatial tracking of confirmed cases, the prediction of regional transmission, the spatial segmentation of the epidemic risk and prevention level, the balancing and management of the supply and demand of material resources, and social-emotional guidance and panic elimination. It provided solid spatial information support for decision-making, measures formulation, and effectiveness assessment of COVID-19 prevention and control. GIS have a complete technological route for data preparation, platform construction, model construction, and map production. However, in the struggle against the widespread epidemic, the main challenge is finding strategies to adjust traditional technical methods and improve the speed and accuracy of information provided for social management.
In line with recent research [
7] we also recognized the following possibilities of GIS to prevent and control COVID-19:
capacity development and usage of GIS tools for controlling the pandemic;
detect the onset of epidemics, identify and count cases;
carry out convenient multi-scale dynamic mapping of the epidemics;
spatial segmentation of the epidemic risk and prevention level;
data tabulation and orientation of the data in terms of time, place, and person (descriptive epidemiology);
implement and evaluate control and prevention measures, rapid estimation of the population flow and distribution;
develop, test hypotheses and plan the balancing of supply and demand of medical resources;
assessment of the feasibility of the supply of materials and transportation risk; and
communicate the findings and monitor the spatial spread of social sentiment and detection.
However, GIS implementation implies a number of difficulties and challenges [
8], some of which are discussed in this paper, like geocoding of confirmed cases, recognition of disease dynamics or identification of vulnerable groups.
Governments, public health agencies, and academic institutions have launched different Web-based GIS services. The most famous example is the Johns Hopkins Covid-19 dashboard, a website assembled by the university’s Center for Systems Science and Engineering, which produces the well-known interface of geoportal and GIS dashboard elements like tally or leaderboard of confirmed cases, heat map of cumulative cases, tables, key figures, and graphs. It was built using the Esri commercial technology ArcGIS, which is well known and used all around the world. Actually, the ArcGIS dashboard is easy to identify, as all implementations have the same user interface. The interface is modular, and each dashboard can be assembled in a different way, but most organizations use either the same or a very similar interface [
9].
Other organizations chose to implement their own system based on open-source platforms, mostly using Leaflet or Open Layers mapping libraries [
10,
11]. The third route was taken by organizations that already had some e-health or business intelligence system and chose to create a public online dashboard to present data collected by those systems [
12].
What is common for most of these implementations is that they are designed for a broad audience and mostly focused on the presentation of a few static pieces of data, such as the daily testing of persons, confirmed cases, deaths, and recovered persons. By combining location-related data with other thematic data like epidemic ones, it is possible to gain critical insights, make better decisions, and optimize important processes and applications. Location intelligence (LI) has the capacity to organize and understand complex phenomena using geographic relationships, which are inherent in all information. It offers an opportunity to streamline the processes and recognize relationships to improve performance and results [
13].
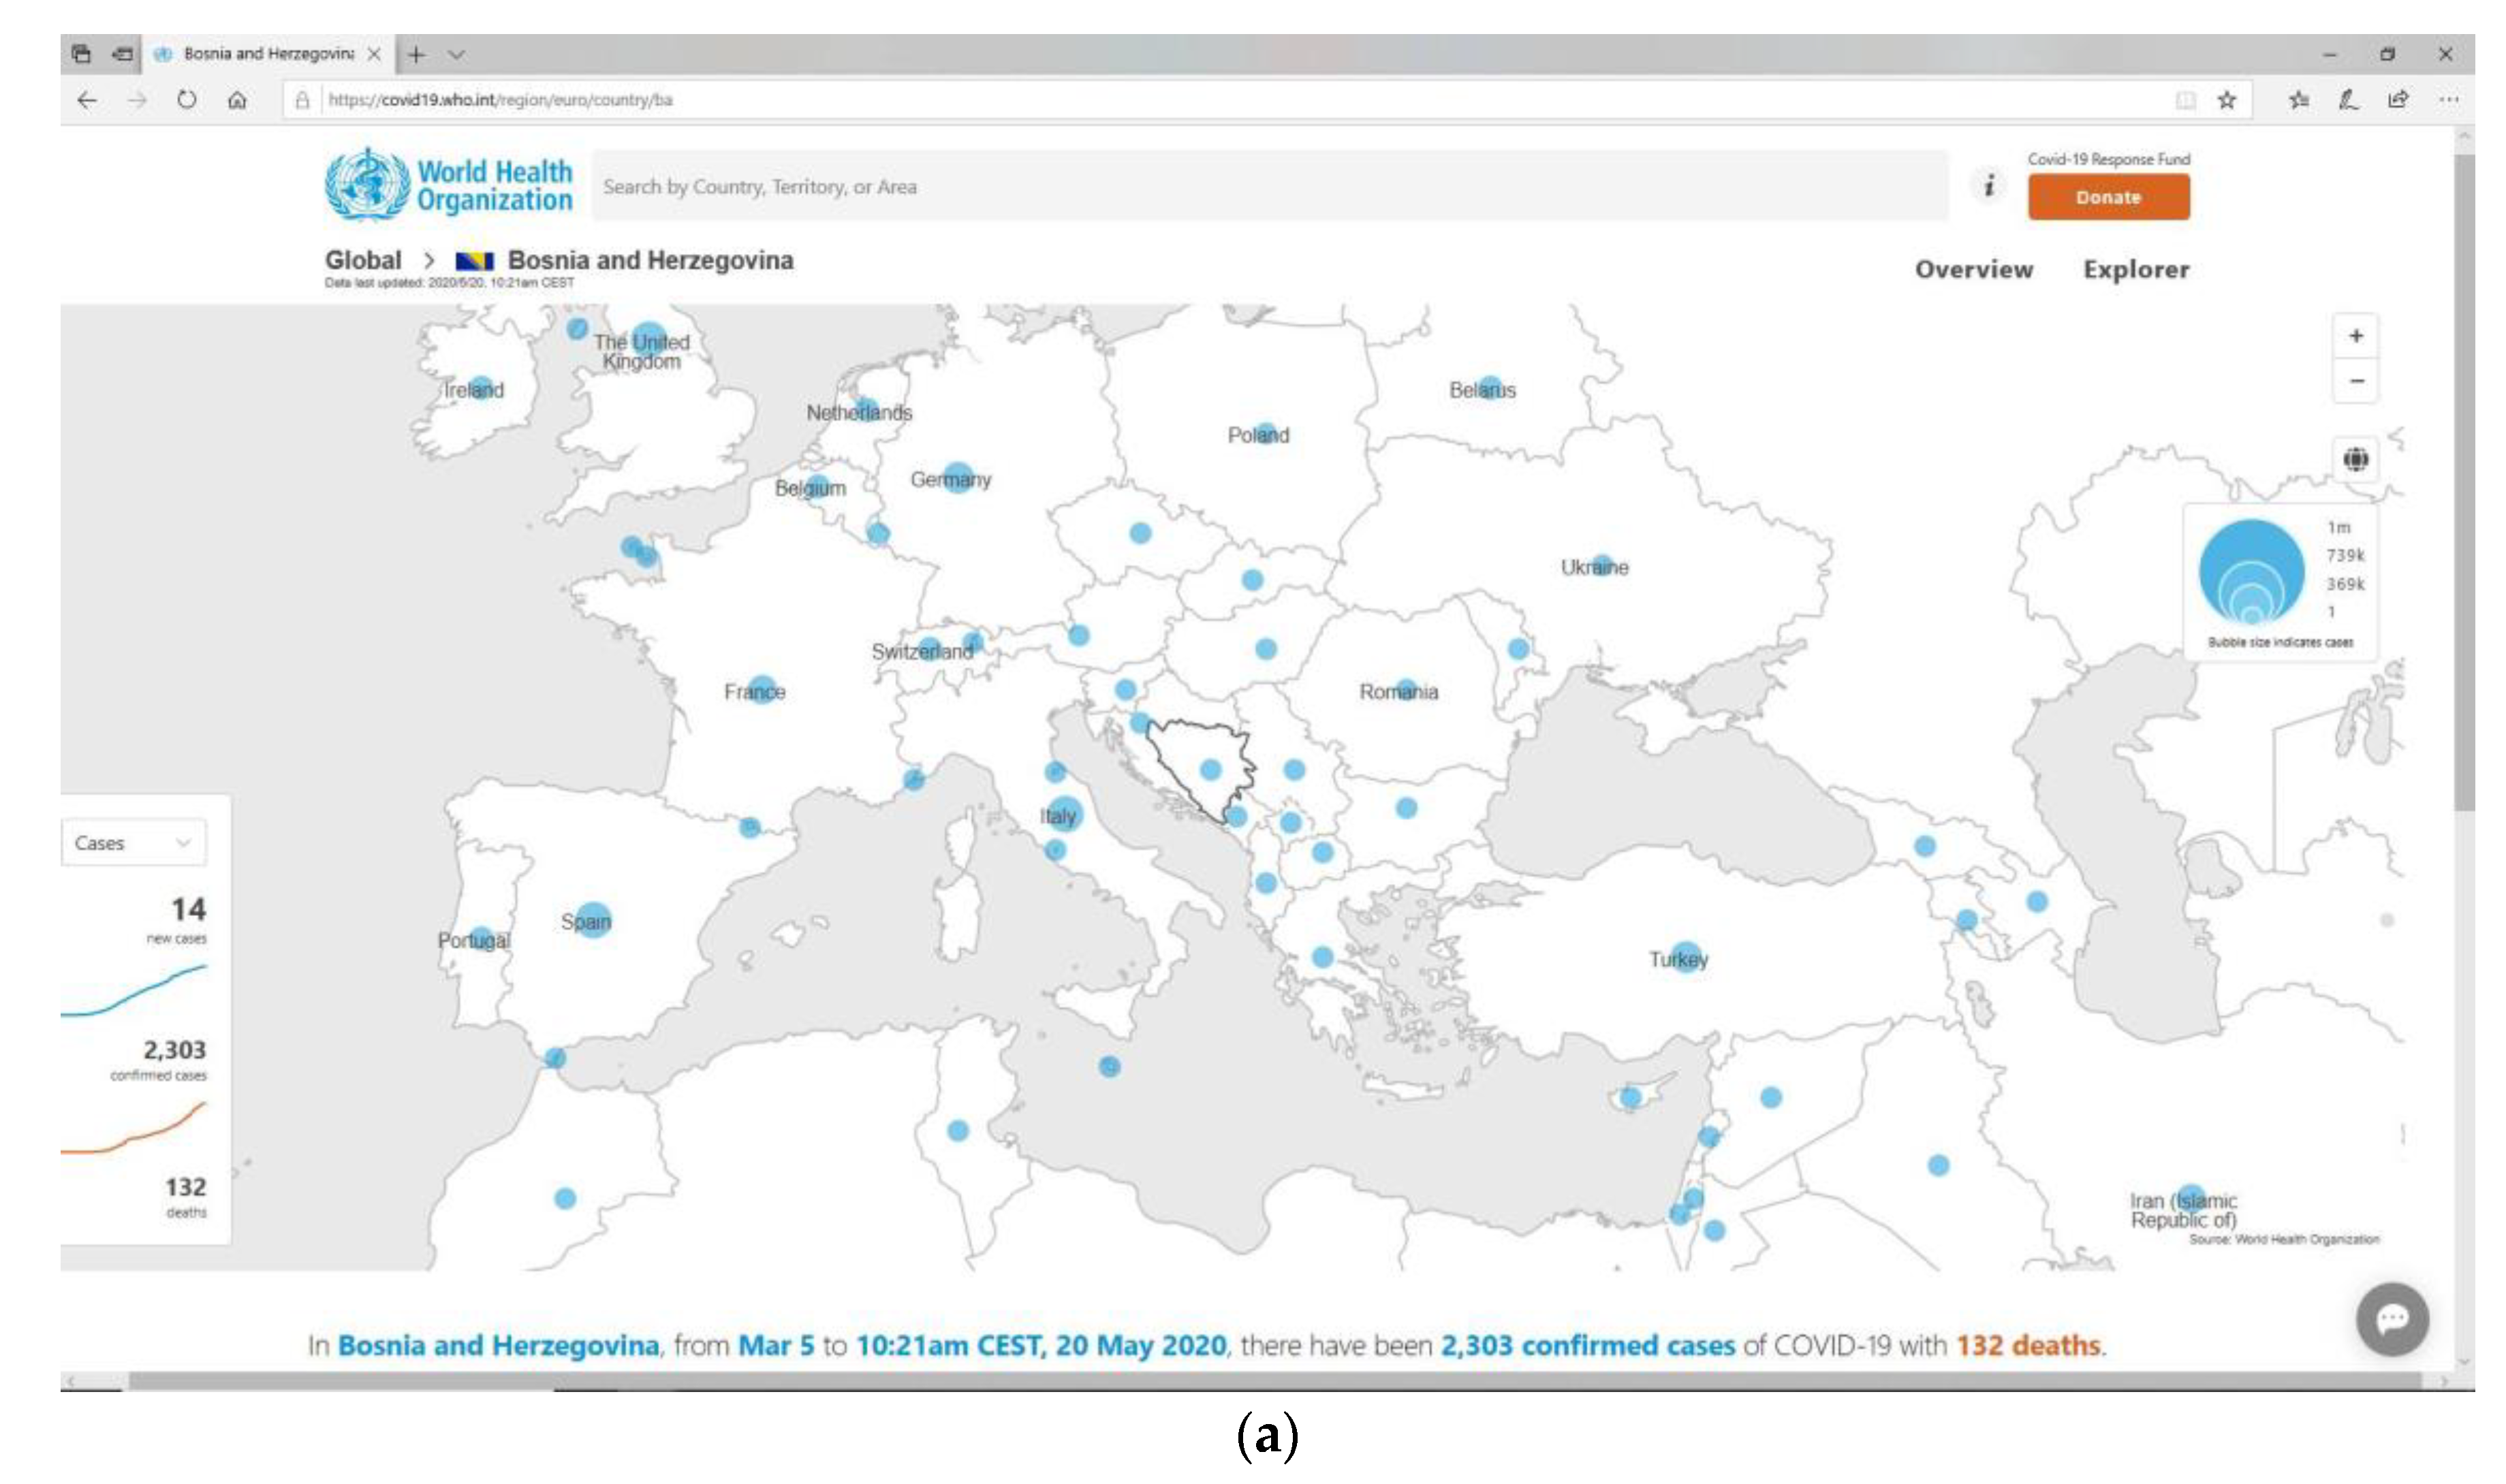
Bosnia and Herzegovina (BiH) is a country with a significantly underfunded public health system and has limited resources to fight the COVID-19 epidemic. The coronavirus was declared as a global pandemic by the World Health Organization (WHO) on 11 March 2020, and the first case was reported in BiH on 5 March 2020 (see
Figure 1). Between 5 March and 17 June 2020, there were 3.141 COVID-19 confirmed cases in Bosnia and Herzegovina, including 2.197 recovered and 168 deaths. The spread of the infection at the beginning saw a continuous increase in the number of confirmed cases, and up to 10 June a declining trend. After May 5th, the instantaneous reproductive number was below 1 [
14].
In order to respond quickly to the rapid development of the epidemic situation related to the spread of COVID-19 in BiH, the Committee for Microbiology and Related Disciplines of the Department of Medical Sciences at the Academy of Sciences and Arts of Bosnia and Herzegovina (ANUBiH) launched the Epidemic Location Intelligence System (ELIS) to monitor the spread of the COVID-19 virus and formed a multidisciplinary team to implement it. The ELIS became fully operational as early as April 2020, and it helped to assess the success of the application of control measures, as well as with other activities undertaken by epidemiological teams.
The system aims to provide epidemic data collection, processing and analysis, research of the COVID-19 epidemic, communication and exchange of information with public health service institutions, evaluation of the existing epidemic surveillance system and control measures taken. It also reports to government institutions and the general public about the current epidemic situation.
Due to the heterogeneity of health information systems and protocols defining the use of epidemic data in Bosnia and Herzegovina, a separate autonomous channel for data exchange with local public health institutes has been established to serve as a data pipeline for ELIS. Some sources of data coming from higher administrative units were publicly available on official sites of BiH institutions. The availability of geospatial data and the demand for better analytic insight have motivated us to move location analysis to the web environment. Most of the epidemic data have a location reference (address) which allows for the enhancing of its analytics with location intelligence, as shown in
Figure 2.
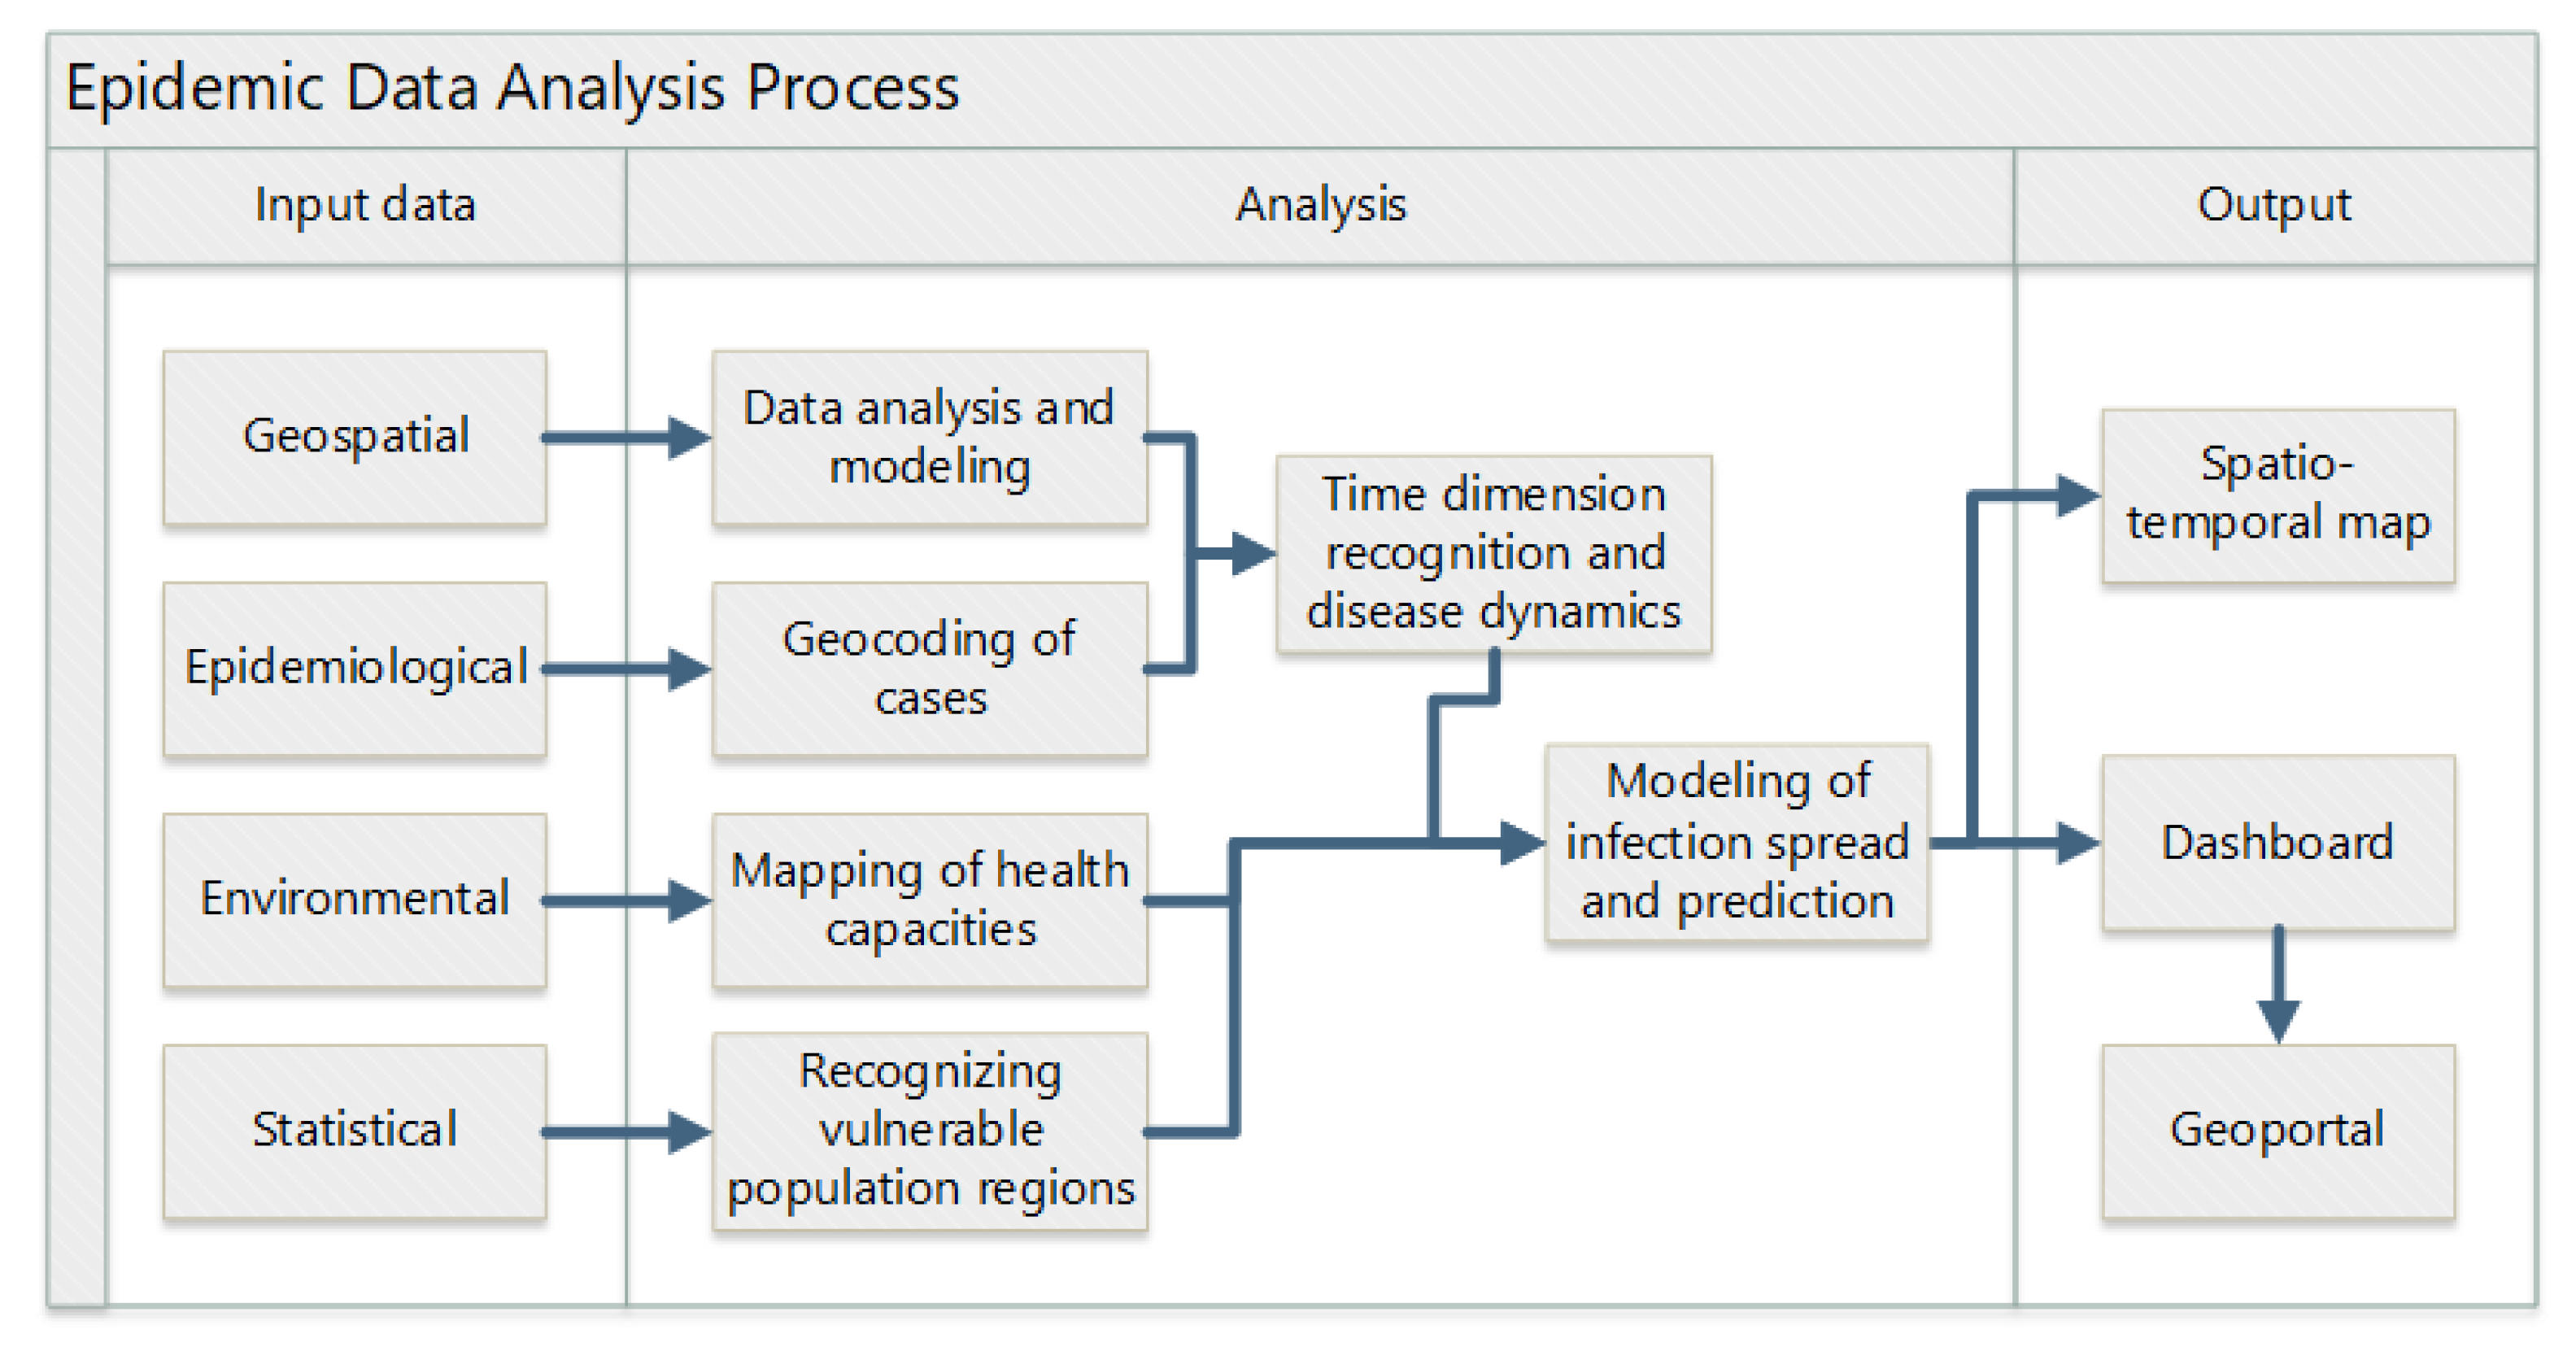
In addition to the difficulties with data exchange, the paper discusses the challenges that the project team had to deal with, such as data preparation and processing for analytical and modelling purposes; geocoding of tested, confirmed, and active cases; time dimension recognition; identification vulnerable population regions and available health resources; the modeling of the spread prediction of COVID-19; and, finally, the facilitation of seamless and instantaneous communication and cooperation between all actors, which was the biggest challenge in the current situation. The paper suggests an approach with locational intelligence using open-source software components for ELIS development as a response to all of these challenges.
2. Materials and Methods
Geoinformation systems (GIS) are all about spatial analysis, and they were originally developed to store, manage, analyze, and present spatial data. Apart from the visualization, there are many important features in GIS [
16]. It provides the capability to integrate location as part of an information system and can improve many types of applications through enhancing accuracy, efficiency, knowledge, and intelligence. Some GIS concepts resemble standard information system (IS) concepts, while others are not widely known in the information systems (IS) field [
13,
16,
17]. Most GIS techniques are grouped into:
Spatial Analysis (spatial data characteristics, map overlays, selection by attribute, selection by location, georeferencing and geocoding, classification and thematic mapping, proximity analysis, buffers, using distance during location selection, Thiessen polygons/creating proximal zones, density, and specialized modeling);
Spatial Statistics; and
Space-time Trend Analysis and 3D Modeling [
17].
The fundamental idea of employing GIS is to explore the geographic space, distribution patterns, evolution processes, and the interactions of geographical elements to enable users to better understand the world [
18].
Methodology for the establishment of the system included four steps: data collection and centralization, system integration, data presentation, and user acceptance [
19].
2.1. Data Collection and Centralization
The authors proposed a system that supports a workflow for the assessment and improvement of epidemiological surveillance, where data are taken from the electronic records of public health institutes, hospitals, and laboratories and grouped into a single epidemiological database. From this database, two data warehouses are created (spatially and epidemiologically oriented) which represent the basic data sets in ELIS that are visualized via geoportal.
Spatial data mart includes data for the whole country:
administrative spatial units up to the level of settlements;
basic infrastructure up to the level of streets and important facilities;
natural characteristics (soil types, vegetation, climate, precipitation);
demographic data up to the level of settlements (by age groups, types of households, etc.); and
healthcare facilities, pharmacies, and other health service facilities.
The actual availability of digital data is a result of series of projects implemented in Bosnia and Herzegovina during the previous decade, mostly to meet the operative needs of local government, and with the establishment of a centralized spatial information system for business processes support.
Based on the availability of data, the epidemic data used in this study was the following:
Base datasets include official daily reported values of the cumulative number of laboratory-confirmed COVID-19 cases. Epidemic data for cantons and municipalities are taken from public health databases and available records. These data are used to develop a model for predicting the spatial and temporal spread of infection. These data are supplemented with other transparent clinical and laboratory information needed to develop a model for predicting the spatial and temporal spread of infection.
2.2. System Integration
The concept and practice of openness has many components. We are most familiar with open-source software and open data, but no less important are open hardware, open standards, open education, and, consequently, open science. Open-source geospatial software includes a broad range of libraries, tools, applications, and platforms developed and released under different Open Source Initiative (OSI) licenses, where most used those that are part of the Open Source Geospatial Foundation (OSGeo) software ecosystem [
20,
21]. OpenStreetMap (OSM) is the most widely known example of a global open geospatial dataset, collaboratively maintained and expanded through a global community of contributors. OSM was inspired by restrictions on the use and availability of geospatial data all over the world.
Due to the specific situation in the country, problems with acquiring software licenses, and legal procedures in procurement, the synergy between open-source geospatial software and open geospatial data together with official data could make a good working community composed of academia, civic society, the private and public sectors [
20,
21].
There are many examples of frameworks for integrating cloud computing with GIS through architecture, workflow, and a case study in the health sector [
22] which show promise in being valuable in solving resource distribution and disease tracking.
Because of the very sudden and unplanned inception of the ELIS project as well as the time-critical nature of the epidemic, we had to act swiftly to create a reliable ICT infrastructure. Cloud computing was the only possible solution in a such short period of time available for implementation of the system. It made handling a large amount of data and services, enabling users to scale, customizing and providing computing resources (software, storage, and development platforms), and giving access to the data and services possible, without time or location dependency. Case data can include sensitive private information about citizens like name or address, which is not suitable to record in public cloud resources.
2.3. Spatial Data Presentation
The geoportal is a type of web portal (web service platform) used to find and access geographic information and associated geographic services (display, editing, analysis, etc.) via the internet, in a service-oriented architecture. This kind of portal can dramatically expand the availability of location-based data to users for review, editing, and analysis. Modern geoportals include direct access to data (in any formats or forms), metadata, visualization tools, automated provenance linkages across users, review tools for data interpretation, and sharing results in files, papers, or directly on social networks. Many use case examples, not only government healthcare (disease outbreak tracking) but also retail (trade area analysis) or marketing (location-based marketing effectiveness), which proves that it is possible to use the inherent advantages of such solutions [
13].
COVID-19 spread monitoring models were selected according to the availability of epidemic data sets. The growth dynamics of the disease was modeled using the SIR (S—susceptible; I—infectious; R—recovered) model applied to two possible scenarios: pessimistic and optimistic. Also, epi-curves and the reproduction number Rt are used to monitor the effectiveness of control measures to suppress the spread of infection.
These models with parameters related to the dynamics and prediction of disease spread were part of reports generated and published via the ELIS geoportal.
2.4. User Acceptance and Usage
End users were included in the entire process from the very beginning, preparing data and testing the interface. After the first month of the development phase, they started to use the system actively, often requesting additional functions, meaning that development continued in concert with usage.
Users of the system were divided into three groups: data administrators, data analysts, and public users. T public health system in Bosnia and Herzegovina is regulated in accordance with the administrative authorities of two entities, a district and ten cantons. The users from thirteen public health institutions together with users from clinical centers and microbiological laboratories were continuously collecting, entering, and validating data. This group has varied from 20 to 30 participants using ELIS as a mostly evidence-based system for the country level.
A group of data analysts consisting of 22 experts from these public health institutions, university clinical centers, and five faculties of medicine have used ELIS as an expert system and produced reports about spread analysis and evaluation of the epidemic situation for different areas and time periods [
14,
23]. Geographical, demographic, and other data combined with epidemic data was processed using the selected analytical methodology, and the results were arranged in the ELIS geoportal in the form of diagrams, attribute tables, interactive maps, and animations.
The third group, public users including press workers, has used ELIS as an informative portal to understand the current situation as well as the history of spread. The number of public visitors on a daily basis has consistently exceeded one hundred.
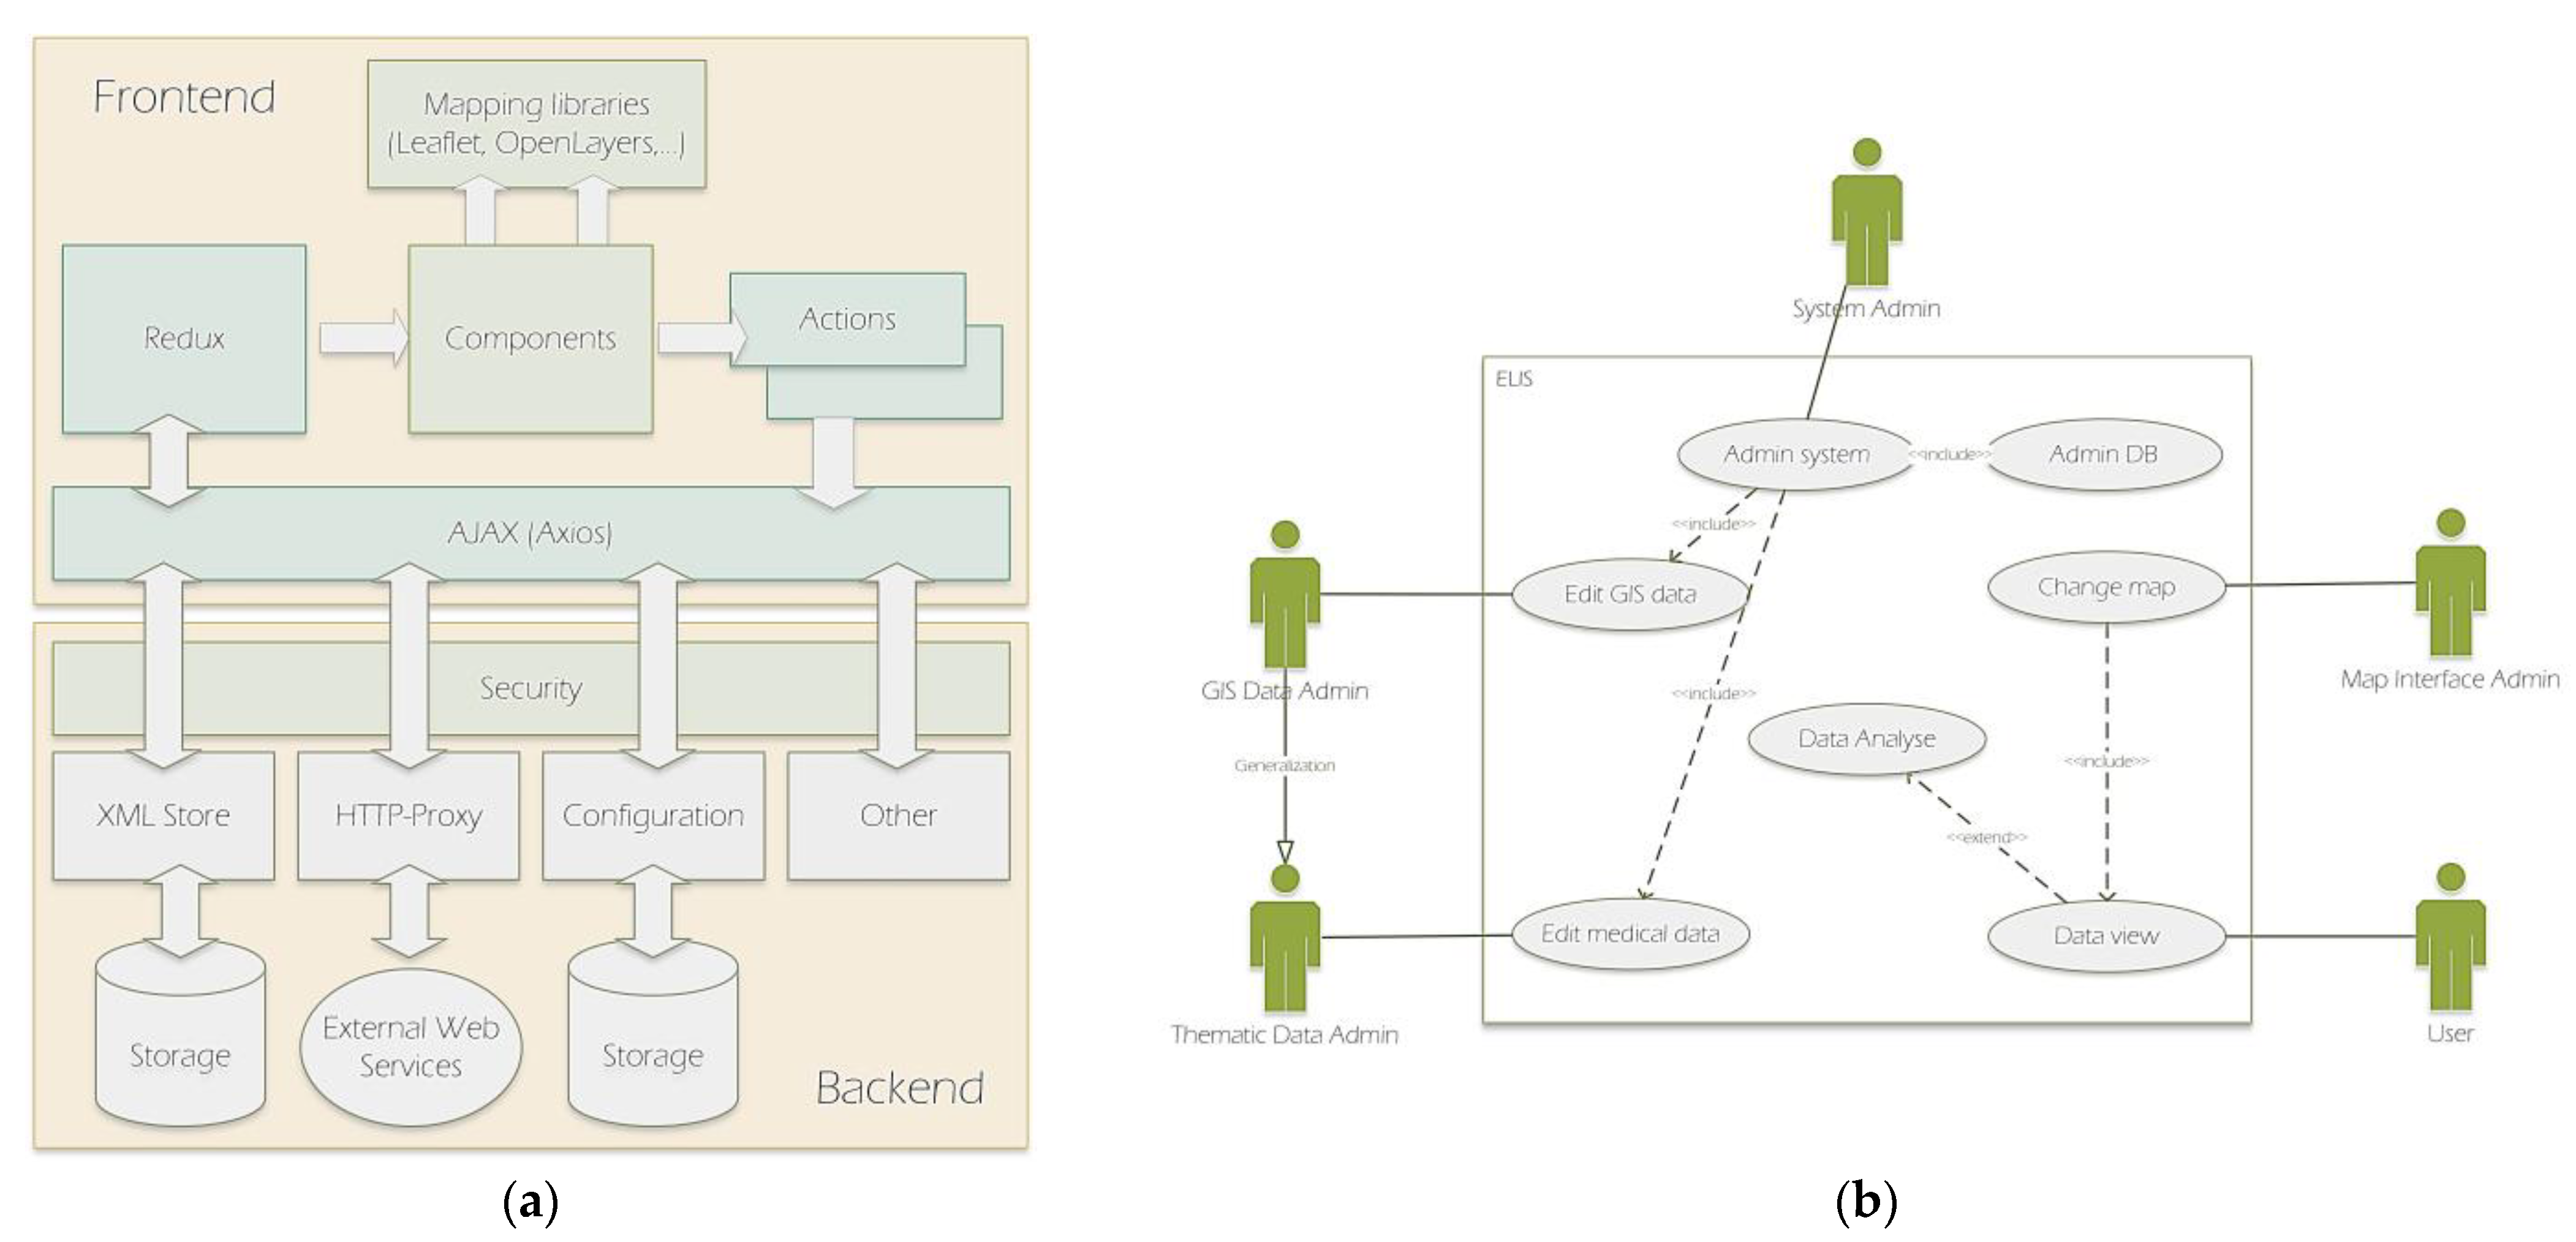
The realization of the described methodology is based on the following architectural concept for the system development (
Figure 3a):
The front end is a JavaScript web application that communicates with web services using AJAX and allows for the connection to different mapping libraries. The front end is based on the ReactJS library and the Redux architecture, which is a specific implementation of the Flux architecture.
The back end consists of a set of web services developed in Java, and includes services for HTTP-Proxy, storage of unstructured resources, and security, with the ability to configure authentication using internal or external services, and flexible authorization policies for access to services and resources.
ELIS is based on the following tech stack:
MapStore is an Open Source highly modular web GIS framework developed by GeoSolutions to create, manage and share securely in a simple and intuitive way maps created by mixing geospatial contents served from servers like Google Maps, OpenStreetMap, Bing, or from servers adhering to OGC standards like WFS, CSW, WMS, and WMTS;
GeoServer is an open-source server that generates maps and controls spatial data. It implements OGC standards like WMS, WFS, and WCS. Its interface has tools to add, update, and delete data sources and layers, as well as set styles;
OpenLayers is used for the development of front end applications such as the JavaScript library, which enables browsing and interacting with spatial data via web browsers; and
PostgreSQL with PostGIS, which is used as DBMS [
21].
Based on the architecture described above and the concept of Web 2.0, the system provides a free classification of information, a responsive interface with dynamic content, user participation in terms of changing data and interface, and software as a service based on APIs. It includes standard analytical tools such as interactive maps, control panels, various diagrams, etc. The user interface, as its client segment, lets different types of users work easily, especially the non-IT-expert users. Each logged-in user is assigned the appropriate services (maps, dashboards, database schemas) [
22].
The results of this structure with a hybrid cloud, and a mix of the private and public environment, were:
fast implementation—in a week we decided on the cloud provider, created needed infrastructure, and installed all applications;
no procurement—cloud computing allows the billing method of pay-as-you-go, plus using an open-source model made the system license-free;
access to all services 24/7 regardless of the location and the time (the user needs only an internet connection);
controlled access—the system allows only authorized users to access data based on defined rules and roles; and
data protection—sensitive data are not stored in the public cloud, they stayed in the original official store, and only aggregated on street or settlement levels for analytical purposes.
In general, the portal, as a web user interface, is an access point to many resources. It provides an environment for users to access data. The portal provides links to other websites and includes various security measures, including access rights to the portal or parts of it. It can be personalized to fit the needs of the user in terms of functionality and appearance. Its development aims to promote the interoperability of data and services, which is achieved through the acceptance and implementation of the standards. Interoperability is largely achieved through standardized geoportal architecture. Users are separated into two main categories: GIS data administrators and Case data ones (
Figure 3b.).
Along with choosing the required components to develop and deploy the web system, there are considered technical standards that allow interaction between these components [
24]. Open Geospatial Consortium (OGC) defined standards like Geography Markup Language (GML), which is based on Extensible Markup Language (XML), data identification such as the Catalog Service for the Web (CSW), data provision services such as the Web Mapping/Feature/Coverage Service (WMS/WFS/WCS), and spatial processing such as the Web Processing Service (WPS) specification, based on the Hypertext Transfer Protocol (HTTP). To integrate geospatial data and services with web-based distributed applications, the OGC specified the Web Service implementation standards (OWS) interface.
3. Results and Discussion
The Epidemic Location Intelligence System (ELIS) is an expert information system for analyzing epidemic data and reporting. The functionality includes communication, analysis, and reporting, which is provided by a robust ICT infrastructure in the background. The system is based on modern design principles and service-oriented architecture, so it allows complete separation of back end and front end, as shown in
Figure 3a. Due to the visual effectiveness of the geoportal interface itself, it is generally very popular, however, its functionality is far broader than the spatial data interfaces used by news portals (like
https://www.klix.ba/koronavirus-u-bih accessed on 26 February 2021) and some government agencies (like
https://covid-19.ba/ accessed on 10 March 2021) to present epidemic data.
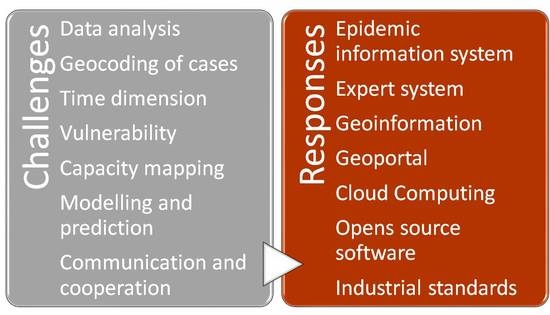
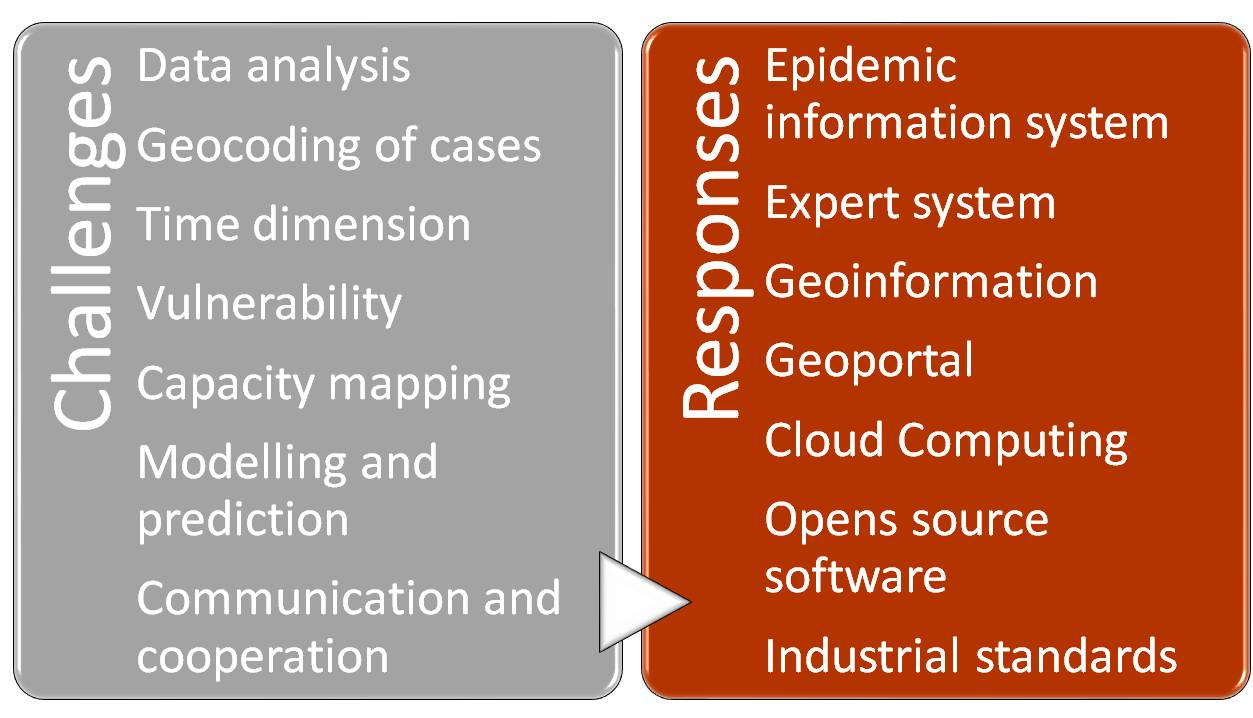
The methodological approach and carefully selected tech stack helped to provide answers to the challenges faced by the Project team:
3.1. Data Analysis and Modeling
Data analysis and modeling involve the process of extracting, transforming, and loading data into a database. These data include three types of source:
official (from the Institute of Public Health and competent institutions),
reliable (from private sources and industry), and
public (from the portal of news agencies and social networks).
Given the diversity of data sources, formats, structures, and the frequency and level of data acquisition, appropriate mechanisms are provided for the transformation of raw data into appropriate models.
Data modelling ensured that all available data was placed within a logical model implemented in the DBMS user environment. The proposed graphical and alphanumeric data model is consistent with the database model and the metadata catalog based on the Core Metadata for Geographic Datasets—ISO 19115: 2003 (E) standard. The geometric data model is based on available geometric types of the GML 3.1.1. standardized geometric data model (spatial topology), as well as associated complex types that enable the maintenance of GIS data using a time-domain (time topology) according to ISO 19107: 2003 (geographic information—spatial schema) and ISO 19108: 2002 (geographic information—temporal schema) standards [
21].
Generally, spatial data go through three phases. The first phase is their acquisition, the second one is storing in databases (to be accessible for analysis, search, querying, or further processing), and the third phase is their presentation (maps, tables, diagrams, text). Each of these phases has distinctive requirements on how to store and keep data, so the modelling of the data considers different models [
23]:
acquisition-oriented data model—receives the data in sequences and according to the structure appropriate to the way and method of their collection;
query-oriented data model—where the data are stored in the database so that they are accessible for query execution; and
output-oriented data model—supports the display of results (outputs) of query operations in the form of tables, maps, reports, and other display formats.
3.2. Geocoding of Cases
According to the definition, geocoding is the process of translating street addresses into geographic latitude and longitude coordinates for accuracy. Geocoding of epidemic cases enables mapping of tested, confirmed, and active cases, and outcomes in terms of death or recovery. Different address models, official, private, and open (subject to availability) are used to identify where COVID-19 infections have occurred.
ELIS uses OpenStreetMap (OSM), a publicly available geographic database. Using the addresses contained in the OSM, the system geolocated the cases and put them on a map. An important issue was data confidentiality. In order to respect anonymity, health data are usually aggregated at the level of the administrative unit, which, in turn, leads to a loss of knowledge about the local spatial distribution of data. Authors applied this method to epidemic data creating points as cluster representatives for settlements.
3.3. Time Dimension Recognition and Disease Dynamics
Maps with a time dimension are able to represent the spread of infection over time (
Figure 4) and recognize clustering phenomena. The capability of a geoportal for visualizing large amounts of information interactively is often seen as the only important function of it. This ability to create multiple perspectives enhances a viewer’s ability to understand studied phenomena.
The user interface is required to be intuitive and simple to learn, as shown in
Figure 5. Generally, an interactive map application allows users to explore and recognize spatial-temporal patterns.
Analogous to its positional and attribute components, the quality of spatial data can also be evaluated in terms of their temporal accuracy. This includes not only the accuracy and precision of the measurement time (for example, the date of examination) but also the temporal consistency of different data sets (which may be in conflict). As the geometric and attribute components of spatial data can be changed together or independently, their temporal validity must also be considered. Validity of the data set implies the actuality of the data in terms of the time difference between the currently available data and the actual state of the phenomenon they represent. The frequency of updating data has a direct impact on validity [
23]. On this portal, the data is updated every working day.
3.4. Recognizing Vulnerable Population Regions
The degree and severity of the disease can vary when the population from certain demographic groups is affected, and therefore age groups and other characteristics related to the population susceptibility factor are mapped, which can help control risk groups and regions. The most important factors considered for vulnerable regions [
23,
24] are related to:
3.5. Capacity Mapping
Services, medical resources, equipment, and other resources related to health care facility locations are mapped in order to more easily assess the readiness of the public health system to respond effectively to the current epidemic situation. Important quantitative information mapped are:
hospital locations;
total number of beds in hospitals;
available beds;
total number of ventilators in hospitals; and
available ventilators in hospitals.
3.6. Modelling and Prediction
Models of spreading the infection are created with the prediction of the occurrence and warn of possible risks. The system displays all reports in one place with a clear indication of the geographical area and time interval they covered. They make comparing the effects of control measures easier (
Figure 6.). Based on these assumptions, the project team has developed themes for the current state based on existing cases, and predicted conditions based on statistics.
Current state themes are:
dispersion of cases by addresses with time presentation;
cumulative disease rate per municipalities (with a percentage share in total and the ratio “per thousand inhabitants”);
overview of confirmed cases per settlements by annotation and choropleth map;
list of all tested per settlements by annotation of number of tested and choropleth maps and ratio tested in the settlement “per thousand inhabitants” by annotation; and
cumulative presentation of the ratio of cases by sex and age for the passive and active population with diagrams showing the statistics of the disease.
Predicted conditions themes are:
expected total number of cases with needs for health care in relation to the entire population;
total cumulative number of hospitalized (with mild, moderate, and severe symptoms) and isolated (supervised) and number of cases of respirator use;
expected increase of cases for the next seven days (optimistic and pessimistic);
epidemic curves (Epi-curves) [
14,
23]; and
instantaneous (weekly) reproductive number (Rt) to control the effects of the applied measures [
14,
23].
3.7. Communication and Cooperation
Interactive maps and control panels are used between participants to quickly communicate about the current situation during the monitoring and to be informed about the expected development of the situation. Interactive dashboards, like the one shown in
Figure 7, are a particularly useful tool because they display key indicators and provide summary critical information.
This work, like other aforementioned research, recognized the advantages of GIS to prevent and control COVID-19, but also some of the difficulties and challenges. Some local specifications of the country with complex and heterogeneous health information system created difficulties in development and maintenance of such platforms. At the beginning, the only continuous data source was from available public news portals, which were not official. These data were shown on the spatio-temporal map for the first six months of epidemic. With the inclusion of more and more official data, other problems arose, such as different data formats and their structures. The ANUBIH created the Center for Disease Control and GeoHealth Studies (CDC/GHS) to be responsible for the back office of the ELIS and to coordinate with health institutions. The center includes multidisciplinary teams with members who are experts in the field of health (epidemiologists, microbiologists, veterinarians), computer science, and geoinformatics.
The purpose of the geoportal is to serve as a support for the exchange of epidemiological and other data between public health institutions and the public during the pandemic crisis.
It refreshes its dashboard and thematic maps every day. Data services from international sources like WHO comes every day, but from local public health institutions usually only on working days. There are 20 to 30 visits by named users daily, and they spend approximately 30 min per visit. Named users are from public health institutions and the administrative authorities of two entities, the district and the ten cantons. There are an average of 30 visits per day by public users who spend about 10 min per visit. Data download is mostly done by scholars and data analysts who are interested in time series.
4. Conclusions
The limitations of the public health system are reflected in the partial approach to recording and reporting data in Bosnia and Herzegovina and in a number of heterogeneous data sources, which were overcome by the implementation of ELIS.
In response to the challenges which every country faces with the outbreak of COVID-19 as a public health emergency, we established an epidemic location intelligence system (ELIS) using open-source components. This approach enabled data modeling with a time dimension, vulnerable population regions, and capacity mapping, prediction, stakeholders communication, and cooperation.
The geoportal, with such structured data, allows access to information from different sources of local, national, and global levels in an interoperable manner and for a wider range of users. This access to relevant, harmonized and quality information is critical for decision-making in a public health emergency. Additionally, this interactive component with a data warehouse in the background represents a knowledge-based system intended to help decision-makers compile useful information from a combination of raw data, documents, and personal knowledge. This decision-making support system gathers and presents information like inventories of information assets, comparative statistics and demography figures between time points, and historic and predicted key indicators and natural characteristics based on statistical assumptions. We recognized the most important features of geoportals and their services: portal services that provide access to geospatial data and manage portals; presentation services used to process geospatial data and prepare it for presentation to the user; catalog services for locating geoservices providing information; and data services for accessing and downloading geospatial content. In general, portals do not store data, but datasets remain with their owners who retain control over them. Users of the services can view data and perform certain operations on them but cannot edit or save them on their system without permission and official download. This is useful for the general public, but it is restrictive for health experts, who need more freedom in data manipulation. This fact required the design of a complete spatial decision support system, with the geoportal as interface. This system is developed with interfaces that implement geospatial processes to meet domain-specific needs which vary from one research area to another. In this way, an expert involved in their field can use GIS functionality, geoinformation, and related geoprocesses in one web environment.
The system development concept was based on the principles of openness. Without the need to deal with software licenses, the complete system was ready in a week and installed in a cloud computing environment. Thanks to using the standards, acquiring data from public sources started immediately, and was quickly followed with data from the public sites of health authorities. Using open geospatial software, data and standards made the development of the system direct and fast.
The aforementioned factors created an atmosphere of trust, allowing the next step, which was the to obtaining of data directly from official sources. This was followed by epidemic data analysis including the application of appropriate data processing algorithms and methods for presenting the outcomes. We reported the results by using advanced features like dashboards, maps, charts, epi-curves, SIR, and Rt diagrams.
Furthermore, among its other purposes, ELIS will serve as a research base of interest for the scientific community in the country and the region.


