
Fuzzy Based Prediction Model for Air Quality Monitoring for Kampala City in East Africa


Abstract
1. Introduction
1.1. Main Air Pollutants
1.1.1. Nitrogen Dioxide
1.1.2. Sulphur Dioxide
1.1.3. Particulate Matter (PM)
2. Materials and Methods
2.1. Fuzzy Modeling Approach
2.1.1. Description of Fuzzy Logic
- x is a variable name
- T(x) is a set of terms;
- U is universe of discourse;
- G is set of syntax rules;
- M is a set of semantic rules.
- Fuzzy logic has the ability to describe systems in terms of a combination of numeric and linguistic means.
- Fuzzy logic measures the certainty or uncertainty of the membership of an element of the set.
- Fuzzy algorithms are often robust in the sense that they are not very sensitive to changing environments and erroneous or forgotten rules.
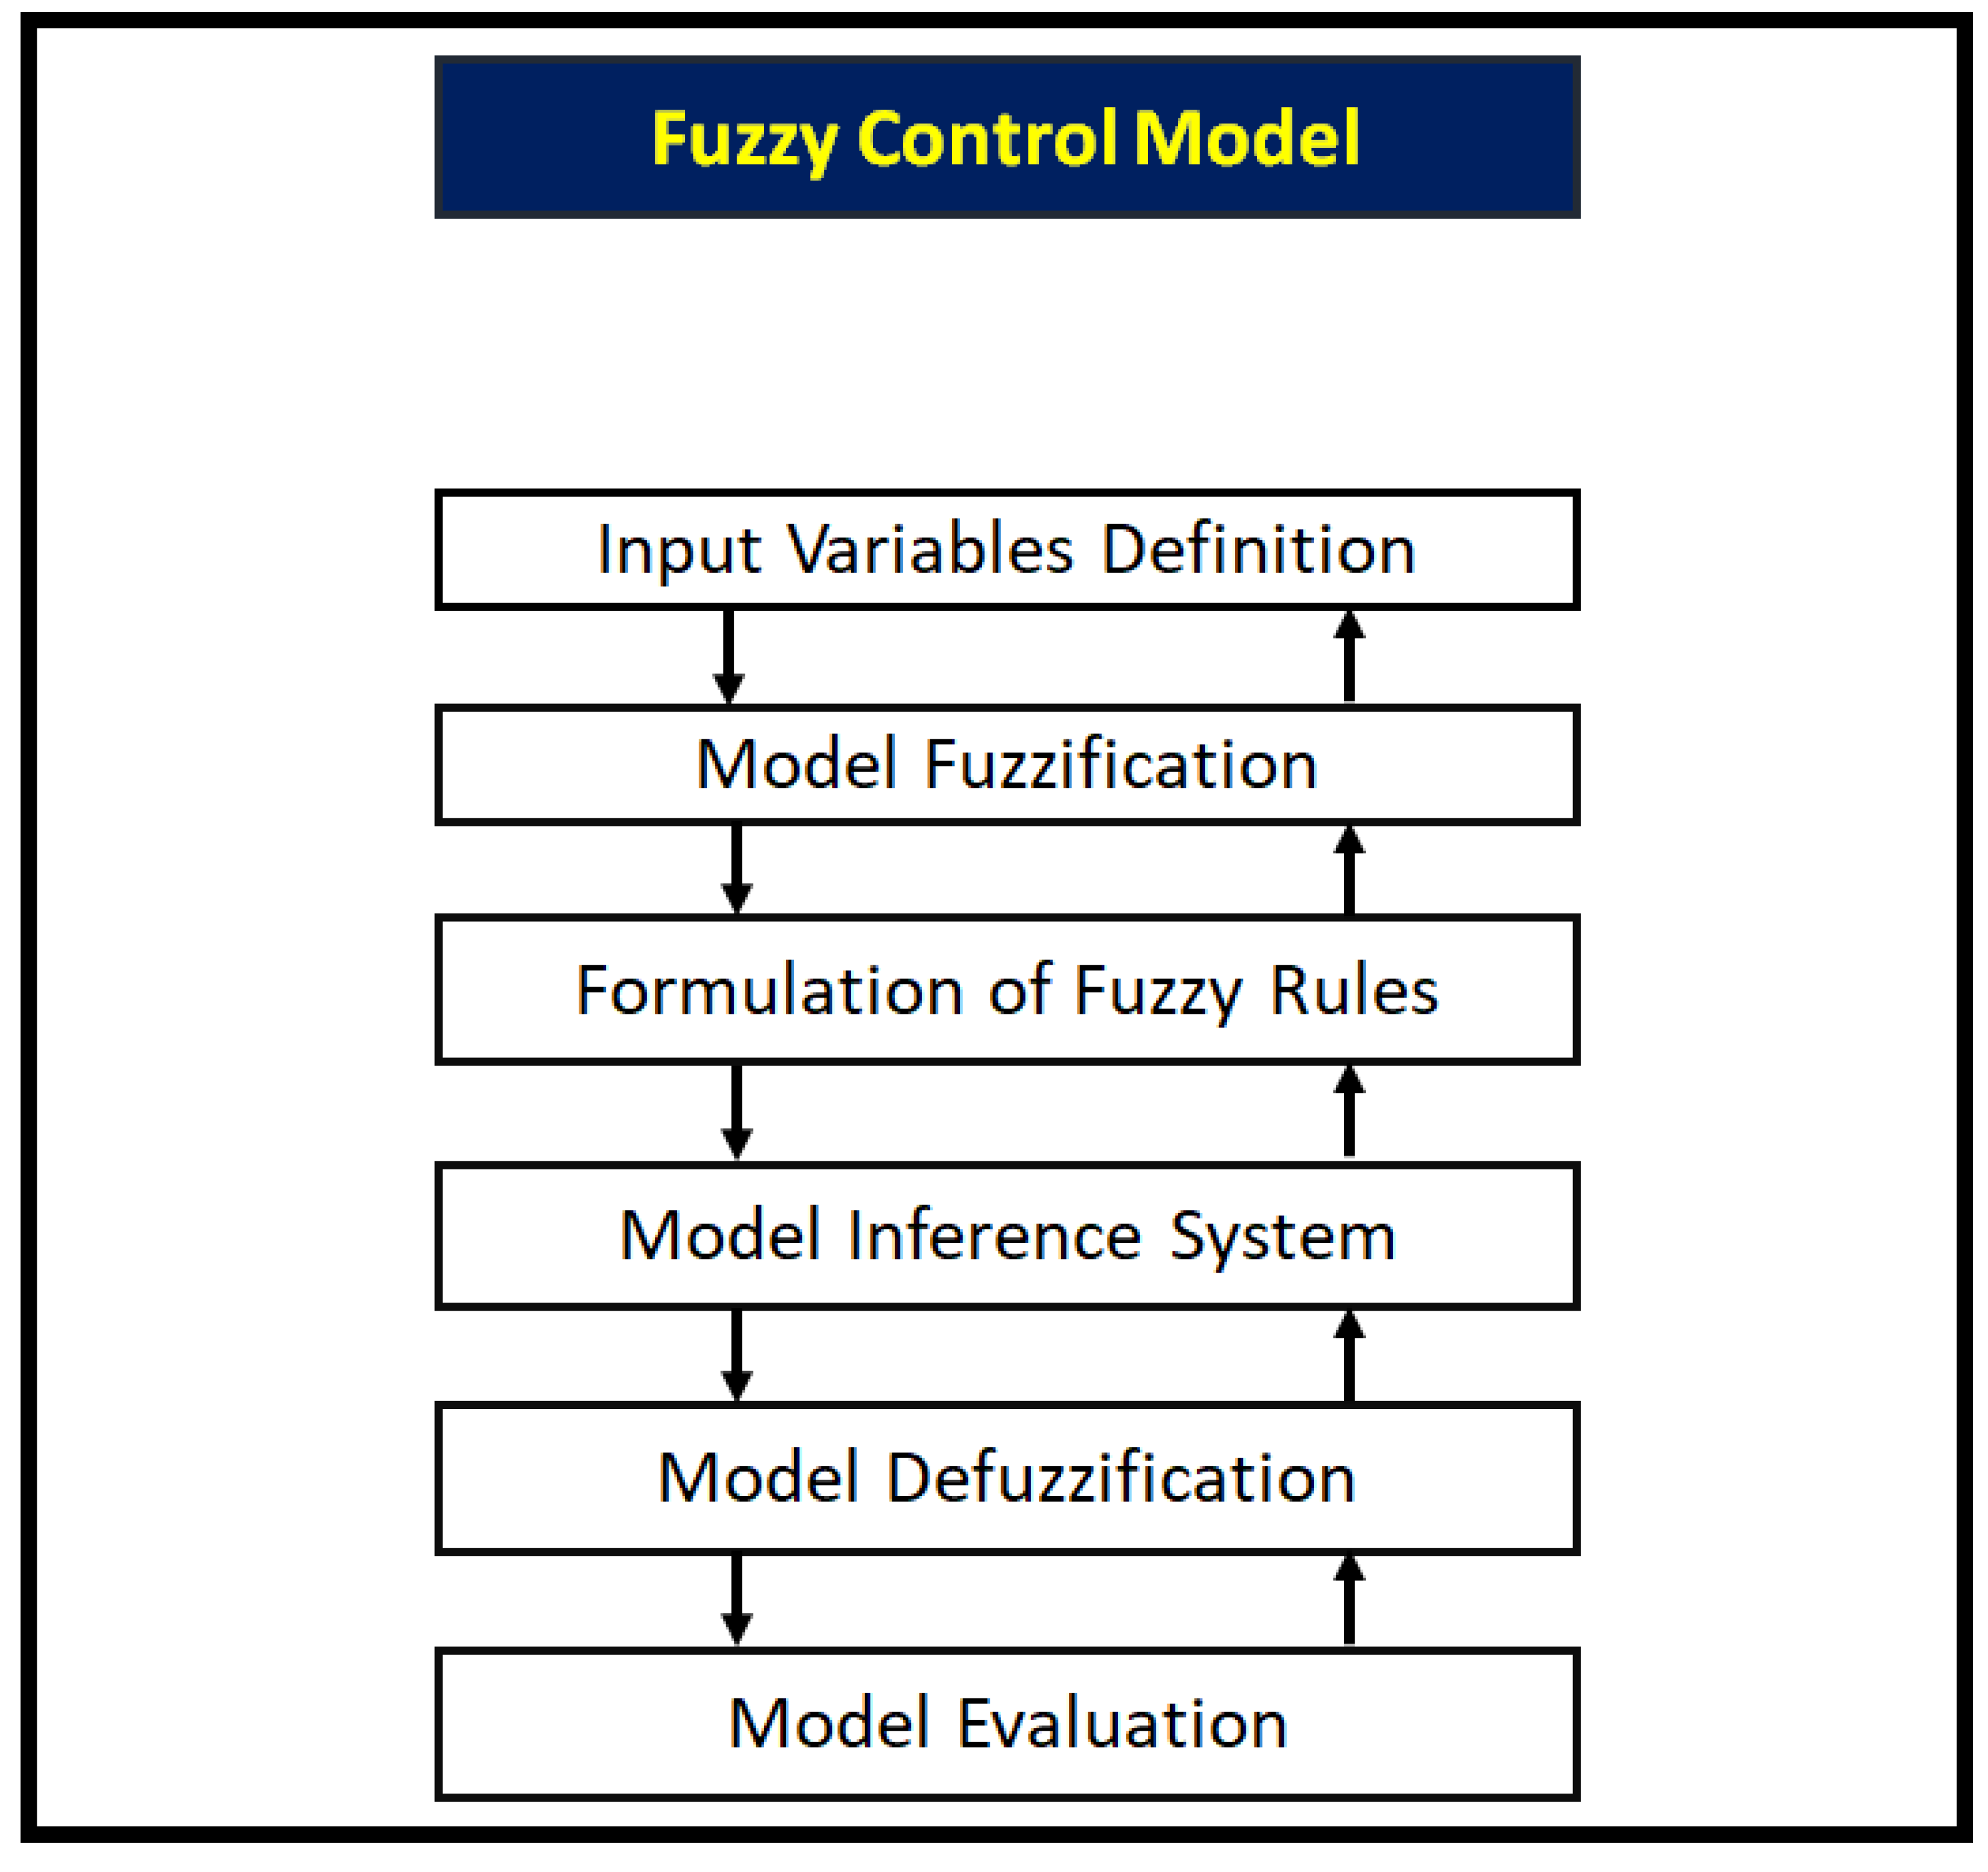
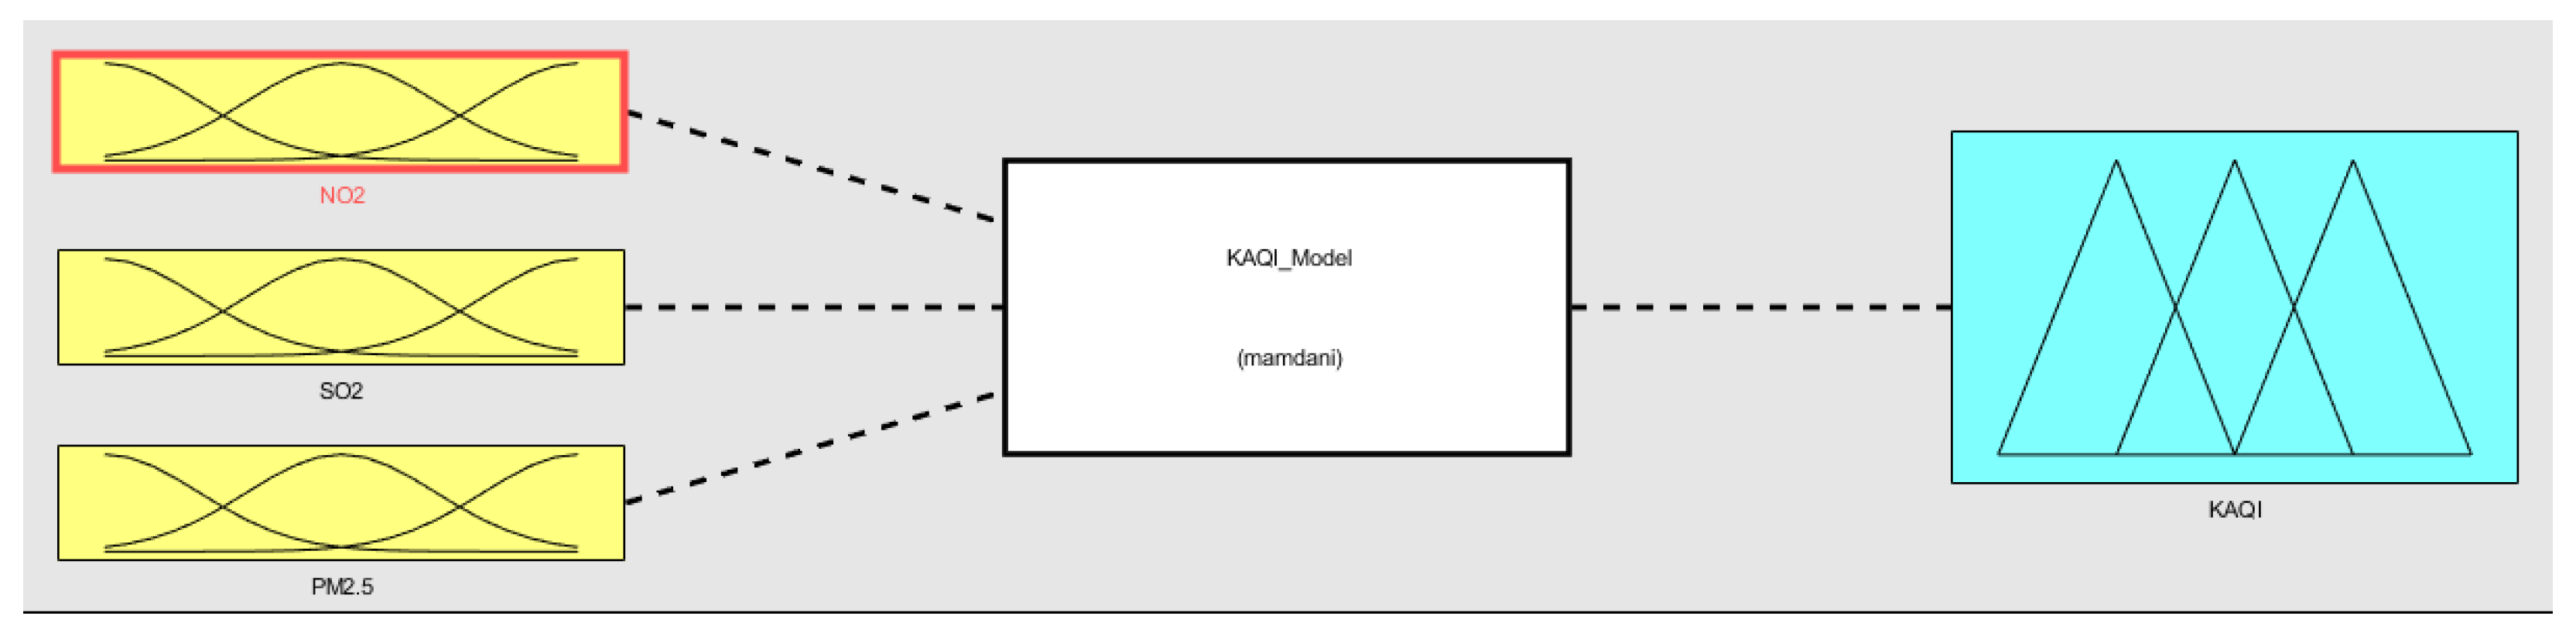
2.1.2. The Proposed Fuzzy Logic Control Model
2.2. Defining the Input Variables and Fuzzyfication of the Values
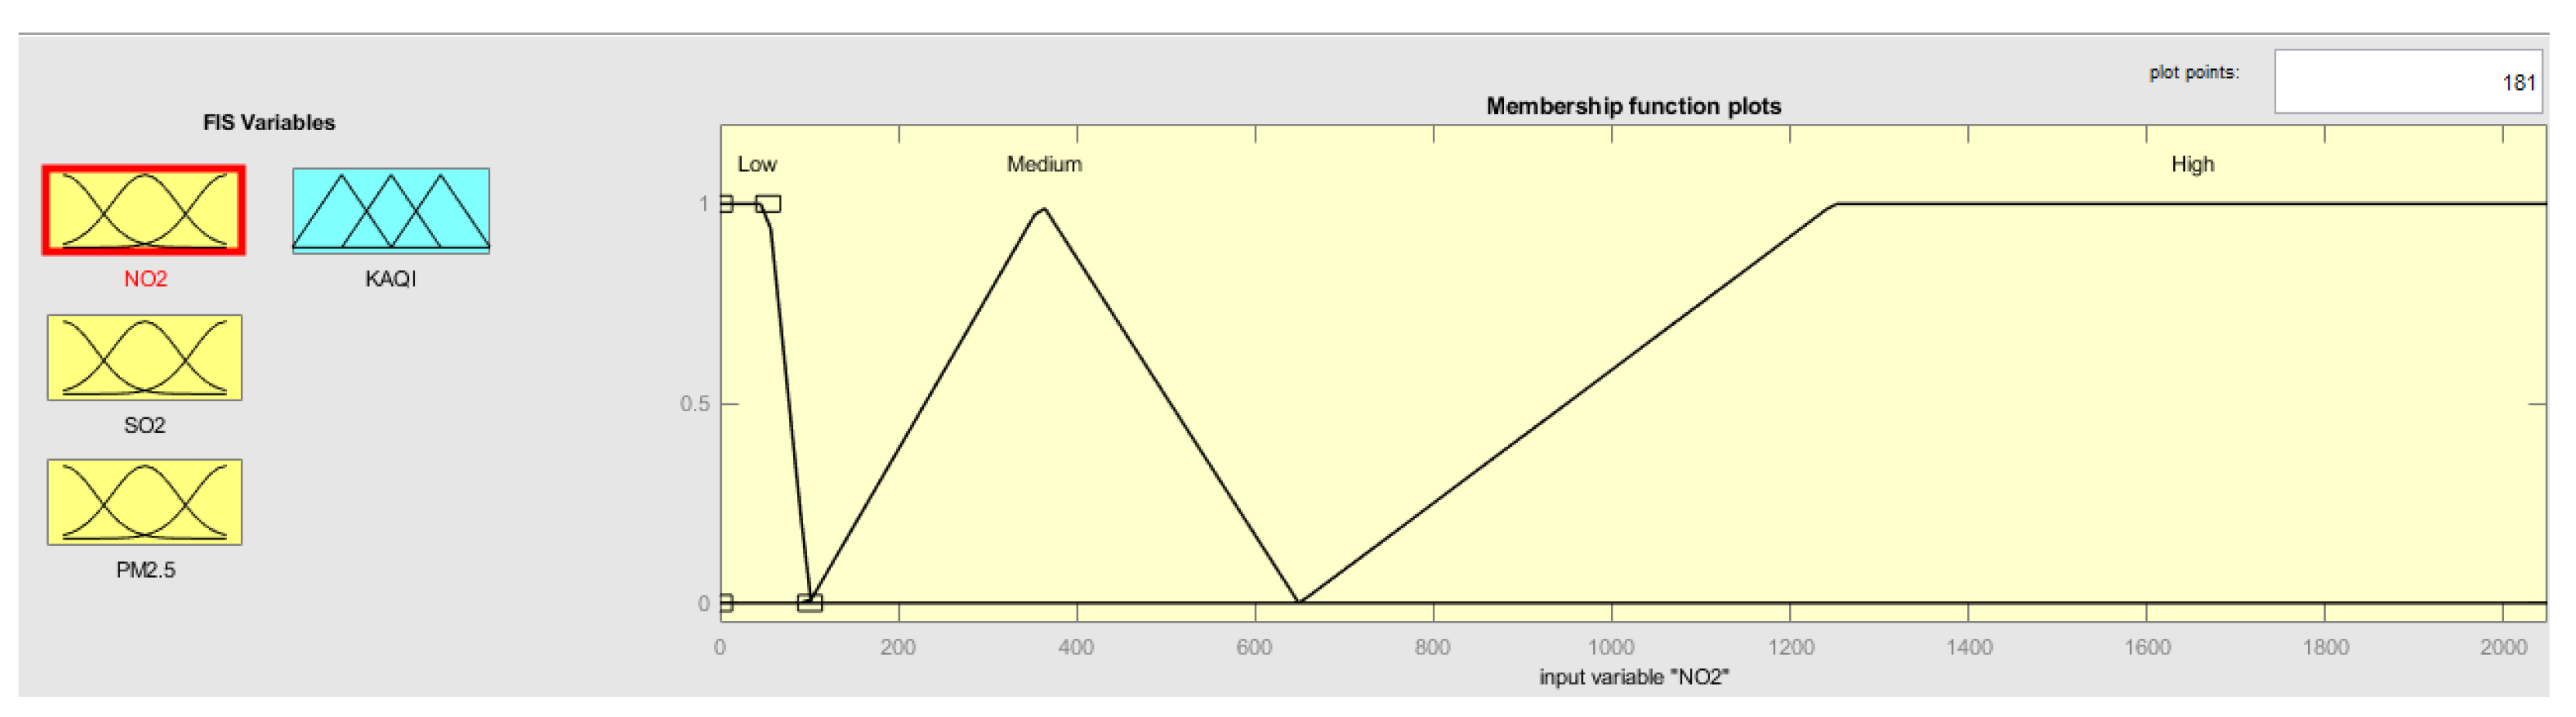
2.2.1. Selection of Membership Functions
- The intensity of nitrogen dioxide (NO) = Low, Medium and High
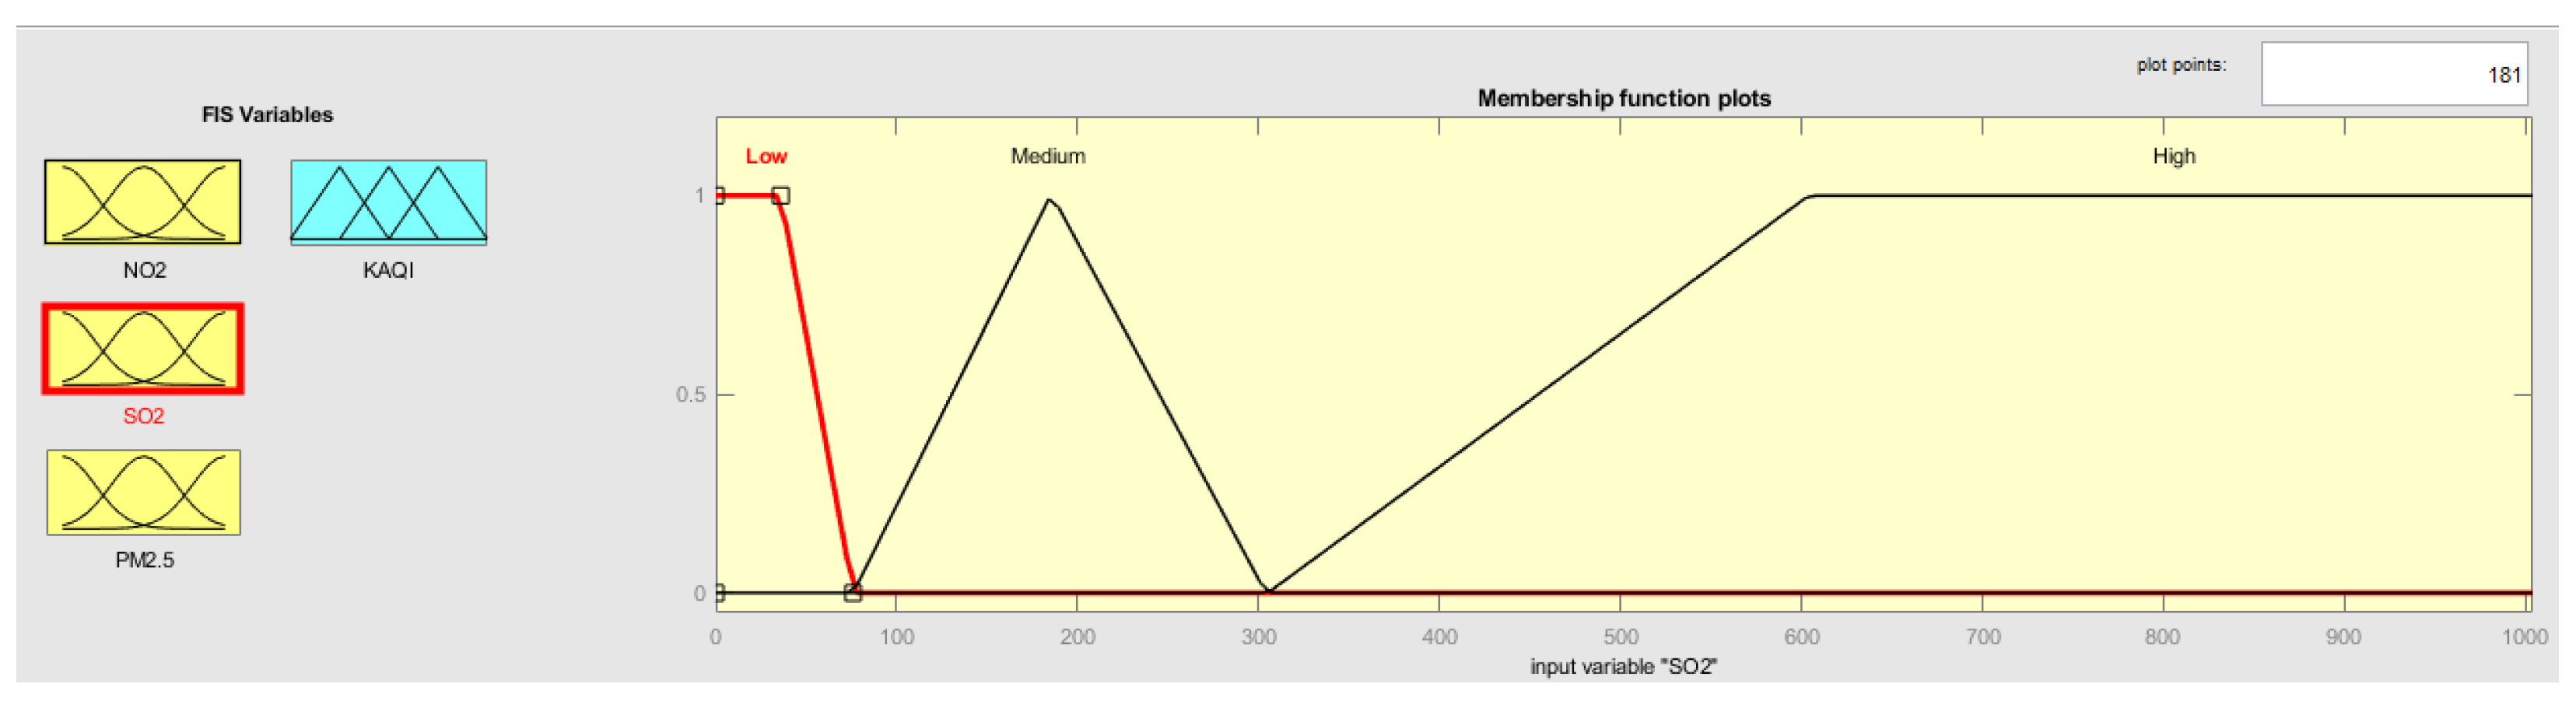
- The intensity of sulphur dioxide (SO) = Low, Medium and High
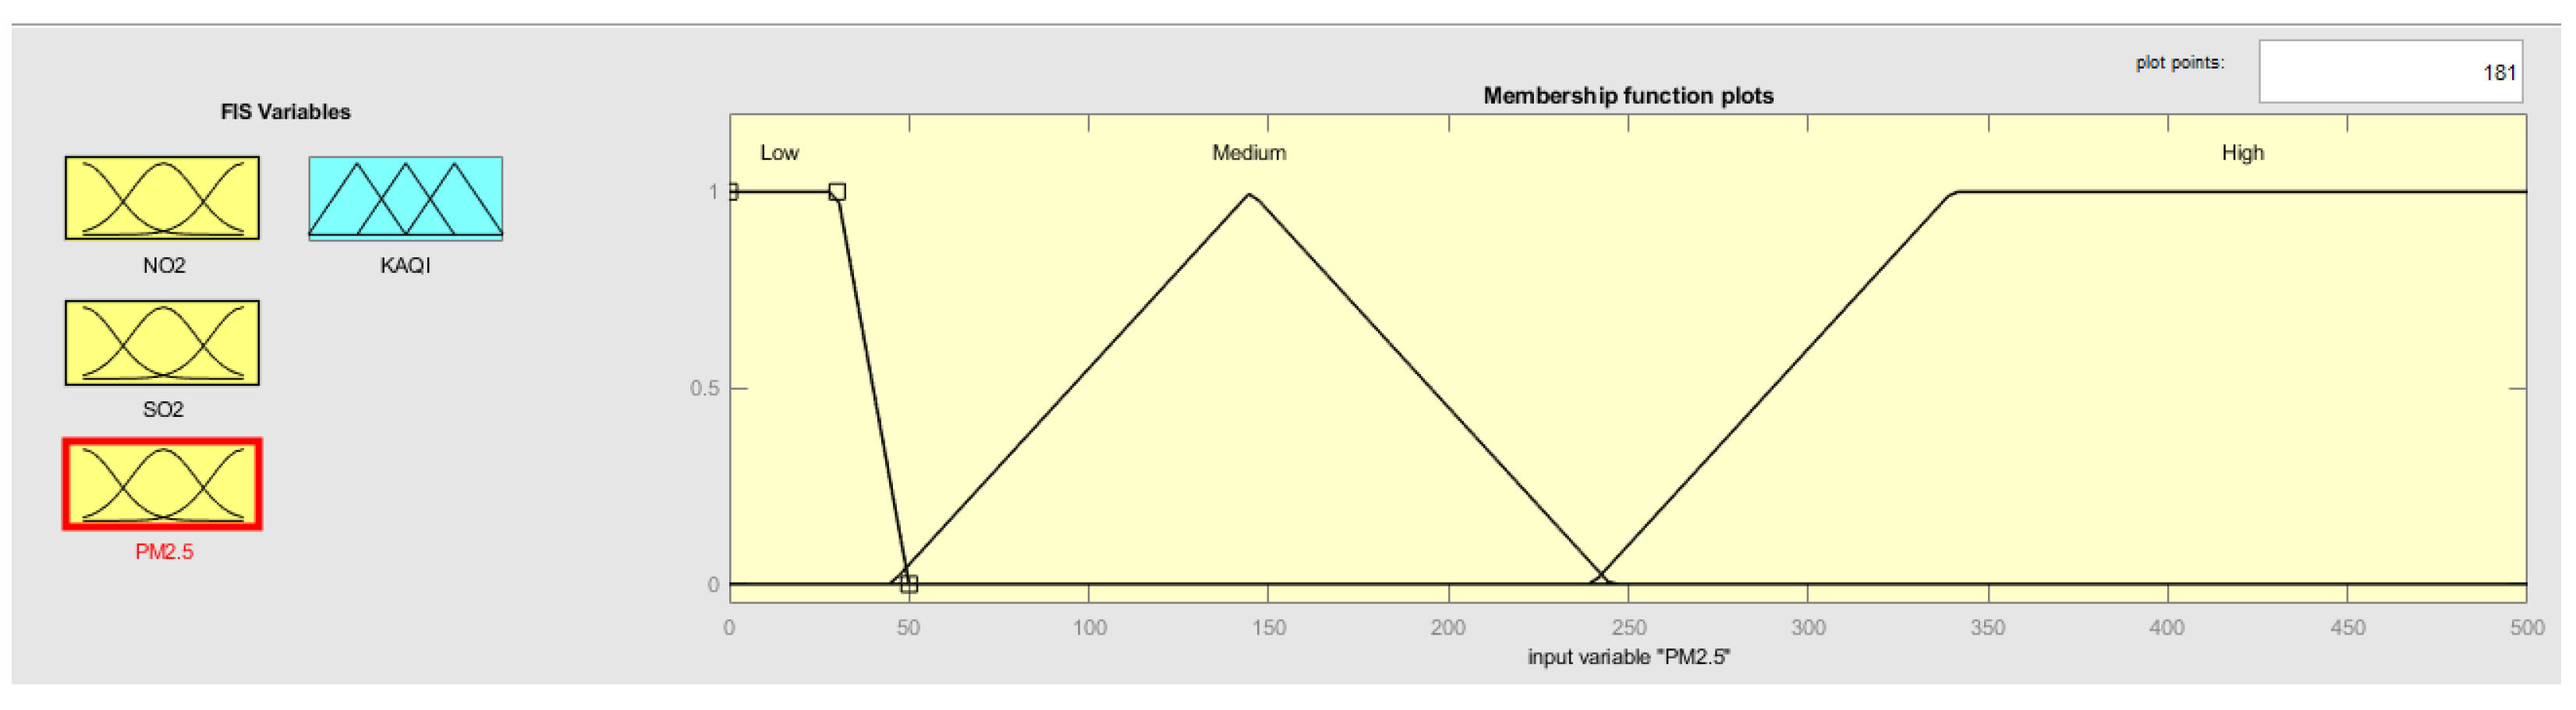
- The intensity of particulate matter 2.5 (PM) = Low, Medium and High
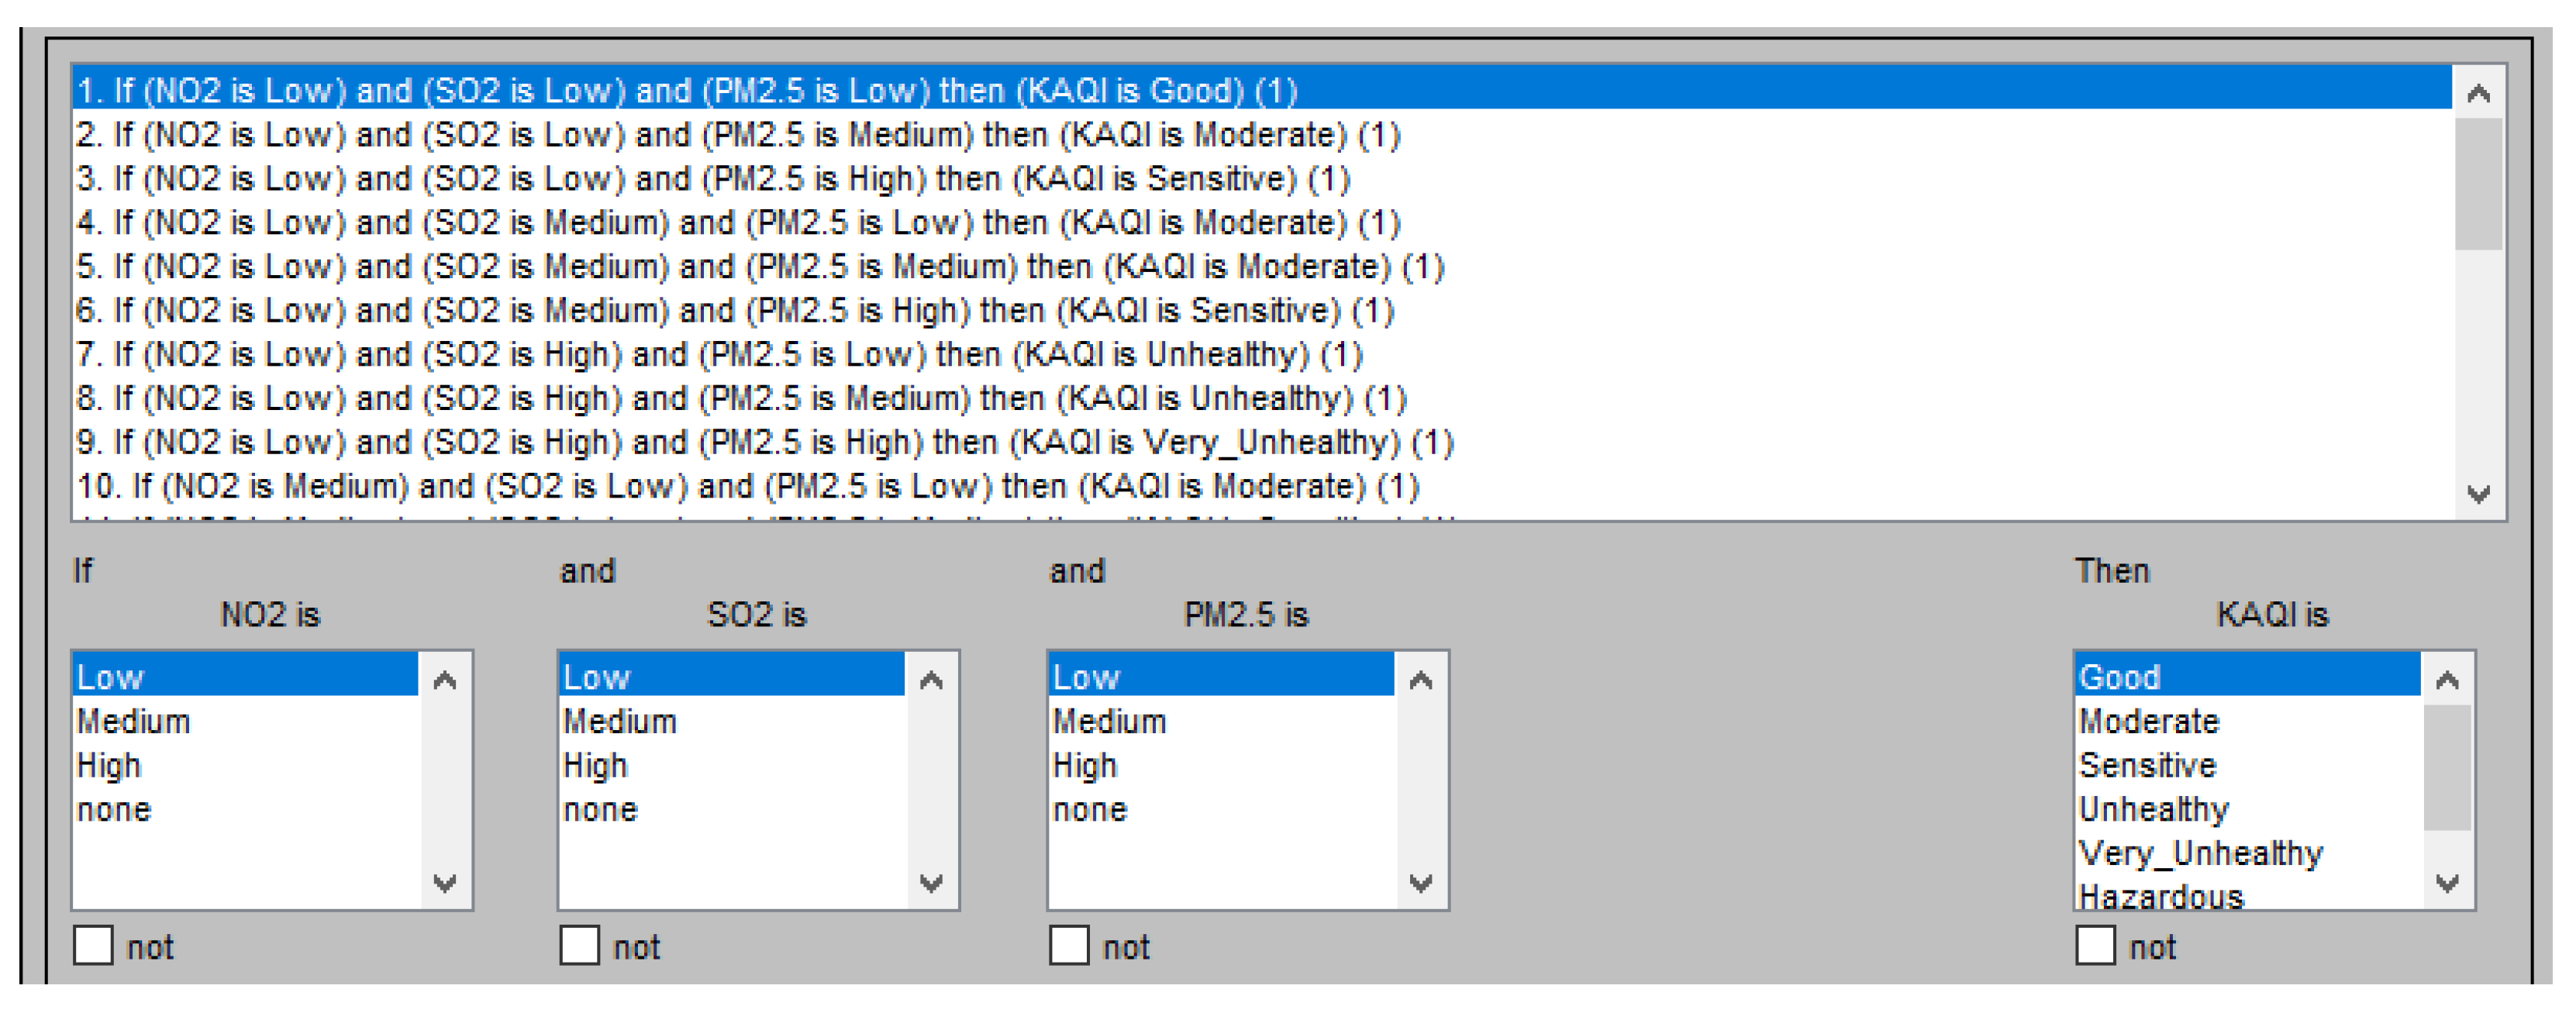
2.2.2. Formulation of Fuzzy Rules
3. Results
3.1. The Fuzzy Control System Design
3.2. Designs of the Input/Output Fuzzy Membership Functions
3.3. Evaluation of the Proposed Fuzzy Based KAQI Prediction Model
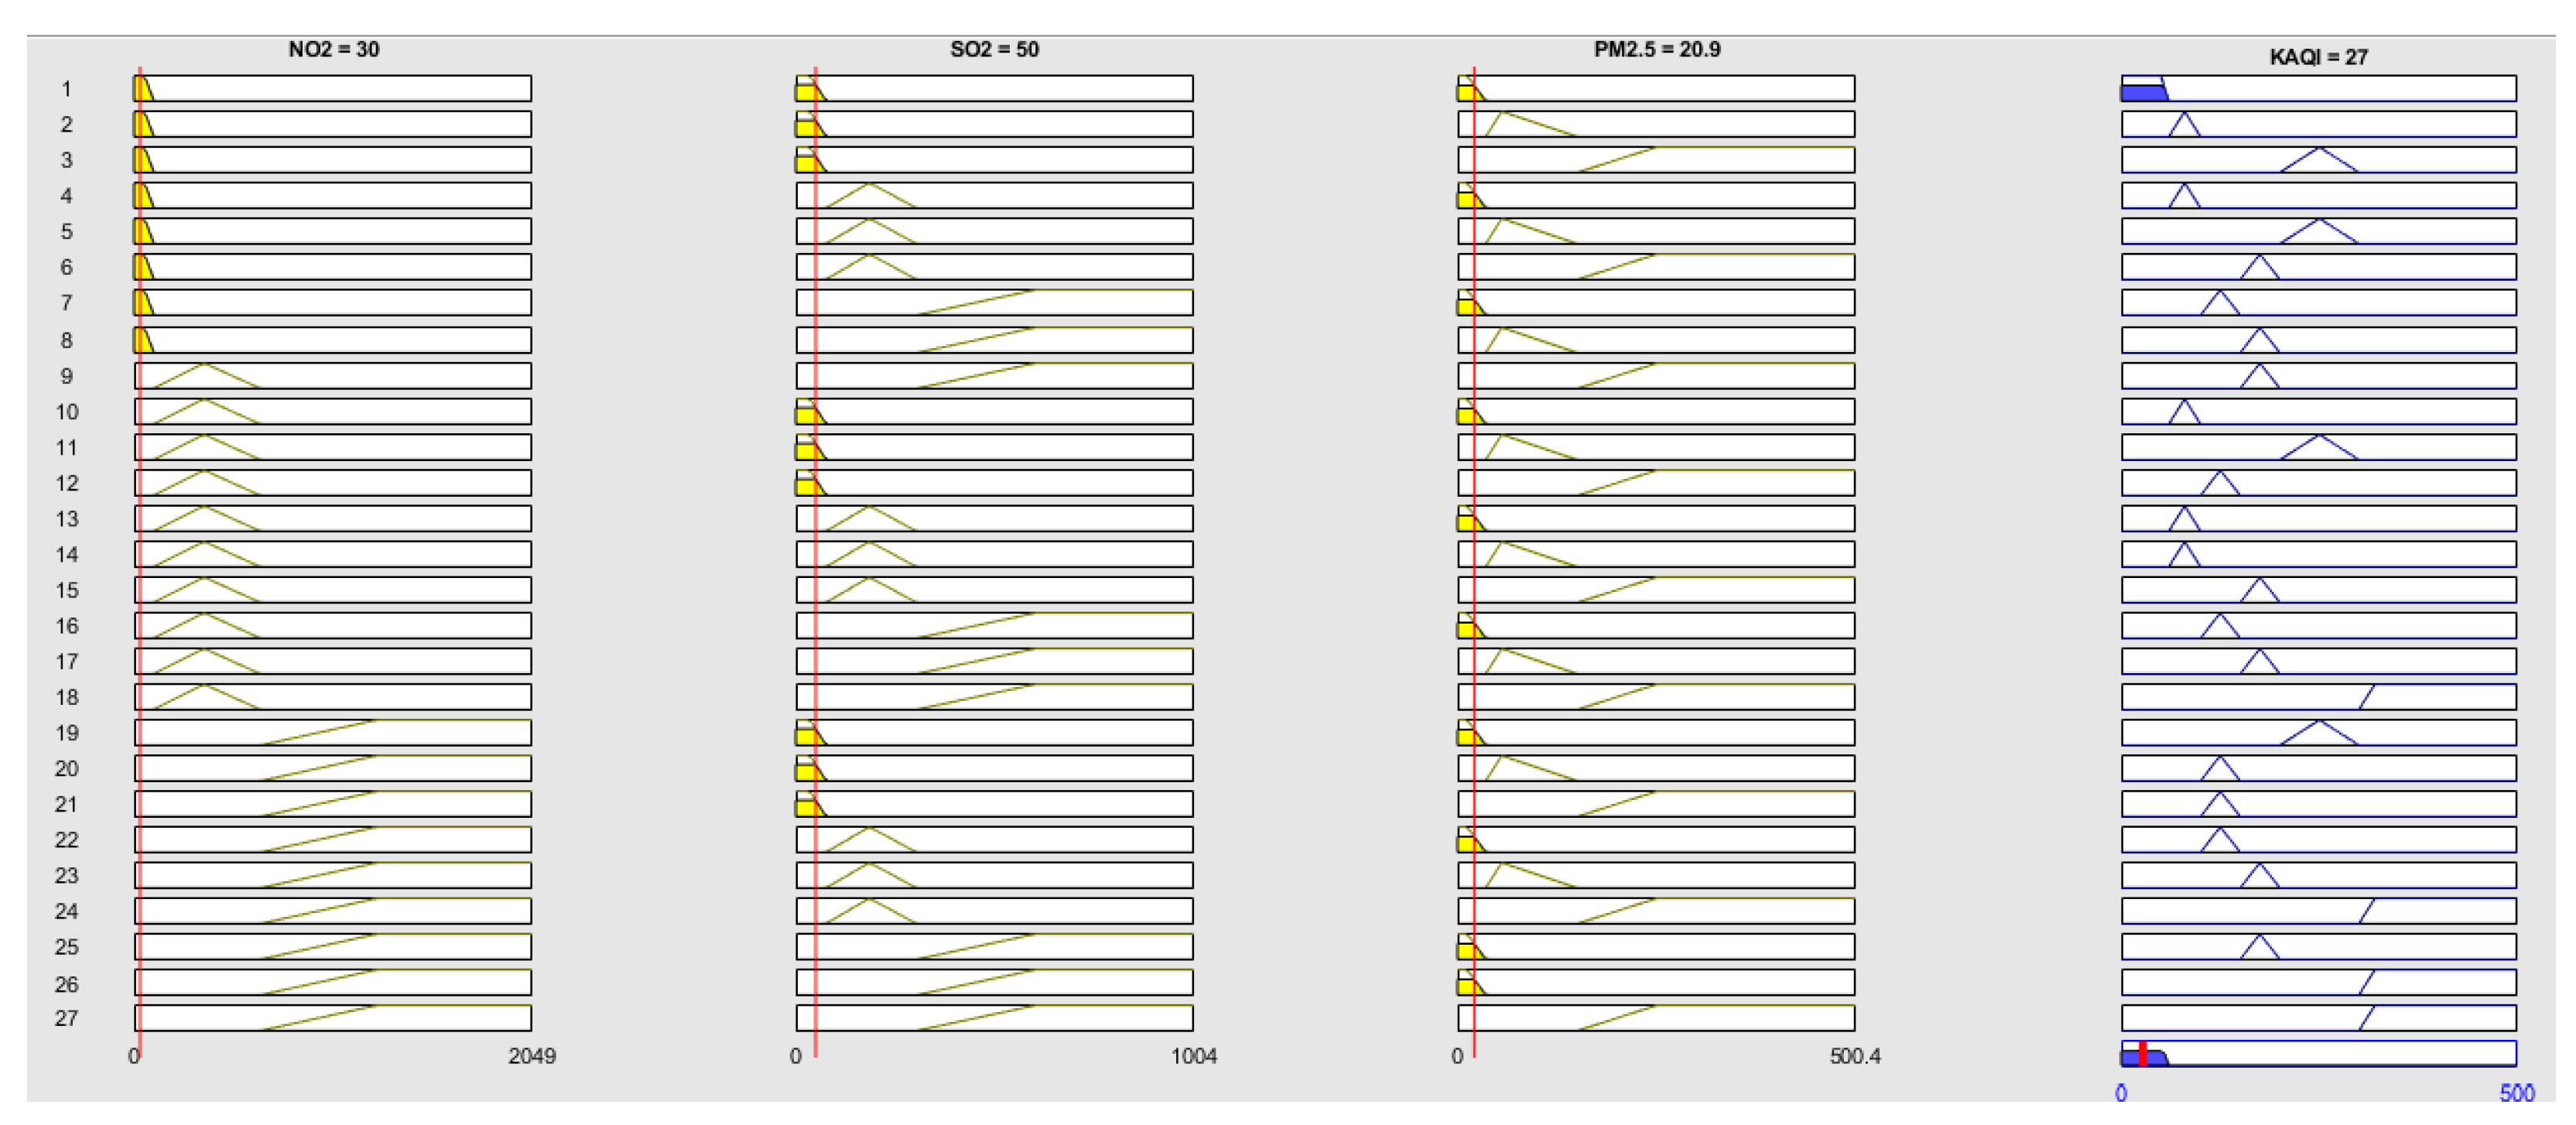
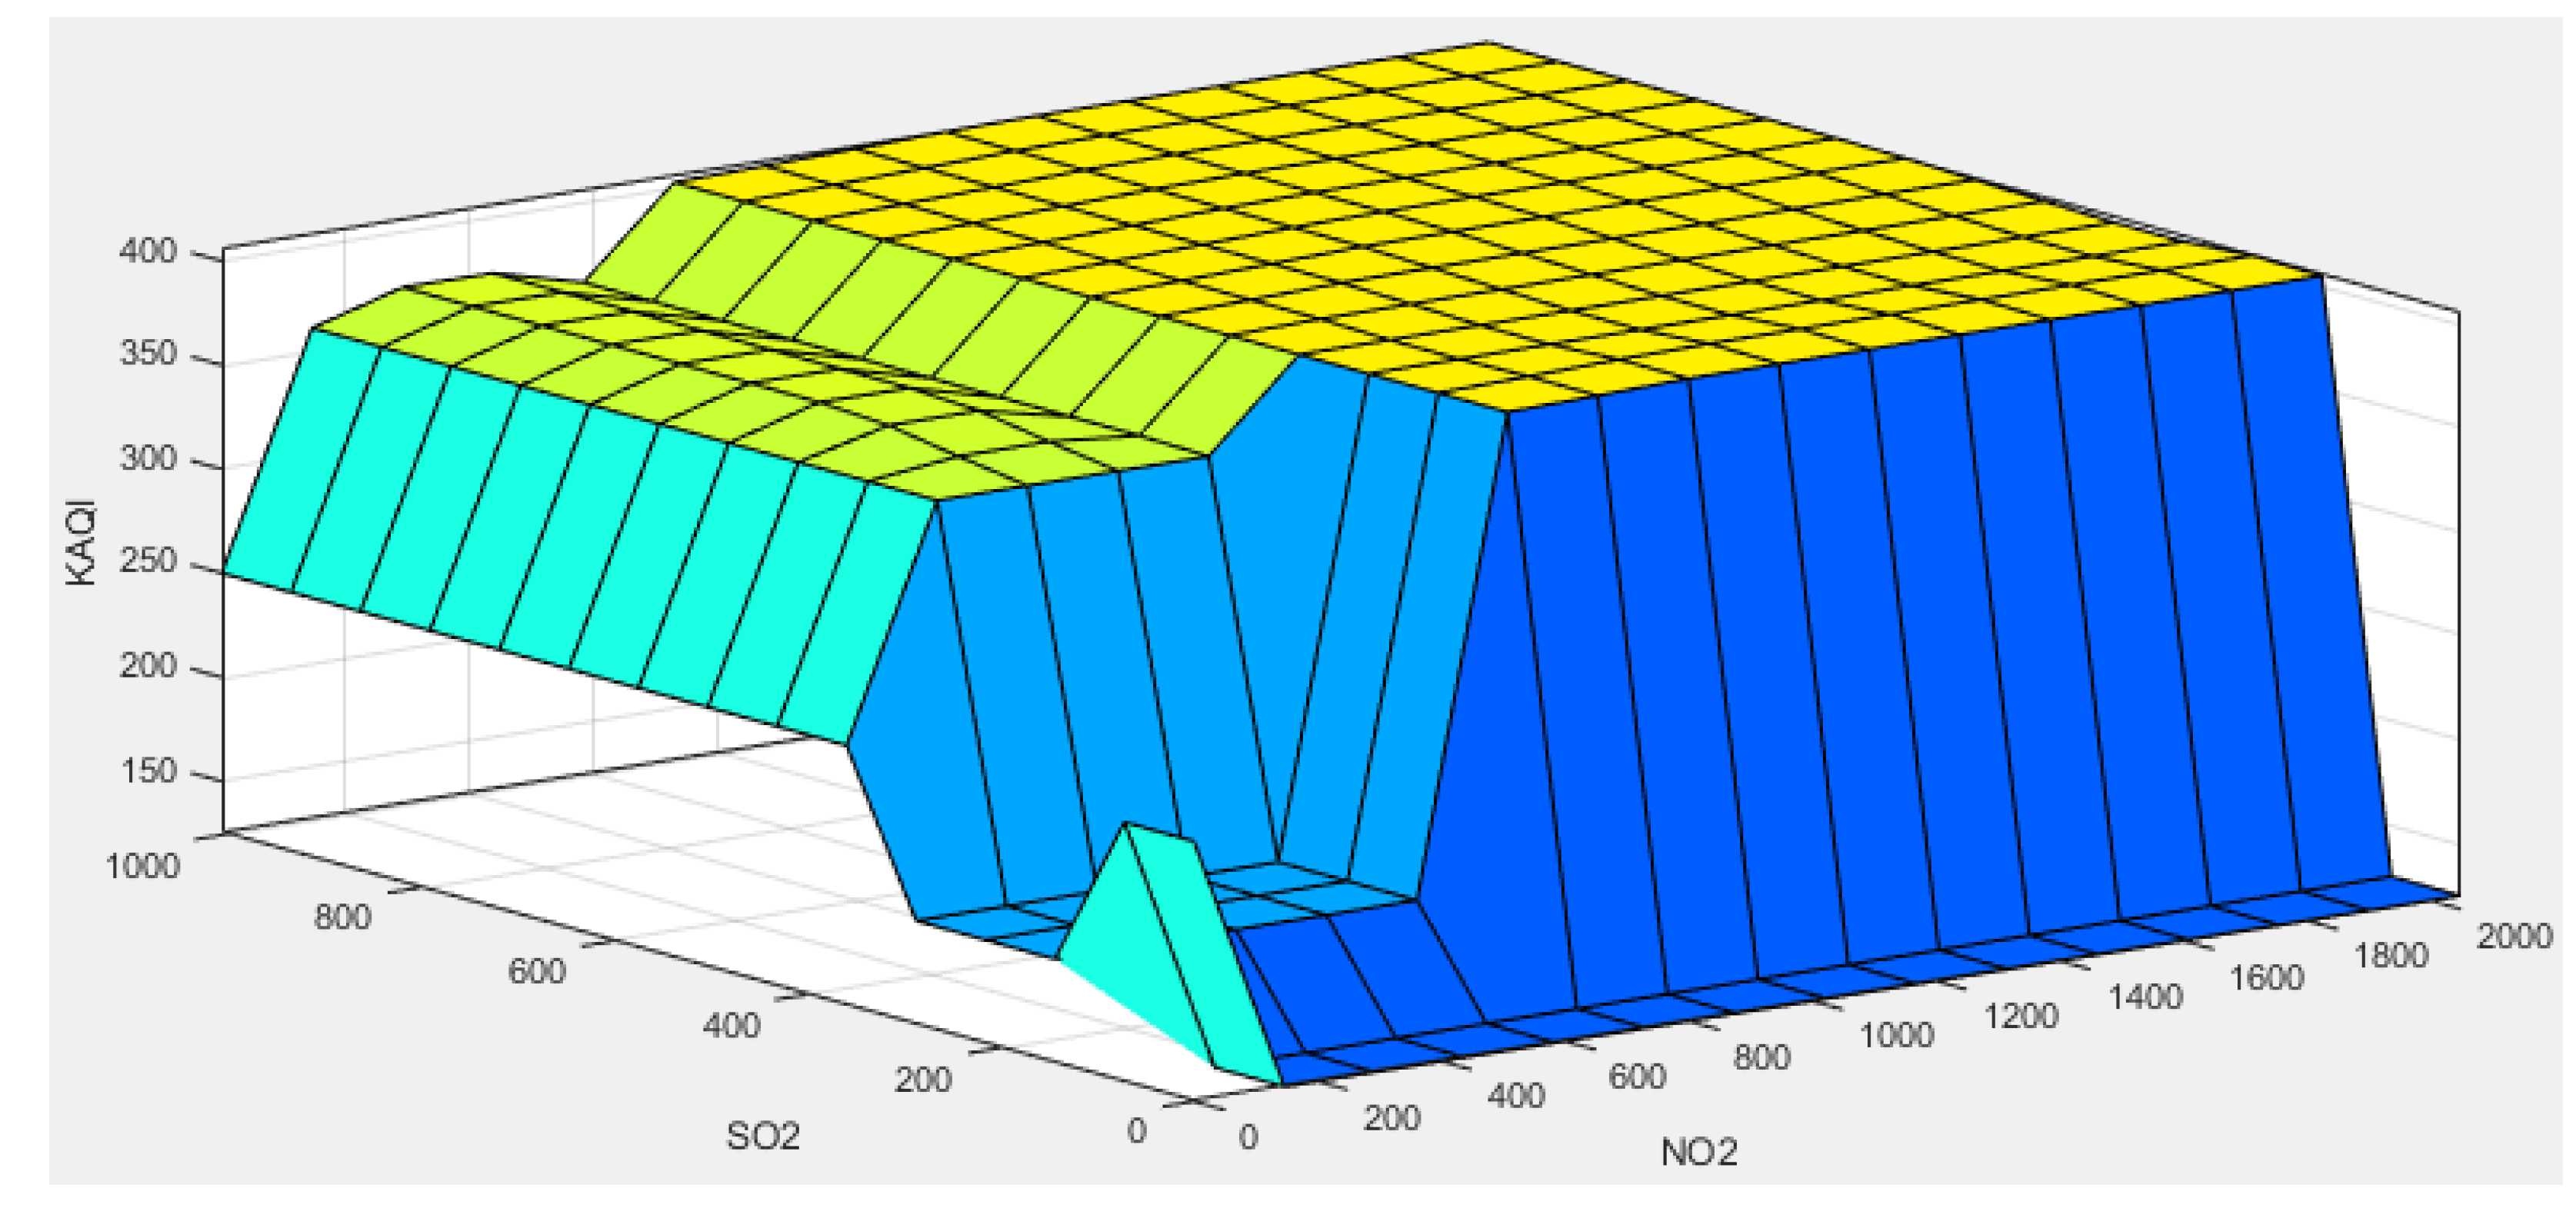
3.4. Rule and Surface Viewer
3.5. Deffuzification to Crisp Sets
4. Discussion
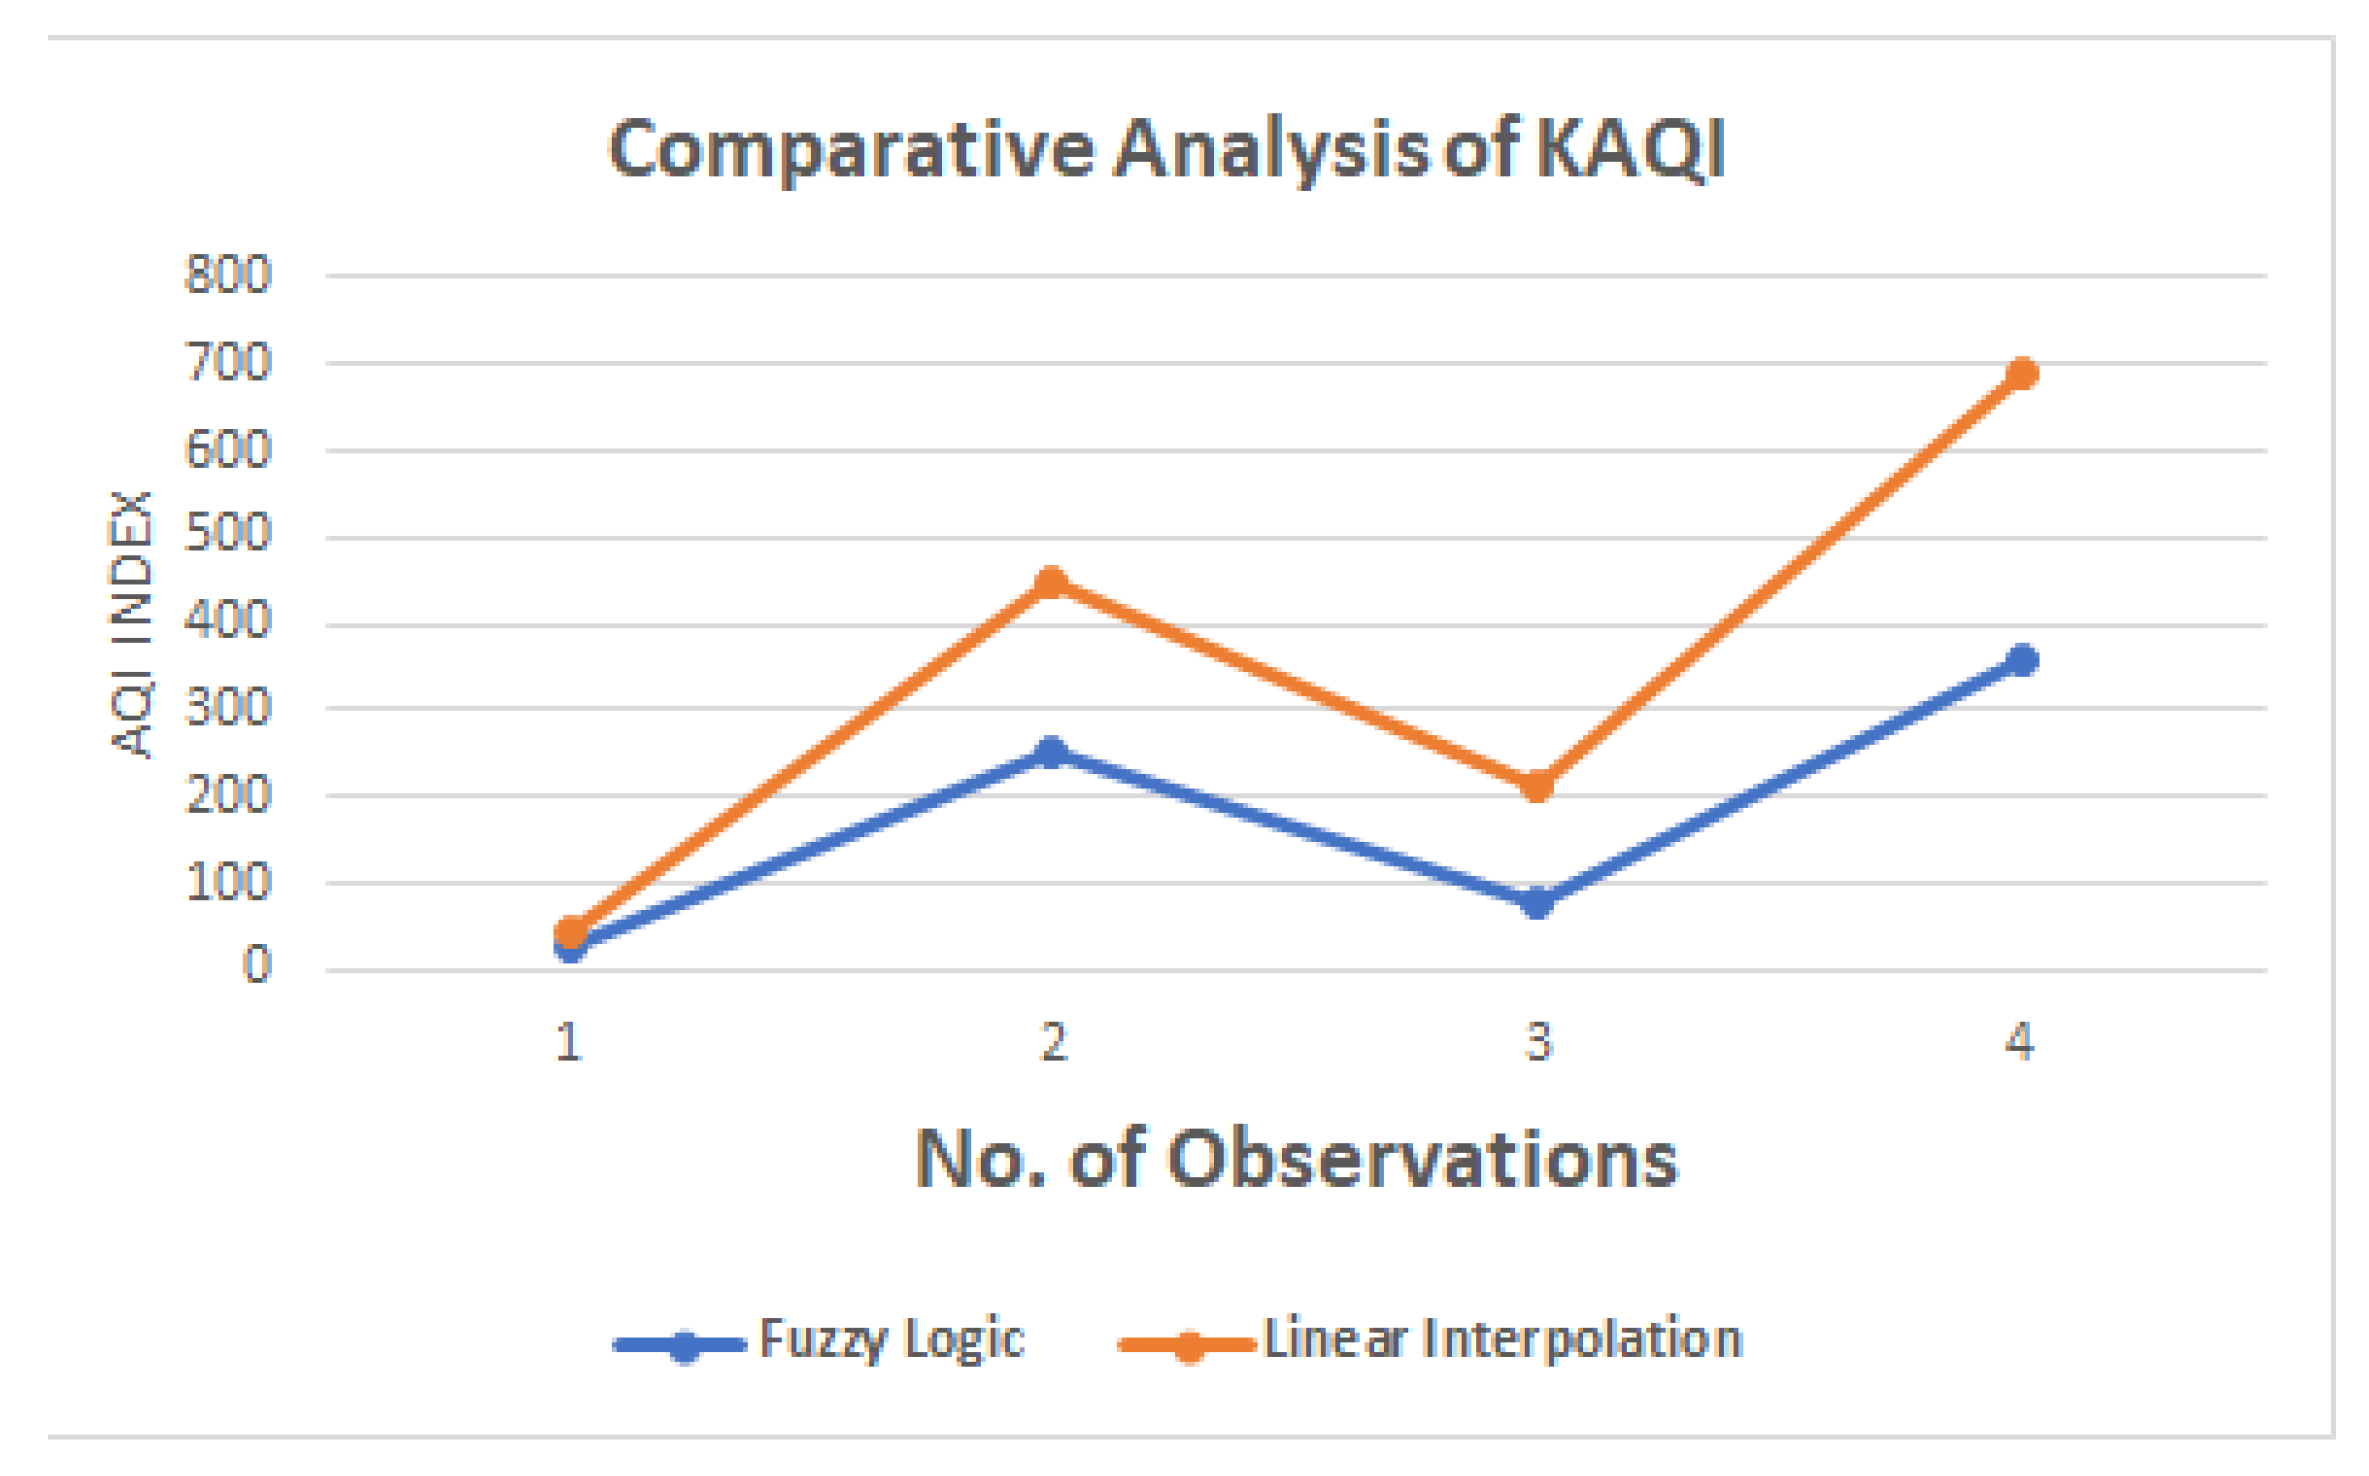
Performance Evaluation of the Designed KAQI Prediction Model
- Ip = the index for pollutant p
- Cp = is the monitored concentration of pollutant p
- BPHigh = the breakpoint that is greater than or equal to Cp
- BPLow = the breakpoint that is less than or equal to Cp
- IHigh = the AQI value corresponding to BPHigh
- ILow = the AQI value corresponding to BPLow
5. Conclusions
Author Contributions
Funding
Acknowledgments
Conflicts of Interest
Abbreviations
| AQI | Air Quality Index |
| EPA | Environmental Protection Agency |
| NO | Nitrogen dioxide |
| SO | Sulphur dioxide |
| PM | Particulate matter 2.5 |
| KAQI | Kampala Air Quality Index |
| COG | Center of Gravity |
| NEMA | Uganda National Environment Management Authority |
| MFs | Membership Functions |
References
- Onkal-Engin, G.; Demir, I.; Hiz, H. Assessment of urban air quality in Istanbul using fuzzy synthetic evaluation. Atmos. Environ. 2004, 23, 3809–3815. [Google Scholar] [CrossRef]
- Air Pollution: Africa’s Invisible, Silent Killer. Available online: https://www.theguardian.com/global-development/2016/oct/20/air-pollution-deadlier-africa-than-dirty-water-or-malnutrition-oecd (accessed on 8 October 2020).
- Air Pollution: Invisible Silent Killer in Africa. Available online: https://www.unenvironment.org/news-and-stories/story/air-pollution-africas-invisible-silent-killer-1 (accessed on 14 October 2020).
- Smith, K.R.; Samet, J.M.; Romieu, I.; Bruce, N. Indoor air pollution in developing countries and acute lower respiratory infections in children. Thorax 2000, 55, 518–532. [Google Scholar] [CrossRef] [PubMed]
- Kirenga, B.; Meng, Q.; Van Gemert, F.; Aanyu, T.H.; Chavannes, N.; Katamba, A.; Obai, G.; Molen, T.; Schwander, S.; Mohsenin, V. The state of ambient air quality in two Ugandan cities: A pilot cross-sectional spatial assessment. Int. J. Environ. Res. Public Health 2015, 12, 8075–8091. [Google Scholar] [CrossRef]
- Schwela, D. Review of Urban Air Quality in Sub-Saharan Africa Region: Air Quality Profile of SSA Countries; World Bank: Washington, DC, USA, 2012. [Google Scholar]
- Kiggundu, A.T. An assessment of the capabilities and gaps in urban air quality management in Uganda. Sci. Afr. J. Sci. Issues Res. Essays 2015, 3, 616–668. [Google Scholar]
- Bateebe, I.P. Investigation of Probable Pollution from Automobile Exhaust Gases in Kampala, City, Uganda. Master’s Thesis, School of Industrial Engineering and Management Energy, Stockholm, Sweden, 2011. [Google Scholar]
- National Environment Management Authority. Fight Air Pollution to Protect Human Health and Environment. Available online: https://www.newvision.co.ug/digital-assets/cf4bd175-7293-4e9a-8fba-7235c1e6b8b1/32-NEMA.pdf (accessed on 6 December 2020).
- Schwander, S.; Okello, C.D.; Freers, J.; Chow, J.C.; Watson, J.G.; Corry, M.; Meng, Q. Ambient particulate matter air pollution in Mpererwe District, Kampala, Uganda: A pilot study. J. Environ. Public Health 2014, 14, 763934. [Google Scholar] [CrossRef]
- Coker, E.; Katamba, A.; Kizito, S.; Eskenazi, B.; Davis, J.L. Household air pollution profiles associated with persistent childhood cough in urban Uganda. Environ. Int. 2020, 136, 105471. [Google Scholar] [CrossRef] [PubMed]
- Matagi, S.V. Some issues of environmental concern in Kampala, the capital city of Uganda. Environ. Monit. Assess. 2002, 2, 121–138. [Google Scholar] [CrossRef] [PubMed]
- Ambient (Outdoor) Air Quality and Health. Available online: http://www.who.int/en/news-room/fact-sheets/detail/ambient-(outdoor)-air-quality-and-health (accessed on 15 November 2020).
- US EPA. Technical Assistance Document for the Reporting of Daily Air Quality. Available online: https://www.airnow.gov/sites/default/files/2020-05/aqi-technical-assistance-document-sept2018.pdf (accessed on 31 May 2021).
- Jovanelly, T.J.; Okot, O.J.; Nyenje, R.; Namaganda, E. Comparative Assessment of Ambient Air Standards in Rural Areas to Uganda City Centers. J. Public Health Dev. Ctries 2017, 3, 371–380. [Google Scholar]
- Robertson, S.; Miller, M.R. Ambient air pollution and thrombosis. Part. Fibre Toxicol. 2018, 15, 1. [Google Scholar] [CrossRef] [PubMed]
- Matooane, M.; Diab, R. Health risk assessment for sulfur dioxide pollution in South Durban, South Africa. Arch. Environ. Health Int. J. 2003, 58, 763–770. [Google Scholar] [CrossRef] [PubMed]
- Kwikiriza, B.C. Causes and Effects of Traffic Congestion in Kampala City. Available online: https://scholar.googleusercontent.com/scholar.bib?q=info:KUzfthKjfmAJ:scholar.google.com/&output=citation&scisdr=CgUbOhNFEPH9-0peEHk:AAGBfm0AAAAAYMxYCHmvHm_b2NLN7bA2H3SuDykPUJwR&scisig=AAGBfm0AAAAAYMxYCGwLr7IZUPsooIme4bwYyUlDd7SV&scisf=4&ct=citation&cd=-1&hl=en (accessed on 17 October 2020).
- Eva, W.; Patrik, L.A.; Terry, B.; Christoffer, B.; Danielle, J.C.; Elena, C.; Stephania, A.C.; Sandra, C.G.; Brian, K.G.; Christer, J.; et al. 14th congress of combustion by-products and their health effects—Origin, fate, and health effects of combustion-related air pollutants in the coming era of bio-based energy sources. Environ. Sci. Pollut. Res. 2016, 23, 8141–8159. [Google Scholar]
- Zadeh, L.A. The concept of a linguistic variable and its application to approximate reasoning—I. Inf. Sci. 1975, 8, 199–249. [Google Scholar] [CrossRef]
- Banks, W. Linguistic Variables: Clear Thinking with Fuzzy Logic. 2008. Available online: http://www.phaedsys.com/principals/bytecraft/bytecraftdata/LinguisticVariables.pdf (accessed on 18 December 2020).
- Piegat, A. What Are the MAIN Advantages of Applying Fuzzy-Based Decision Making Approaches in Comparison with the Non-Fuzzy-Based Ones? 2015. Available online: https://www.researchgate.net/post/What_are_the_main_advantages_of_applying_fuzzy-based_decision_making_approaches_in_comparison_with_the_non-fuzzy-based_ones (accessed on 10 December 2020).
- Liu, M.; Chen, D.; Wu, C.; Li, H. Approximation theorem of the fuzzy transform in fuzzy reasoning and its application to the scheduling problem. Comput. Math. Appl. 2006, 51, 515–526. [Google Scholar] [CrossRef][Green Version]
- EPA. Air Quality Index. A Guide to Air Quality and Your Health; EPA: Washington, DC, USA, 2014.
- Ali, O.A.M.; Ali, A.Y.; Sumait, B.S. Comparison between the effects of different types of membership functions on fuzzy logic controller performance. Int. J. 2015, 76, 76–83. [Google Scholar]
- Hajek, P.; Olej, V. Air quality indices and their modelling by hierarchical fuzzy inference systems. WSEAS Trans. Environ. Dev. 2009, 10, 661–672. [Google Scholar]
- Jain, A.; Sharma, A. Membership function formulation methods for fuzzy logic systems: A comprehensive review. J. Crit. Rev. 2020, 7, 8717–8733. [Google Scholar]
- Ruckelshaus, W.D. The Role of the Environmental Protection Agency. Envtl. Aff. 1971, 1, 528. [Google Scholar]
- Atacak, I.; Arici, N.; Guner, D. Modelling and evaluating air quality with fuzzy logic algorithm-Ankara-Cebeci sample. Int. J. Intell. Syst. Appl. Eng. 2017, 5, 263–268. [Google Scholar] [CrossRef][Green Version]
- David, M. Guideline for Reporting of Daily Air Quality—Air Quality Index (AQI); U.S. Environmental Protection Agency: Washington, DC, USA, 2006. [Google Scholar]


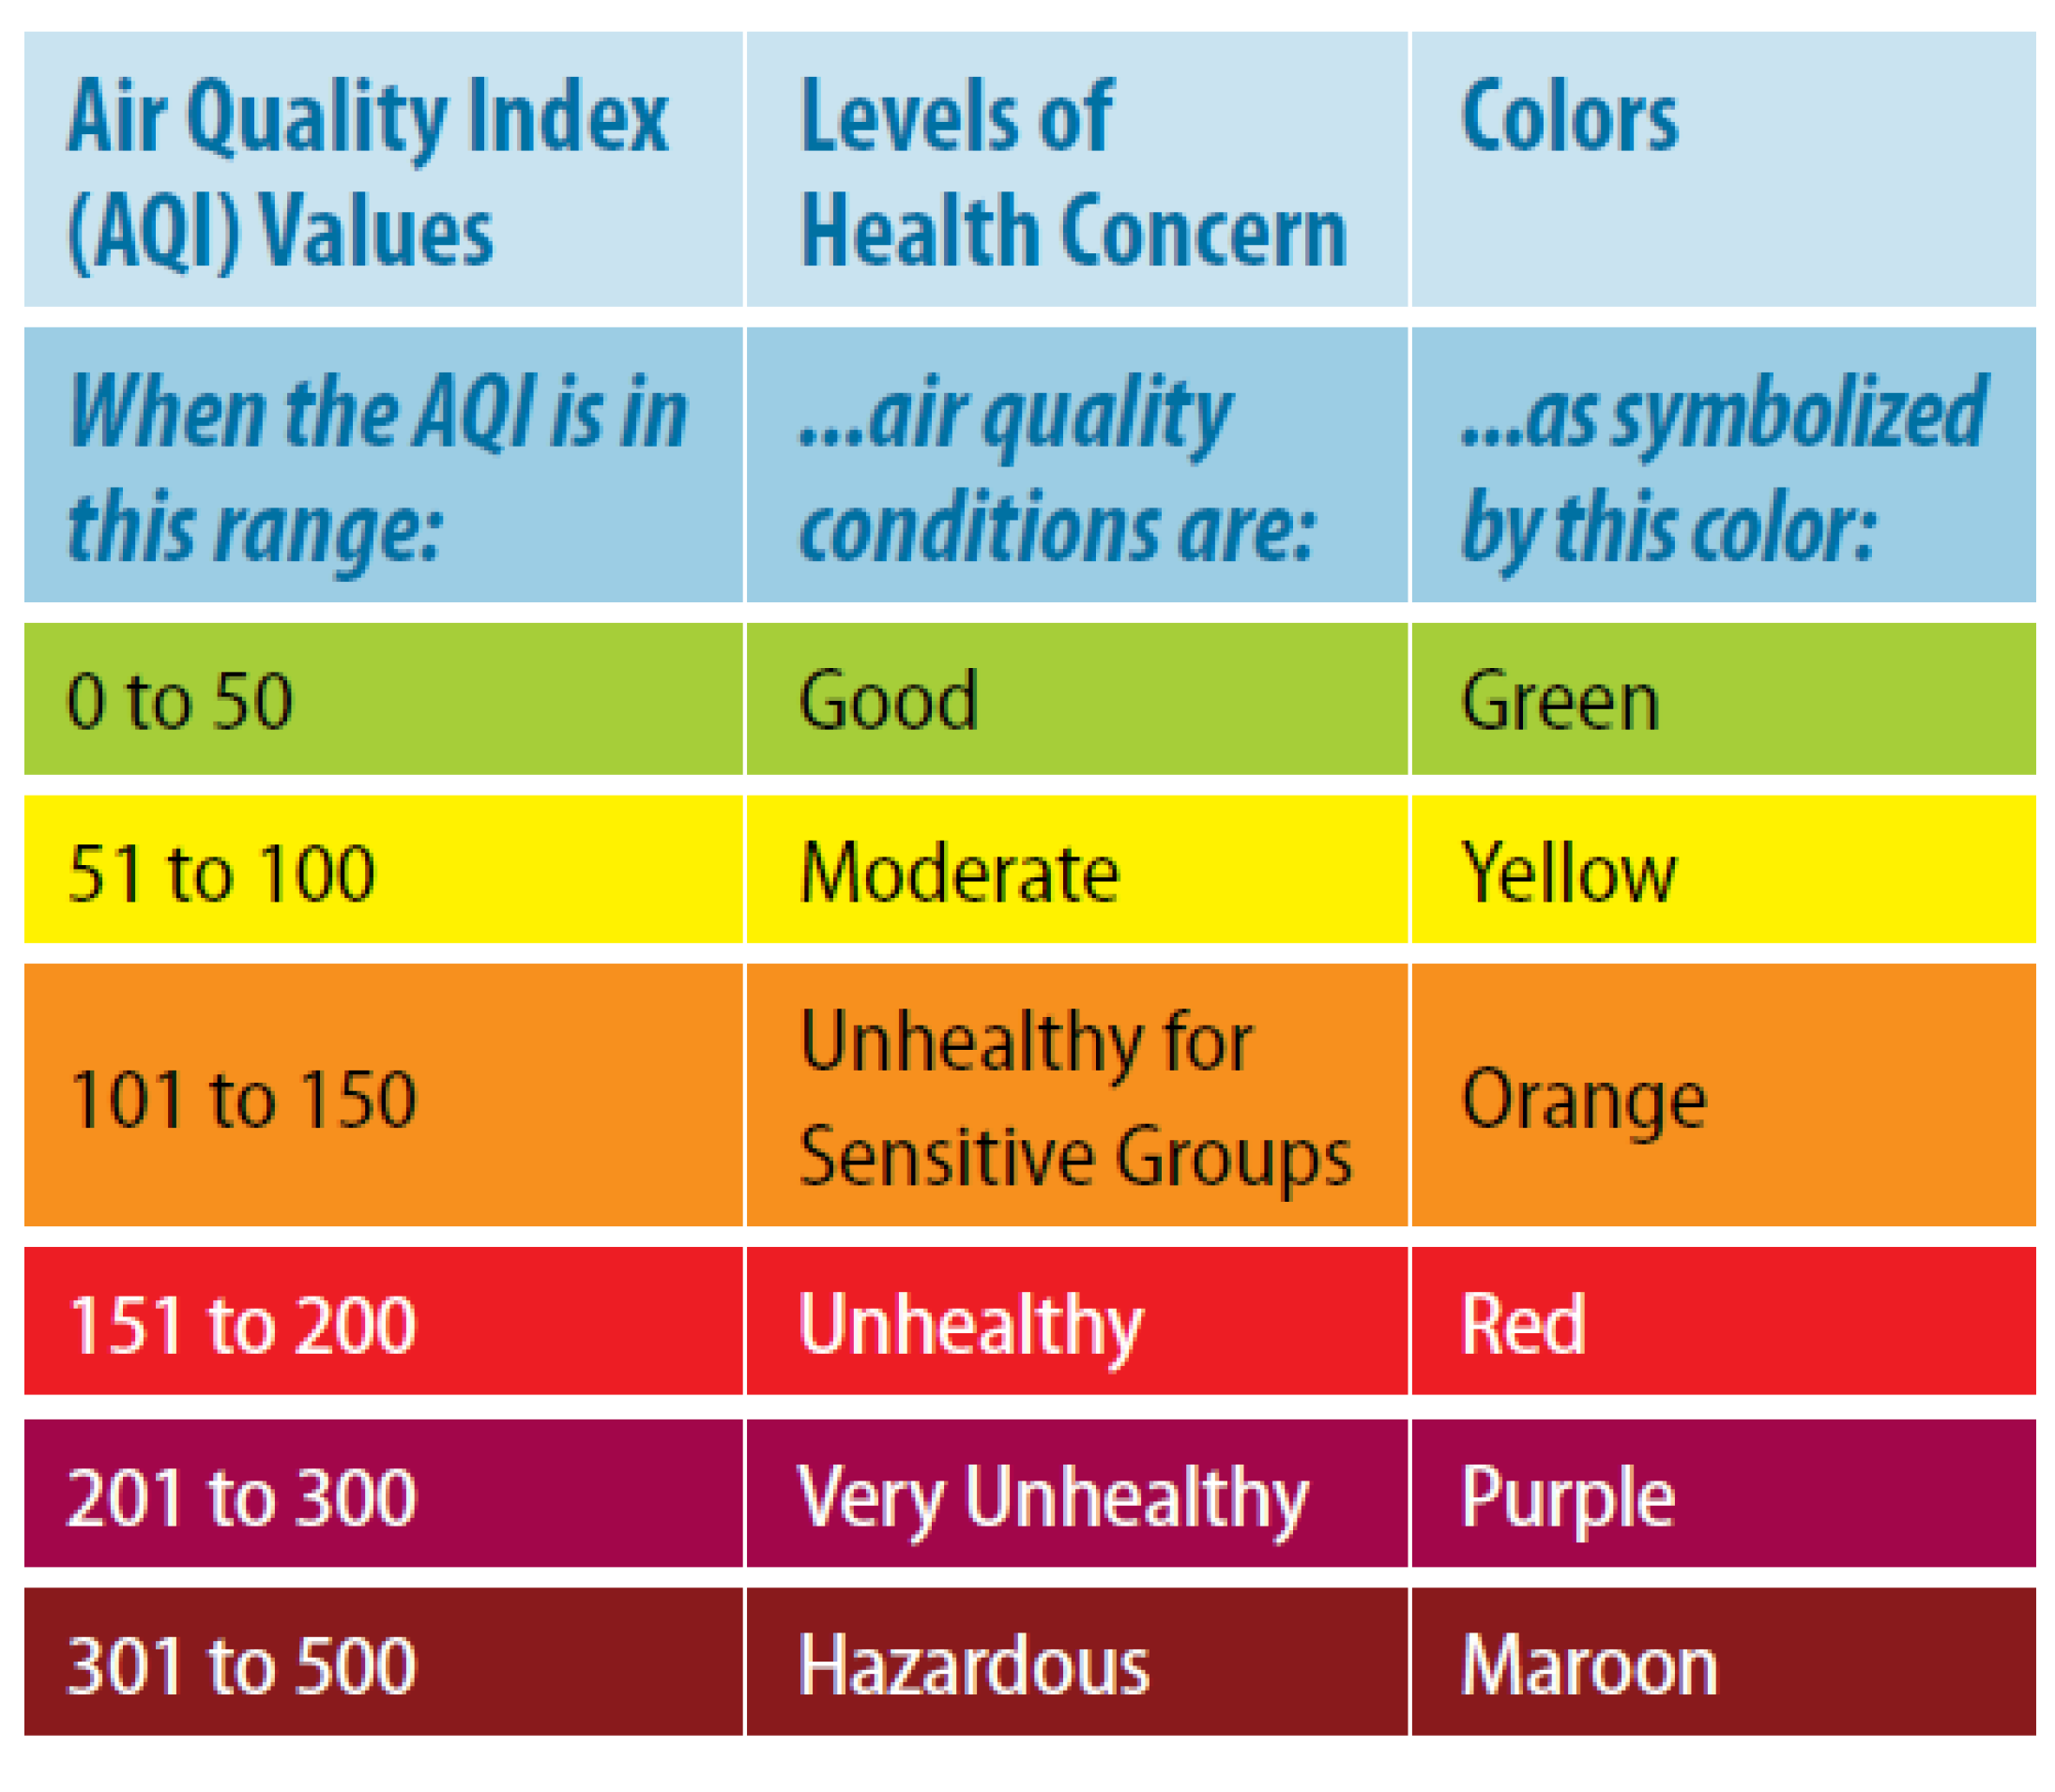
| Index Class | AQI | NO (ppb) | SO (ppb) | PM (g/m) |
|---|---|---|---|---|
| Good | 0–50 | 0–53 | 0–35 | 0–12.0 |
| Moderate | 51–100 | 54–100 | 36–75 | 12.1–35.4 |
| Sensitive | 101–150 | 101–360 | 76–185 | 35.5–55.4 |
| Unhealthy | 151–200 | 361–649 | 186–304 | 55.5–150.4 |
| Very Unhealthy | 201–300 | 650–1249 | 305–604 | 150.5–250.4 |
| Hazardous | 301–500 | 1250–2049 | 605–1004 | 250.5–500.4 |
| Crisp Input Variables | Fuzzy Input Parameters | Boundary Values for Universal Sets | Universe of Discourse for MFs |
|---|---|---|---|
| NO (ppb) | Low, Medium, High | 0–2049 | 0–53, 54–360, 361–2049 |
| SO (ppb) | Low, Medium, High | 0–1004 | 0–75, 76–304, 305–1004 |
| PM (g/m) | Low, Medium, High | 0–500.4 | 0–12.0, 12.1–55.4, 55.5–500.4 |
| Input Variables | Fuzzy Input Parameters | Boundary Values for Universal Sets | Universe of Discourse for MFs |
|---|---|---|---|
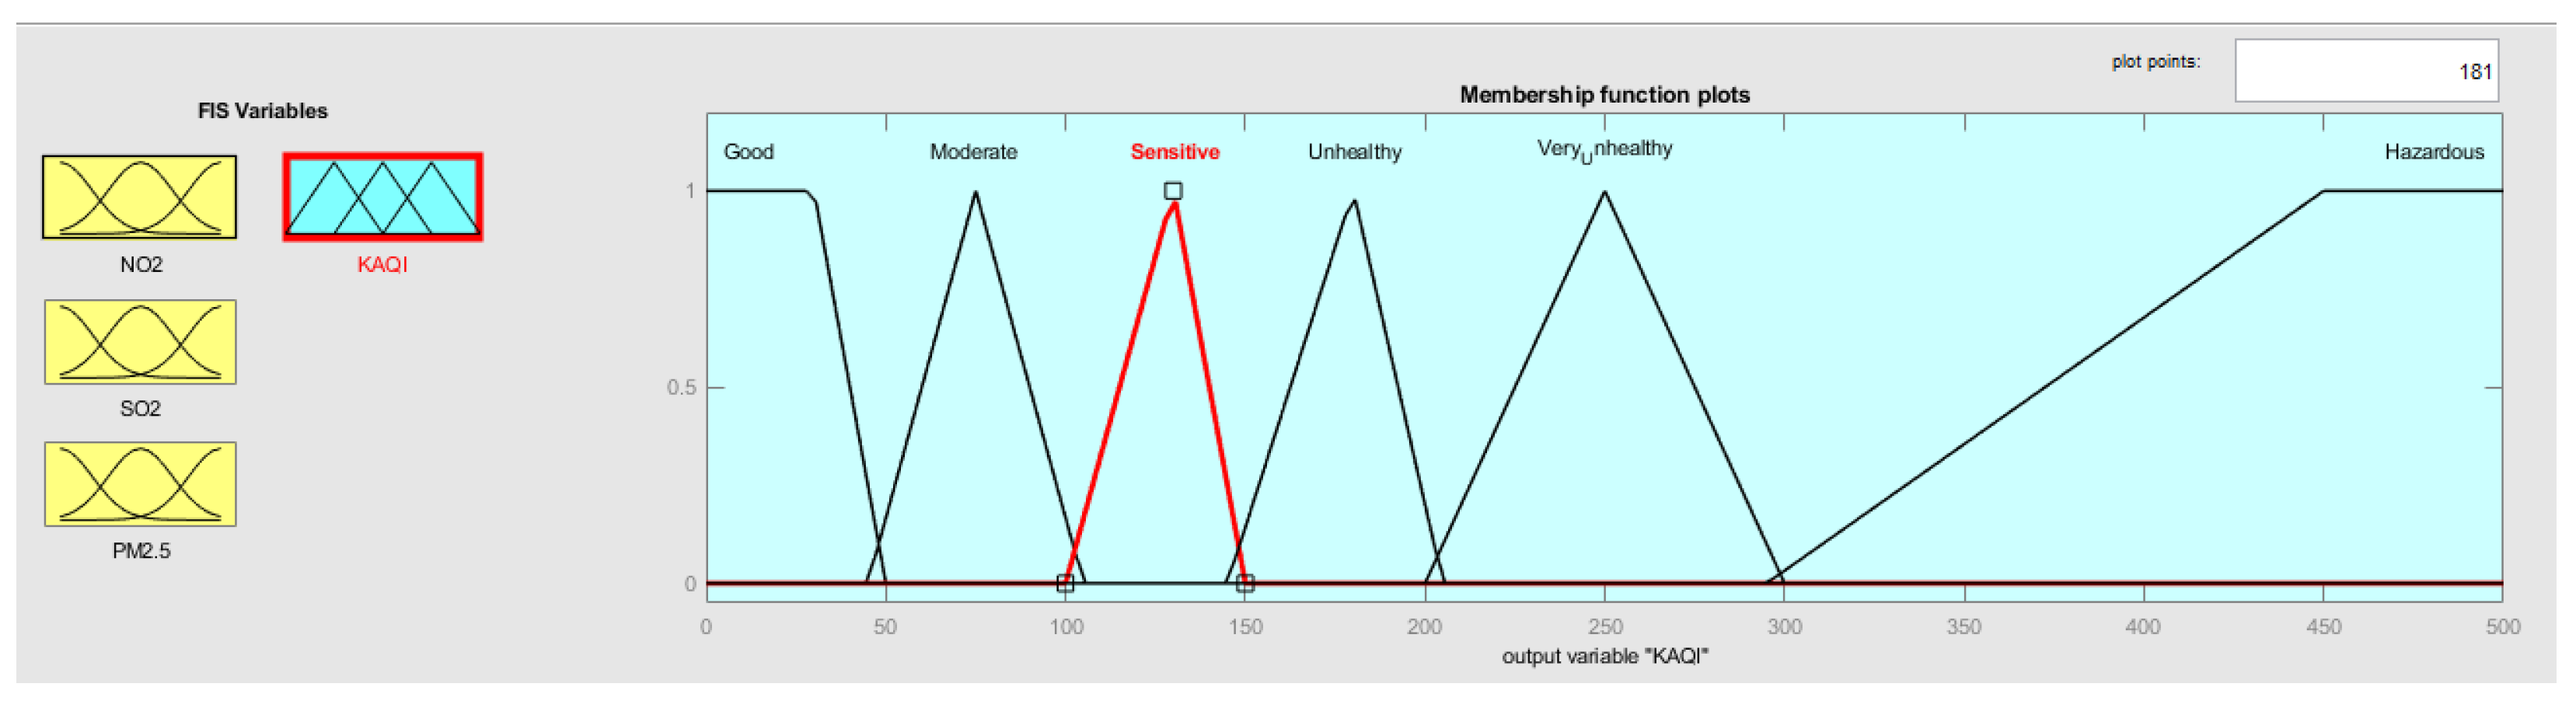
| KAQI | Good, Moderate, Sensitive, Unhealthy, Very Unhealthy, Hazardous | 0–500 | 0–50, 51–100, 101–150, 151–200, 201–300, 301–500 |
| Rule No. | NO (ppb) | SO (ppb) | PM (g/m) | KAQI |
|---|---|---|---|---|
| 1 | Low | Low | Low | Good |
| 2 | Low | Low | Medium | Moderate |
| 3 | Low | Medium | High | Unhealthy |
| 4 | Low | Medium | Low | Moderate |
| 5 | Low | Medium | Medium | Sensitive |
| 6 | Low | Medium | High | Very Unhealthy |
| 7 | Low | High | Low | Unhealthy |
| 8 | Low | High | high | Very Unhealthy |
| 9 | Medium | High | High | Very Unhealthy |
| 10 | Medium | Low | Low | Moderate |
| 11 | Medium | Low | Medium | Sensitive |
| 12 | Medium | Low | High | Unhealthy |
| 13 | Medium | Medium | Low | Moderate |
| 14 | Medium | Medium | Medium | Moderate |
| 15 | Medium | Medium | High | Very Unhealthy |
| 16 | Medium | High | Low | Very Unhealthy |
| 17 | Medium | High | Medium | Very Unhealthy |
| 18 | Medium | High | High | Hazardous |
| 19 | High | Low | Low | Unhealthy |
| 20 | High | Low | Medium | Unhealthy |
| 21 | High | Low | High | Hazardous |
| 22 | High | Medium | Low | Unhealthy |
| 23 | High | Medium | Medium | Very Unhealthy |
| 24 | High | Medium | High | Hazardous |
| 25 | High | High | Low | Hazardous |
| 26 | High | High | Medium | Hazardous |
| 27 | High | High | High | Hazardous |
| No. of Observations | NO (ppb) | SO (ppb) | PM (g/m) | KAQI Using Fuzzy Logic Based Model | KAQI Using Linear Interpolation Method |
|---|---|---|---|---|---|
| 1 | 30 | 50 | 20.9 | 27 | 18 |
| 2 | 40 | 185 | 150 | 250 | 200 |
| 3 | 100 | 150 | 30.6 | 80 | 134 |
| 4 | 290 | 350 | 345 | 361 | 331 |
Publisher’s Note: MDPI stays neutral with regard to jurisdictional claims in published maps and institutional affiliations. |
© 2021 by the authors. Licensee MDPI, Basel, Switzerland. This article is an open access article distributed under the terms and conditions of the Creative Commons Attribution (CC BY) license (https://creativecommons.org/licenses/by/4.0/).
Share and Cite
Katushabe, C.; Kumaran, S.; Masabo, E. Fuzzy Based Prediction Model for Air Quality Monitoring for Kampala City in East Africa. Appl. Syst. Innov. 2021, 4, 44. https://doi.org/10.3390/asi4030044
Katushabe C, Kumaran S, Masabo E. Fuzzy Based Prediction Model for Air Quality Monitoring for Kampala City in East Africa. Applied System Innovation. 2021; 4(3):44. https://doi.org/10.3390/asi4030044
Chicago/Turabian StyleKatushabe, Calorine, Santhi Kumaran, and Emmanuel Masabo. 2021. "Fuzzy Based Prediction Model for Air Quality Monitoring for Kampala City in East Africa" Applied System Innovation 4, no. 3: 44. https://doi.org/10.3390/asi4030044
APA StyleKatushabe, C., Kumaran, S., & Masabo, E. (2021). Fuzzy Based Prediction Model for Air Quality Monitoring for Kampala City in East Africa. Applied System Innovation, 4(3), 44. https://doi.org/10.3390/asi4030044