Article

Emerging Scientific Field Detection Using Citation Networks and Topic Models—A Case Study of the Nanocarbon Field

1
Institute for Future Initiatives, The University of Tokyo, Tokyo 113-0033, Japan
2
Graduate School of Engineering, The University of Tokyo, Tokyo 113-8654, Japan
*
Author to whom correspondence should be addressed.
Appl. Syst. Innov. 2020, 3(3), 40; https://doi.org/10.3390/asi3030040
Submission received: 21 August 2020 / Revised: 9 September 2020 / Accepted: 11 September 2020 / Published: 14 September 2020
(This article belongs to the Collection Feature Paper Collection in Applied System Innovation)

Abstract

:
In fields with high science linkage, such as the nanocarbon field, trends in academic papers are particularly important for identifying future technological trends. The use of the number of citations allows us to predict the qualitative trends on a paper-by-paper basis. At the same time, it is necessary to be able to comprehensively discuss both qualitative and quantitative aspects in the subject area. This study aimed to detect emerging areas in the nanocarbon field using network models and topic models. It was possible to not only construct a model that exceeded an 86.2% F1 measure but also to focus on an area that could not be detected by the prediction model. This was accomplished by focusing on paper units, such as the research on the chemical synthesis of zigzag single-walled carbon nanotubes. Thus, it is possible to obtain knowledge that contributes to diversified R&D strategies and innovation policies by considering the emergence of new fields from multiple perspectives.

1. Introduction

Academic research trends often help companies formulate research and development (R&D) strategies. Specialized knowledge is becoming more individualistic and, in highly fragmented fields, the results may change depending on the selection of participants [1]. In many academic fields, the number of publications is growing exponentially and it is becoming increasingly difficult to obtain comprehensive perspectives of such fields [2]. As the amount of science and technology data are increasing, attempts are being made to contribute to innovation policies and R&D strategies by considering entire fields [3,4,5,6,7,8,9]. While endeavoring to obtain the overall perspectives of such fields, efforts have also been directed toward investigations of what kinds of research will attract attention in the future [10,11,12,13,14]. In fields such as the nanocarbon field where the linkage representing the distance between technology and science is high, the trends of academic papers are important for identifying future technological trends. There are many review papers on nanocarbons, including ones on exudation in carbon nanotube (CNT) polymer composites [15], chemical vapor deposition (CVD) of CNTs [16], and the application of CNTs as electrode materials in lithium-ion batteries [17]. It is possible to provide certain guidelines for overviewing work in this area from the past to the present. However, few studies have adequately discussed future projections.
Extensive research has been conducted on the prediction or identification of emerging science and technology fields. The prediction of emerging research areas has traditionally been studied in bibliometrics or library and information science. It is known to be useful to focus on the citation relationships of papers as a method for extracting the essence of a field. The number of citations is a useful indicator for evaluating the quality of research. The use of regression of the number of citations allows us to downsize the number of papers and to avoid selection bias [18,19,20]. Due to the current advancement of prediction algorithms, such as machine learning algorithms and the improvement of computing capabilities, it has become possible to extract patterns that contribute to predicting future trends.
This research-based forecasting of the future of science is needed when companies and governments discuss innovation policy, but a paper-by-paper perspective alone is insufficient information for actual decision-making. A semimacro perspective on what new areas are emerging is needed, not just a paper-by-paper view. This study focuses on the field of nanocarbons, not only in terms of papers but also in terms of emerging areas. A combination of micro and semimacro perspectives will enable us to understand the trends in the field in terms of both quality and quantity.

1.1. Literature Review

There has been discussion regarding the definition of an emerging paper based on indicators of emergence using similarity and entropy between papers [21]. This includes an increase in terms of the abstracts [22] and the cumulative number of scientific and technological documents in basic and applied research. Dong et al. [23] predicted the h-index of a book five years after publication. They defined the impact of a paper based on six factors—author, content, publisher, citation, coauthorship, and time series—and applied their approach to 200,000 computer science papers [23]. Chakraborty et al. [24] used data from 1.5 million computer science papers to categorize the time series of citation counts for several years after publication into six types. By combining the characteristics of the authors, academic societies, and keywords, Chakraborty et al. predicted the citation counts within five years. Wang et al. [25] focused on the power law describing the citation numbers of papers and formulated a citation number prediction method for future papers from the time series information of citation numbers five years after publication. Adams [26] showed that the number of citations 3–10 years after publication is correlated with the number of citations 1–2 years after publication in the fields of life science and physics. Li and Tong [27] formulated the paper citation prediction as an optimization problem. The authors studied 50,000 computer science papers and estimated the number of citations 10 years after publication based on the information obtained 3 years after publication.
Reports that discuss emerging research using citation analysis can be broadly divided into those that involve cocitations [10,28], bibliographic coupling [29], and direct citations [30,31]. In many of these investigations, knowledge structures were abstracted as networks. Davletov et al. [32] estimated the number of citations 5 or 10 years after publication by using the time series information of citations several years after publication and the structure information of citation networks. This was accomplished by employing data from 27,000 arXiv energy physics papers [32], 150,000 computer science papers (Arnet Miner), and 200,000 papers (CiteSeerX). According to Davletov et al. [33], the time series of citations during the first two years after publication are important for prediction. Meanwhile, Mori et al. [34] focused on academic papers related to artificial intelligence to predict the emergence of papers from the perspective of increasing the citation count by using network, text, and cluster information, among other aspects. Sasaki et al. [35] attempted to extract emerging papers in the photovoltaic (PV) power generation field. Chen et al. [36] used cocitation networks and collaborative research networks in academic papers to focus on research across structural gaps in networks. Citation networks are connections of knowledge, at least based on the premise that knowledge is built on knowledge in academia.
Topic models are often used to predict trends in academic research. In recent years, Latent Dirichlet Allocation (LDA) has been used in numerous studies for scientific and technological bibliographic information [37,38,39]. For example, Jiang et al. [40] extracted common terms such as “fish,” “species,” “emission,” “lake,” “sediment,” and “climate” using topic models from 1726 papers related to hydroelectric fields. These facilitate understanding of the topic of interest, using all the papers published in a particular year as a parameter. However, the topic model is a model that evaluates a topic based on the many terms that have appeared up to that point. In other words, they can capture a large trend in a topic, but they do not guarantee the quality of the research. In addition, topic models do not contribute to the future prediction of a field, because they evaluate the emergence of many terms as a posteriori.

1.2. Purpose and Contribution

As described above, it is possible to evaluate individual papers by using quality indexes such as the number of citations, but it is not sufficient to evaluate quantitatively the emerging fields of research. In addition, it is not sufficient to evaluate qualitatively and predict the future of research if we only evaluate topics that are emerging in large numbers at a given time, as in the case of the topic model. In forecasting the emergence of a field where both scientific and technological applications are mixed, such as nanocarbons, there are scientific and commercial perspectives. In such a complex field, there is a limit to the ability to predict and discuss the emerging technologies using only one forecasting method. However, not enough research exists to predict the emergence of the field from this perspective. In this study, we propose a prediction method that takes into account both the quality and quantity of emerging fields, by discussing them from both a micro perspective, which has not been sufficiently discussed in the past, and a semimacro perspective, which has focused on the cluster units.
The contribution of this study is to provide knowledge that will help companies and governments to predict the future from multiple perspectives when implementing innovation plans in highly uncertain fields, such as nanocarbons.

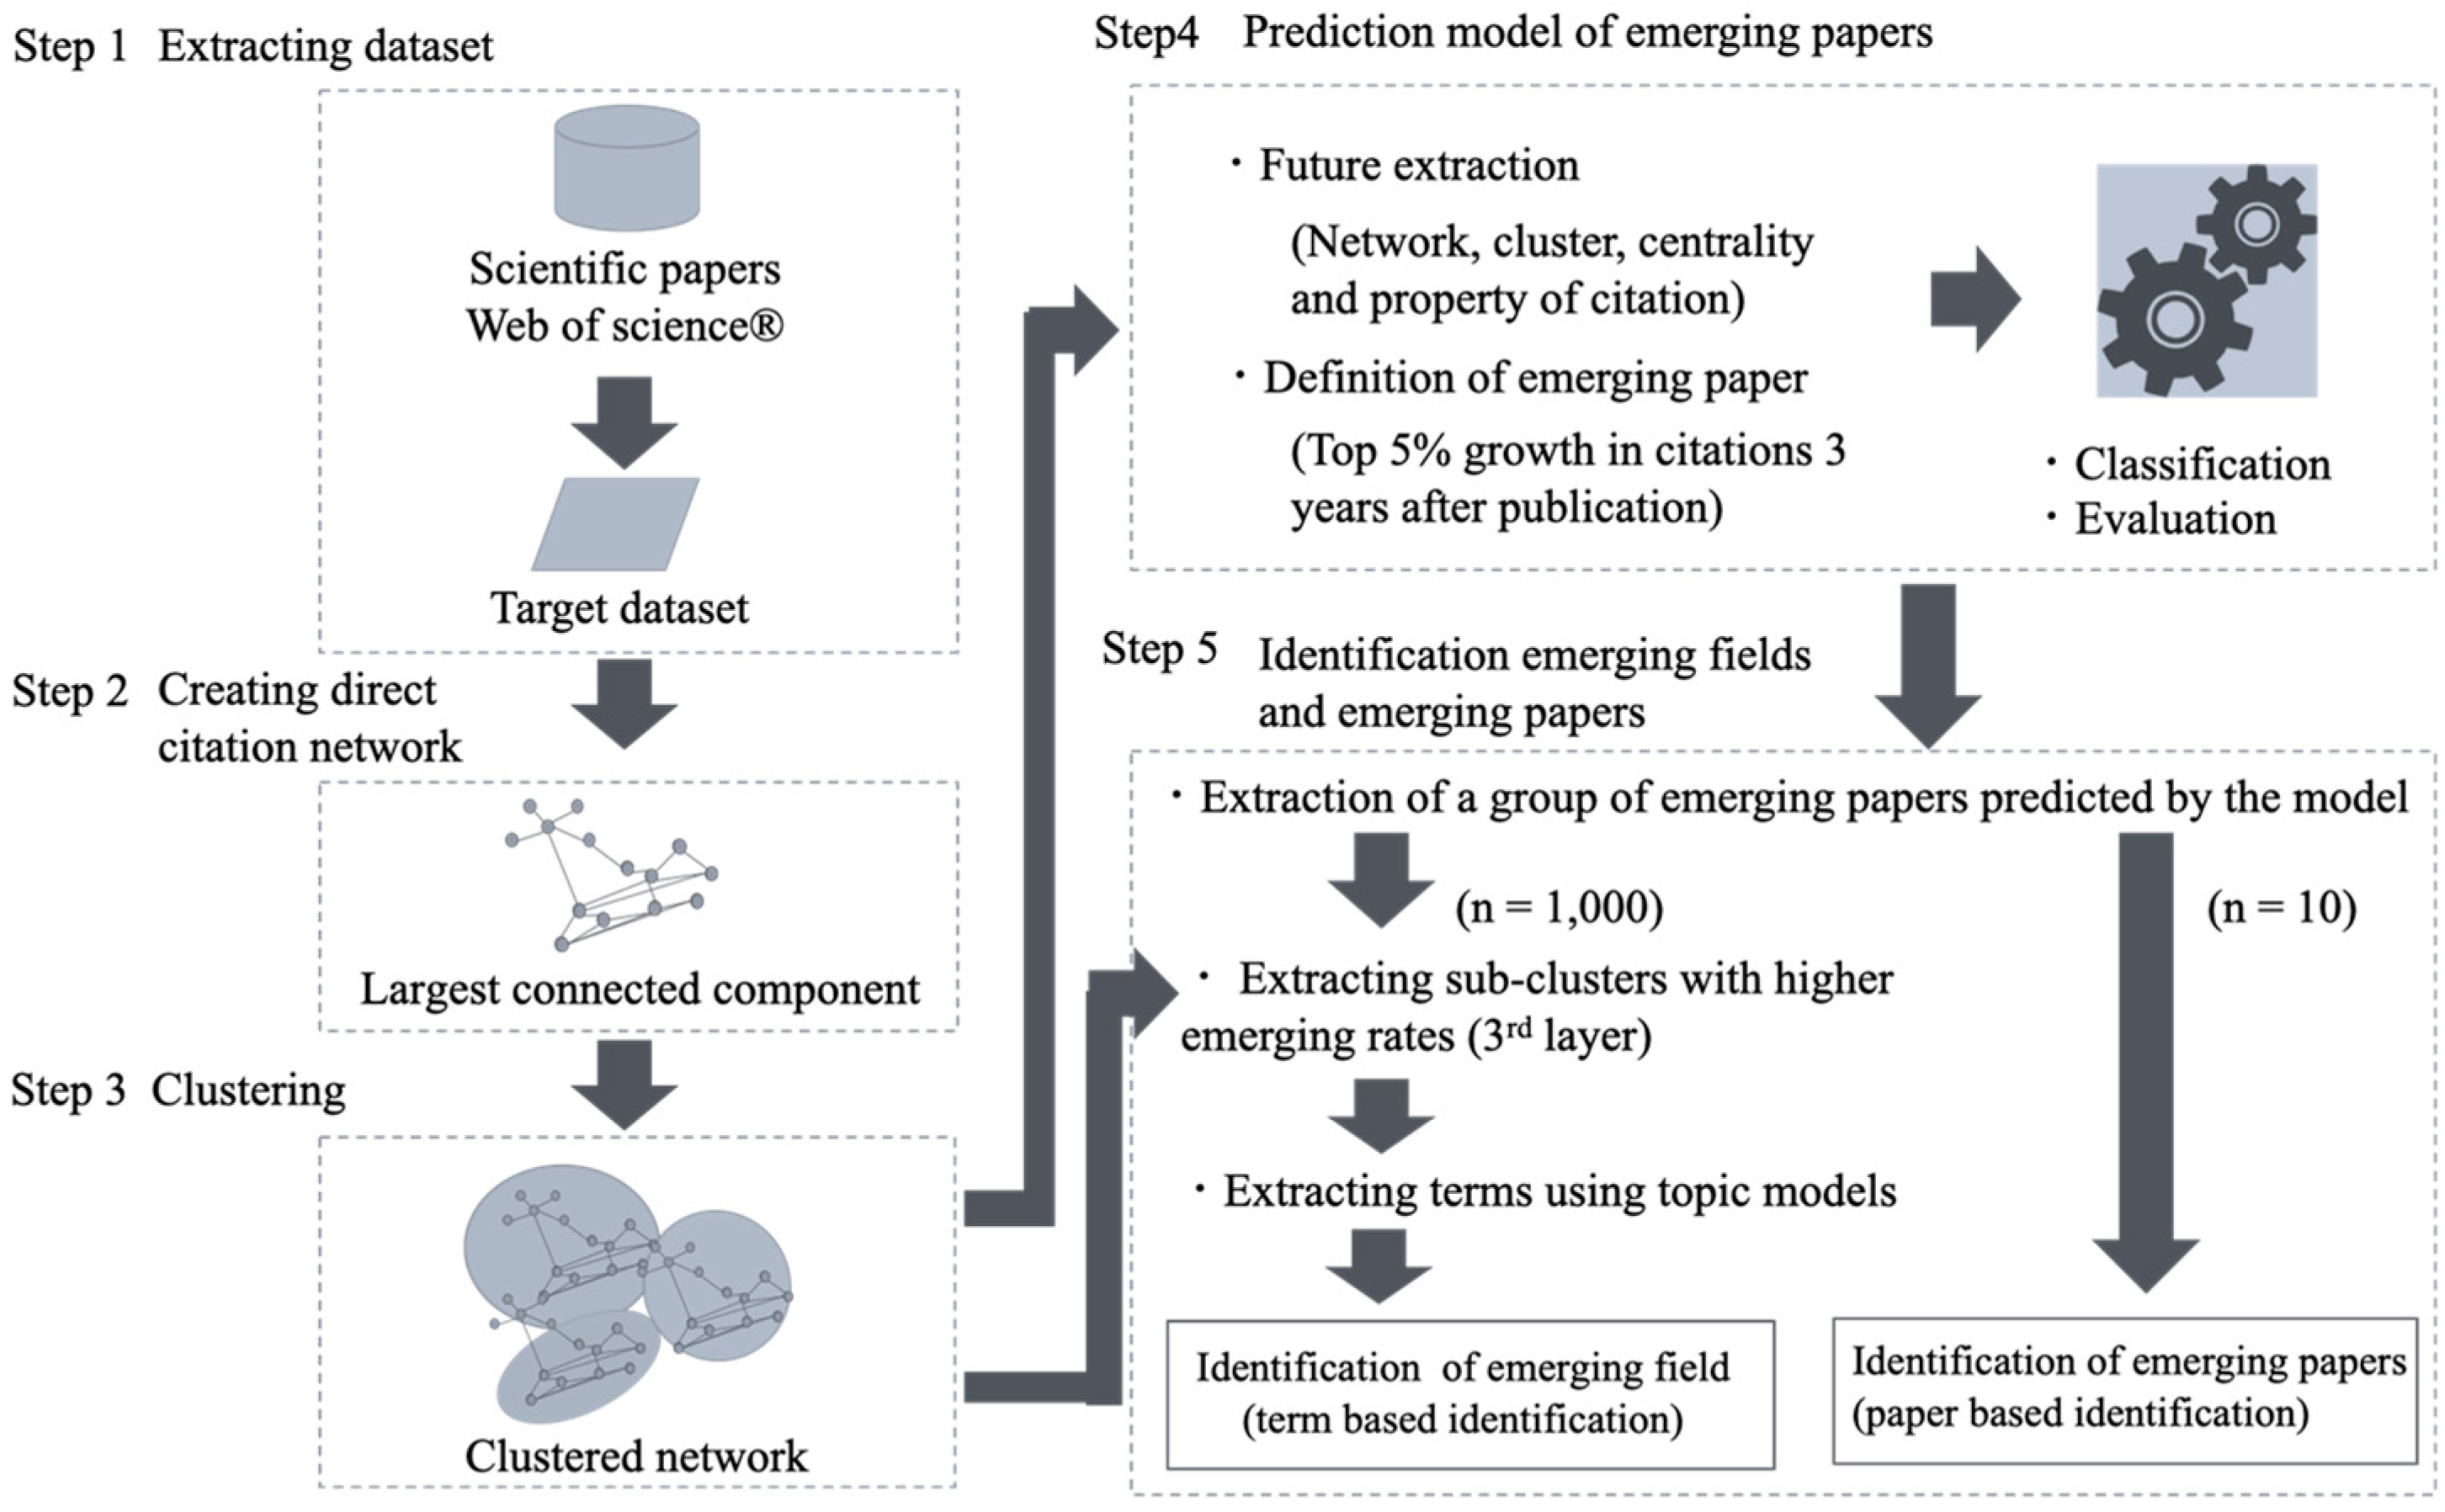
2. Method Development

2.1. Overview

Figure 1 provides an overview of the method. As shown, the citation network was converted into an unweighted network with papers as nodes and citation relationships as links (Step 1 in Figure 1). Because core papers always constitute the largest component, direct citation is the most effective means of detecting research frontiers. In fact, not all papers are closely related to the target fields of nanocarbons. Papers having no citations as the largest component were considered digressional and were ignored in this study (Step 2 in Figure 1). The network was then divided into several clusters [41,42] using the topological clustering method [42] (Step 3 in Figure 1). Topological clustering is a clustering method based on the graph structure of a network, and here we use a modularity maximization. Here, a cluster is a module in a citation network and is a group of papers in which the citation relations are divided using a modularity (Q value) maximization method and are densely aggregated [42]. The modularity maximization method appreciates network partitioning such that the intracluster is dense and the intercluster is sparse. The modularity maximization method determines an optimal partitioning pattern by extracting the partitioning pattern that maximizes the modularity by a greedy algorithm. Q is an evaluation function of the degree of coupling within a cluster and between clusters and is given below.
Q = i ( e i i a i 2 )
Here, e i i is the ratio between the number of links connected to nodes belonging to the same cluster i and the number of links in the entire network. Additionally, a i 2 is the expected value of the ratio between the number of links of e i i and the total number of links.
Next, an emerging paper was defined, features were extracted from the cited networks, and the constructed machine learning model was evaluated (Step 4). Emerging papers were defined as papers that were ranked in the top 5% of the dataset each year and whose citations increased for three years after publication. Step 4 will be described in detail after the following task definition. Using the predicted emerging paper results, the topics of the clusters were further analyzed to address the emergence by area and paper (Step 5 in Figure 1).

2.2. Feature Extraction

The features of each paper were extracted from the bibliographic information and citation network of the obtained paper. The features referred to here were learning data for predicting emerging papers. These were used as explanatory variables. The features in this study can be classified into four categories: network macro features; cluster features; network centrality features; citing paper features. A network macro feature is a typical feature of the target citation network. These include: the maximum value (NW MAXQ) of the number of papers (NW NODES); the total number of citations (NW EDGES); the modularity (Q value) of the clusters in the network. Cluster features describe the cluster to which the target paper belongs to and includes the maximum Q value of the cluster (CL QMAX), the number of nodes in the cluster (CL NODES), and the order of the cluster (CL RANK) to which the subject paper belongs. The network centrality features indicate the central position of a given paper in a cited network. Specifically, these include: the centrality degree (CNT DEGRE) [43]; the betweenness centrality (CNT BETWE) [43]; the closeness centrality (CNT CLOSE) [43]; the eigenvector centrality (CNT EIGEN) [44]; the network constraint (CNT NETWO) [45]; the clustering coefficient (CNT CLUST) [46]; the page rank (CNT PAGER) [47]; the hub score (CNT HUBSC) [48]; the authority score (CNT AUTHOR) [48]. Reference paper feature values were calculated for the cited papers, and representative statistical values such as the maximum, minimum, average, and total were used as the feature values. For each of the papers, 15 features (network, cluster, and centrality) can be calculated directly. In addition, three cluster features and nine centrality features were calculated for each reference in the paper, and the maximum, minimum, average, and total values were considered to be the features. Thus, the number of reference paper features was 48 (=12 * 4). The number of all features was 63 (=15 + 48) for all papers. Table 1 summarizes all 63 types of features in the four abovementioned categories. These features calculated the maximum connected components among the cited networks in the target field, which were used as explanatory variables in the prediction model.

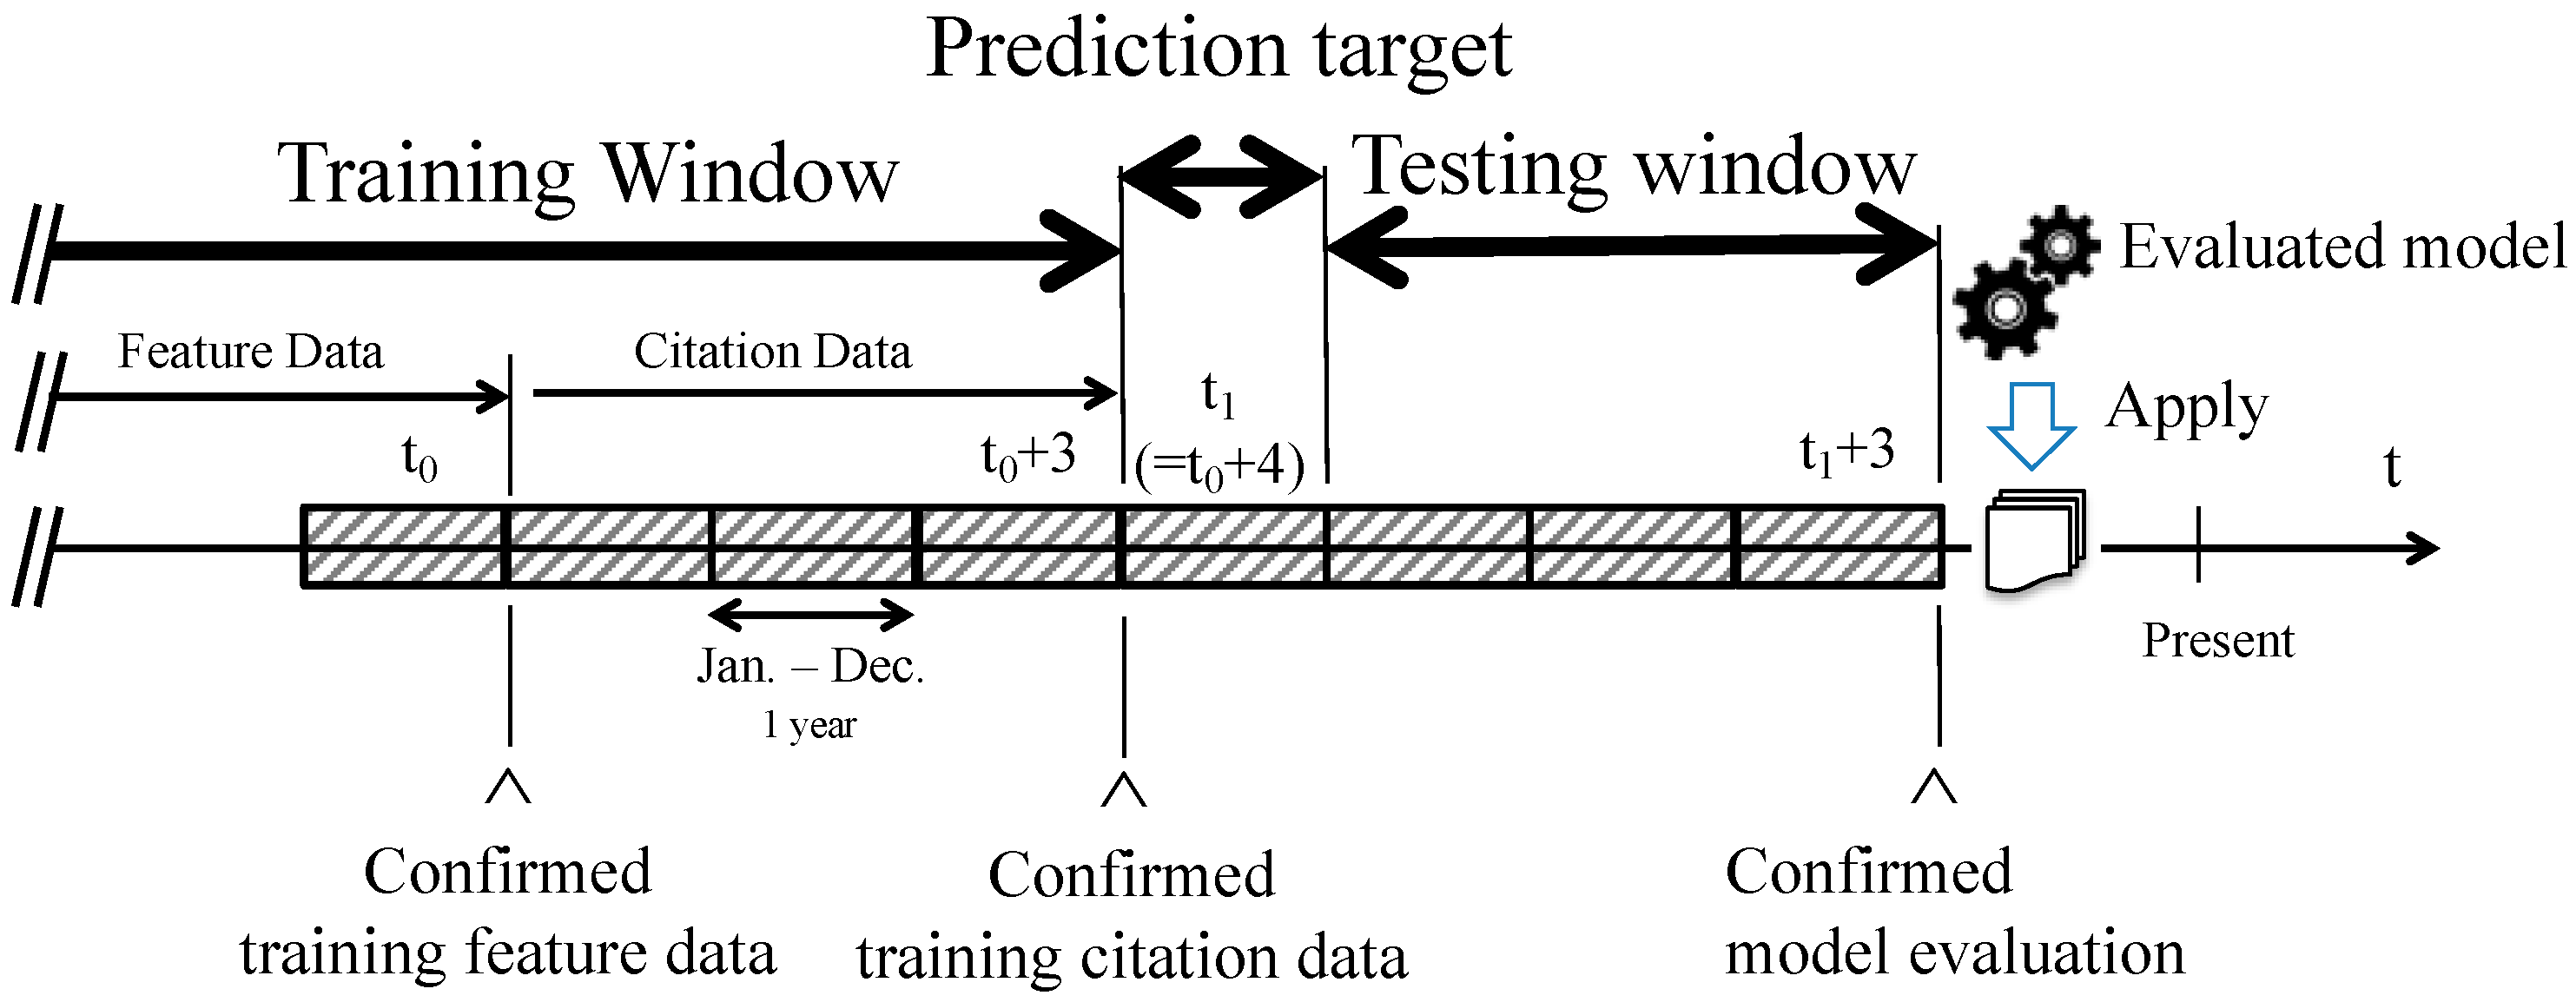
2.3. Task Definition

In this study, all the features were calculated for the papers included in the largest connected component of the cited network and were treated as explanatory variables. The explained variable was whether the paper was an emerging paper. Emerging papers were defined as papers that were ranked in the top 5% of the dataset each year and whose citations increased for three years after publication. In fact, in the case of emerging papers included in the top 5% of the increase in the number of citations, a positive example was given a flag, and 50% or less was treated as a negative example, or as an explained variable. In other words, the emergence prediction problem in this study was considered to be a two-class classification problem, involving the identification of whether a paper satisfied the requirements for emergence within three years of publication. A logistic regression, which is a linear classifier, was adopted as the classifier, and LIBLINEAR was used for implementation. Among the data included in the negative example, the same amount of data as in the positive example were randomly extracted eight times, and eight kinds of datasets were constructed for each year. In addition, by performing a five-fold cross validation on each model, overlearning was avoided. The prediction model used learning data regarding whether a paper had become an emerging paper three years after publication and was actually applied to a group of papers published four years after the publication of the learning data as a prediction object. That is, when t1 (=t0 + 4) was set as the publication year of the prediction target paper, the learning data of t0 + 3, which was the learning window, were applied to the paper from t1 (=t0 + 4). The model could also be evaluated three years after the publication of the model (t1 + 3). This period was defined as the evaluation window. A schematic of the relationship between the learning and evaluation windows is provided in Figure 2.
For example, if a paper published in 2012 (t1) is the subject of prediction, the prediction model is constructed using the citation growth rate of papers published in 2008 (t0) as of 2011 (t0 + 3). This model is called the 2008 model for convenience. By applying the 2008 model to the set of papers published in 2012 (t1 = t0 + 4), a forecast for 2012 was obtained. A further three years later, in 2015 (t1 + 3), it is possible to evaluate the results of applying the 2008 model to the 2012 publication data. Table 2 shows the correspondence between the learning and evaluation years for each model.

2.4. Evaluation

The F 1   m e a s u r e which is defined as the harmonic mean of the P r e c i s i o n and R e c a l l , was used to evaluate the analytical model. The P r e c i s i o n is the ratio between the number of actually emerging papers and the number predicted as emerging. The R e c a l l is the ratio between the number of papers predicted as emerging and the number actually emerging. The F 1   m e a s u r e was extensively used to evaluate the prediction models. The definitions of precision and recall, which are commonly used in machine learning classification models, are shown below.
The precision is the fraction of positive data that is actually positive:
P r e c i s i o n = T r u e   P o s i t i v e   ( T r u e   P o s i t i v e + F a l s e   P o s i t i v e )
The recall is the fraction of data that is actually positive relative to the data that were predicted to be positive:
R e c a l l = T r u e   P o s i t i v e ( T r u e   P o s i t i v e   +   F a l s e   N e g a t i v e )
The F1 measure is the harmonic mean of the precision and recall:
F 1 m e a s u r e = 2 P r e c i s i o n · R e c a l l ( P r e c i s i o n   +   R e c a l l )

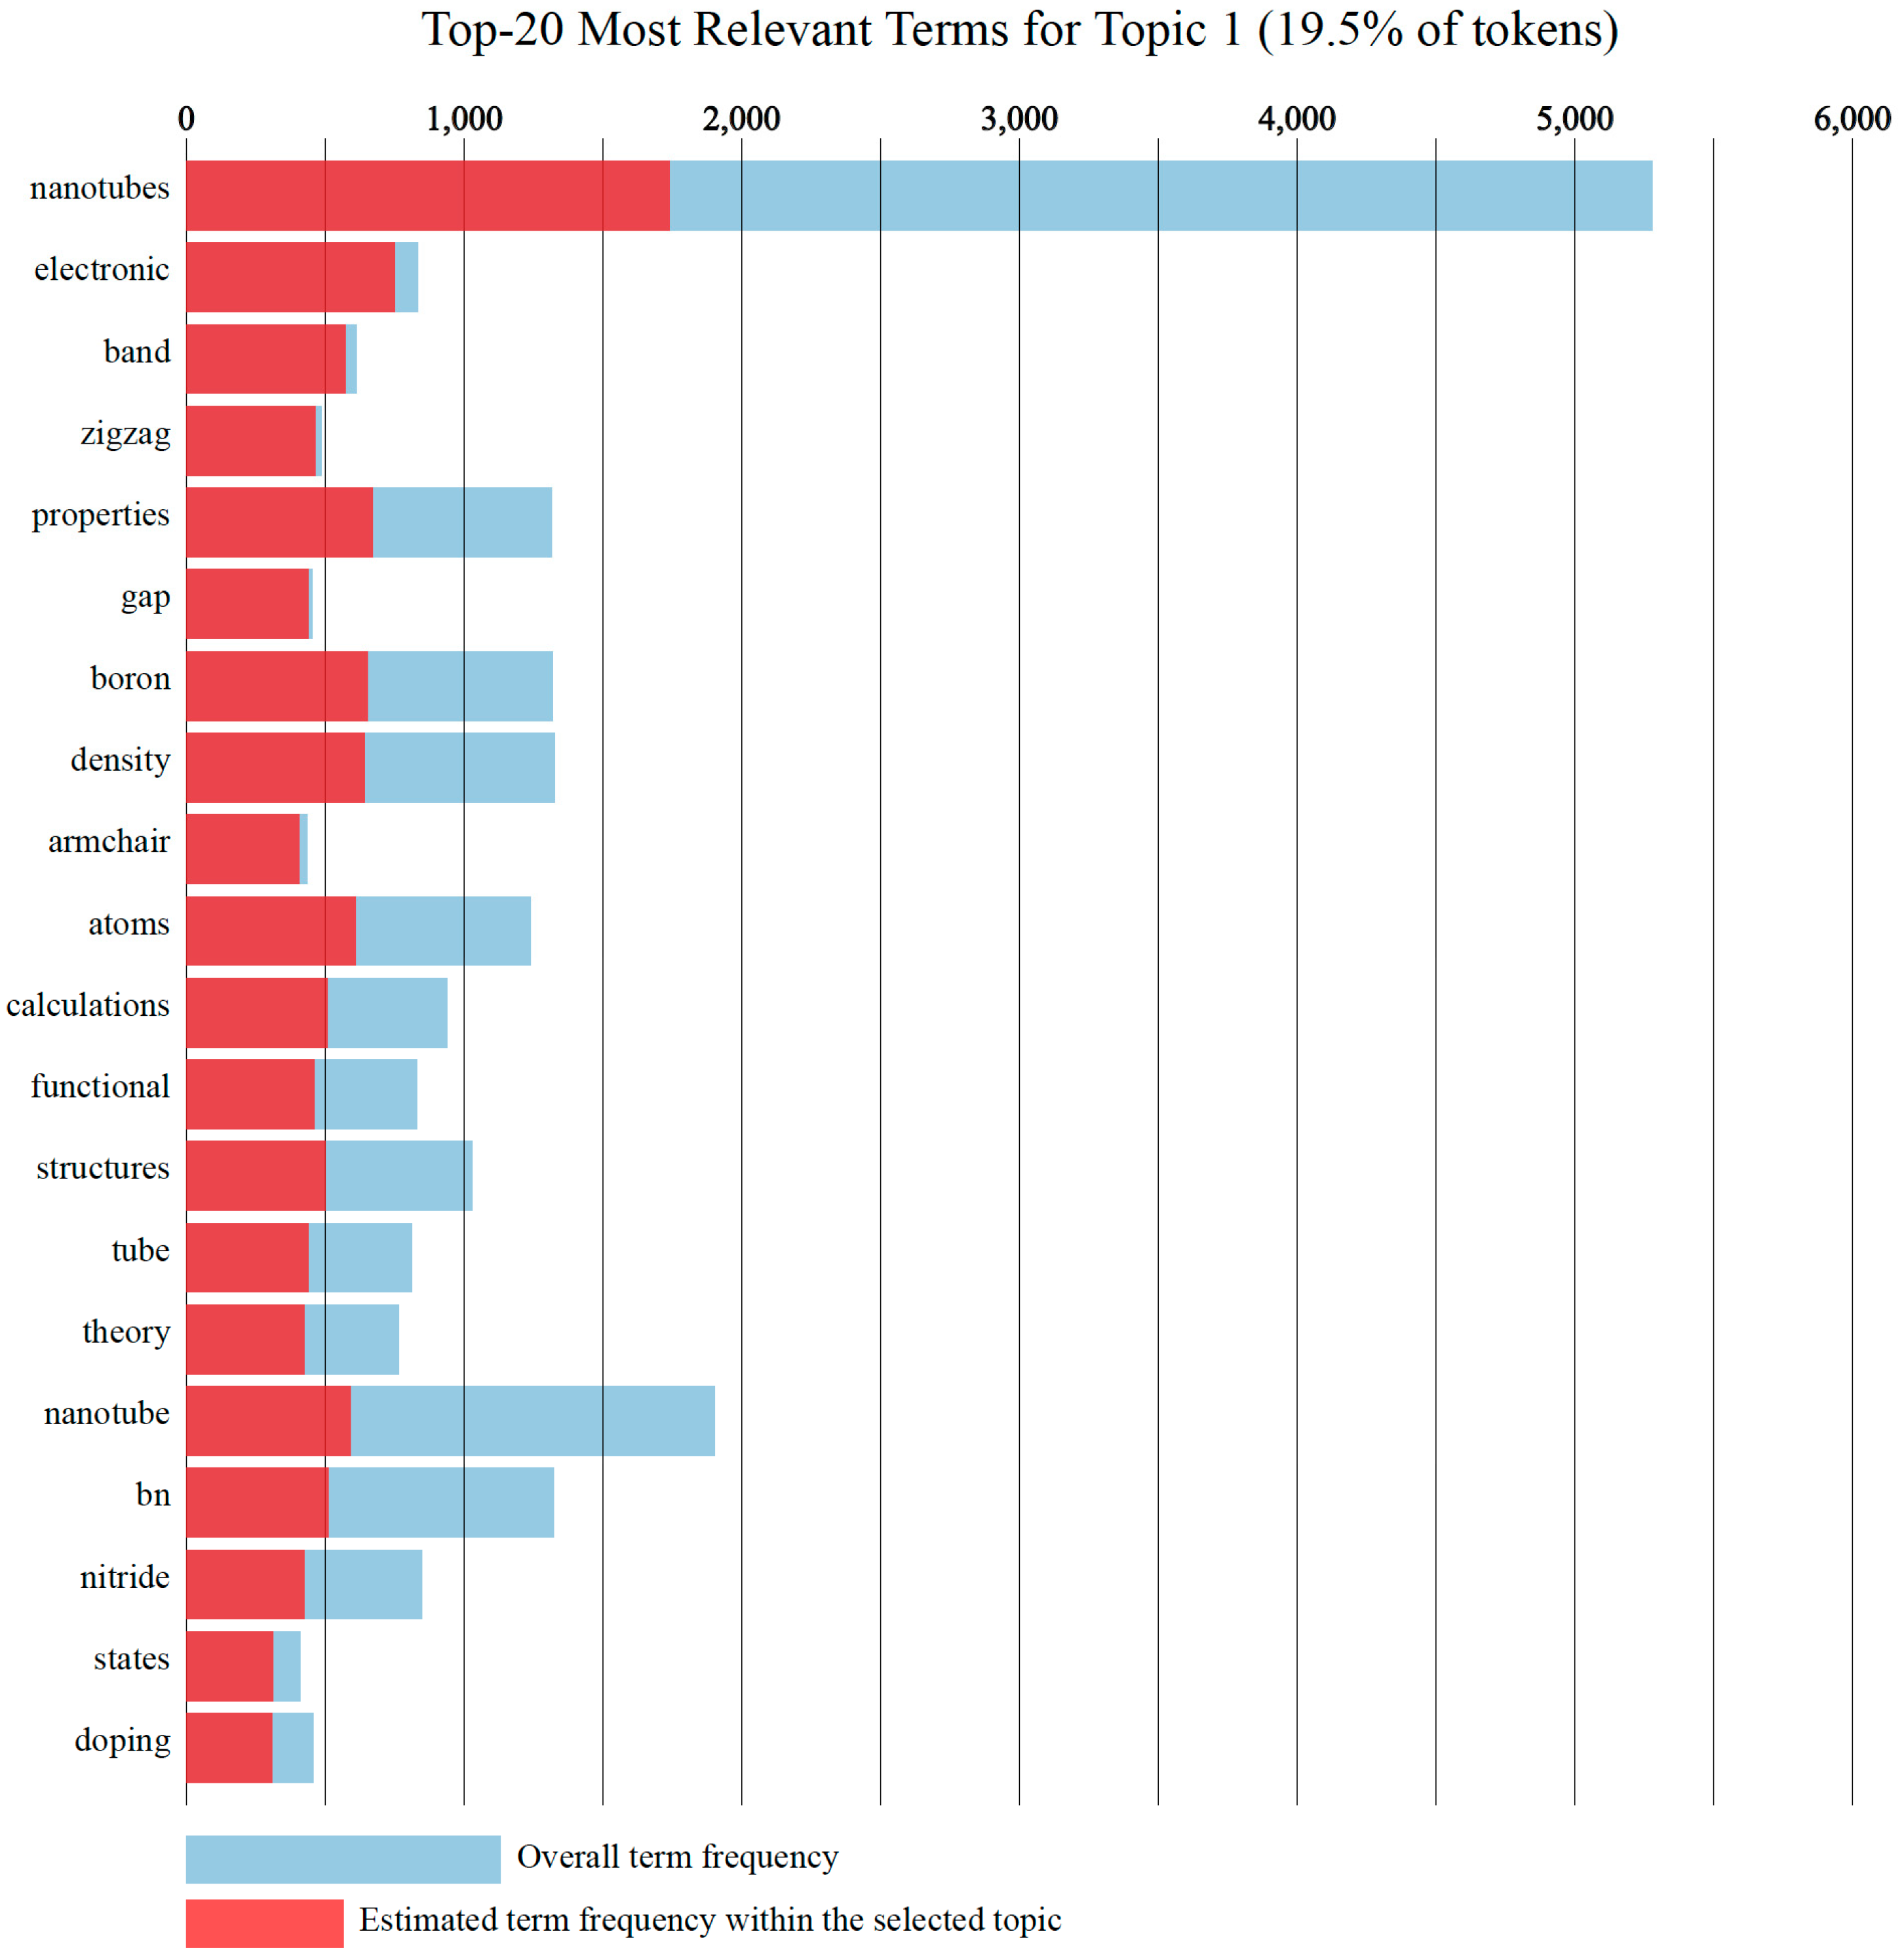
2.5. Topic Extraction from Each Cluster
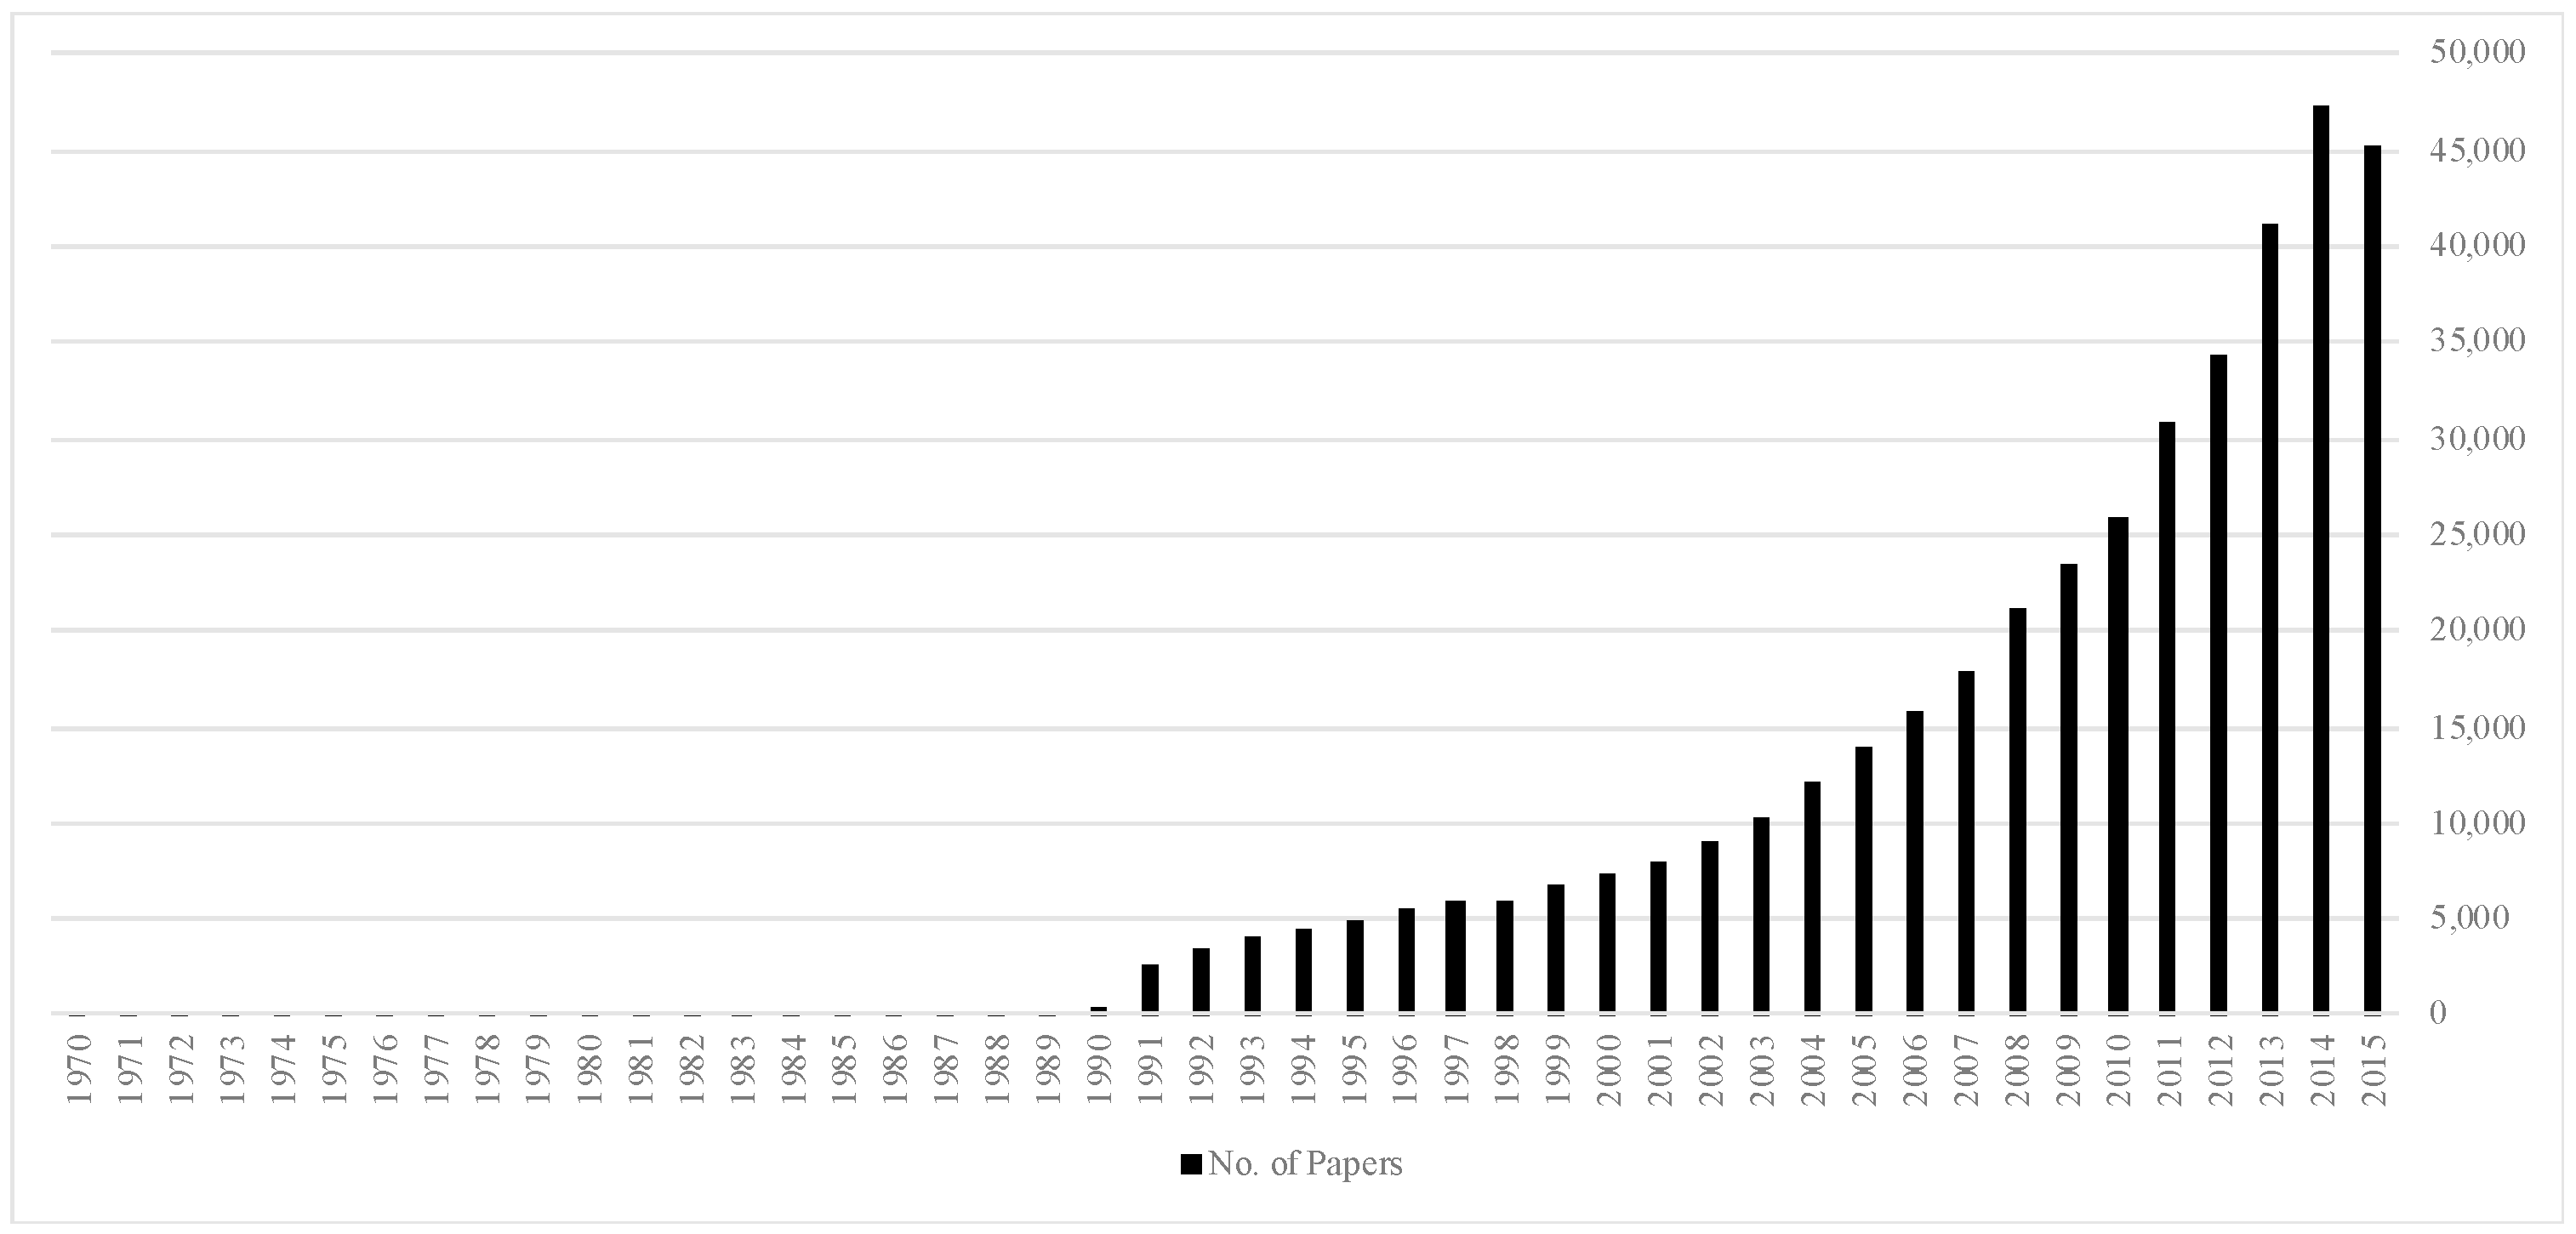
The topics of the papers belonging to each cluster were estimated using latent dirichlet allocation (LDA) [49]. LDA is a topic model—a probabilistic language model for estimating the contents of a target document (group). Since the LDA model assumes that a document (group) consists of multiple topics, it serves the purpose of analyzing the object as a cluster unit in a quoting network. For example, suppose a group of papers has silicon-based solar PV (photovoltaics), thin-film solar PV, and dye-sensitized solar PV as topics. The probability distribution is determined as the probability of generating (silicon, membrane, dye-sensitized) = (0.1, 0.3, 0.6) which is 0.3 for each topic and that of (silicon, membrane, dye-sensitized) = (0.6, 0.2, 0.2) is 0.6. The graphical model is shown in Figure 3. Here, α is a parameter for obtaining the topic selection probability. Additionally, β is a parameter for obtaining the terms generation probability in accordance with the topic. These parameters are estimated with N terms in each document and M document sets [49].
LDAvis is used to visualize LDA [50]. The saliency of term w in any topic t is defined by Equation (5). In addition, the number of topics included in each cluster is estimated [51].
S a l i e n c y t e r m w = f r e c u e n c y ( w ) [ s u m t p ( t | w ) log ( p ( t | w ) p ( t ) ) ]

3. Dataset

In this study, the analysis will focus on the field of nanocarbons. A nanocarbon material is a material made from graphite composed of carbon nanotubes (CNTs), graphene, and fullerenes. Nanocarbon materials are employed in various devices, such as semiconductors, fuel cells, optical devices, and structural materials. This can be attributed to their excellent mechanical, electrical, and thermal properties. For example, the potential use of nanocarbon materials in energy fields [52,53,54,55,56] and space elevators has been discussed [57,58,59].
The Science Citation Index (SCI) and Social Science Citation Index (SSCI) database indexed by Web of Science were used to extract papers with “((carbon and (nano* OR micro*)) or fullerene or Buckminsterfullerene or Buckminster-fullerene or C60 or C-60 or graphene or (filament* and carbon))” in the titles or keyword lists of papers published between 1 January 1970 and 31 November 2015. As a result, 411,084 papers satisfying these criteria were extracted.

4. Results

Figure 4 presents the number of scientific papers published in each year since 1970. The number of papers published increases rapidly starting in 1991 and there were more than 45,000 papers published in 2015.

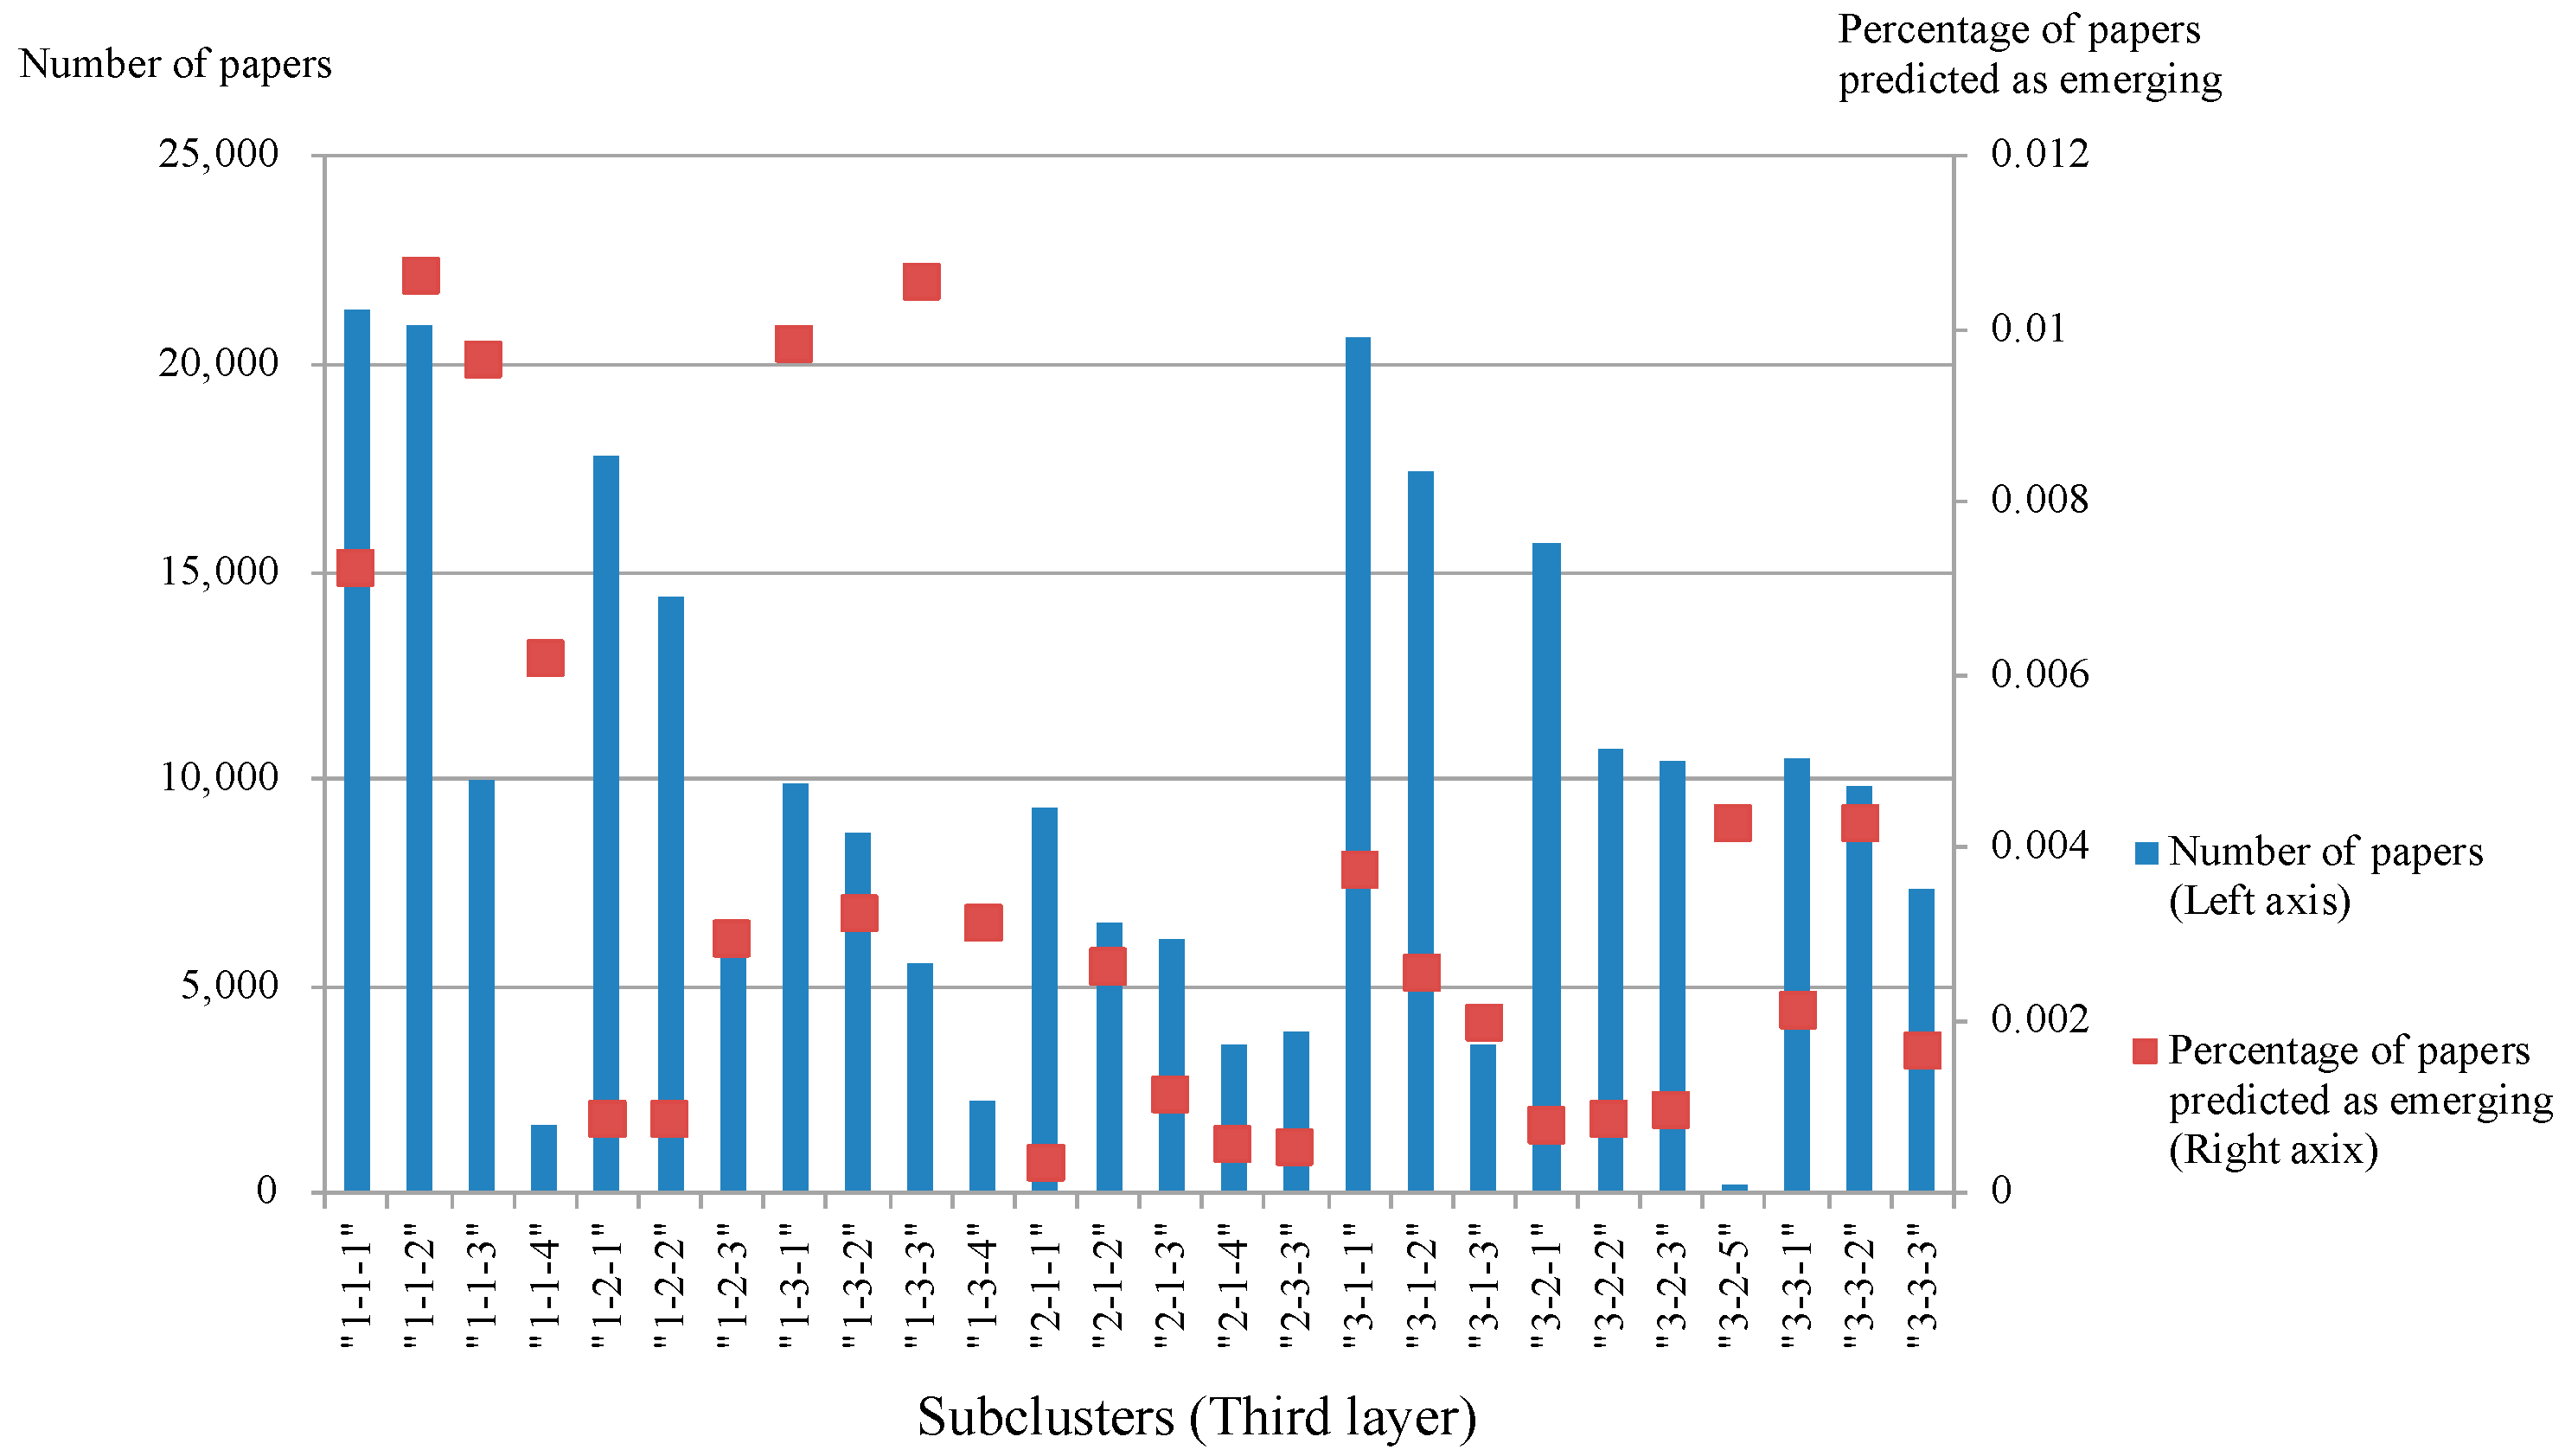
4.1. Result of the Network Model

After constructing a citation network based on direct citations, 379,044 papers belonged to the largest connected component. The features listed in Table 2 were calculated for all papers belonging to the largest connected component. The negative cases were randomly selected from the papers published in the same year in which the citation number increase was within the bottom 50%. Random sampling was conducted eight times. In other words, eight models were constructed in each experiment, and the averages of these values were evaluated. The evaluation results are listed in Table 3.
Table 4 lists the features with high predictive contributions for the model constructed for each year. Table 5 lists the numbers of citations for the top 10 papers published in 2014, three years after 2011. Of the 10 predicted papers, nine papers satisfied the conditions of emerging papers in 2014. In other words, 90% of the 10 papers listed in Table 5 were in the top 5% in terms of citation increases in 2014. These papers were sorted by calculated probabilities the predicted paper will be an emerging paper.

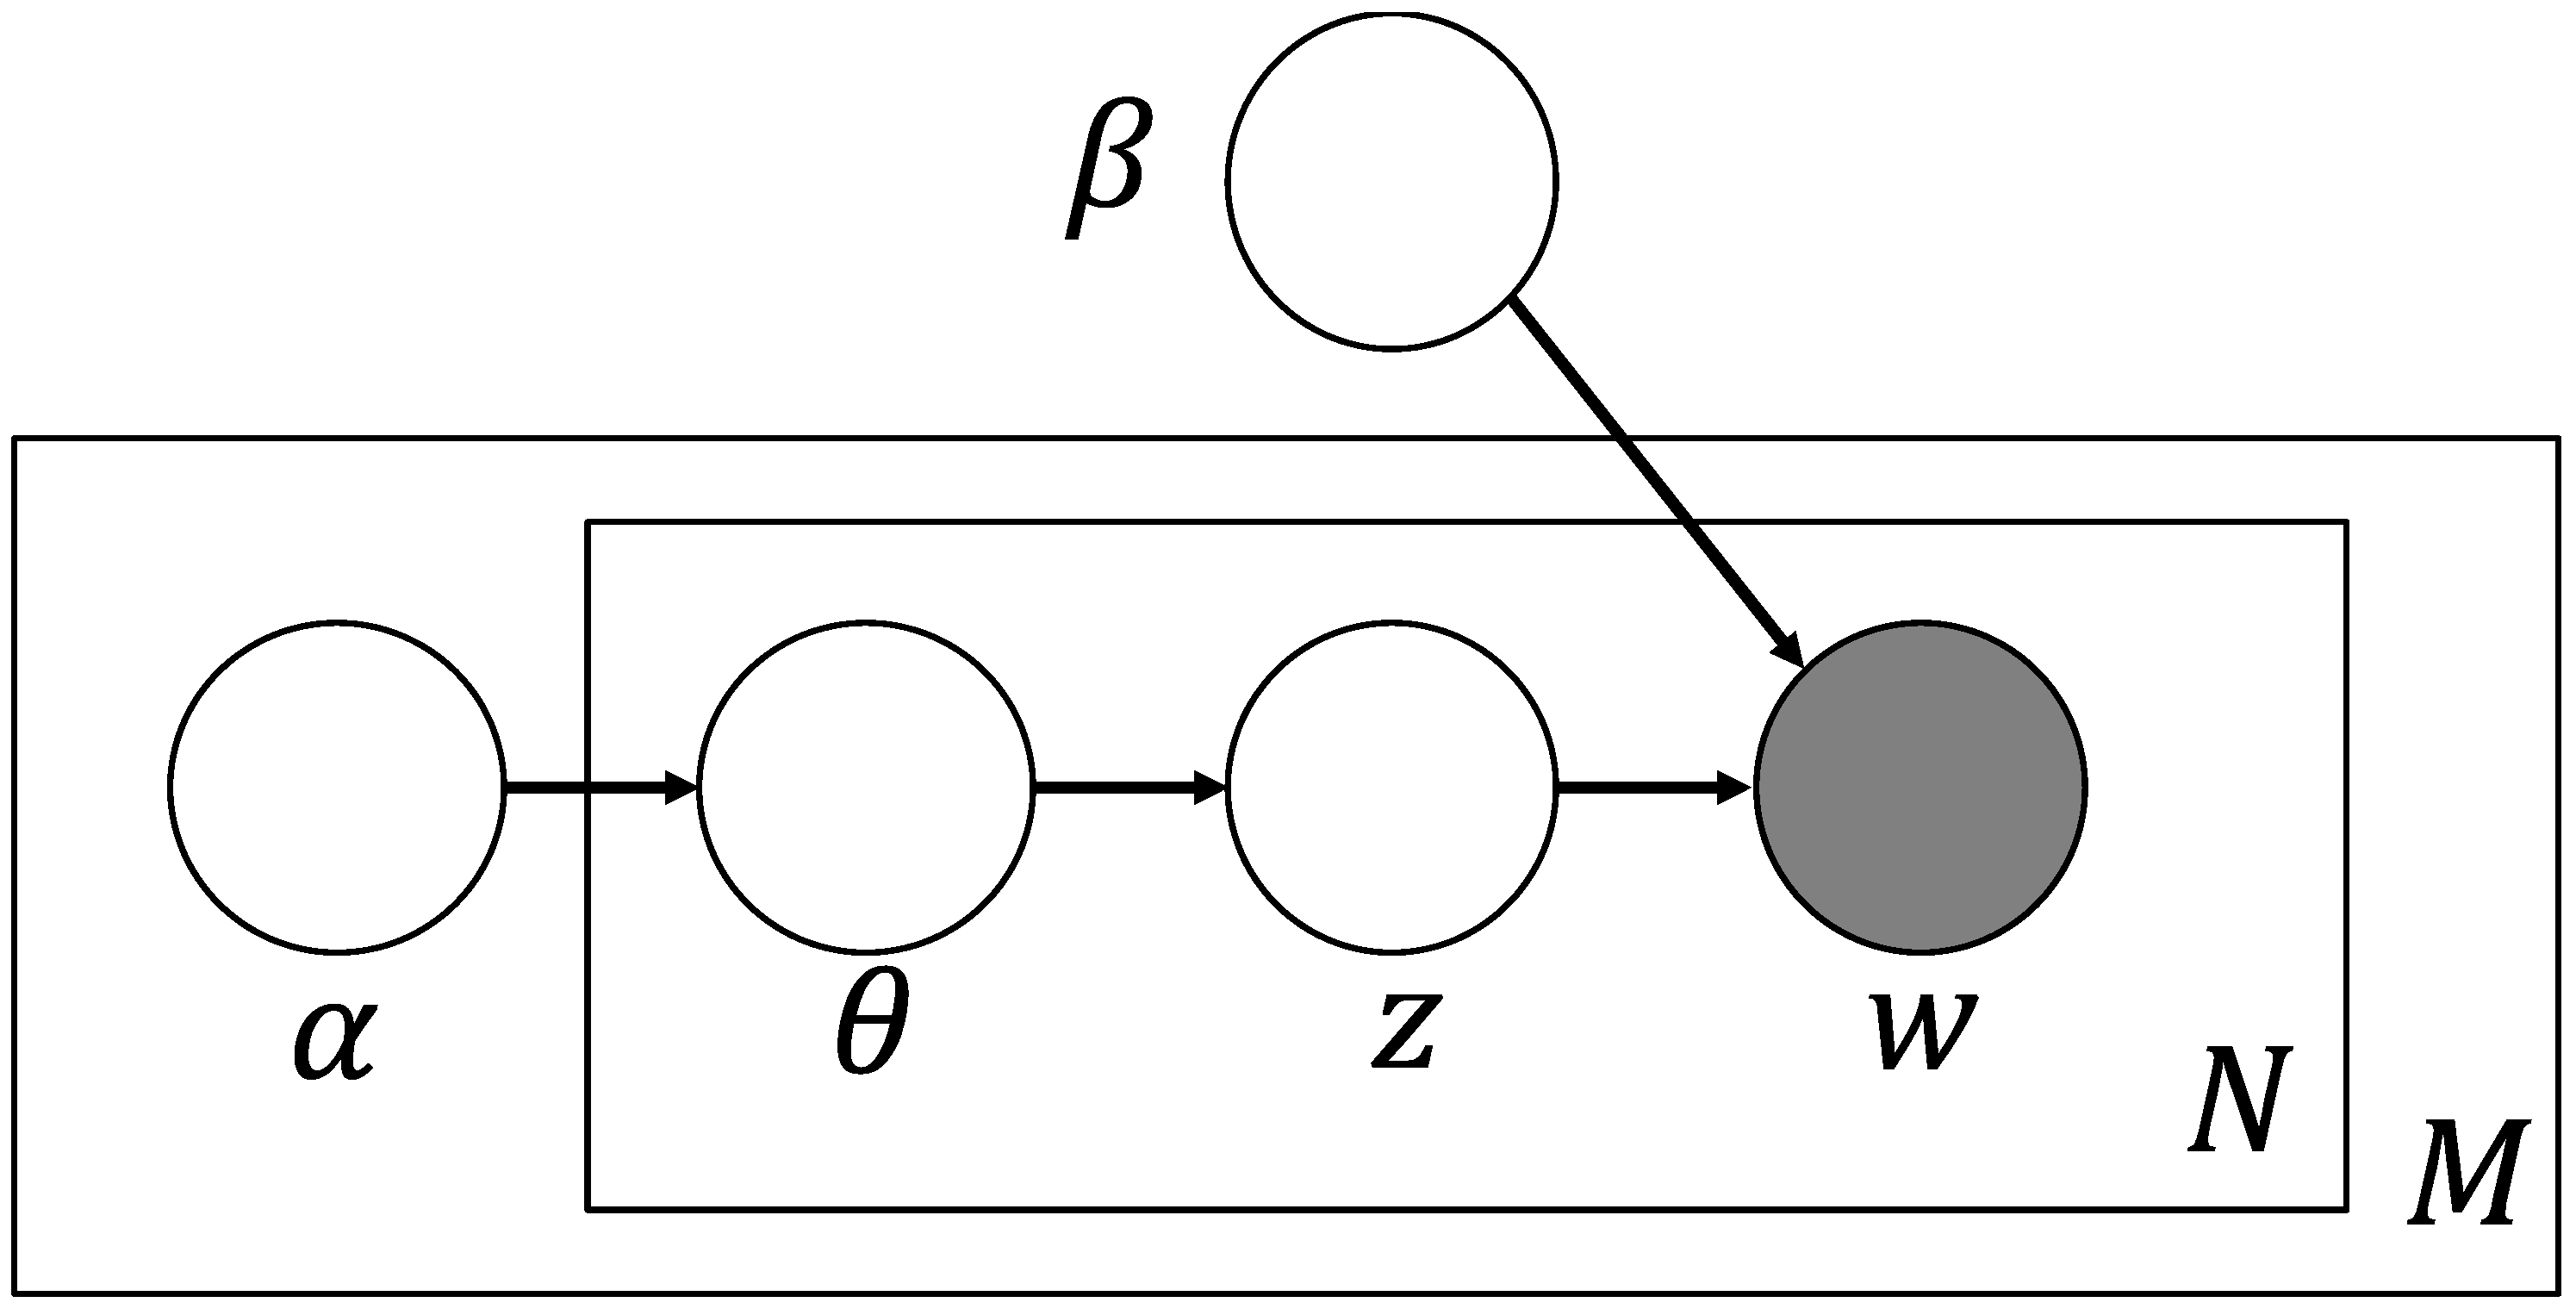
4.2. Result of Topic Model

Figure 5 shows the results of the aggregation by clustering up the third layer for the top 1000 papers as the emerging score. Note that the first and second layers targeted only the upper three clusters, while the third layer targeted all the clusters. This figure shows that papers with the highest degrees of emergence in the cluster unit are concentrated in subcluster 1-3-3. This report focuses on subcluster 1-3-3, which has a small number of papers.
The results of the topic model by LDA analysis for the emerging papers in subcluster 1-3-3 are shown in Figure 6. Figure 6 provides an overview of the topic classification in subcluster 1-3-3. The image on the right shows the frequency distribution of the top 20 prominent terms extracted from the abstracts of papers belonging to subcluster 1-3-3. The chart on the left is a visualization of the principal component analysis obtained by classifying subcluster 1-3-3 into eight topics. In this figure light blue represents the frequencies of terms corresponding to the highlighted topic, and red represents the estimated frequencies of those corresponding to unhighlighted topics. In this figure, some attention is paid to terms with high estimated frequencies such as “electronic,” “armchair,” “band,” “zigzag,” “gap,” and so on that are conspicuous. These considerations are addressed in greater detail in the discussion section.

5. Discussion

In this study, the model was applied to the nanocarbon field to predict whether a novel paper would be published three years later. Nine out of the top ten predicted papers published in 2011 were confirmed to be emerging papers by definition. The F1 measure remained stable at around 0.8 throughout the year, and the model was believed to be built with a balance between precision and recall. Table 4 indicates that the feature having the highest contribution in each case is the page rank (CNT PAGER). Page ranking is a proposed method for evaluating the importance of web pages based on citation relationships, although it was used to evaluate scientific papers in this study. This characteristic can be interpreted as an index that increases when a paper with several citations is cited. Simultaneously, this indicator decreases the relative importance of papers with citations between local communities, such as cross-references. In this study, from the perspective of calculation cost, the feature, centrality, etc., are calculated with the quotation-related network as an undirected network. Strictly speaking, it is the sum of the number of citing papers and cited papers. However, the number of citing papers in the year of publication is extremely small and it can be considered that most citations are based on the number of cited papers. The next important feature is the centrality degree (CNT DEGRE). This means that the more papers an article cites, the more likely it is to be ranked at the top of the list. The centrality degree is a characteristic feature. Based on the fact that these two features are higher, the papers that are to be expected to earn citation counts in the future (i.e., the emerging papers mentioned in this report) are those that have been appropriately researched in the subject field.
The top 10 papers predicted to be emerging will be discussed here. Zhang et al. [60] focused on the mass production of CNTs. Initially, the arc discharge and laser evaporation methods were used for this purpose. The arc discharge method can produce high-quality CNTs with few defects; however, it cannot produce large quantities of them. Although laser evaporation can produce CNTs with relatively high purity, it is also considered to be unsuitable as an industrial manufacturing technique [64]. Against this background, CVD, which is said to be suitable for mass synthesis, has attracted attention. Based on proposals made by Professor Endo of Shinshu University, such as those entitled, “Carbon multiwall nanotubes” and “CoMoCATProcess at SWeNT” by the University of Oklahoma, several manufacturing technologies have been pioneered and are already being employed for practical purposes. Zhang et al. [60] comprehensively introduced and discussed research on not only CVD but also CNT mass production. Zhang et al. received 84 citations in three years, which demonstrates that the paper is drawing attention.
The article [61] ranked second in Table 5 is a review article on the current situation and physical properties of oriented CNTs and their application areas. Among the CNT production technologies, CVD is also expected to provide a high orientation. Diverse application areas, such as light emission, optical antenna, subwavelength light transmission, and PV power generation with nanocoaxial structure, are expected for such aligned CNTs [61]. Although this paper did not satisfy the conditions for the emerging papers in the definition of this study, a certain number of citations was obtained.
The paper ranked third focuses on mass production techniques for the three-dimensional assembly of CNTs and graphene [62]. For studies related to three-dimensional networks of CNTs and graphene, see Dasgupta et al. [70]. Research on porous films with three-dimensional structures is still in the initial stage, and a material that contributes to the practical application from hereon is necessary [70]. Graphene is a single atomic plane of graphite crystal. In 2004, Novoselov et al. succeeded in extracting a thin piece of graphene by peeling off the surface of highly oriented anhydrous graphite with adhesive tape and then further peeling off the peeled surface. Since this report was published, the electrical, electronic, mechanical, and scientific properties of graphene have become clear [71].
In particular, the high electron mobility in graphene has been clarified, where electron mobility is a measure of the speed of electrons in a solid. The paper ranked fourth is a review article that focuses on the high electron mobility of graphene and discusses its electrical properties and applications [63]. A theoretical value of 2,000,000 cm2/Vs was predicted [64], and an experimental value of 200,000 cm2/Vs was obtained [72]. Considering that the electron mobility in silicon is 1000 cm2/Vs, the electron mobility of graphene is more than 100 times than in silicon. High electron mobility is an important factor to achieve high-speed transistors, for example. The paper ranked fourth was confirmed to have received 664 citations in 2014.
The paper ranked fifth is a comprehensive discussion of the physical properties of graphene. Graphene has a high electron mobility, high thermal stability, and excellent strength. In addition, this paper comprehensively describes the graphene-based applications in field-effect transistors, memory, solar devices, and sensing platforms. This paper had 587 citations in 2014.
The sixth article in Table 5 focuses on the methods of structural analysis of nanomaterials. Raman spectroscopy is one of the most effective methods for this purpose. In particular, the Raman spectra of carbon materials shows the G-band peaks derived from graphite structures and the D-band peaks derived from the defects. The ratios of these peaks can be used to evaluate the crystalline purity and defect concentration of nanocarbon materials. This is a review paper focusing on Raman spectroscopy in CNTs and graphene while summarizing related studies.
The paper ranked seventh in Table 5 is a review that comprehensively summarizes the prior literature related to the reaction principle of methane catalytic decomposition, the shape of the resulting nanocarbon material, and the formation principle. It is possible to produce hydrogen and carbon using steam reforming methane and a catalyst in a high-temperature section. The hydrogen produced can be used as fuel for fuel cells and has been attracting attention mainly as a means of producing hydrogen. In contrast, because the generated carbon can also be used in direct carbon fuel cells, it is one of the methods attracting attention from the perspective of nanocarbon material production.
CNTs are said to be toxic to humans because of their structural similarity to asbestos. Hence, toxicity reduction in other nanocarbons is a popular research topic for the use of nanocarbon materials. This paper [67], ranked eighth in Table 5, is an attempt to provide systematic knowledge in this field, called nanotoxicology. The authors also identified specific challenges for achieving low toxicity. The paper discusses techniques that lead to the biological and toxicological transformation of carbon nanomaterials through chemical changes.
The paper by Singh et al. [68] is an exhaustive summary of the history of graphene and its properties, means of production, and impacts on applications in various fields. This includes: electrical devices; optronics devices; scientific sensor nanocomposites; energy storage. As of 2014, there were 506 citations.
The paper ranked tenth is entitled “Carbonaceous nanomaterials for enhancement of TiO2 photocatalysis” [69]. Titanium oxide (TiO2) is generally used as a photocatalyst material. However, problems have been noted due to its efficiency and narrow response range. The properties can be changed considerably by combining TiO2 with nanocarbon materials. As a paper on photocatalysis using nanocarbon-TiO2, this paper presents guidelines on generation methods, features, and future directions. As of 2014, the paper had 232 citations.
Figure 6 shows that “electronic,” “band,” “zigzag,” “gap,” “armchair,” etc., stand out when focusing on terms with high estimated frequencies. It is known that the structure of a single-wall CNT (SWCNT) has varying conductivity that depends on the degree of the helix (i.e., chirality). For example, a zigzag-type structure has the characteristics of being one-third metal and two-thirds semiconductor. Meanwhile, a chiral-type structure has the characteristics of a semiconductor and an armchair-type structure has the characteristics of a metal. In 2010, they had problems synthesizing chemicals; however, in October 2011, they succeeded in synthesizing chiral and armchair forms. The remaining zigzag CNTs were also presented in a paper by Hitosugi et al. [73] in the Journal of the American Chemical Society, entitled “Bottom-up synthesis and thread-in-bead structures of finite (n,0)-zigzag SWCNTs.” Thus, around 2011, chemical syntheses of chiral, armchair, and zigzag single-phase CNTs were increasing. The terms “armchair,” “zigzag,” “gap,” and “band,” in Figure 6 exhibit the expected tendencies. Hitosugi et al. [74] also published a paper in 2011 related to Hitosugi et al. [73]. In fact, the number of citations reached 44 after three years, and the paper satisfies the definition of an emerging paper in this model. However, the emerging score was ranked at 11,932. This means that the article could not be identified only by the emerging prediction model focusing on the number of papers. Accordingly, it can be considered effective to a certain extent to specify research fields that will become popular in the future based on the granularity of emerging research in units of not only papers but also terms.
The validity of the proposed method was tested in the field of nanocarbons in this study. We found that papers falling into the emerging research areas obtained by a combination of network analysis and topic models were not necessarily at the top of the predictive rankings obtained by network analysis alone. In other words, the paper-by-paper method for predicting emerging research was inadequate to capture the trends in quantitative fields. In this study, the dataset on nanocarbons was extracted from Web of Science (WoS) as a case study, but the dataset on other fields can be applied as it is. An important aspect of this is the need to confirm the accuracy of the predictions of emerging papers obtained from the citation network analysis. In particular, it is important to ensure that the accuracy is stable even if we change the time window. As a preliminary experiment, we confirmed that the F1 measure was more than 70% accurate for several different regions, although the accuracy varied. Therefore, we demonstrated that the validity of our method is not specific to the nanocarbon field. The applicability of the method to various fields, which identify issues of interest in terms of quality and quantity, both in terms of papers and topics, may help companies and countries that are sensitive to science and technology trends make decisions. For example, this method may be useful for companies to consider the future direction of their areas of strength. By analyzing several related areas (e.g., any subdiscipline related to the material area), the country can obtain papers and topics that will contribute to the development of national innovation policies.

6. Conclusions

This study applied a model that predicts promising papers based on the vast amount of information on 411,084 scientific papers in the nanocarbon field. The purpose of this research was to predict the increase in the number of citations of a paper three years after its publication, based only on information available less than one year after its publication, in order to identify emerging areas earlier. Unlike the existing research, this investigation involved the use of various features, network indicators, and clustering results to predict the increase in the number of citations of a paper several years in advance based on the features immediately after its publication. The features used in the prediction model mainly fall into four categories (network, cluster, centrality, and citation relationship features), and all of them can be constructed by observing a network. This investigation attempted to identify emerging research areas based on not only the micro (i.e., papers) but also the semimacro perspectives (i.e., research fields). This was achieved by employing the topic model while focusing on the terms used in the papers in the cluster with a high percentage of emerging papers, after identifying the emerging papers by using the aforementioned network indices. The predictive model of emerging papers itself achieved a certain level of accuracy in both the nanocarbon field and the PV power generation field, and a highly useful model was developed. The feature with the highest degree of contributions was the page rank. This means that the number of citations of a paper is likely to increase if it is cited in a paper that has a large number of citations. In addition, the contribution of the proximity centrality means that the papers are close to many papers; hence, they are the focal papers in the field. These findings demonstrate that emerging papers are those that have been thoroughly researched in the field and address issues that are evaluated by the community. The capabilities of the authors can be considered to be among the indices to quantify. By examining the characteristic terms of subclusters with high proportions of emerging papers expected, it was possible to focus on research on the chemical synthesis of zigzag SWCNTs in the nanocarbon field. The emerging fields were successfully examined, not in units of papers, but rather as research areas.
The limitations of this study along with future research need to be addressed. This study defined emerging papers as papers that have been cited the most—within the top 5%—three years after publication. However, the interpretation of citation counts depends on the field and training period. This can be rephrased depending on the process of formation of knowledge in scientific fields. Therefore, the robustness of the model against variations in these parameters is assumed to vary from field to field. Similarly, challenges remain regarding robustness in databases. In this study, the SCI and SSCI indexes in Web of Science (WoS) were used as the database. Until the creation of Scopus and Google Scholar in 2004, WoS had been the sole tool for citation analysis [75]. Even today, WoS is still one of the most effective databases in the historical field, as it is known to have a longer recording period than Scopus. However, both WoS and Scopus are now known as leading databases, and the robustness of the method remains to be evaluated in a future study.
Only the top 5% of papers is considered as a sprout and the number of positive examples is small; this will have an impact on the limit of prediction performance because there are few patterns to train. In the future, the application of this method to multiple fields is being examined and it is necessary to discuss robustness against parameters and appropriate parameter settings. It is necessary to devise a unique interpretation of a subcluster in which a group of papers expected to be sprouting papers is concentrated. From the relevant terms extracted, certain domain knowledge is essential to imagine what type of field it is. It is necessary to devise and enable a semantic interpretation using multiple terms. In the future, more sophisticated and stable models will be developed that can contribute to policy formulation and future trends in multiple fields.
As the amount of information increases and the structure of knowledge becomes more complex in the future, it will become extremely difficult for companies to make R&D investment decisions and for the government to make decisions regarding resource allocation for science and technology policy. The outlook for trends in science and technology should be developed independently. The role of predictive models such as those investigated in this study can facilitate decision-making. It is considered that the methods supporting the extraction of future useful papers based on enormous amounts of information will increase in the future.

Author Contributions

H.S. designed conceptualization, data curation, formal analysis, investigation, methodology, software, validation, visualization, resources, writing original draft and writing—review and editing. B.F. and I.S. provided supervision and project administration. All authors have read and agreed to the published version of the manuscript.

Funding

This work was supported by JSPS KAKENHI [Grant Number 20K01821].

Conflicts of Interest

The authors declare no conflict of interest.

References

  1. Beretta, R. A critical review of the Delphi technique. Nurse Res. 1996, 3, 79–89. [Google Scholar] [CrossRef] [PubMed]
  2. Kajikawa, Y.; Yoshikawa, J.; Takeda, Y.; Matsushima, K. Tracking emerging technologies in energy research: Toward a roadmap for sustainable energy. Technol. Forecast. Soc. Chang. 2008, 75, 771–782. [Google Scholar] [CrossRef]
  3. Martín-Martín, A.; Orduna-Malea, E.; Ayllón, J.M.; López-Cózar, E.D. Un panorama académico de dos caras: Retrato de los documentos altamente citados en google scholar (1950–2013). Rev. Esp. Doc. Cient. 2016, 39, e149. [Google Scholar] [CrossRef]
  4. Hashimoto, M.; Sakata, I.; Kajikawa, Y.; Takeda, Y.; Matsushima, K. Academic landscape of innovation research and innovation policy by network science. Hitotsubashi Bus. Rev. 2009, 56, 194–211. [Google Scholar] [CrossRef]
  5. Takeda, Y.; Kajikawa, Y. Optics: A bibliometric approach to detect emerging research domains and intellectual bases. Scientometrics 2009, 78, 543–558. [Google Scholar] [CrossRef]
  6. Börner, K.; Chen, C.; Boyack, K.W. Visualizing knowledge domains. Annu. Rev. Inf. Sci. Technol. 2003, 37, 179–255. [Google Scholar] [CrossRef]
  7. Kostoff, R.N.; Toothman, D.R.; Eberhart, H.J.; Humenik, J.A. Text mining using database tomography and bibliometrics: A review. Technol. Forecast. Soc. Chang. 2001, 68, 223–253. [Google Scholar] [CrossRef]
  8. Boyack, K.W.; Wylie, B.N.; Davidson, G.S. Domain visualization using VxInsight® for science and technology management. J. Am. Soc. Inf. Sci. Technol. 2002, 53, 764–774. [Google Scholar] [CrossRef]
  9. Chen, C.; Cribbin, T.; Macredie, R.; Morar, S. Visualizing and tracking the growth of competing paradigms: Two case studies. J. Am. Soc. Inf. Sci. Technol. 2002, 53, 678–689. [Google Scholar] [CrossRef] [Green Version]
  10. Small, H. Tracking and predicting growth areas in science. Scientometrics 2006, 68, 595–610. [Google Scholar] [CrossRef] [Green Version]
  11. Shibata, N.; Kajikawa, Y.; Takeda, Y.; Matsushima, K. Detecting emerging research fronts based on topological measures in citation networks of scientific publications. Technovation 2008, 28, 758–775. [Google Scholar] [CrossRef]
  12. Glänzel, W. Bibliometric methods for detecting and analysing emerging research topics. Prof. Inf. 2012, 21, 194–201. [Google Scholar] [CrossRef]
  13. Winnink, J.J.; Tijssen, R.J.W. Early stage identification of breakthroughs at the interface of science and technology: Lessons drawn from a landmark publication. Scientometrics 2015, 102, 113–134. [Google Scholar] [CrossRef]
  14. Kleinberg, J. Bursty and hierarchical structure in streams. Data Min. Knowl. Disc. 2003, 7, 373–397. [Google Scholar] [CrossRef]
  15. Bauhofer, W.; Kovacs, J.Z. A review and analysis of electrical percolation in carbon nanotube polymer composites. Compos. Sci. Technol. 2009, 69, 1486–1498. [Google Scholar] [CrossRef]
  16. Kumar, M.; Ando, Y. Chemical vapor deposition of carbon nanotubes: A review on growth mechanism and mass production. J. Nanosci. Nanotechnol. 2010, 10, 3739–3758. [Google Scholar] [CrossRef] [Green Version]
  17. Liu, X.M.; Huang, Z.D.; Oh, S.W.; Zhang, B.; Ma, P.C.; Yuen, M.M.F.; Kim, J.K. Carbon nanotube (CNT)-based composites as electrode material for rechargeable Li-ion batteries: A review. Compos. Sci. Technol. 2012, 72, 121–144. [Google Scholar] [CrossRef]
  18. Tomczak, S.K.; Staszkiewicz, P. Cross-Country Application of Manufacturing Failure Models. J. Risk Financ. Manag. 2020, 13, 34. [Google Scholar] [CrossRef] [Green Version]
  19. Staszkiewicz, P. The application of citation count regression to identify important papers in the literature on non-audit fees. Manag. Audit. J. 2019, 34, 96–115. [Google Scholar] [CrossRef]
  20. Staszkiewicz, P. Search for Measure of the Value of Baltic Sustainability Development: A Meta-Review. Sustainability 2019, 11, 6640. [Google Scholar] [CrossRef] [Green Version]
  21. Watts, R.J.; Porter, A.L. R&D cluster quality measures and technology maturity. Technol. Forecast. Soc. Chang. 2003, 70, 735–758. [Google Scholar] [CrossRef]
  22. Guo, H.; Weingart, S.; Börner, K. Mixed-indicators model for identifying emerging research areas. Scientometrics 2011, 89, 421–435. [Google Scholar] [CrossRef]
  23. Dong, Y.; Johnson, R.A.; Chawla, N.V. Will this paper increase your h-index? Scientific impact prediction. In Proceedings of the Eighth ACM International Conference on Web Search and Data Mining—WSDM’15, Shanghai, China, 2–6 February 2015; ACM: New York, NY, USA; pp. 149–158. [Google Scholar]
  24. Chakraborty, T.; Kumar, S.; Goyal, P.; Ganguly, N.; Mukherjee, A. Towards a stratified learning approach to predict future citation counts. In Proceedings of the 14th ACM/IEEE-CS Joint Conference on Digital Libraries, London, UK, 8–12 September 2014; IEEE: London, UK; pp. 351–360. [Google Scholar]
  25. Wang, D.; Song, C.; Barabási, A.-L. Quantifying long-term scientific impact. Science 2013, 342, 127–132. [Google Scholar] [CrossRef] [PubMed] [Green Version]
  26. Adams, J. Early citation counts correlate with accumulated impact. Scientometrics 2005, 63, 567–581. [Google Scholar] [CrossRef]
  27. Li, L.; Tong, H. The child is father of the man: Foresee the success at the early stage. In Proceedings of the 21th ACM SIGKDD International Conference on Knowledge Discovery and Data Mining—KDD’15, Sydney, Australia, 10–13 August 2015; ACM: New York, NY, USA; pp. 655–664. [Google Scholar]
  28. Boyack, K.W.; Klavans, R.; Small, H.; Ungar, L. Characterizing the emergence of two nanotechnology topics using a contemporaneous global micro-model of science. J. Eng. Technol. Manag. 2014, 32, 147–159. [Google Scholar] [CrossRef]
  29. Kuusi, O.; Meyer, M. Anticipating technological breakthroughs: Using bibliographic coupling to explore the nanotubes paradigm. Scientometrics 2007, 70, 759–777. [Google Scholar] [CrossRef]
  30. Garfield, E.; Sher, I.H.; Torpie, R.J. The Use of Citation Data in Writing the History of Science; Institute for Scientific Information Inc.: Philadelphia, PA, USA, 1964. [Google Scholar]
  31. Scharnhorst, A.; Garfield, E. Tracing scientific influence. arXiv 2010, arXiv:1010.3525. [Google Scholar]
  32. Davletov, F.; Aydin, A.S.; Cakmak, A. High impact academic paper prediction using temporal and topological features. In Proceedings of the 23rd ACM International Conference on Conference on Information and Knowledge Management—CIKM’14, Shanghai, China, 3–7 November 2014; ACM: New York, NY, USA; pp. 491–498. [Google Scholar]
  33. Arxiv. arxiv.org, March. 2020. Available online: http://arxiv.org (accessed on 1 September 2020).
  34. Mori, J.; Sakaki, T.; Kajikawa, Y.; Sakata, I. Predicting citations to detect emerging technologies using academic papers. In Proceedings of the 28th Annual Conference of the Japanese Society for Artificial Intelligence, Ehime, Japan, 12–15 May 2014. [Google Scholar]
  35. Sasaki, H.; Hara, T.; Sakata, I. Identifying emerging research related to solar cells field using a machine leaning approach. J. Sustain. Dev. Energy Water Environ. Syst. 2016, 4, 418–429. [Google Scholar] [CrossRef] [Green Version]
  36. Chen, C.; Chen, Y.; Horowitz, M.; Hou, H.; Liu, Z.; Pellegrino, D. Towards an explanatory and computational theory of scientific discovery. J. Informetr. 2009, 3, 191–209. [Google Scholar] [CrossRef] [Green Version]
  37. Yau, C.K.; Porter, A.; Newman, N.; Suominen, A. Clustering scientific documents with topic modeling. Scientometrics 2014, 100, 767–786. [Google Scholar] [CrossRef]
  38. He, Q.; Chen, B.; Pei, J.; Qiu, B.; Mitra, P.; Giles, L. Detecting topic evolution in scientific literature: How can citations help? In Proceedings of the 18th ACM Conference on Information and Knowledge Management—CIKM’09, Hong Kong, China, 2–6 November 2009; ACM: New York, NY, USA; pp. 957–966. [Google Scholar]
  39. Liu, X.; Zhang, J.; Guo, C. Full-text citation analysis: Enhancing bibliometric and scientific publication ranking. In Proceedings of the 21st ACM International Conference on Information and Knowledge Management—CIKM’12, Maui, HI, USA, 29 October–2 November 2012; ACM: New York, NY, USA; pp. 1975–1979. [Google Scholar]
  40. Jiang, H.; Qiang, M.; Lin, P. A topic modeling based bibliometric exploration of hydropower research. Renew. Sustain. Energy Rev. 2016, 57, 226–237. [Google Scholar] [CrossRef]
  41. Newman, M.E.J. Modularity and community structure in networks. Proc. Natl. Acad. Sci. USA 2006, 103, 8577–8582. [Google Scholar] [CrossRef] [Green Version]
  42. Newman, M.E.J.; Girvan, M. Finding and evaluating community structure in networks. Phys. Rev. E 2004, 69, 026113. [Google Scholar] [CrossRef] [PubMed] [Green Version]
  43. Freeman, L.C. Centrality in social networks conceptual clarification. Soc. Netw. 1978, 1, 215–239. [Google Scholar] [CrossRef] [Green Version]
  44. Bonacich, P. Technique for analyzing overlapping memberships. Sociol. Methodol. 1972, 4, 176. [Google Scholar] [CrossRef]
  45. Burt, R.S. Structural holes and good ideas. Am. J. Sociol. 2004, 110, 349–399. [Google Scholar] [CrossRef]
  46. Watts, D.J.; Strogatz, S.H. Collective dynamics of ‘small-world’ networks. Nature 1998, 393, 440–442. [Google Scholar] [CrossRef]
  47. Brin, S.; Page, L. The anatomy of a large-scale hypertextual web search engine. Comput. Netw. ISDN Syst. 1998, 30, 107–117. [Google Scholar] [CrossRef]
  48. Guimerà, R.; Amaral, L.A.N. Functional cartography of complex metabolic networks. Nature 2005, 433, 895–900. [Google Scholar] [CrossRef] [Green Version]
  49. Blei, D.M.; Ng, A.Y.; Jordan, M.I. Latent dirichlet allocation. J. Mach. Learn. Res. 2003, 3, 993–1022. [Google Scholar] [CrossRef] [Green Version]
  50. Sievert, C.; Shirley, K. LDAvis: A method for visualizing and interpreting topics. In Proceedings of the Workshop on Interactive Language Learning, Visualization, and Interfaces, Baltimore, MD, USA, 27 June 2014; Association for Computational Linguistics: Baltimore, MD, USA; pp. 63–70. [Google Scholar]
  51. Deveaud, R.; SanJuan, E.; Bellot, P. Accurate and effective latent concept modeling for ad hoc information retrieval. Doc. Numér. 2014, 17, 61–84. [Google Scholar] [CrossRef] [Green Version]
  52. D’Souza, F.; Ito, O. Photosensitized electron transfer processes of nanocarbons applicable to solar cells. Chem. Soc. Rev. 2012, 41, 86–96. [Google Scholar] [CrossRef] [PubMed]
  53. Burke, A. R&D considerations for the performance and application of electrochemical capacitors. Electrochim. Acta 2007, 53, 1083–1091. [Google Scholar] [CrossRef]
  54. Suzuki, K.; Yamaguchi, M.; Kumagai, M.; Yanagida, S. Application of carbon nanotubes to counter electrodes of dye-sensitized solar cells. Chem. Lett. 2002, 32, 28–29. [Google Scholar] [CrossRef]
  55. Kasavajjula, U.; Wang, C.; Appleby, A.J. Nano- and bulk-silicon-based insertion anodes for lithium-ion secondary cells. J. Power Sources 2007, 163, 1003–1039. [Google Scholar] [CrossRef]
  56. Liu, C.; Li, F.; Ma, L.P.; Cheng, H.M. Advanced materials for energy storage. Adv. Mater. 2010, 22, E28–E62. [Google Scholar] [CrossRef]
  57. Edwards, B.C. Design and deployment of a space elevator. Acta Astronaut. 2000, 47, 735–744. [Google Scholar] [CrossRef]
  58. Pugno, N.M. On the strength of the carbon nanotube-based space elevator cable: From nanomechanics to megamechanics. J. Phys. Condens. Matter 2006, 18, S1971–S1990. [Google Scholar] [CrossRef]
  59. Pugno, N. The role of defects in the design of space elevator cable: From nanotube to megatube. Acta Mater. 2007, 55, 5269–5279. [Google Scholar] [CrossRef]
  60. Zhang, Q.; Huang, J.Q.; Zhao, M.Q.; Qian, W.Z.; Wei, F. Carbon nanotube mass production: Principles and processes. ChemSusChem 2011, 4, 864–889. [Google Scholar] [CrossRef]
  61. Lan, Y.; Wang, Y.; Ren, Z.F. Physics and applications of aligned carbon nanotubes. Adv. Phys. 2011, 60, 553–678. [Google Scholar] [CrossRef]
  62. Lee, S.H.; Lee, D.H.; Lee, W.J.; Kim, S.O. Tailored assembly of carbon nanotubes and graphene. Adv. Funct. Mater. 2011, 21, 1338–1354. [Google Scholar] [CrossRef]
  63. Sarma, S.D.; Adam, S.; Hwang, E.H.; Rossi, E. Electronic transport in two-dimensional graphene. Rev. Mod. Phys. 2011, 83, 407–470. [Google Scholar] [CrossRef] [Green Version]
  64. Hwang, E.H.; Adam, S.; Sarma, S.D. Carrier transport in two-dimensional graphene layers. Phys. Rev. Lett. 2007, 98, 186806. [Google Scholar] [CrossRef] [Green Version]
  65. Saito, R.; Hofmann, M.; Dresselhaus, G.; Jorio, A.; Dresselhaus, M.S. Raman spectroscopy of graphene and carbon nanotubes. Adv. Phys. 2011, 60, 413–550. [Google Scholar] [CrossRef]
  66. Li, Y.; Li, D.; Wang, G. Methane decomposition to COx-free hydrogen and nano-carbon material on group 8–10 base metal catalysts: A review. Catal. Today 2011, 162, 1–48. [Google Scholar] [CrossRef]
  67. Yan, L.; Zhao, F.; Li, S.; Hu, Z.; Zhao, Y. Low-toxic and safe nanomaterials by surface-chemical design, carbon nanotubes, fullerenes, metallofullerenes, and graphenes. Nanoscale 2011, 3, 362–382. [Google Scholar] [CrossRef]
  68. Singh, V.; Joung, D.; Zhai, L.; Das, S.; Khondaker, S.I.; Seal, S. Graphene based materials: Past, present and future. Prog. Mater. Sci. 2011, 56, 1178–1271. [Google Scholar] [CrossRef]
  69. Leary, R.; Westwood, A. Carbonaceous nanomaterials for the enhancement of TiO2 photocatalysis. Carbon 2011, 49, 741–772. [Google Scholar] [CrossRef]
  70. Dasgupta, A.; Rajukumar, L.P.; Rotella, C.; Lei, Y.; Terrones, M. Covalent three-dimensional networks of graphene and carbon nanotubes: Synthesis and environmental applications. Nano Today 2017, 12, 116–135. [Google Scholar] [CrossRef]
  71. Novoselov, K.S.; Geim, A.K.; Morozov, S.V.; Jiang, D.; Zhang, Y.; Dubonos, S.V.; Grigorieva, I.V.; Firsov, A.A. Electric field effect in atomically thin carbon films. Science 2004, 306, 666–669. [Google Scholar] [CrossRef] [Green Version]
  72. Bolotin, K.I.; Sikes, K.J.; Jiang, Z.; Klima, M.; Fudenberg, G.; Hone, J.; Kim, P.; Stormer, H.L. Ultrahigh electron mobility in suspended graphene. Solid State Commun. 2008, 146, 351–355. [Google Scholar] [CrossRef] [Green Version]
  73. Hitosugi, S.; Yamasaki, T.; Isobe, H. Bottom-up synthesis and thread-in-bead structures of finite (n,0)-zigzag single-wall carbon nanotubes. J. Am. Chem. Soc. 2012, 134, 12442–12445. [Google Scholar] [CrossRef] [PubMed]
  74. Hitosugi, S.; Nakanishi, W.; Yamasaki, T.; Isobe, H. Bottom-up synthesis of finite models of helical (n,m)-single-wall carbon nanotubes. Nat. Commun. 2011, 2, 492. [Google Scholar] [CrossRef]
  75. Mongeon, P.; Paul-Hus, A. The journal coverage of Web of Science and Scopus: A comparative analysis. Scientometrics 2016, 106, 213–228. [Google Scholar] [CrossRef]
Figure 1. Overview of the method.
Asi 03 00040 g001
Figure 2. Model training and prediction.
Asi 03 00040 g002
Figure 3. Graphical model representation of latent dirichlet allocation (LDA) (source: Blei et al. [49]).
Asi 03 00040 g003
Figure 4. Number of publications each year (x-axis: year of publication, y-axis: number of publications).
Asi 03 00040 g004
Figure 5. Frequencies of the top 1000 emerging papers by subcluster (third layer).
Asi 03 00040 g005
Figure 6. First topic in subcluster 1-3-3.
Asi 03 00040 g006
Table 1. Features used in the emergence prediction model.
Class of FeatureName of FeatureDescription
NetworkDataset in question and feature of network in the year in question.
NW_NODESNumber of papers in a network.
NW_EDGESNumber of citation links in a network.
NW_MAXQMaximum of Q-values of clusters in a network.
ClusterFeature of the cluster to which a paper belongs.
CL_QMAXMaximum of Q-values of clusters to which a paper belongs.
CL_NODESNumber of nodes in the cluster to which a paper belongs.
CL_RANKRank of the cluster to which a paper belongs.
CentralityNetwork centrality of a paper.
CNT_DEGREDegree centrality.
CNT_BETWEBetweenness centrality.
CNT_CLOSECloseness centrality.
CNT_EIGENEigenvector centrality.
CNT_NETWONetwork constraint.
CNT_CLUSTClustering coefficient.
CNT_PAGERPage rank.
CNT_HUBSCHub score.
CNT_AUTHORAuthority score.
Property of referenceThe sum of the features of paper sets that a paper cites.
CITING_MAX-[feature]Maximum of features in questions in cited paper sets that a paper cites.
CITING_MIN-[feature]Minimum of features in questions in cited paper sets that a paper cites.
CITING_AVG-[feature]Average of features in questions in cited paper sets that a paper cites.
CITING_SUM-[feature]Sum of features in questions in cited paper sets that a paper cites.
Table 2. Combination of learning and evaluation years for each model.
Model Training Year t0Training Citation Data Confirmation Year t0 + 3Prediction Target Year t1Prediction Model Evaluation Year t1 + 3
2003200620072010
2004200720082011
2005200820092012
2006200920102013
2007201020112014
2008201120122015
Table 3. Evaluation results for each year.
Prediction   Target   Year   t 1 Model   Year   t 0 Number of Target PapersNumber of Predicted PapersF1 Measure (Average)
200620022990149567.5
200720033598177963.8
200820043990199574.3
200920054664233255.5
201020064994249786.2
201120075830291585.3
Table 4. Top five features contributing in the model for each year.
2002 Model for 20062003 Model for 20072004 Model for 2008
CNT_PAGER20.5CNT_PAGER22.3CNT_PAGER27.1
CNT_AUTHO9.4CNT_AUTHO10.3CNT_AUTHO11.2
CITING_MAX-CNT_DEGRE5.3CNT_DEGRE8.0CNT_DEGRE9.0
CNT_DEGRE5.3CITING_MAX-CNT_DEGRE5.4CNT_CLOSE5.5
CITING_SUM-CL_RANK4.2CNT_CLOSE4.3CITING_AVG-CNT_CLOSE4.5
2005 Model for 20092006 Model for 20102007 Model for 2011
CNT_PAGER23.3CNT_PAGER25.8CNT_PAGER33.1
CNT_AUTHO9.7CNT_AUTHO18.3CNT_AUTHO14.9
CNT_DEGRE6.1CNT_DEGRE8.2CNT_CLOSE9.3
CITING_SUM-CL_RANK3.6CNT_CLOSE5.7CNT_DEGRE8.9
CITING_SUM-CL_QMAX3.5CITING_SUM-CL_RANK4.6CITING_AVG-CNT_CLOSE5.2
Table 5. Top ten papers published in 2011 that were predicted to be most likely to be emerging.
RankProb.TitleJournalNumber of Citations (2011)Number of Citations (2014)Ref.
11Carbon nanotube mass production: Principles and processesChemSusChem084Zhang et al. [60]
21Physics and applications of aligned carbon nanotubesAdvances in Physics035Lan et al. [61]
30.99Tailored assembly of carbon nanotubes and grapheneAdvanced Functional Materials682Lee et al. [62]
40.99Electronic transport in two-dimensional grapheneReviews of Modern Physics51664Sarma et al. [63]
50.99Graphene-based materials: Synthesis, characterization, properties, and applicationsSmall26587Hwang et al. [64]
60.99Raman spectroscopy of graphene and carbon nanotubesAdvances in Physics098Saito et al. [65]
70.99Methane decomposition to COx-free hydrogen and nanocarbon material on group 8–10 base metal catalysts: A reviewCatalysis Today546Li et al. [66]
80.99Low-toxic and safe nanomaterials by surface-chemical design, carbon nanotubes, fullerenes, metallofullerenes, and graphenesNanoscale567Yan et al. [67]
90.99Graphene-based materials: Past, present, and futureProgress in Materials Science7506Singh et al. [68]
100.99Carbonaceous nanomaterials for enhancement of TiO2 photocatalysisCarbon11223Leary and Westwood [69]

