Article

Determinants of Bicycle Use among Student Population: Exploratory Research of Social and Infrastructure Factors

1
Department of Architecture, Faculty of Civil Engineering, Transportation Engineering and Architecture, University of Maribor, Smetanova ulica 17, 2000 Maribor, Slovenia
2
Institute for Social Studies, Science and Research Centre Koper, Garibaldijeva ulica 1, 6000 Koper, Slovenia
3
Department of Sociology, Faculty of Arts, University of Maribor, Koroška cesta 160, 2000 Maribor, Slovenia
4
Department of Civil Engineering, Faculty of Civil Engineering, Transportation Engineering and Architecture, University of Maribor, Smetanova ulica 17, 2000 Maribor, Slovenia
*
Author to whom correspondence should be addressed.
Appl. Syst. Innov. 2020, 3(1), 6; https://doi.org/10.3390/asi3010006
Submission received: 11 December 2019 / Revised: 5 January 2020 / Accepted: 9 January 2020 / Published: 12 January 2020

Abstract

:
By exposing more benefits than shortcomings regarding cycling, this paper focuses on university students as a significant target group that could promote cycling as the main transport mode in cities. The paper addresses a variety of determinants, barriers, and motivation for cycling among the university students within the international context. Furthermore, it exposes the importance of smaller university cities, where students can present a substantial share of the total population. Contextually, we present the research upon the use of bicycles among the students in the university city of Maribor, Slovenia. To examine whether social or infrastructural determinants play a decisive role, a questionnaire was conducted among 382 students. The findings revealed that although the topography of the city and the distances between crucial institutions are, in general, favorable, only 10.7% of students cycle daily, whereby 63.3% do not cycle at all. There were no statistical differences noticed between the impact of infrastructural and social factors; convenience was exposed as a statistically significant determinant, whereas the sustainability aspect proved to be an insignificant factor for students cycling. To conclude, cycling among the student population in smaller cities can represent a common case of potentially high impact of student population regarding sustainable mobility.

1. Introduction

The general interest in cycling has grown in recent years [1,2], although its share across countries still varies significantly [3]. As one of the most important environmentally friendly means of mobility, cycling is supported by a number of institutions such as the European Cyclist Federation and by sustainable mobility policies, especially the mechanism of Sustainable Urban Mobility Plans, along with local cycling strategies and agendas supporting cycling as an alternative to motorized traffic in cities. Cycling strategies aim at improving the quality, quantity, and safety of cycling. At the same time, such agendas state multiple positive impacts related to personal mobility, such as lowering the carbon footprint of the city and thus reinforcing the principles of a sustainable lifestyle [3,4]. On the individual level, factors such as reduction of expenses, time-saving, and health benefits [2] promote cycling [1].
By exposing more benefits than shortcomings, we focus on university students as a significant target group that could use and promote cycling as the main transport mode in cities (as opposed to the use of personal motorized vehicles). As young and presumably healthy adults, students have the physical capacity to cycle; allegedly, they should have more knowledge, motivation, and awareness about sustainability issues. On the other hand, they usually have fewer financial resources than employed people, this being only one crucial issue that could contribute to their more frequent use of bicycles. In fact, students should be considered as relevant forerunners for cycling in cities, but how does this look in practice?
The purpose of this paper was to elaborate on the determinants of bicycle use. We focused on infrastructure factors and social traits. This article addressed (a) the barriers and motivations for cycling among tertiary education learners—university students—to find out whether the quality of infrastructure or the social traits (and which in particular) had a bigger impact on the frequency of cycling among students. Secondly, the purpose was (b) to gain a more accurate insight through the case study of students cycling in the University of Maribor, for example, how they perceived different factors (e.g., the fear of theft, the importance of cycling with friends, lack of bicycle stands). Above all, we wanted to present the percentage of students cycling regularly, occasionally, or never, within the selected sample. The gained data can contribute to a better understanding of the perception of cycling from a young person’s point of view. Nevertheless, this can also contribute to measures that need to be taken into account in order to improve the current state of infrastructure in cities or to improve communication and raise awareness.
Additionally, we put emphasis on smaller-size European cities with a population size between 50,000 and 150,000 people, focusing particularly on those that have universities. By the term ‘university cities’, we consider cities in which there are one or more university campuses that play an important role in the local economy. Smaller size cities are, in general, often underrepresented in terms of urban research [5], moreover in relation to cycling habits of students. Therefore, the gap in the research was addressed by establishing the connection between the importance of cycling among the student population in smaller-size university cities, which could potentially present a common case of high impact regarding sustainable mobility. At the starting position, smaller size cities have one obvious advantage compared to the cities of larger scale—shorter distances—which are favorable to cycling.
The working hypotheses were (a) there should be more cyclists among students compared to the city’s average (if the data were available), in the sense that university students could and should be the promotors of cycling in cities, and (b) the quality of infrastructure has a stronger influence on the decision as to whether students will cycle or not compared with the selected social traits.

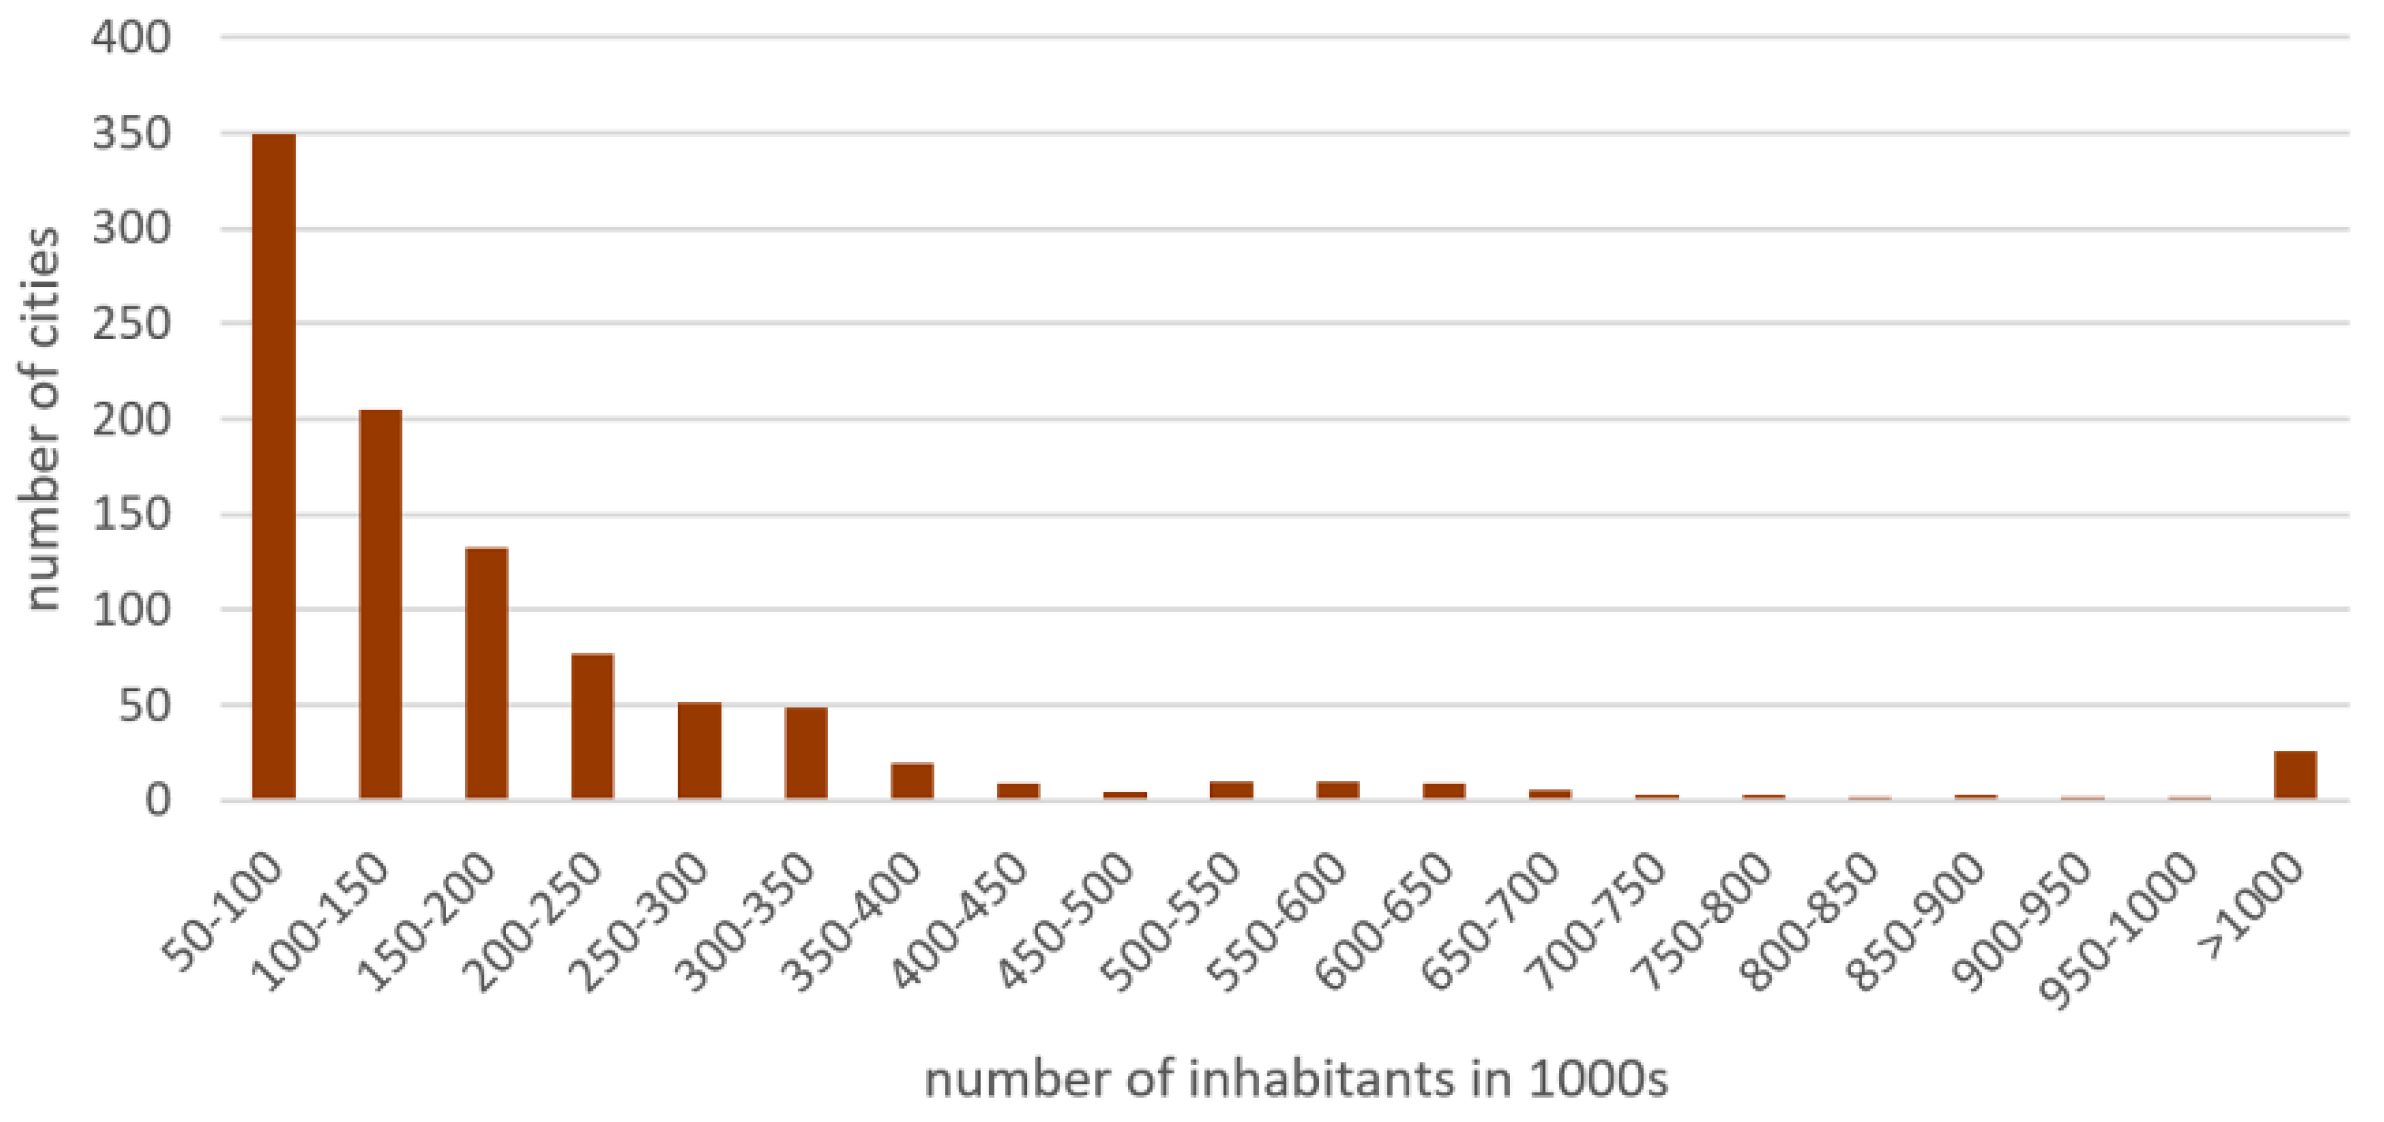
1.1. University Cities and Bicycle Use

According to Swiers et al., there is a paucity of evidence on students’ cycling [3]. However, efforts to establish active mobility among students date back to 1990 with the Talloires Declaration, up to the 2002 Graz Declaration. These agendas claim that universities around the world have acknowledged their unique position to take a leadership role in terms of sustainable travel development [6]. Studies reveal that some university cities show rather important shares of cyclists among students, consequently representing a significant share of cyclists among the total population. This is especially noticeable in the northern part of Europe, where cycling culture is more developed [7]; for example, in the university city of Leiden (the Netherlands), where the popularity of cycling is large due to the vast student population and the relatively small size of the city with approximately 125,000 inhabitants [8]. Around 27,000 students and 6500 staff members are highly encouraged to cycle daily by several stimulating regulations; almost 50% of students commute by bicycle and more than half of the staff members come to work by bicycle as well [9]. Such a high percentage is possible due to the fact that the size of the city is rather small. All university premises are within the 15 min walking distance from the main train station, but more importantly a lot of careful planning was invested in supporting sustainable mobility during the past 40 years, exposing good cooperation between the university and municipality [9]. Similarly, in the university city of Cambridge (England) with 120,000 inhabitants and 43,000 students, the latter are partly responsible for the high numbers in cycling. Among other steps, they have introduced a special policy where undergraduates are not allowed to have a car parking permit unless under special circumstances [10]. Additionally, there are different services offered, for instance, cycle training sessions for staff and students. Another stimulating example is the case of the university city of Ferrara (Italy), a city with 133,000 inhabitants and approximately 15,000 students, where 25.7% of students use a bicycle to go to their courses [11]. Favorable topography, good infrastructure, and service are complimenting to good results. Similarly, in the city of Pécs (Hungary), the university gives full support to their students in terms of cycling, for example by inviting them to join the Academic Bicycle Challenge (ABC) [12]. On the other hand, there are a handful of smaller university cities that present extremely low shares of cycling among students, but also among the wider population, be it because of the general absence of cycling culture, as in the case of university city of Aveiro (Portugal), or because of accompanied extreme topography, such as at the university city of Rijeka (Croatia), which might change in the future due to use of electric bikes and other stimulating policies.
Experience in students’ cycling can be useful and transmittable from university cities of larger scales that have in Europe recently developed models and structures to support cycling among students. In the case of Seville (Spain), a bicycle rental system called “bici” was offered to students and university employees for free to stimulate a potential group of 60,000 people to cycle [13]. The case of Seville is interesting because this was a city without the tradition of cycling, but they managed to increase cycling from negligible values to more than 5% of the modal split in just five years from 2007 to 2011. This change was closely related to the extensive building of cycling infrastructure, which had a considerable impact on the city landscape, as well as on the mobility culture of the population. Students and employees from the University of Seville present roughly 10% of the total population of the city; therefore, specific locations such as university centers were positively discriminated against when planning the cycling network, especially because of their previous cycling tradition (e.g., initiatives aimed to promote cycling already at the end of 1990 and providing parking facilities for bicycles) [13].
Apart from infrastructural investments, other university cities, as is the case of Edinburgh (Scotland), stimulate students with a so-called ‘Cycle Friendly Campus Award’ to explore barriers to cycling and potential solutions in order to develop “cycling culture”. Developed by students for students, the award would have more of an indirect impact on student cycling behavior; however, it also directly influences competition and improves individual cycling practices [14]. According to the survey that took place at the university campus of Madrid (Spain), walking was the predominant mode of traveling for students (as well as using metro and car); however, the authorities tried to promote cycling with the UNIBICI project (university bicycle hiring system). The planned bike lanes connect main campus attractions and public institutions [15]. Research conducted upon students from the University of Zagreb (Croatia) showed that, on average, 20.6% of students use a bicycle once a month (at a minimum, except in the colder seasons of the year)—either as a mean of transport or as a form of recreation [16]. The authors evaluated different types of cycling infrastructure; students were the least satisfied with bicycle parking in the city center. The research showed the difference between expectations for improved cycling infrastructure and activities conducted by the city government. Students, for example, expected specific measures such as subsidies to purchase bicycles and implementation of a city-owned bicycle system to those requiring a broad circle of interested parties for implementation, such as measures entailing the education of all participants in traffic [16].
Active travel to university is an opportunity for students to incorporate physical activity into their everyday. To understand which factors positively and negatively influence bicycle use among students, this paper analyzed the availability and quality of bicycle infrastructure, which is, generally, understood as the prerequisite for more frequent and better cycling, although some authors reduce its importance [17]. The impact of bicycle culture or related social traits must not be underestimated. Bicycle culture refers to the mainstream culture that supports the use of bicycles, but also to the subcultures. In some countries and towns across the world, bicycle culture has been an integral part of people’s mobility for generations. Reasons for such behavior are various, for instance, a flat topography, a good climate, and a specific system of social values. Bicycle culture is best described as asocial interaction or spill-over phenomenon, where a higher bicycle mode share makes it more likely that other people will also use a bike [18]. Goetzke and Rave [18] describe main reasons as being (a) complementarity (i.e., biking with others), (b) conformity to a social norm (i.e., “biking is cool”), and (c) social network effect (i.e., cycling works).

1.2. Positive Factors That Promote Bicycle Use Among Students (Motivations)

When trying to evaluate and identify characteristics of the infrastructure that encourage the use of the bicycle, researchers have in mind the environmental affordances. These are factors that help to assess the existing network, for instance, whether there are traffic lights for cycling, the number of bicycle stands, and bi-directional cycleways [19]. Some authors (e.g., Wilhoit) define environmental affordances as infrastructure’s way of communicating with cyclists and organizing them. One clear example of such environmental affordance is, for example, an area where traffic lights are timed to 20 km/h for a limited period. Such limitation allows cycling without being stopped by a red light [20] and helps to create a pleasant cycling experience. Another important factor is an impact of perception; if the path toward desirable places (post office, school, grocery store, hospital, etc.) leads to safe routes, a positive relation to cycling is established [17]. Cyclists evaluate the continuation of paths and physical separation as important factors for their cycling interest. Additionally, the length of the route is an important prediction—students that commute on shorter distances are more likely to cycle [21]. Shorter distances are defined as distances between 1.5 and 3 km [17]. Also, if the fear of bicycle theft is low, cycling becomes a popular way of commuting (twice as likely). Cycling brings emotional satisfaction and it requires low levels of effort. Additionally, there is a positive relationship with environmentally friendly behavior. Students who relate cycling with pleasure and nature-friendly behavior cycle twice as likely as their peers do, who asses cycling as an unpleasant activity [22]. Environmental reasons are among the main universal reasons when it comes to motivation. Among positive factors that promote bicycle use, Fernández-Heredia and colleagues [15] also identify (a) efficiency (avoiding traffic jams, convenient parking, door-to-door transportation, etc.); (b) flexibility; and that cycling is (c) economical, (d) ecological, (e) healthy, and (f) fun. They state that convenience (flexibility and efficiency) and exogenous factors (vandalism and danger) are the most important factors that encourage cycling. The idea of convenience is promoted through costs and saving time in medium-distance trips (shorter than 5 km) [15].
Furthermore, included among the reasons that seem to be important for cycling are, as Damant-Sirois, Grimsrud, and El-Geneidy [23] state, a healthy lifestyle (or a desire to improve health), greater comfort, and higher income. Rather surprisingly, the same authors write that people who state that they like cycling because it is beneficial for their health are not among those who cycle most frequently. Additionally, Damant-Sirois, Grimsrud, and El-Geneidy [23] explain that pure desire for cycling itself and limited driving options contribute to more bike use. Another important condition that promotes cycling is that sometimes such a mode of transport presents a fast and flexible way in combination with predictable travel time; people who agree with such a description especially like to cycle to work. When it comes to safety perception, this is related to the number of motorized vehicles, speed of cars, and the distance to cars that are parked [23].

1.3. Negative Factors (Barriers)

One of the universal factors that do not evoke positive feelings among cyclists are lanes that go in the opposite direction of traffic [23]. Additionally, the absence of a unified cycling network harms bike use [19]. In the study from two universities in Valencia, results showed that travel time represents an important barrier for students [24]. The perception of safety is negatively associated with cycling on a regular basis—the safer university students feel on their journey, the more likely they cycle [21]. The danger coming from the speeding cars that violate the speed limit is identified as an extremely discouraging factor in the research conducted by Bakogiannis et al. Weather and concerns related to safety were reported as the most common barriers; 64% reported that barriers for cycling were more frequent than for driving, and similar results were found in another survey, which indicated that weather was more of a barrier than the perception of safety. Additionally, an important barrier was the lack of shower facilities [25]. Note that owning a bike is an important component to develop the interest for cycling, however, it does not guarantee the actual use of a bike by itself [23]. People who live in surroundings where bicycle theft is common and traffic conditions are inconvenient would probably not consider owning a bike. However, if a person expresses interest in cycling, there is a great chance of their possession of a bike [23].

1.4. Aims of the Research

The aim of this study was to present the questionnaire-related survey on the topic of cycling among the students of the University of Maribor, Slovenia. By doing so, we placed this topic in the context of a much larger group of cities that are university cities and/or are smaller-sized European cities. Additionally, we contribute new data to the field of relatively limited research that had been done in Central Eastern Europe or post-communist countries.
Concerning the population size, the city of Maribor is among 58% of European cities with a population smaller than 150,000 inhabitants, amounting to 585 cities (Figure 1) out of the total of 994 cities in the European Union (EU) and Switzerland [26]. These groups of cities remain under-explored, as the focal point of urban research is often put on metropolises and capital cities.
Furthermore, if we take into consideration that there are approximately 2500 higher education establishments in the European Union [27], 19.6 million students in EU matriculated in 2016 [28], and that approximately 230 university cities in Europe fall in the target group of cities with a population size ranging from 50,000 to 150,000 inhabitants [29], then we can postulate a thesis that students represent an extremely important target group with the potential to generate a tangible impact on the city.
Section 3 presents the results of the research, followed by Section 4, where the results are discussed. Finally, in Section 5, the conclusions of the study are presented.

2. Methodology (Research Area and Data Collection)

The research was conducted in 2018 among the student population at the University of Maribor, exploring the estimated low shares of student population cycling, whereby early estimations were made solely upon observation. No previous study has been conducted before on this topic at the University of Maribor. Furthermore, students of the University of Maribor presented in 2018 one-sixth (1/6) of the entire population of the city (approximately 16,000 students were enrolled in 2018; however, in 2000 the number of enrolled students was much higher, up to 25,000 [30]).
The data were obtained from the Štud-Bike survey which was part of the Student Innovative Project for Social Benefits (ŠIPK, 2016–2018). The survey is based on a sample of individuals representing the student population in the university city of Maribor.

2.1. Research Sample

Students were members of faculties that are located in the city center or nearby. The sampling (we used a non-probability sampling) was linked to the information about the number of enrolled students that we had received from the Department of Education and Students’ Affairs at the University of Maribor. We conducted a random sample of courses at both levels, undergraduate and graduate. Course tutors and vice deans for student affairs provided information about the attendance of selected courses. We asked for a confirmation letter via email to conduct surveys among students. The data were collected with self-administered questionnaires in the lecture halls (the questionnair used is presented in Supplementary materials Table S1). The sample consisted of 382 respondents from 11 faculties located in the city center or nearby (67.2% women and 32.8% men, Mage = 22); however, the sample is not representative. In Table 1 some demographic characteristics of our sample are presented.

2.2. Plan of Analysis

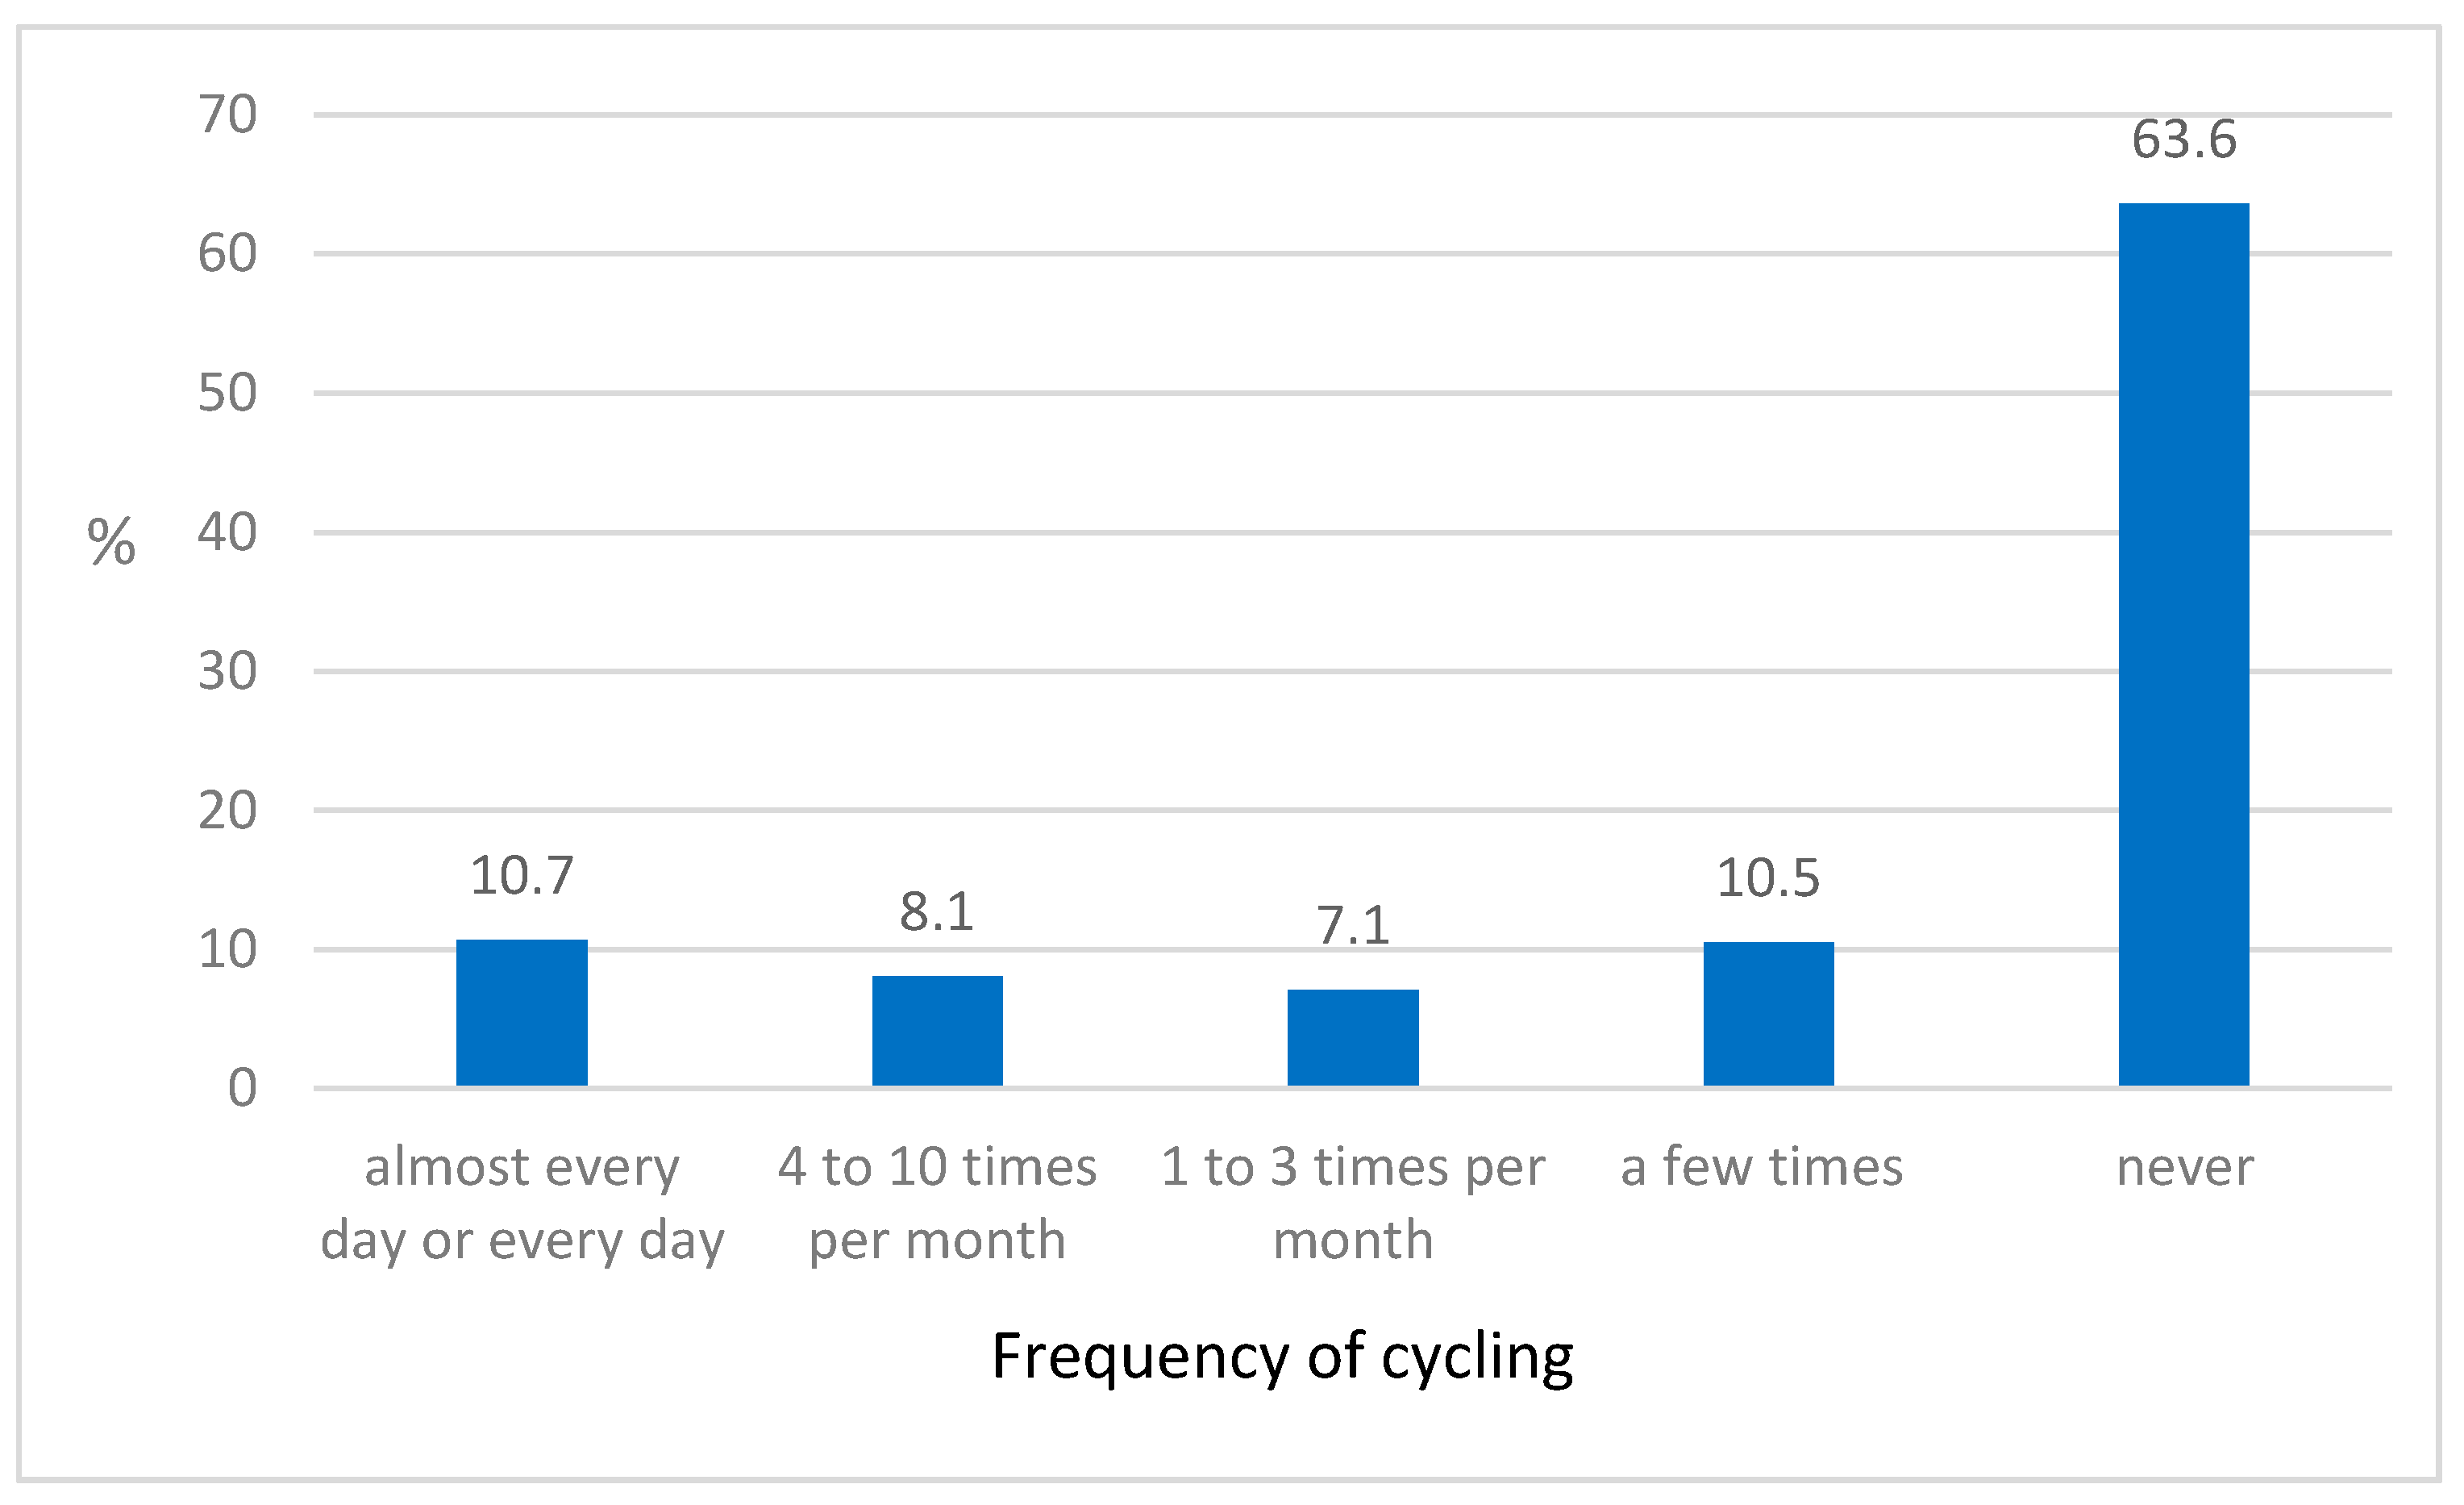
2.2.1. Dependent Variable: Frequency of Cycling

Frequency of respondent’s cycling was measured with a question, “How often did you cycle in the last year in Maribor?” (1 = never; 2 = several times a year; 3 = 1–3 times per month; 4 = 4–10 times per month; 5 = almost every day or every day).

2.2.2. Independent Variables

Physical factors were measured with a question, “To what extent do you agree that following factors present an obstacle for your cycling?”, and two items: “Living too far from the point I am off to” (1 = completely disagree; 5 = completely agree) and “Cycling takes too much time” (1 = completely disagree; 5 = completely agree). We created a summation variable of physical factors (rho = 0.52).
Convenience was measured with three items on a five-point scale (1 = not encouraging at all; 5 = very encouraging) with a question, “How encouraging are these factors in your decision to cycle?” The items were “Cycling allows me to save money”, “Cycling is the fastest way to come from point A to point B”, and “Flexibility of the departure time”. Furthermore, we created a summation variable (Cronbach’s α = 0.76).
Ecological orientation was measured with two items: “When I am cycling, I contribute to climate-change reduction” (1 = completely disagree; 5 = completely agree), and “When I am cycling, I contribute to local air pollution reduction” (1 = completely disagree; 5 = completely agree). Additionally, we created a summation variable-ecological orientation (rho = 0.67).
Perceived safe infrastructure for cycling included seven examined perceived factors that contribute to safe cycling infrastructure in Maribor. The indicators were “Properly maintained and safe cycling crossings infrastructure”, “Physically divided cycling infrastructure/path from the motor traffic”, “Low traffic volume of motor traffic on the roadway and low speed of motor traffic”, “Offset of the cycling infrastructure from the obstacles”, “Cycling surface on the carriageway (e.g., cycling lane)”, “Cycling surface on a sidewalk (e.g., cycling path)”, and “Appropriate stand or parking lot for bicycle” (1 = not important at all; 2 = not important; 3 = neither important or unimportant; 4 = important; 5 = very important). We created a summation variable—perceived safe infrastructure for cycling (Cronbach’s α = 0.80).
Additionally, we included items measuring complementarity and conformity to a social norm, as suggested by Goetzke and Rave [18]. The first item, measuring complementarity, was “I have friends who recreationally cycle with me” (1 = not encouraging at all; 5 = very encouraging), the second item, measuring conformity was “Biking is cool” (1 = completely disagree; 5 = completely disagree). Because fear of bicycle theft has been previously proven to be an important determinant for frequency of cycling [22], we included the following item, “I fear that someone will steal my bike” (1 = completely disagree; 5 = completely agree). Furthermore, we included an item measuring a lack of car ownership as a potential motive for cycling, “I do not have a car” (1 = not encouraging at all; 5 = very encouraging), and taking care of health as a motive, “Cycling helps me to take care for health” (1 = not encouraging at all; 5 = very encouraging). Inconvenient weather conditions were also included as an obstacle for cycling. The question was “To what extent do you agree that the following factors present an obstacle for your cycling? Inconvinient weather circumstances, such as rain, snow, heat, cold” (1 = not agree at all, 5 = fully agree). Finally, we analyzed the respondent’s lack of desire/motivation for cycling. The item was “I do not feel like cycling”, measured on a five-point Likert scale.
Lastly, we included sociodemographic variables: age, gender (0 = male; 1 = female), and socioeconomic status. Socioeconomic status (SES) was measured with parental education. The question was “What is the highest formal education of one of your parents (choose a parent with higher education)” (1 = elementary/primary school; 2 = vocational school; 3 = grammar school; 4 = bachelor’s degree; 5 = master’s degree; 6 = doctorate).

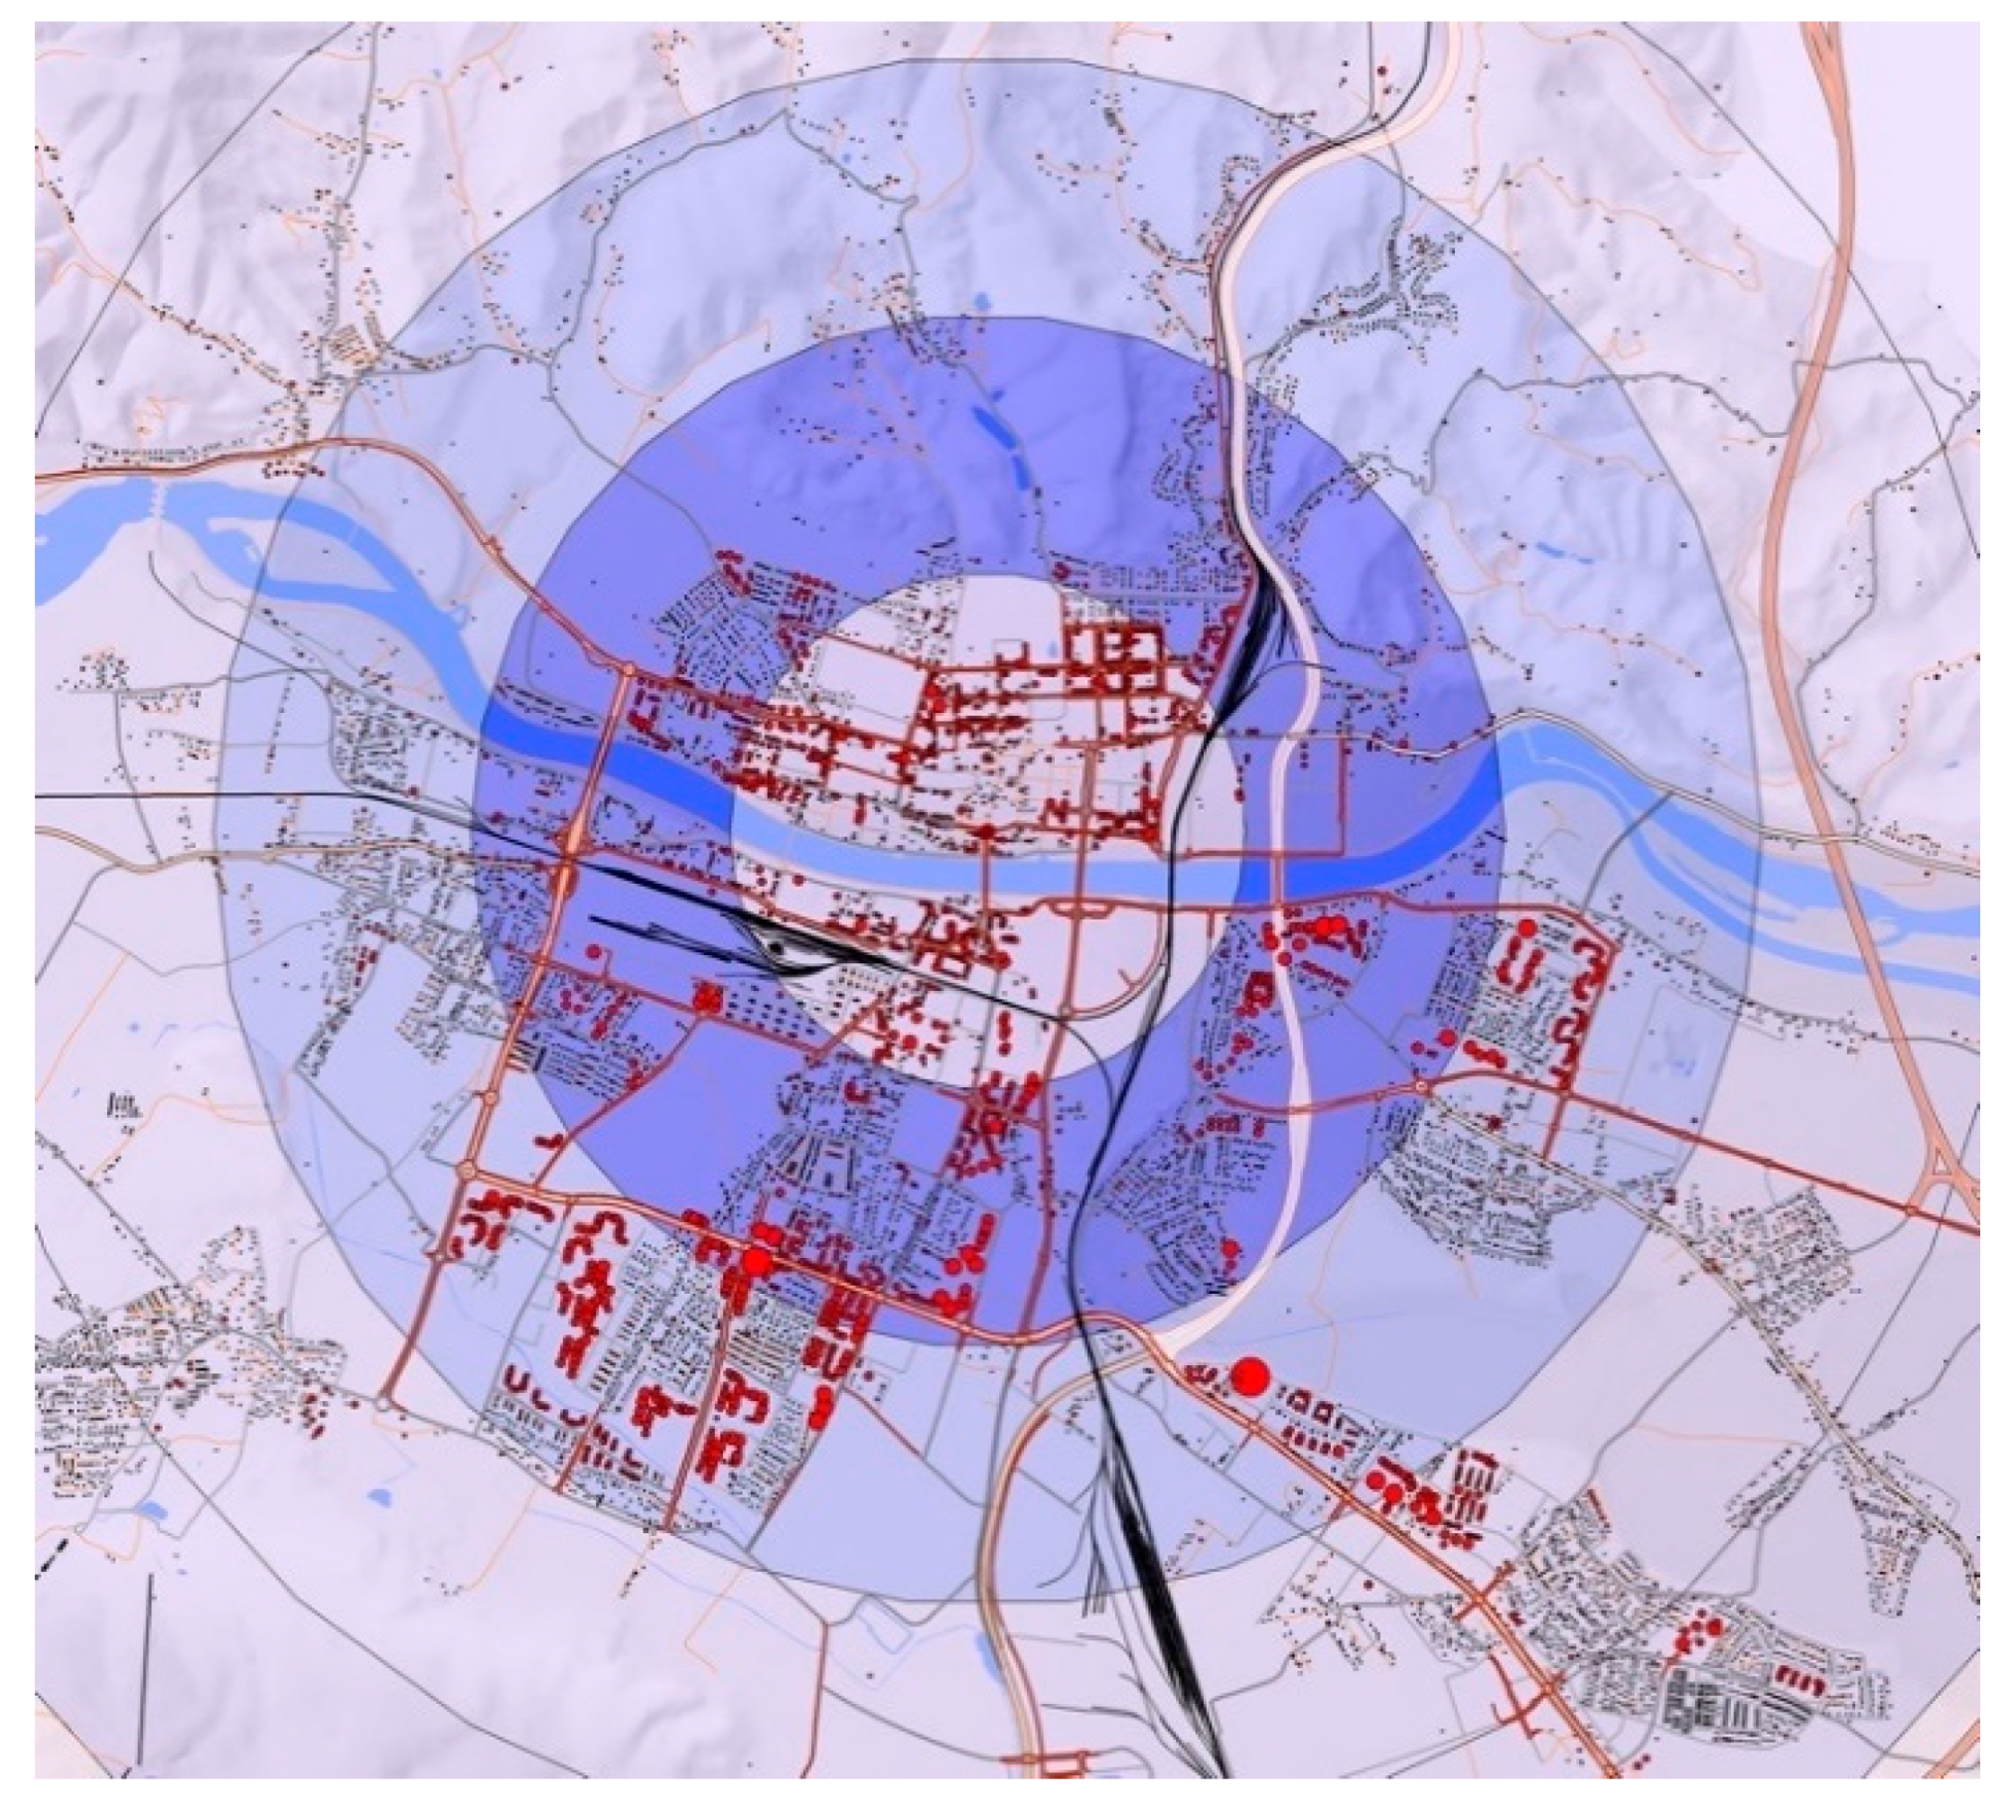
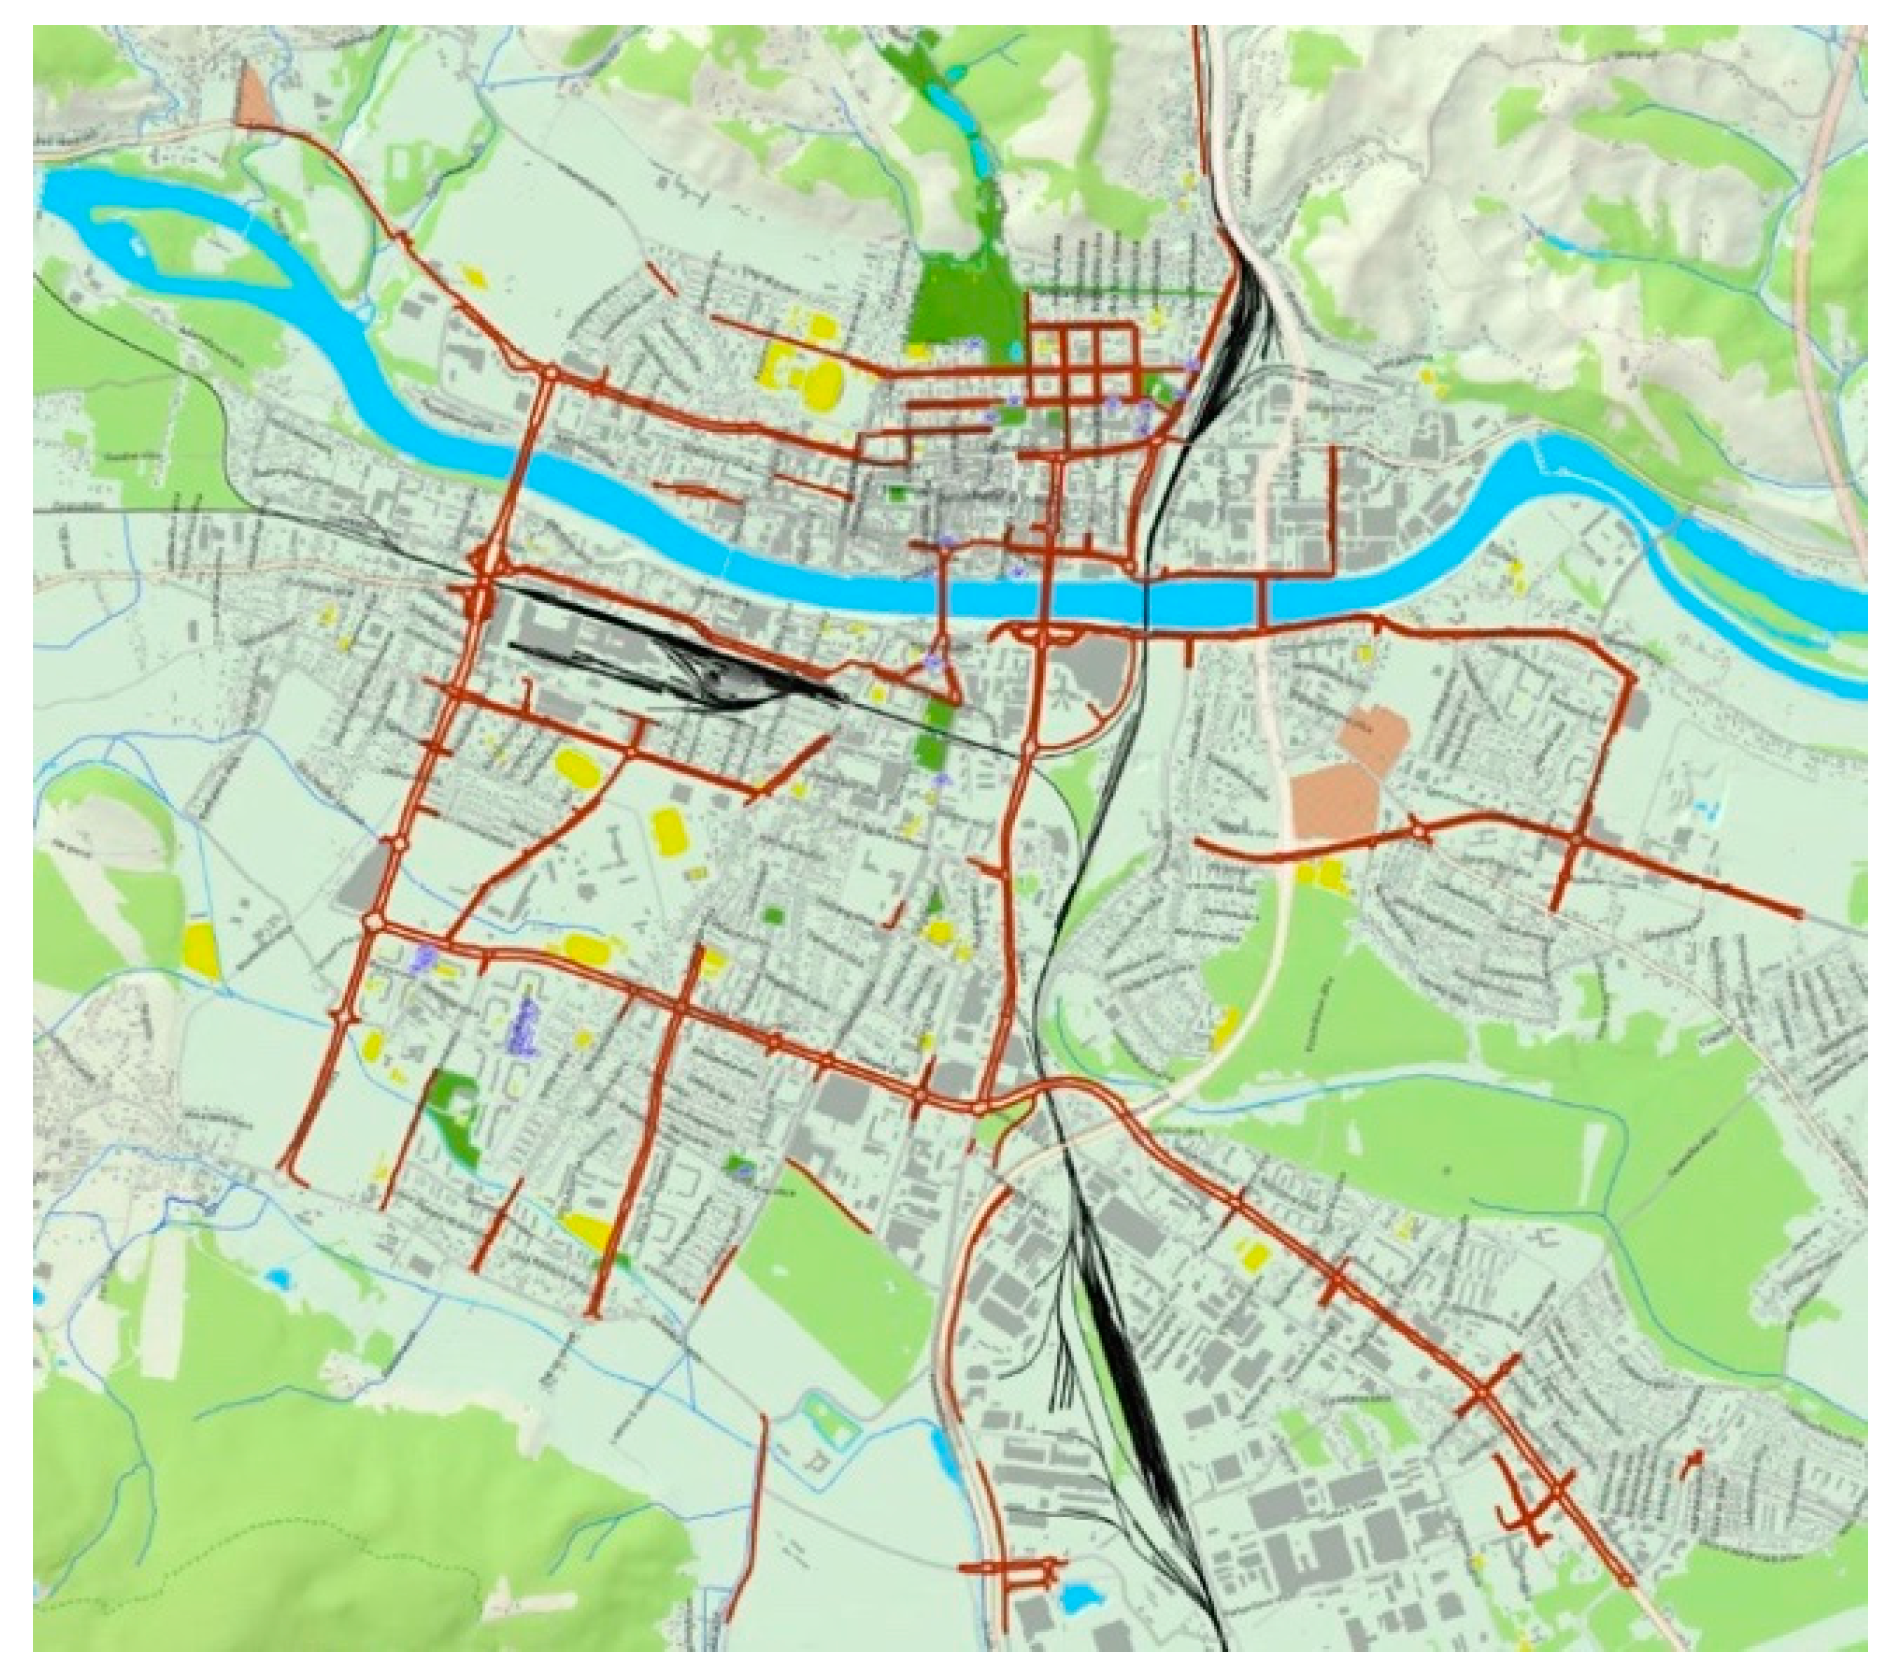
2.3. Research Area and Context

Our research area consisted of 11 faculties that are located in the city center of Maribor (Figure 2). The maximal walking distance from the farthest faculty to the old city center is 25 min. Additionally, 15 min more of walking is required from the city center to the main train and bus station. Roughly 20% of all students of the University of Maribor stay in student dormitories, where 4 are located in the student campus (Figure 1, position 2) and 12 are scattered around the city center (always within 3 km of the center.) A share of students live in private units that are located throughout the city of Maribor. In addition, almost 80% of the whole city population lives within the 3 km radius from the city center (Figure 3) and near key institutions, so it is not surprising that in general students are also close to the center/faculties. Maribor is the second largest city in Slovenia, with approximately 100,000 inhabitants. In the second half of the 20th century, the city had a strong focus on the car, metal, and textile industries, whereas most of it ceased to operate at the beginning of 1990, causing high unemployment among the citizens—up to 17.5% [31]. Maribor is nowadays developing into a dynamic, green, touristic–cultural, and economic center of northeastern Slovenia. Interestingly, cycling was a popular transport means for citizens of Maribor at the beginning of the 20th century, but afterward with the rise of motorization, it fell into complete decline. This can be explained by the low status of cyclists compared to the societal importance of owning and riding a car in the before mentioned industrial city. The period can historically be understood as the first development cycle.
According to the internationally recognized methodology PRESTO (Promoting Cycling for Everyone as a Daily Transport Mode), which measures the development of cycling in urban areas, Maribor was in 2013 ranked among the cities that are at the initial stage of cycling development [4], related to the second development cycle and according to the different parameters (e.g., share of cyclists in traffic, level of development of cycling network, quality of cycling infrastructure, funding for cycling development). On the other hand, Maribor has quite good preconditions for cycling, including good climate, flat topography, and rather short distances within the city. Once again, we emphasize that 80% of all of the inhabitants live in a radius of 3 km from the city center (Figure 3). The cycling network (in the length of approximately 86 km) in Maribor consists mainly of a network of one-way cycle tracks on sidewalks and occasionally (on less busy roads/streets) together with motor vehicle traffic on the carriageway. Furthermore, the cycling network consists of bicycle lanes on the carriageway—in some cases as advanced cycle lanes. The map (Figure 4) shows the existing cycling network in the city of Maribor.
The current situation in the field of cycling infrastructure in Maribor—despite improvements established in the past 15 years—is still not at the desired level. We could point out the following deficiencies:
  • The cycling network is not always connected. It is fragmented and disconnected, having conflict points, and is inadequately linked to central areas and recreational areas.
  • Quality of pavement surface is often inadequate and could cause destabilization of the handlebars and loss of wheel control.
  • Inappropriate beginning/ending of the cycling infrastructure—when connected to carriageway or sidewalks, ramps are either too narrow or with dangerous edges.
  • Inadequate cycling path widths, which are especially evident on narrow streets or where the cycle path is placed on a narrow sidewalk.
  • Indirect guidance of cyclists through intersections, which increases the risk of accidents (car drivers could overlook cyclists).
  • Lack of one-side two-way bike paths—which is especially annoying on four-lane roads, where easy crossing is not always possible.
  • Obstructing objects in the vicinity of the cycling paths—traffic signs, poles, street lighting, garbage cans, urban equipment, (improperly) parked vehicles, etc.
  • Conflicts with pedestrians—especially when the ramps at pedestrian crossings are too narrow or when the bike path is placed on a narrow sidewalk.
This assessment was made to define the various independent variables of our survey.

3. Results

3.1. Results According to Shares and Faculties

Results on the share of students cycling in Maribor are presented in Figure 5. The figure shows that 10.7% of all students involved in the survey cycle every or almost every day. The percentage is slightly higher to the estimated percentage of all inhabitants cycling in the city of Maribor according to the recent localized measurements, which confirms the first hypothesis. On the other hand, there is almost the same amount of students (10.5%) who use a bike only several times a year. Hereby, it has to be mentioned that there is a lack of available traffic data, only a few localized cyclist traffic countings were performed in the last five years. In 2013, at the time of the last official counting, the city’s modal split in cycling was 5% [4], but it has grown since then by a few percentage points, up to an estimated 8% (it is important to take into account different sampling methods). The general growth in the percentage of citizens cycling in recent years correlates with slight improvements in infrastructure, particularly better availability of bicycle stands in the city center, but also with the global impulses in the field of cycling. Cycling has become a more socially accepted mode of transportation as it was in the past, and there is increased positive media attention related to cycling.
The results from Figure 5 apply to students who cycle 4–10 times per month; there were 8.1% of them. These students can be considered active cyclists, but their cycling is not bound to daily commuting, but rather using a bicycle for recreation and sports, shopping, and other activities. Adding both groups together, we have a group of less than 20% of students that can be described as active cyclists. This percentage can position students of Maribor in-between the more developed university cities regarding cycling, as mentioned before with regards to Leiden and, on the other hand, university cities that do not have any developed cycling infrastructure or culture. We should add that those in the Mediterranean countries have in recent years reached meaningful levels [13].
Referring again to Figure 5, the results show a high number of non-cycling students (63.6%). Including those who cycle only a few times per year, we noticed a rather large group of students, almost three-quarters of the total sample, who are not active cyclists. This group causes curiosity that needs to be better understood, especially in identifying the obstacles to cycling.
The distribution of active cyclist and non-cyclist was measured according to all faculties involved. Faculty enrolment is frequently used to help in the process of identifying student opinion. Additionally, the location of the faculty may have an impact on the decision to use a bicycle [16]. Figure 6 shows large disparities and differences between faculties, whereas those with orientation in technics and natural sciences such as Faculty for Natural Sciences and Mathematics (FNM) (36.8% of all students cycled every or almost every day); Faculty of Civil Engineering, Transportation Engineering and Architecture (FGPA) (20% of all students cycled every or almost every day); and Faculty of Mechanical Engineering (FS) (18.9% of all students cycled every or almost every day) had a noticeably higher amount of active cyclists compared to the faculties oriented in the social sciences. The lowest share of active daily cycling was measured for the Faculty of Law (PF) (2.8%), Faculty of Arts (FF) (4.9%), and Faculty of Education (PeF) (5.9%). Regarding their spatial distribution, it is difficult to draw any conclusions, as they are all located in a close vicinity to the city center, but also dormitories. In most cases, distances did not exceed 3 km (Figure 2).

3.2. Results of Regression Analysis

When analyzing the determinants of bicycle use, it turned out that the distance to the student’s home/dormitory had a significant impact on cycling frequency. Most often, those who cycle do not live more than 3 to 5 km away from their faculty. In that sense, but also surprising to a certain degree, was the share of active cyclists among the students of FNM, the only faculty that is, at the same time, located directly in the student campus and has the largest share of active cyclists.
Furthermore, the regression analysis showed (Table 2) that cycling frequency was statistically significantly associated with physical factors (β = −0.13; p < 0.01), convenience (β = 0.25; p < 0.01), health (β = −0.14; p < 0.01), fear of bicycle theft (β = −0.16; p < 0.01), lack of desire to cycle (β = −0.26; p < 0.01), inconvenient weather circumstances (β = 0.09, p < 0.05), and SES (socioeconomic status; β = 0.13; p < 0.01). Physical factors and frequency of cycling had a negative statistic correlation, whereas convenience was positively associated with frequency of cycling; students are more willing to cycle when cycling presents the fastest means of transport and allows them to save money. The analysis showed a negative correlation between the frequency of cycling and associating cycling with improved health. The results are interesting because they indicate cognitive dissonance (Festinger, 1962) among students. The latter perceive cycling as good for health, but their behavior (low cycling frequency) conflicts with their beliefs [33]. We also found that the more students are afraid they will be a victim of bike theft, the less fond they are of cycling. In addition, we found that when students have a lack of desire to cycle, their cycling frequency is low. Furthermore, the analysis showed inconvenient weather circumstances are not associated with a lower frequency of cycling because the correlation is positive. Finally, the results indicate that higher SES (measured through parental education) increases the likelihood of cycling among students.
We need to mention two interesting determinants that do not have a statistical correlation with the frequency of cycling. We assumed that ecological orientation would encourage more enthusiasm for cycling among students, as suggested by Titze and colleagues [22], and we also expected infrastructural determinants would be associated with the frequency of cycling. However, both determinants were not statistically significant.
A result evaluating the overall quality of cycling infrastructure was graded with 5.85 out of 10 (measured on the same scale as exam grades are graded at the University of Maribor: 1—insufficient, 10—excellent).

4. Discussion

This study investigated the determinants of bicycle use among the student population in the city of Maribor, whereas no comparable studies on students cycling in Slovenia were performed before. Exploratory research of social and infrastructural factors investigated which determinants influenced students to cycle more or less. The research provided a variety of interesting insights. Most of the results were not expected at all, especially regarding, for instance, the ecological orientation that proved to be statistically insignificant. This is particularly interesting in the light of environmental protests inspired by the young climate activist Greta Thunberg where the youth are finding their way to communicate their “green mindset”. Part of the explanation maybe lies in the convenient distance between crucial institutions that allows students to walk. Note that we did not include ‘walking’ in our questionnaire, however, short distances might affect students’ perception that walking is not as unpleasant and time-consuming to reconsider alternative ways of commuting. Additionally, in the past few years, Slovenian students have been encouraged to use the IJPP card (integrated public transport car) that allows combining buses and trains. Therefore, the youth already use two means of transport that are promoting sustainable mobility; however, short distances seem to be managed without a bike. The frequency of cycling was quite low, and therefore motivation for cycling of those who already cycle probably lies somewhere else. We can assume that they are particularly internally (or externally) motivated by some other factors (not having a car, genuine enjoyment, etc.), and thus they use the approach that best suits them ‘as they go’. If there are lanes, they will use them, and if there are not, they will find another way to get to the desired location. However, we show that there exists a generally positive attitude towards bikers in Maribor, also at locations where cycling infrastructure is of poor quality or non-existent. On the other hand, people who do not want to cycle will not cycle, no matter the quality of infrastructure, as Damant-Sirois et al. state [23].
Although this study contributes to broader research field with valuable data that was unavailable before, it is difficult to draw clear conclusions because there was no explicit statistical result. We cannot conclude that the rather average representation of active cycling among students of the University of Maribor is the result of imperfect infrastructure or lack of cycling culture and other social factors, but it is somehow evident that both social and infrastructural factors deeply intertwine, that is, the fear of bicycle theft is connected to the quality and safety of bicycle parking. The general notion that infrastructure presents a larger impact on a person’s decision to cycle was not exposed as more significant as some other social determinants.

4.1. Infrastructure Factors

Regarding the state of cycling infrastructure in Maribor that is far from excellent, the grade given by the local students, 5.85 of 10, speaks clearly about its shortcomings. There are no quality parking spaces (fenced or with surveillance) in the vicinity of faculties, however, some dormitories provide them on a smaller scale (up to 20 stands). There are few smaller bike rental options for students, especially for Erasmus students, who usually do not bring their bikes along. On the city level, there is no offer of a bicycle rental system, as is the case for many cities across Europe. Despite the fact that infrastructure, as already mentioned before, is gradually improving as a result of strategic orientation proposed in several municipal documents in recent years [31,34], and following the framework of Integrated Urban Development Strategies, it has still not reached the desired level of attractiveness and safety. Being in this state of in-between, the basic provision of cycling infrastructure makes it even more difficult for students to evaluate it (e.g., there is a good cycling path provided, but it is interrupted after 500 m).
Crucial for the development of cycling infrastructure and cycling culture are local activists and local civil initiatives such as the Maribor Cycling Network [35], which was paving the way towards developing Maribor into a bicycle-oriented city since 1990. Furthermore, in 2014, the List of Cyclists and Pedestrians has been established as a non-political list entering the local elections and advocating cycling at a higher level. The same list transformed into a political party in 2018, achieving good results in the local elections in Maribor, as well as in Ljubljana, Slovenia’s capital city. Now, they are taking a stand for better conditions for cyclists and pedestrians in both cities [36].
Unfortunately, the University of Maribor has not taken enough of an active role in creating a policy for cycling among students until now. This might be the answer to the fact that three-quarters of students do not cycle at all. With favorable spatial predispositions as short distances and flat topography, the university, along with students’ initiatives and in cooperation with the municipality, should assure better infrastructure and develop policies to promote cycling among students in Maribor. The current percentage of active cyclists, which amounts to roughly 20%, could be increased by a few percentage points without larger investments. Nevertheless, for more success, the already mentioned shortages should be eliminated.

4.2. Social Factors

Related to the social determinants, the results showed that two determinants, SES and convenience, increase the likelihood for cycling, whereas fear of bicycle theft, lack of desire or motivation for cycling, and physical factors (living too far and time consumption) tend to have a negative impact on cycling frequency. Given that the university, faculties, library, and other key institutions of student life are relatively close, it would be beneficial to promote this type of information with, for example, graphics maps such as Metrominuta [37]. Consequently, students could see the relative closeness and time they would spend traveling by bike. Since convenience (e.g., saving money and flexibility of departure time) promotes cycling frequency, we suggested that policymakers further popularize this information. One can notice that the lack of information, specific stigmas, or ingrained beliefs are often reasons for increased insecurity and consequently cause a refusal to use a bicycle. Therefore, it is important to address young people in order to encourage and empower them toward the independence of movement in cities, as far as we want them to be developed in a sustainable way. In this sense, the continuation of the Štud-Bike project in the year 2019 was focused on the development of soft tools and approaches that could increase the level of motivation for cycling (information platform [38] and a brochure were produced as a result of multidisciplinary student work).
Furthermore, it is also a matter of discussion that students with an orientation in technics and natural sciences were found to be more likely to be active cyclists than the students with an orientation in social studies. To some extent, this could be interpreted in the light of cycling being more popular among male respondents than females [23], and additionally, more male students than female students enroll in programs associated with technical and natural sciences.
Last but not least, we must acknowledge that the city of Maribor had a history as an industrial city, with a strong focus on the car industry. It developed a strong cult of owning and driving personal motorized vehicles, which was once more proven in the case of spatial transformation of one of the oldest centrally located streets called Koroška street and accompanying difficulties [39]. To develop a deep-rooted cycling culture, it takes time and engagement—in the case of Maribor, it is the culture that is in the course of development over the past 30 years (despite its early beginnings around 1900).

4.3. European Context

Bringing the discussion back to the level of European university cities, we can argue that the number of students among the total population, especially in smaller cities, can present a significant target group that needs to be motivated for cycling at the bottom-line. This research showed and slightly exposed the lack of desire and motivation among students of the University of Maribor to cycle. Rising the motivation to cycle among students should be one of the primal duties of university managements that need to be acquired with full severity. Changing mobility patterns among young people is contributing to the sustainability of cities in the long run. How is this achieved? By implementing a series of supporting policies. Incorporating modern technologies can also be a motivating factor for students; e-platforms, specific applications related to cycling, and e-bikes seem to be attractive among youth. Using technology has been proven to be useful and successful in the case of the University of Seville. According to Marques, the webpage (http://bicicletas.us.es) was created to disseminate all the initiatives, and these policies led to participation of between 11% and 14% of bicycle trips in the modal split of trips to and from the university buildings. This more than doubled the participation of the bicycle in the city’s overall modal split [13].
To conclude, on one side we have university cities in Europe from which we should learn, and on the other side, there are cities and individuals at universities who struggle to promote cycling in their urban environment, referring to the smaller city of Aveiro (Portugal), displaying a rather low percentage of students cycling. Most of them use cars to commute to the faculty and, as a result, the beautiful campus is surrounded by a huge parking space. At the same time, the University of Aveiro has a strong initiative to promote and develop cycling infrastructure and culture, being involved in many sustainable mobility projects, opening a mobility center for cycling, acquiring bikes for students, even teaching them how to ride a bike, which is not a self-evident thing. However, such developments can take plenty of time until cycling is considered irresistible [7].

5. Conclusions

The paper dealt with the question of whether cycling infrastructure or social traits contribute to more cycling among university students. According to the results from the survey, it seems that both determinants are deeply intertwined and connected, one directly influencing the other. The road to students who choose cycling as their main way to commute is paved with sufficient, safe, and attractive infrastructure; a user-friendly bike-sharing system; a variety of (digital) promoting approaches; encouragement from the authorities and peers; and educational practices about personal benefits that cycling brings. This could be achieved by a variety of practical approaches such as bike charity events, students’ critical mass events, cycling awards and competitions, cycling tours, cycling courses for beginners, positive and creative promotion of cycling using social media, creating new models of socio-economic exchange, but also providing support for fixing bikes, and above all assuring safe infrastructure and parking. The factors listed above should be valid not just for students who use bicycles—after all, students are the proportion of the population that is more suitable for cycling because of their age and physical predispositions (and maybe this is the reason why they do not have bigger complaints about cycling infrastructure)—but also in terms of establishing appropriate conditions for using bicycles under the ‘8–80’ principle.
We conclude with the notion that smaller size cities that incorporate universities should be obliged to support students as intrinsic capital and potential to grow into high quality sustainable urban environments. Results presented could be used for universities (in a similarly sized city with the similar conditions for cycling) and corresponding city authorities as a useful indicator in terms of preparing/adopting mobility plans or university mobility plans. University- and municipality-representatives in cooperation with students’ organizations and dormitories should develop tools and structures to foster the use of a bicycle as the most democratic and all accessible post-fossil mobility means among students and young people in general. Above all, urban environments around faculties, campuses, and dormitories should be redesigned in a way to encourage students to cycle more. Students should be considered as the most important protagonist of active and sustainable mobility in our cities. Successful examples show that stimulating environments for students to cycle are those where the whole community breathes with this idea, and this involves good cooperation with municipalities. We should not underestimate the role of all members of the university staff—professors and assistants are important role-models in this respect.

Supplementary Materials

The following are available online at https://www.mdpi.com/2571-5577/3/1/6/s1: Table S1: Research questionar.

Author Contributions

All authors contributed to the design, data-preparation, introduction, literature review, results, and discussion. All authors have read and agreed to the published version of the manuscript.

Funding

Štud-Bike survey, which was part of Student Innovative Project for Social Benefits (ŠIPK, 2016–2018). The project was funded by the Ministry of Education, Science and Sport and European Union through the European Social Fund.

Acknowledgments

Special thanks go also to the participating students and to the project partner—Maribor Cycling Network.

Conflicts of Interest

The authors declare no conflict of interest. The funders had no role in the design of the study; in the collection, analyses, or interpretation of data; in the writing of the manuscript, or in the decision to publish the results.

References

  1. Dufour, D.; Ligtermoet & Partners. Promoting Cycling for Everyone as a Daily Transport Mode. PRESTO Cycling Policy Guide. 2010. Available online: https://ec.europa.eu/transport/sites/transport/files/cycling-guidance/presto_policy_guide_cycling_infrastructure_en.pdf (accessed on 16 September 2019).
  2. Pucher, J.; Hagen, V. Walking and Cycling for Sustainable Cities. Built Environ. 2014, 18, 391–414. [Google Scholar]
  3. Swiers, R.; Pritchard, C.; Gee, I. A cross sectional survey of attitudes, behaviours, barriers and motivators to cycling in University students. J. Transp. Health 2017, 6, 379–385. [Google Scholar] [CrossRef]
  4. Rotar, J.; Lozar, M.; Renčelj, M.; Rozman, U.; Veselko, R. Kolesarska Strategija Mesta Maribor 2013–2030; MOM: Maribor, Slovenia, 2013. [Google Scholar]
  5. Servillo, L.; Atkinson, R.; Hamdouch, A. Small and Medium-Sized Towns in Europe: Conceptual, Methodological and Policy Issues. Tijdschr. Econ. Soc. Geogr. 2017, 108, 365–379. [Google Scholar] [CrossRef]
  6. Balsas, C.J.L. Sustainable transportation planning on college campuses. Transp. Policy 2003, 10, 35–49. [Google Scholar] [CrossRef]
  7. Pucher, J.; Buehler, R. Making cycling irresistible: Lessons from the Netherlands, Denmark and Germany. Transp. Rev. 2008, 28, 495–528. [Google Scholar] [CrossRef]
  8. Population Leiden. Available online: https://www.citypopulation.de/php/netherlands-admin.php?adm2id=0546 (accessed on 16 September 2019).
  9. Leiden University Environmental Policy Plan 2016–2020. Available online: https://www.universiteitleiden.nl/binaries/content/assets/algemeen/duurzaamheid/environmental-policy-plan-2016.pdf (accessed on 16 September 2019).
  10. Laker, L. What Makes Cambridge a Model Cycling City? Available online: https://www.theguardian.com/environment/bike-blog/2011/aug/17/cambridge-model-cycling-city (accessed on 3 October 2019).
  11. Ferrara Città Delle Biciclette. Available online: https://servizi.comune.fe.it/2405/attach/statistica/docs/informanumeri_biciclette.pdf (accessed on 15 October 2019).
  12. Academic Bicycle Challenge. Available online: https://www.go-abc.org/en/for-universities/ (accessed on 15 August 2019).
  13. Marqués, R.; Hernández-Herrador, V.; Calvo-Salazar, M.; García-Cebrián, J.A. How infrastructure can promote cycling in cities: Lessons from Seville. Res. Transp. Econ. 2015, 53, 31–44. [Google Scholar] [CrossRef]
  14. Acton, J.; Ashe, A.; Barriga, P.; Bauer, K.; Casallas, A.; Daravanis, T.; Devenport, E.; Donner, K.; Forbes, C.; Grossman, M.; et al. How do we get students cycling more at Universities and Colleges in Edinburgh? Univ. Edinburgh Cycl. Rep. 2015, 15, 1–16. [Google Scholar]
  15. Fernández-Heredia, Á.; Jara-Díaz, S.; Monzón, A. Modelling bicycle use intention: The role of perceptions. Transportation 2016, 43, 1–23. [Google Scholar] [CrossRef]
  16. Lukić, A.; Prelogović, V.; Rihtar, S. Planning a More Humane City: Student Expectations Concerning Bicycle Use and Transportation in Zagreb. Hrvat. Geogr. Glas. Geogr. Bull. 2018, 73, 111–132. [Google Scholar] [CrossRef] [Green Version]
  17. Handy, S.L.; Xing, Y.; Buehler, T.J. Factors associated with bicycle ownership and use: A study of six small U.S. cities. Transportation 2010, 37, 967–985. [Google Scholar] [CrossRef]
  18. Goetzke, F.; Rave, T. Bicycle use in Germany: Explaining differences between municipalities with social network effects. Urban Stud. 2011, 48, 427–437. [Google Scholar] [CrossRef] [PubMed]
  19. Bakogiannis, E.; Kyriakidis, C.; Tsigdinos, S.; Dianellou, M. Study of cycling behavior in medium-sized Greek cities. The case study of Volos Municipality. Urban. Inf. 2018, 45, 14–18. [Google Scholar]
  20. Wilhoit, E.D. Affordances as Material Communication: How the Spatial Environment Communicates to Organize Cyclists in Copenhagen, Denmark. West. J. Commun. 2018, 82, 217–237. [Google Scholar] [CrossRef]
  21. Jones, N.R.; Jones, A.; van Sluijs, E.M.F.; Panter, J.; Harrison, F.; Griffin, S.J. School environments and physical activity: The development and testing of an audit tool. Health Place 2010, 16, 776–783. [Google Scholar] [CrossRef] [PubMed] [Green Version]
  22. Titze, S.; Stronegger, W.J.; Janschitz, S.; Oja, P. Environmental, social, and personal correlates of cycling for transportation in a student population. J. Phys. Act. Health 2007, 4, 66–79. [Google Scholar] [CrossRef] [PubMed]
  23. Damant-Sirois, G.; Grimsrud, M.; El-Geneidy, A.M. What’s your type: A multidimensional cyclist typology. Transportation 2014, 41, 1153–1169. [Google Scholar] [CrossRef]
  24. Molina-García, J.; Castillo, I.; Sallis, J.F. Psychosocial and environmental correlates of active commuting for university students. Prev. Med. 2010, 51, 136–138. [Google Scholar] [CrossRef] [PubMed]
  25. Iwińska, K.; Blicharska, M.; Pierotti, L.; Tainio, M.; de Nazelle, A. Cycling in Warsaw, Poland—Perceived enablers and barriers according to cyclists and non-cyclists. Transp. Res. Part A Policy Pract. 2018, 113, 291–301. [Google Scholar] [CrossRef] [PubMed]
  26. Eurostat Cities Database. Available online: https://ec.europa.eu/eurostat/web/cities/data/database (accessed on 20 September 2019).
  27. European Tertiary Education Register. Available online: https://ec.europa.eu/education/european-tertiary-education-register_en (accessed on 5 October 2019).
  28. Tertiary Education Statistics. Available online: https://ec.europa.eu/eurostat/statistics-explained/index.php/Tertiary_education_statistics (accessed on 5 October 2019).
  29. ETER. Available online: https://www.eter-project.com (accessed on 12 October 2019).
  30. Jan, Ž.; Lorber, L.; Vaupotič, N.; Jesenšek, M.; Turk, J. Letno Poročilo Univerze v Mariboru za Leto 2017; University of Maribor: Maribor, Slovenia, 2017. [Google Scholar]
  31. Kos, I.; Ketiš, I.; Budar, A.; Čanč, B.; Zorko, L.; Kodrič Vuk, L.; Jambrovič, U.; Klinc, A.; Keuc, B.; Krmelj, V.; et al. Maribor Ima Priložnost: Trajnostna Urbana Strategija Mestne Občine Maribor. 1915. Available online: http://www.maribor.si/dokument.aspx?id=28079 (accessed on 20 October 2019).
  32. Vešligaj, S. Population Density According to the Distance to the City Centre Per 1 km; Služba za Geografski Informacijski Sistem, Obdelavo Podatkov in Informatiko: Municipality of Maribor, Slovenia, 2015. [Google Scholar]
  33. Festinger, L. A Theory of Cognitive Dissonance; Stanford University Press: Palo Alto, CA, USA, 1962; Volume 2, p. 291. [Google Scholar]
  34. Balant, M.; Klemenčič, M.; Kukovec, M.; Lep, M.; Mesarec, B.; Mladenovič, L.; Plevnik, A.; Rotar, J. Celostna Pormetna Strategija Mesta Maribor. 2015. Available online: http://sptm.si/wp-content/uploads/2019/04/Maribor-CPS-2015.pdf (accessed on 1 October 2019).
  35. Maribor Cycling Network. Available online: https://ibikemaribor.com/ (accessed on 2 September 2019).
  36. List of Cyclists and Pedestrians. Available online: http://www.kolesarjiinpesci.si/ (accessed on 15 October 2019).
  37. Metro Minuta Maribor. Available online: http://www.kolesarjiinpesci.si/wp-content/uploads/2018/11/MetroMINUTA_lista-kolesarjev-in-pescev_.pdf (accessed on 15 August 2019).
  38. Stud-Bike. Available online: https://www.stud-bike.si/ (accessed on 10 September 2019).
  39. Šenk, P.; Pogačar, K. Tracking Contemporary Streetscape Transformation Processes—Two Case Studies from Slovenia Sledovanie aktuálneho procesu transformácie ulíc—Dve prípadové štúdie zo Slovinska. Archit. Urban. 2019, 1–2, 60–73. [Google Scholar]
Figure 1. Distribution of cities according to population size in the European Union (EU) [26].
Asi 03 00006 g001
Figure 2. Research area, including locations of faculties in city center of Maribor. Note: 11 faculties are located on 7 different locations (legend: 1—Faculty of Medicine (MF); 2—Faculty of Natural Sciences and Mathematics (FNM); 2—Faculty of Education (PeF); 2—Faculty of Arts (FF); 3—Faculty of Law (PF); 4—Faculty of Civil Engineering, Transportation Engineering, and Architecture (FGPA); 4—Faculty of Chemistry and Chemical Engineering (FKKT); 4—Faculty of Mechanical Engineering (FS); 5—Faculty of Electrical Engineering and Computer Science (FERI); 6—Faculty of Economics and Business (EPF); 7—Faculty of Health Sciences (FZV)).
Asi 03 00006 g002
Figure 3. Population density according to the distance to the city center per 1 km (within 1st km—17,402 inhabitants; within 2nd km—30,441 inhabitants, within 3rd km—29,856 inhabitants, etc.) [32].
Asi 03 00006 g003
Figure 4. Cycling network in Maribor [4].
Asi 03 00006 g004
Figure 5. Frequency of cycling among students of the University of Maribor.
Asi 03 00006 g005
Figure 6. Frequency of cycling among students per faculties of the University of Maribor as percentages.
Asi 03 00006 g006
Table 1. Demographic characteristics of the sample.
Demographic Characteristics% (n)
GenderMale32.8% (124)
Female67.2% (254)
Age19–2148.4% (181)
22–2548.4% (181)
26–433.2% (12)
FacultyFF16% (61)
EPF6.8% (26)
FERI12.6% (48)
PeF8.9% (34)
FGPA7.9% (30)
FKKT3.1% (12)
FZV10.8% (41)
MF9.7% (37)
FNM5% (19)
FS9.7% (37)
PF9.4% (36)
Distance of living from the facultyLess than 3 km52.9% (202)
3–5 km11% (42)
5–10 km7.6% (29)
More than 5 km28.5% (109)
Legend: Faculty of Medicine (MF), Faculty of Natural Sciences and Mathematics (FNM), Faculty of Education (PeF), Faculty of Arts (FF), Faculty of Law (PF), Faculty of Civil Engineering, Transportation Engineering and Architecture (FGPA), Faculty of Chemistry and Chemical Engineering (FKKT), Faculty of Mechanical Engineering (FS), Faculty of Electrical Engineering and Computer Science (FERI), Faculty of Economics and Business (EPF), Faculty of Health Sciences (FZV).
Table 2. Determinants of cycling frequency.
BSE Bβtp
Ecological factors−0.030.07−0.02−0.390.70
Infrastructure−0.130.09−0.07−1.430.15
Physical factors−0.150.06−0.13−2.650.01
Convenience0.300.070.254.500.00
Conformity to a social norm0.000.050.000.070.94
Complementarity0.080.070.061.190.24
Not owning a car0.080.040.081.680.09
Health−0.170.06−0.14−2.740.01
Fear of theft−0.170.05−0.16−3.410.00
No desire to cycle−0.270.05−0.26−5.050.00
Inconvenient weather circumstances0.100.050.091.940.05
Gender−0.260.14−0.09−1.870.06
Age0.010.030.010.300.77
Socioeconomic status (SES)0.150.050.132.910.00
Note: R2 = 0.31, Adjusted R2 = 0.28.

