1. Introduction
Solar energy can be utilized to produce both electricity and heat. Concentrated solar power collectors (CSPs) have received significant attention for their electricity generation capability. Thermal storage integrated CSPs overcome the intermittency of solar radiation. The thermo-physical properties of the heat transfer fluids (HTF) and the thermal energy storage (TES) materials are key to enhancing the system efficiency. Molten salts, such as alkali nitrates and alkali carbonates, are considered as alternatives to conventional HTF in CSP. However, the heat capacity of the molten salts is lower than that of conventional HTF.
Reviews of different concentrated solar power (CSP) collectors’ applications have been available for several decades [
1,
2,
3,
4,
5,
6,
7]. However, a possible improvement of CSP technologies can be realized through integration into a hybrid system that uses a CSP–Organic Rankine Cycle ORC system. This simultaneously provides electricity and heat [
8,
9,
10,
11,
12,
13,
14,
15,
16,
17,
18,
19,
20,
21,
22,
23,
24,
25,
26,
27,
28,
29,
30,
31,
32,
33,
34,
35,
36,
37,
38,
39].
In general, the CSP power generation systems use solar concentrators to focus solar radiation onto a receiver that carries a heat transfer fluid which is heated to a high temperature due to highly concentrated solar radiation. Generally, in most CSP plants, the heat transfer fluid is thermal oil. This heat transfer fluid goes to a conventional steam turbine, using water as coolant or an Organic Rankine Turbine generator (ORC) using refrigerant, where electricity is generated [
1,
7]. Thermal energy storage is an integral part of a CSP plant in order to overcome the intermittency of solar radiations for continuous production of power during the night and on cloudy days [
8,
9].
Nanofluid is a mixture of an HTF and nanoparticles and can be used to enhance the thermo-physical properties of HTF. Recently, it was proposed in references [
10,
11,
12,
13,
14,
15,
16,
17,
18] to nanofluids as a heat transfer fluid in solar power collectors, and to investigate their optical properties, which are essential to the phenomenon of direct energy absorption. The results reported in these references showed that the maximum allowable temperature at which the absorption coefficient does not change significantly is as high as 500 °C. This makes metal-oxide nanoparticles suitable for use at very high temperatures in heat transfer fluids in CSP plants.
Heat transfer fluids with nanoparticles provide significant benefits in CSP solar power plants because of the enhancement of heat transfer, thermodynamic and thermophysical properties in absorbing heat induced by solar radiation. Enhanced heat transfer by the use nanofluids yields improvement to the receiver performance and absorption efficiency that may reduce the number of CSP collectors required to produce power using the basis fluid as thermal oil [
28,
29,
30,
31,
32,
33,
34,
35].
It has been shown theoretically and experimentally that, in low-temperature solar collectors at around 100 °C, efficiency can be improved by using nanofluids [
10,
11]. A paper was presented by Calise and Vanoli [
12] on the design procedure and a simulation model of a novel concentrating PVT collector. The model considered a parabolic trough concentrator and a linear triangular receiver. This model was based on zero-dimensional energy balances. The simulation model calculated the temperatures of the main components of the system and the main energy flows. The results showed that the performance of the system is excellent even when the fluid temperature is very high (>100 °C).
Bozorgan and Shafahi [
13] presented a paper review on nanofluid as a heat transfer absorber fluid to enhance heat transfer in solar devices. This review summarized the research done in recent years on the nanofluids’ applications in solar thermal engineering systems. The review article provided comprehensive information for the design of a solar thermal system working at the different operating conditions.
The enhancement of the thermal properties of various high-temperature nanofluids for solar thermal energy storage application in concentrating solar power (CSP) systems, the thermo-physical properties of the heat transfer fluids (HTF), and the thermal energy storage (TES) materials were studied and presented by reference [
14]. In this study, silica (SiO
2) and alumina (Al
2O
3) nanoparticles, as well as carbon nanotubes (CNT), were dispersed into a molten salt and a commercially available HTF. Dimensional analyses and computer simulations were performed to predict the enhancement of thermal properties of the nanofluids.
A model was presented by Saadatfar [
18] for the analysis of thermodynamic cycle of the solar thermal production of power, heating and cooling utilizing nanofluid as a working fluid in Organic Rankine Cycle. The initial studies in reference [
18] were performed with silver-nano pentane as a working fluid in the cycle. An available modeling program was used by this reference to model and investigate the performance of the system with nano organic fluid. This paper concluded that under optimum conditions, the thermodynamic efficiencies were higher than those obtained from the base fluid.
Reference [
19] reported and analyzed high-temperature parabolic trough collectors (PTC) coupled with an Organic Rankine Cycle (ORC) to carry out optimization at both levels: financially and energetically. They investigated the solar field, the storage tank and the ORC module under many conditions of collecting solar areas and storage tank volumes. They also presented an economic comparison for different commercial solar collectors.
Adnan Alashkar and Mohamed Gadall [
20] studied the performance of Parabolic Trough Solar Collector (PTSC)-based power generation plant, the effect of adding an Organic Rankine Cycle (ORC), and a Thermal Energy Storage (TES) system and the most efficient fluid on the performance and financial metrics of the PTSC-power plant. The simulation results of this paper showed that Benzene is the most efficient organic fluid, having the highest thermal and exergetic efficiency, and the lowest pumping power when compared to other organic fluids. Finally, thermodynamic modeling of ORC was reported in the literature by Saloux et al. [
21], Sami [
22,
23], and Jo-ao [
24] where low- and high-grade waste heat is converted into power.
In this paper, we present a numerical model to simulate and study the behavior of heat transfer fluid with different nanofluids circulating in the parabolic trough solar collector loop to drive an Organic Rankine Cycle with patent quaternary refrigerant mixture, under different solar radiations. The model is based upon the mass and energy equations written for the heat transfer fluid with nanofluids. These equations were integrated and solved to predict the behavior of the parabolic trough collectors (PTC) coupled with an Organic Rankine Cycle (ORC) under different operating conditions such as solar radiations, nanofluid flow rates, ambient temperatures, and various volumetric nanofluid concentrations. This study is intended to investigate the enhancement effect and characteristics of nanofluids Al2O3, CuO, Fe3O4 and SiO2 in an integrated concentrating solar power (CSP) with ORC, and TES under different solar radiations, angle of incidence, and different nanofluids concentrations. Also, the objectives of this study are to investigate impact of the nanofluids Al2O3, Fe3O4, CuO and SiO2 on the CSP solar collector performance compared to thermal oil base fluid under study at similar conditions. This research represents a significant contribution to the nanofluid science where nanofluid are nanofluids are used to enhance performance of CSP solar collectors and integrated ORCs compared to thermal oil as base heat transfer fluid.
2. Mathematical Model
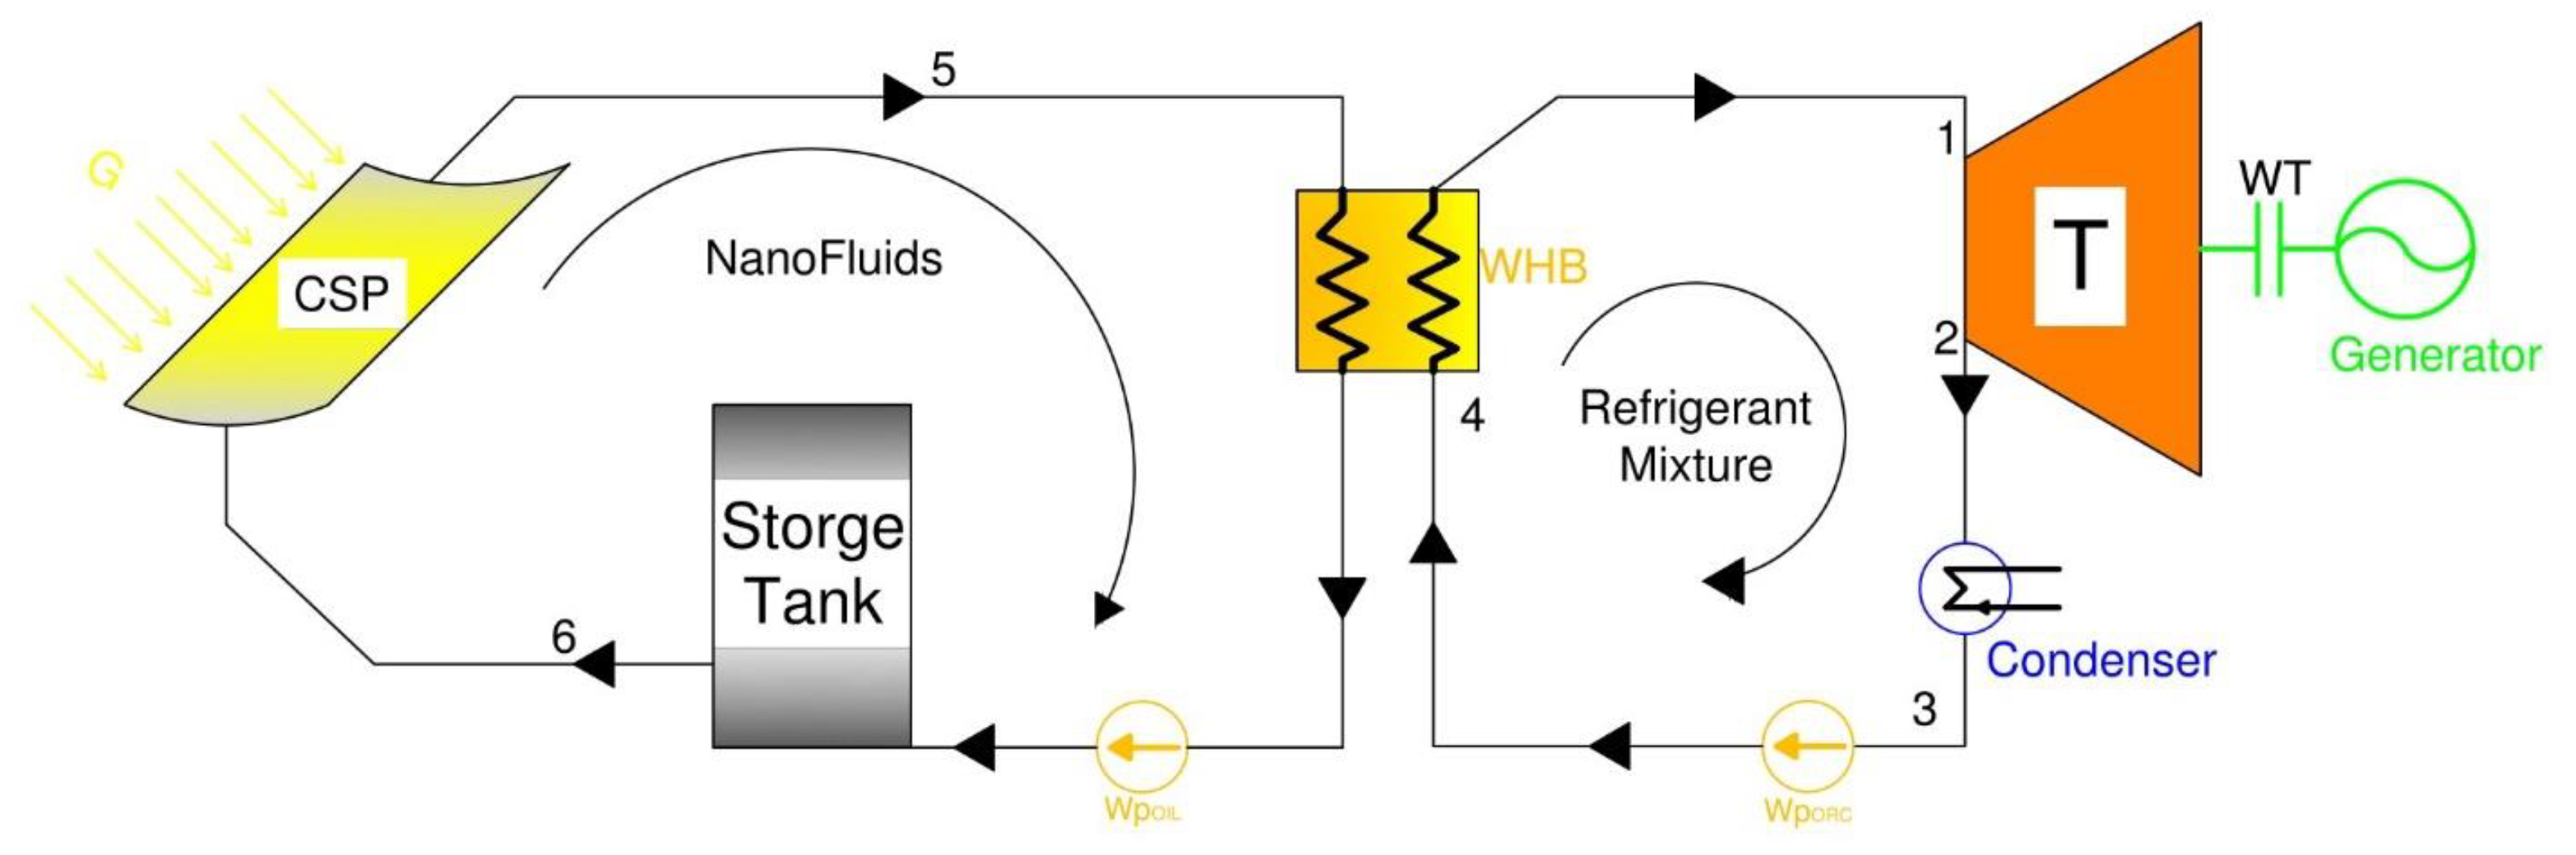
The mathematical model was established based on the mass and energy equations written to describe the behavior the nanofluids driving an Organic Rankine Cycle, ORC, with a refrigerant mixture as shown in
Figure 1. This figure depicts the proposed CPS system. The CPS thermal loop is composed of a CPS solar collector, thermal storage tank, and pump, as well as the waste heat boiler of the ORC. The solar radiation is absorbed by the CSP solar collector and converted into thermal energy that heats up the nanofluids and thermal oil circulating in the thermal oil/storage tank loop. The thermal oil is the base fluid heat transport fluid with nanofluids is used to drive the ORC circuit.
The thermal storage tank is used to store thermal energy, and during the intermittent solar radiation periods, it supplies heat to the ORC waste heat boiler. In the ORC circuit, the thermal heat absorbed evaporates the refrigerant mixture that drives the turbine. In the turbine, the thermal energy is converted into kinetic energy and produces power at the turbine shaft and the generator. The low-pressure vapor is condensed in the condenser into liquid and pumped back to the waste heat boiler. The refrigerant mixture used in the ORC loop is an environmentally sound quaternary mixture composed of R134a, R245fa, R125, R236fa [
23]. Thermodynamic and thermophysical properties were obtained at REFPROP [
27].
Figure 2 depicts the thermodynamic properties and the pressure-enthalpy diagram of the mixture R134a, R245fa, R125, R236fa, where it is quite clear that one of the most important characteristics is the variable saturation temperature and glide temperature. This feature is pivotal in enhancing the Organic Rankine Cycle efficiency.
In the following sections, the different equations of mass and energy are presented. It is assumed in the model that the nanofluid is homogeneous, isotropic, incompressible, and Newtonian; that inlet velocity and inlet temperature are constant; and that the thermophysical properties of the nanofluids are constant. In the following, the conservation mass and energy equations and heat transfer equations are written and presented for each element of the nanofluids.
2.1. CSP Solar Collector Model
The power absorbed from solar radiation by the CSP solar collector can be determined by the following [
3,
4,
5,
6,
23];
where:
DNI: Solar radiation (w/m2)
Θ: Angle of incidence
ηopt: Optical efficiency
IAM: Incidence angle modifier.
Rs: Row shadow
El: End losses
SFAval: Solar field available
The CSP collected power is given by;
where:
Pabs: Collector power absorbed by CSP defined in Equation (1)
Plosscol: Collector thermal losses of the CSP.
Plosspip: solar field piping losses.
The collected power calculated in Equation (2) is transferred to the heat transfer fluid, thermal oil, and nanofluids loop. It is also assumed that this thermal energy will be accumulated in the thermal storage tank that supplies the thermal energy to drive the ORC cycle.
The CSP collector thermal losses are calculated by Equations (3)–(5);
Readers interested in the detailed calculation of the collector thermal losses are advised to consult references [
3,
4,
5,
6,
23].
On the other hand, the piping losses are determined from the following equation:
Readers interested in the detailed calculation of the collector piping losses are advised to consult references [
3,
4,
5,
6,
23].
Finally, the power of the CSP collector is
where Equations (3) and (6) define the collector thermal losses
and piping losses,
, respectively.
The mass flow rate of the basic heat transfer fluid, thermal oil, can be given by the following:
where
The Dowtherm fluid was used in this CSP loop since it offers good thermal stability at temperatures up to 625 °F (330 °C). The maximum recommended film temperature is 675 °F (360 °C). Between 550 °F and 600 °F (290 °C and 315 °C), its stability is 15 to 30 times greater than that of a typical hot oil. Where the specific heat of the thermal oil is [
37]:
where
Toil is the thermal
oil temperature.
The thermal heat accumulated in the thermal storage tank during the charging process is:
where
is the oil flow rate obtained from Equation (8) and
Cpoil is the specific heat of thermal oil in the base fluid.
The thermal heat during discharging process is [
31]:
The energy balance at the ORC cycle gives the following [
23]:
where,
h1: enthalpy at the outlet of the waste heat boiler (kj/Kg)
h2: enthalpy at the exit of the vapor turbine (kj/Kg)
h3: enthalpy at the condenser outlet (kj/kg)
h4: enthalpy at ORC pump outlet (kj/kg)
mref: refrigerant mass flow rate (kg/s)
An environmentally sound quaternary refrigerant with low GWP was used in the ORC cycle and its enthalpies and entropies, as well as its thermal properties, were calculated using the REFPROP program [
23,
24,
25,
26,
27].
The ORC efficiency can be calculated as:
where
Finally, the hybrid system efficiency is:
where
Qcollector represents the collected CSP power and given by Equation (2).
The hybrid system refers to the CSP collector, thermal oil loop and the ORC cycle.
2.2. Nanofluid Heat Transfer Fluid
The basic fluid in the CPS loop is the thermal
oil. However, nanofluids have been added to the thermal oil to enhance its thermal properties. Sharama et al. [
25], Sami [
26] and Marefati et al. [
31] presented equations to calculate the thermophysical and thermodynamic properties of nanofluids such as specific heat, thermal conductivity, viscosity and density, employing the law of mixtures as a function of the volumetric concentration of nanoparticles;
where α represents a particular thermophysical property of the nanofluid under investigation.
The nanofluid thermal and thermophysical properties, α
total, can be calculated as follows:
where Φ represents the nanoparticles volumetric concentration.
The thermal conductivity is related to thermal diffusivity and density of the nanofluids as follows:
where
Cp is the specific heat, α is the thermal diffusivity,
λ and
ρ represent the thermal conductivity and density, respectively.
The specific heat is calculated for nanofluids as follows [
25,
26,
31]:
where “
nf” and “
bf” refer to nanofluid and basic fluid, respectively.
Ø is the nanofluid particle concentration.
ρ represents the density.
The density of nanofluids can be written as follows [
25,
26,
31]:
ρp represents the density of the nanoparticle.
2.3. Numerical Procedure
The model describing the energy conversion mechanisms taking place during energy conversion in the CSP, thermal oil loop and the ORC cycle was presented in Equations (1)–(23). The logical diagram presented in
Figure 3 describes the sequence of steps and calculations of the model in question. The Equations (1)–(23) were integrated in the finite-difference formulations. Iterations were performed using MATLAB iteration techniques until a converged solution is reached with acceptable iteration error as ±0.05. The logical diagram starts inputting solar radiations, nanofluids, specifications and parameters to start the calculation of the CSP collected power, thermal oil flow, storage tank, refrigerant flow and finally the ORC components and work produced. To this end, the CSP, ORC and hybrid system efficiencies were calculated.
3. Discussion and Analysis
Samples of the predicted results for the CSP, thermal oil loop and ORC cycle are presented under different inlet conditions, and are analyzed and discussed in the following sections for different solar radiations—550, 750, 1000 and 1200 w/m2—and different angles of incidence at 8 a.m., 12 p.m. and 16.00 p.m., and with different nanofluids— Al2O3, CuO, Fe3O4 and SiO2—with a mainly thermal oil supply with exit temperatures of the CSP collector of 166.5 °C (331 °F) and 149.5 °C (301 °F), respectively, and an ambient temperature of 25 °C (77 °F). Other output temperatures of the CSP solar collector were considered: 182 °C (361 °F), and 199 °C (391 °F).
Figure 4,
Figure 5 and
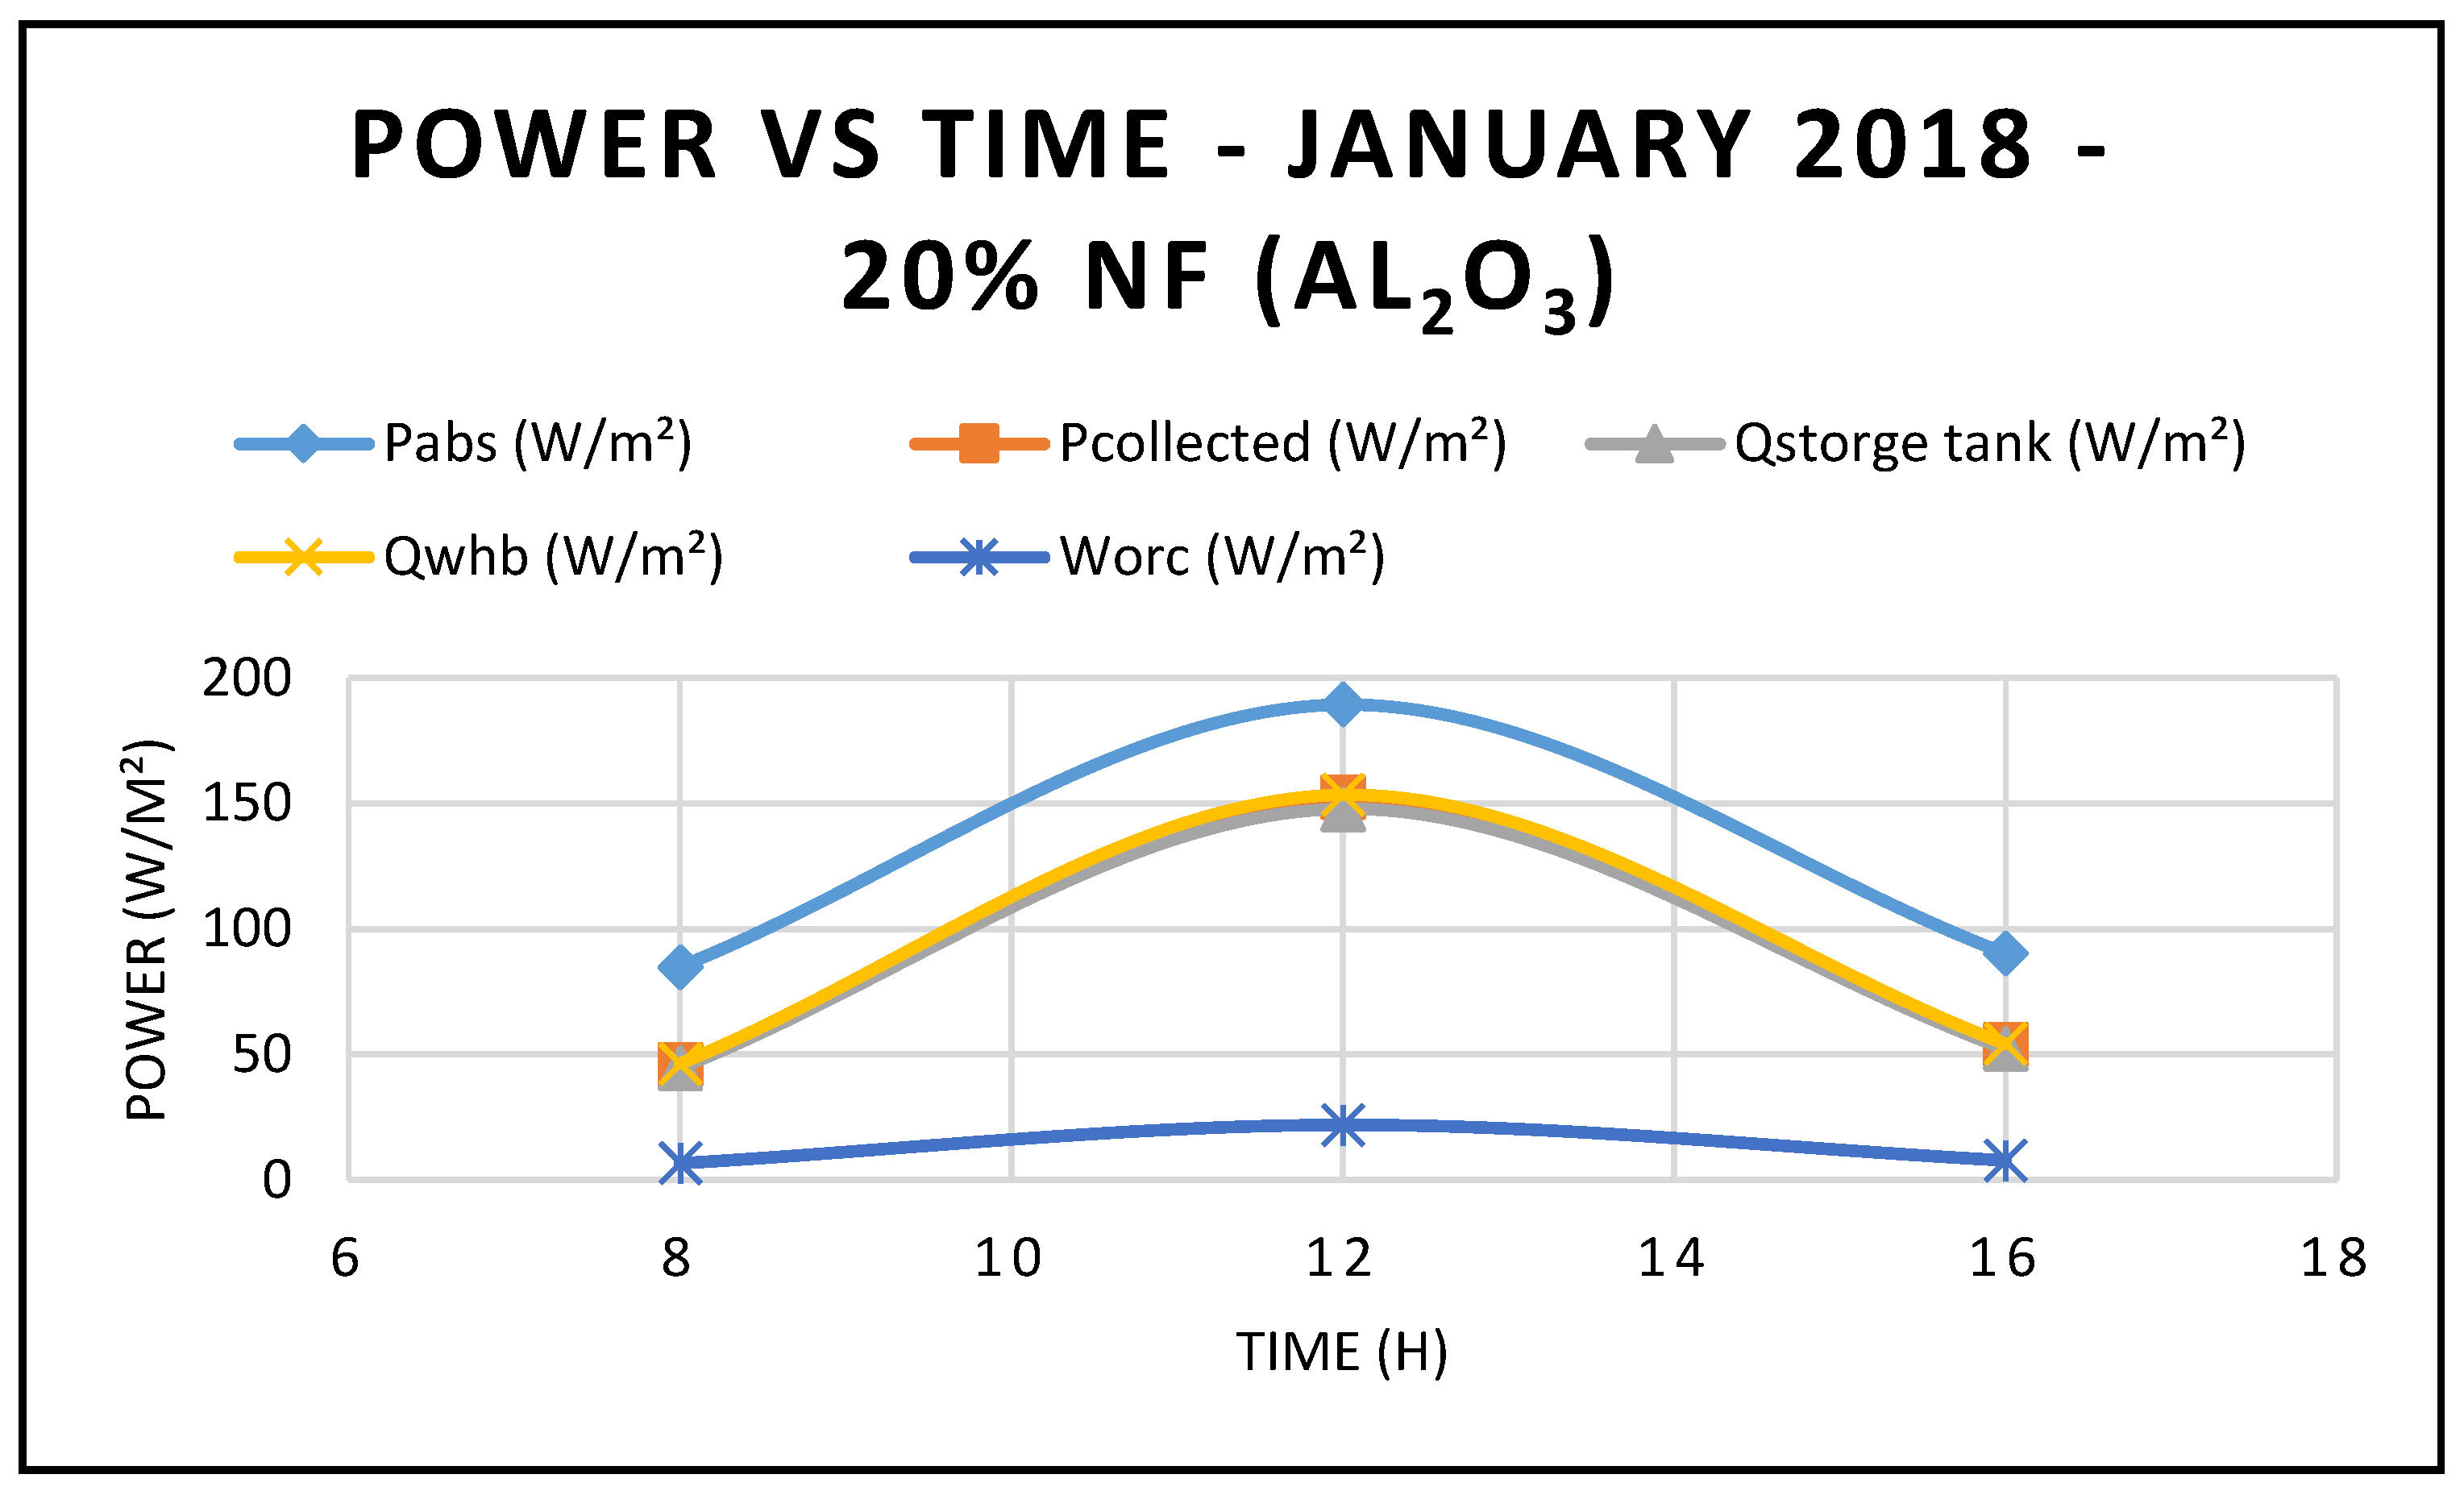
Figure 6 present the results of the characteristics of the CSP hybrid system, including absorbed thermal energy, collected thermal energy by the CSP, thermal energy stored, thermal energy delivered to the waste heat boiler of the ORC and finally work produced by ORC, where the thermal oil is the base fluid at three different times during the day, and with different angles of incidence of the solar radiation: 17.44° at 8:00 a.m., 77.44° at 12:00 p.m. and 137.44° at 16:00 p.m. Specifically,
Figure 3 displays the power absorbed by the CSP at different times during the day and at different angles of incidence in the month of January 2018. It is apparent that the maximum power absorbed by the CSP occurs at midday—12:00 p.m. However, the highest power was observed at 8:00 a.m. due to the solar radiation being higher at 8:00 a.m. compared to at 4:00 p.m. On the other hand,
Figure 4 shows the power produced by the ORC at different times during the day and at different angles of incidence. This figure also confirms that the maximum power produced by the ORC occurs at midday. Furthermore, the main parameters of the CSP system—power absorbed, power collected, storage tank thermal energy and work generated by the ORC at different direct normal insolation and angles of incidence—are depicted in
Figure 3 and
Figure 4. Solar radiations depicted in
Figure 4 were measured at the site using a Hobo environmental station. It is quite evident from the results displayed in these figures that the higher the solar radiation, the higher the characteristics of the CSP system and the power produced by the ORC with the use of thermal oil as base fluid. In addition, the solar radiation intensities corresponding to the different angle of incidences are shown in
Figure 3.
Figure 4 demonstrates that the higher the solar radiation, the higher the efficiencies of CPS and hybrid systems. Furthermore, the results displayed in this figure also demonstrate the maximum efficiencies of the CSP and the hybrid system occur at mid-dia. This can be attributed to the fact that higher solar radiation at higher angles of incidence increases the thermal energy absorbed by the CPS collector and the thermal energy delivered to the waste heat boiler of the ORC.
This, in turn, increases the ORC work produced and the efficiencies of the CPS and the hybrid system as shown in
Figure 5, where the efficiency of CSP collector and hybrid system are plotted against different angle of incidence and thermal oil as base fluid. The results in this figure also clearly demonstrate that the maximum efficiencies occur at 12:00 and solar radiation of 599.67 w/m
2.
Al
2O
3 is one of the most studied nanofluid in the literature [
17,
26,
29,
30]; in the following sections, we present first samples of the results in
Figure 7,
Figure 8,
Figure 9,
Figure 10 and
Figure 11 for 5% and 20% concentrations of nanofluid Al
2O
3. This is followed by a discussion and analysis of the impact of the nanofluid concentration ranging from 1% to 50% of Al
2O
3 in
Figure 12,
Figure 13,
Figure 14,
Figure 15,
Figure 16 and
Figure 17 on the different characteristics of the CSP collector, such as: thermal energy absorbed by solar collector, thermal energy collected, thermal energy in storage tank, thermal energy supplied to the waste heat boiler of ORC, work produced at the ORC’s turbine, and efficiencies of the CSP collector and the CSP hybrid system. On the other hand,
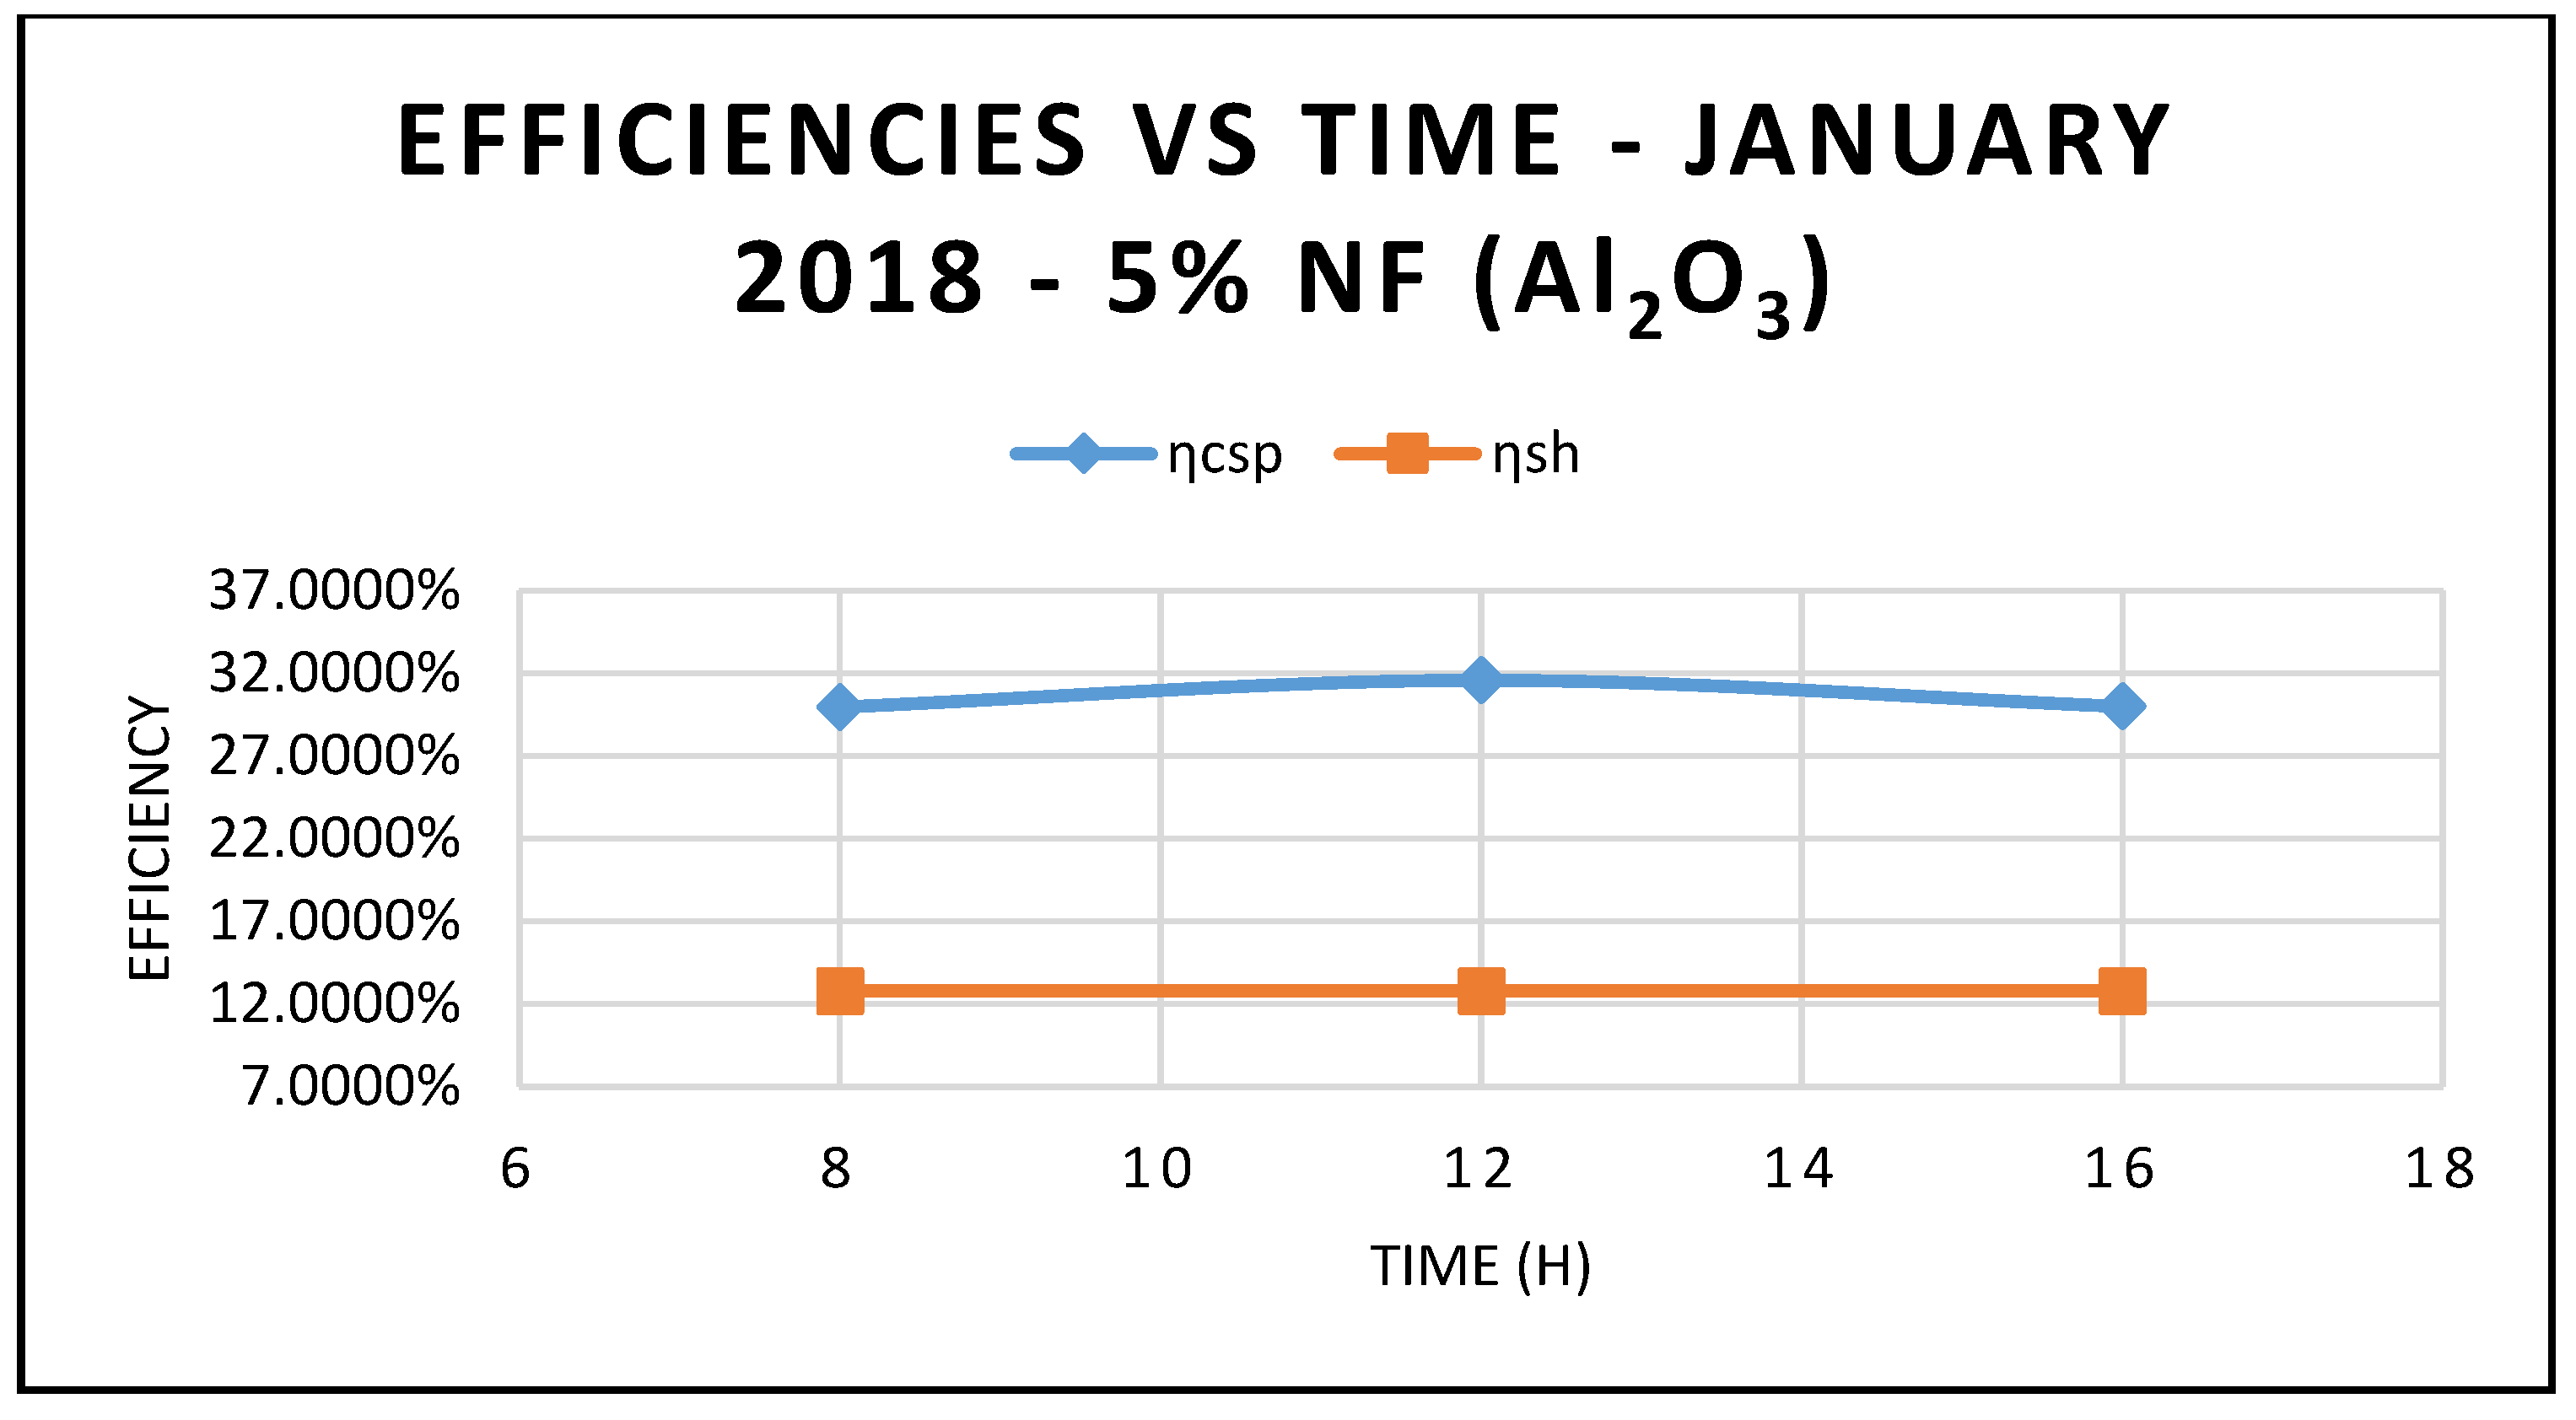
Figure 5 compares the efficiency of the CSP collector and the efficiency of the hybrid system calculated on the basis of Equations (17) and (18), respectively.
As expected, the data displayed in this figure show that those efficiencies are maximized at 12:00 p.m., with solar radiation of 599.674 w/m
2, as shown in
Figure 10.
Furthermore, the predicted results of the CSP system Characteristics using nanofluid Al
2O
3 are displayed in
Figure 9,
Figure 10 and
Figure 11. Nanofluid concentrations of 5% and 20% respectively showed that the CSP system characteristics including efficiencies are enhanced with the higher concentrations of nanofluid Al
2O
3 over the thermal oil as base fluid presented in
Figure 5 and are maximized at midday, when solar radiation is at its highest peak. Also, the depicted results of the efficiencies of the CSP and the hybrid system showed clearly that the CSP efficiency is higher than the hybrid system efficiency and peaked at the midday.
Furthermore,
Figure 12,
Figure 13,
Figure 14 and
Figure 15 demonstrate that the higher the concentration of the nanofluid Al
2O
3, the higher the CSP system characteristics, such as ORC performance, thermal energy at the storage tank, and thermal energy supplied to the waste heat boiler of the ORC. Also, the maximum value was achieved by midday, at which point solar radiation is at its highest, at 599.67 w/m
2 measured at the site. However,
Figure 14 shows that the CSP power collected and calculated by Equation (7) is not significantly influenced by the nanofluid concentrations, since Equation (7) is highly dependent on the thermal and piping losses given by Equations (3)–(6).
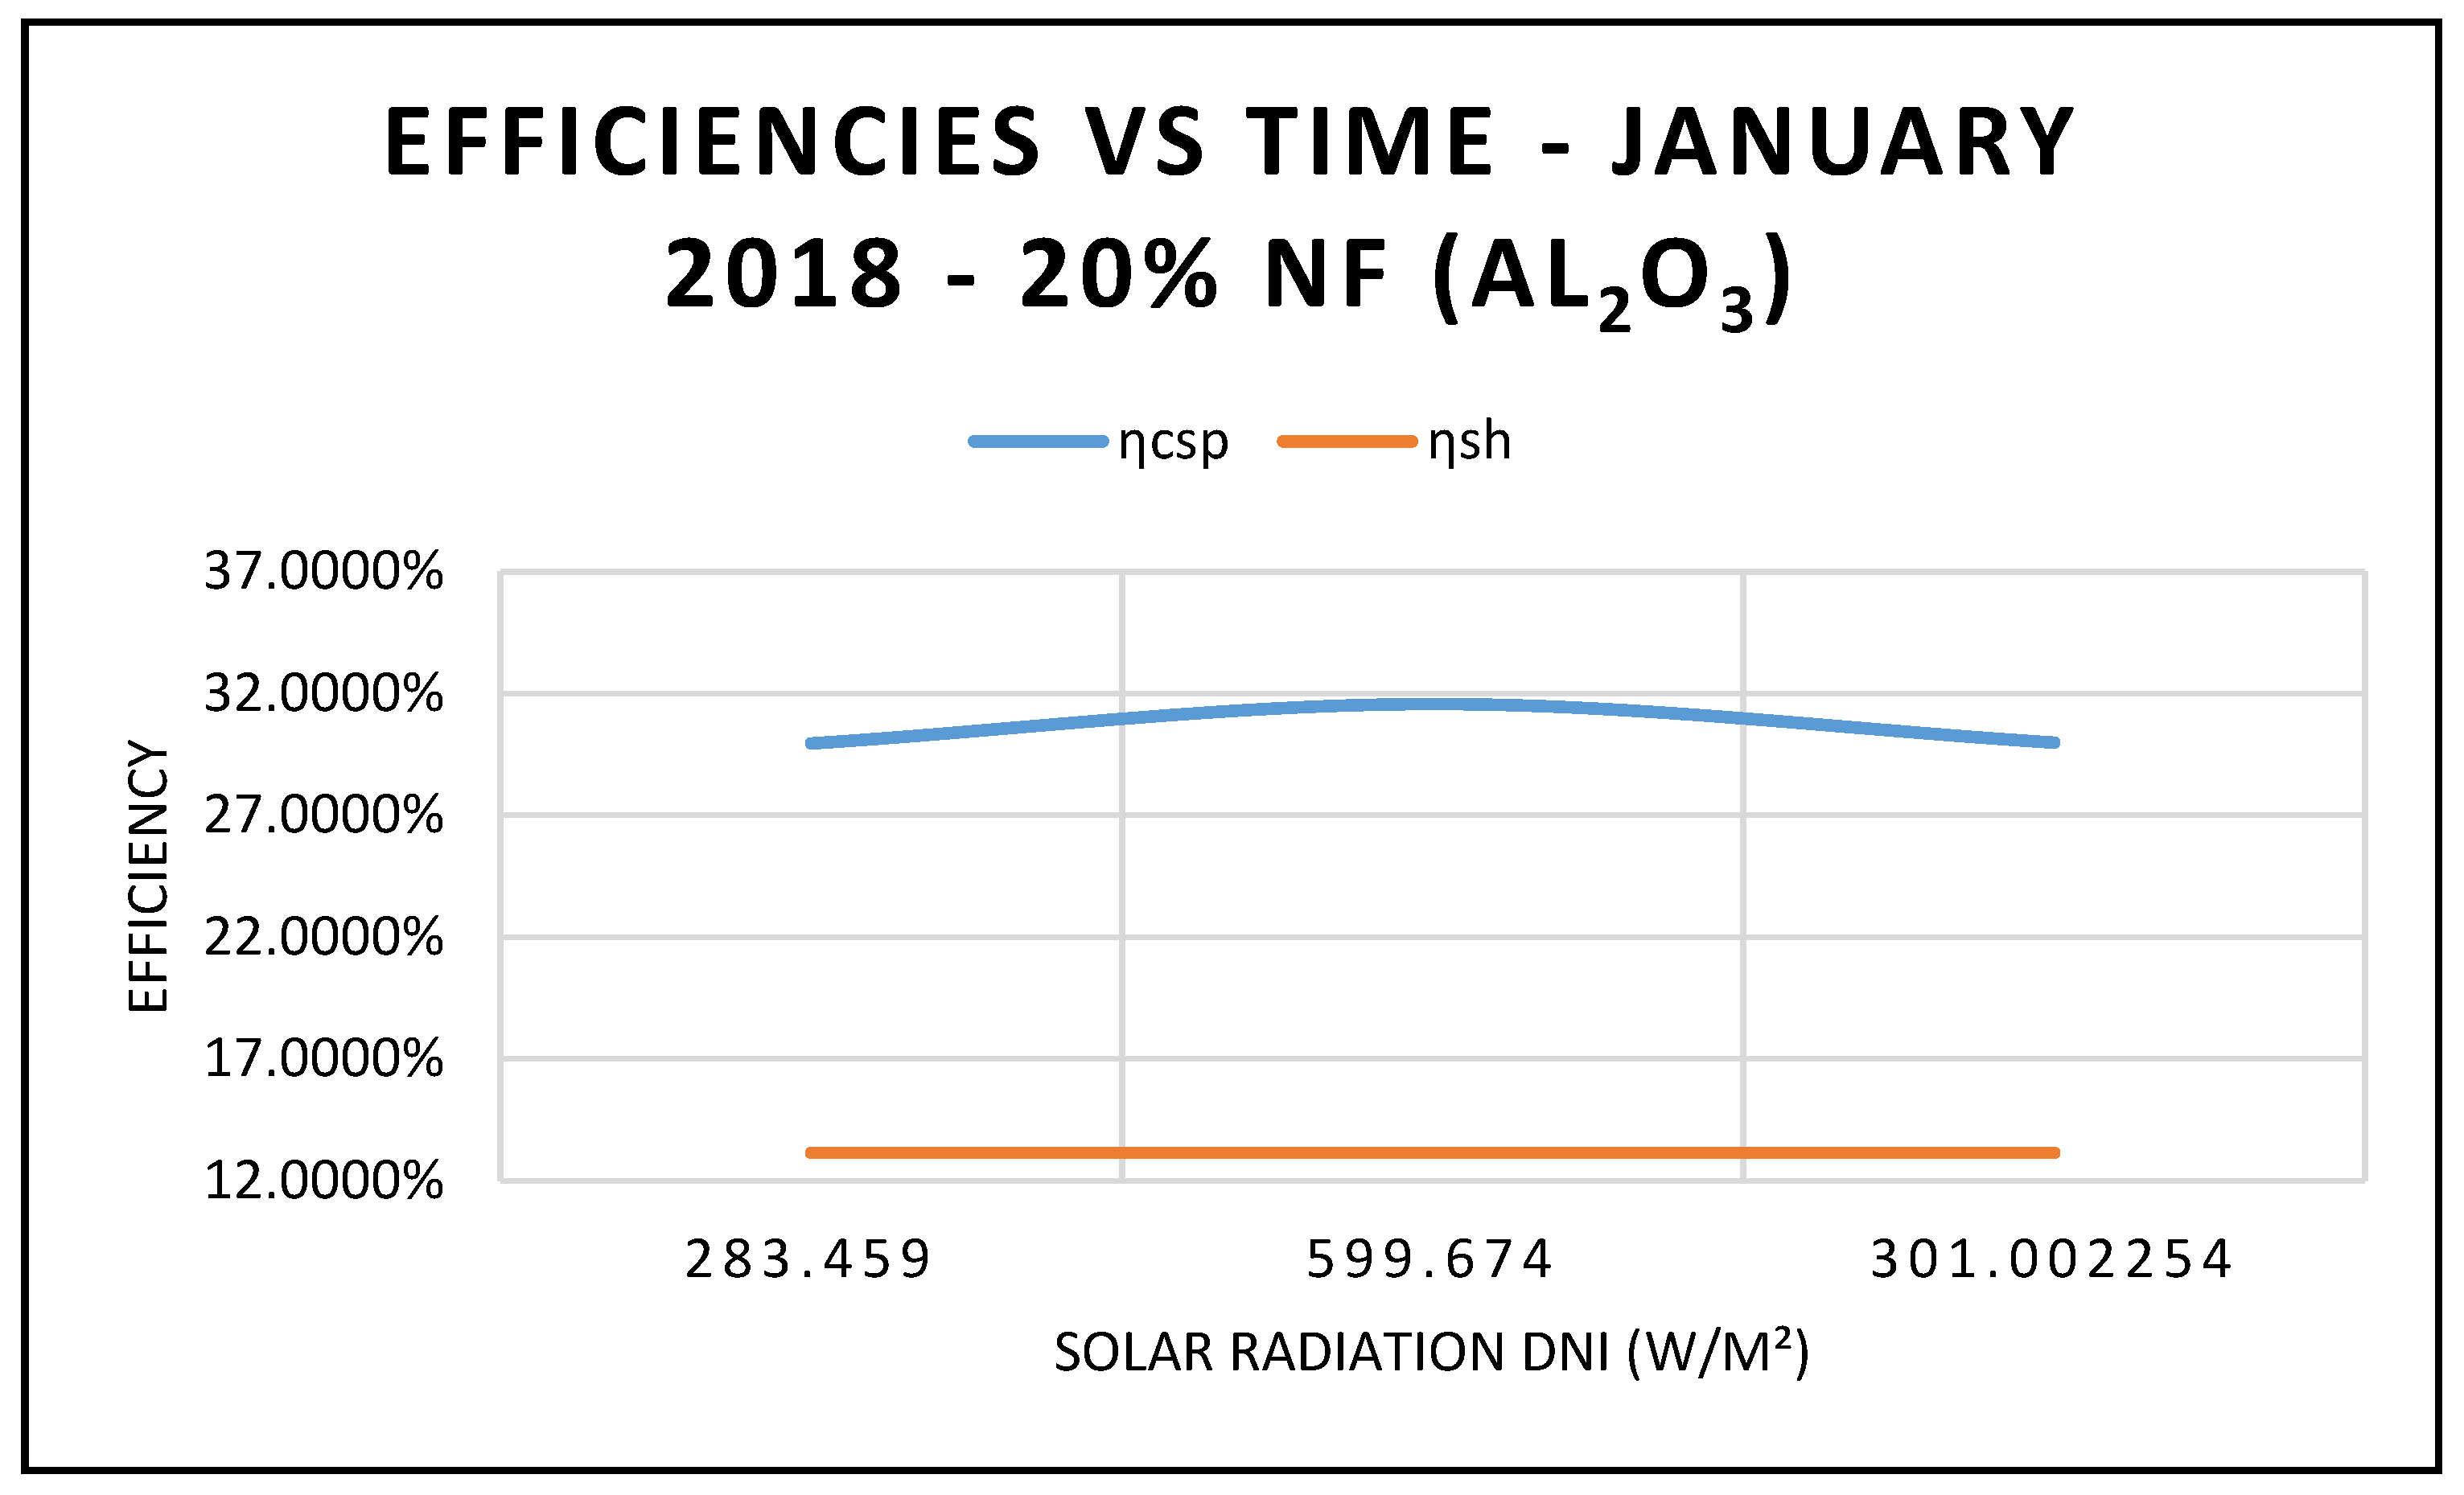
Figure 16 and
Figure 17 display the efficiencies of the CSP collector and the CSP hybrid system, respectively, at different nanofluid concentrations. As expected, the results in these figures clearly indicate that the higher efficiencies of the hybrid system the higher the solar radiations, but, the CSP collector efficiencies are independent of the nanofluid concentrations, as per Equation (17).
Figure 18 depicts the variation of the refrigerant mass flow rate of the ORC cycle at three different times during the day, and different angles of incidence of the solar radiation: 17.44° at 8:00 a.m., 77.44° at 12:00 p.m. and 137.44° at 16:00 p.m. The data displayed in this figure clearly demonstrated that the refrigerant flow is maximized at midday, which reflects on the work produced at the ORC vapor turbine, where its maximum value also occurs at same time.
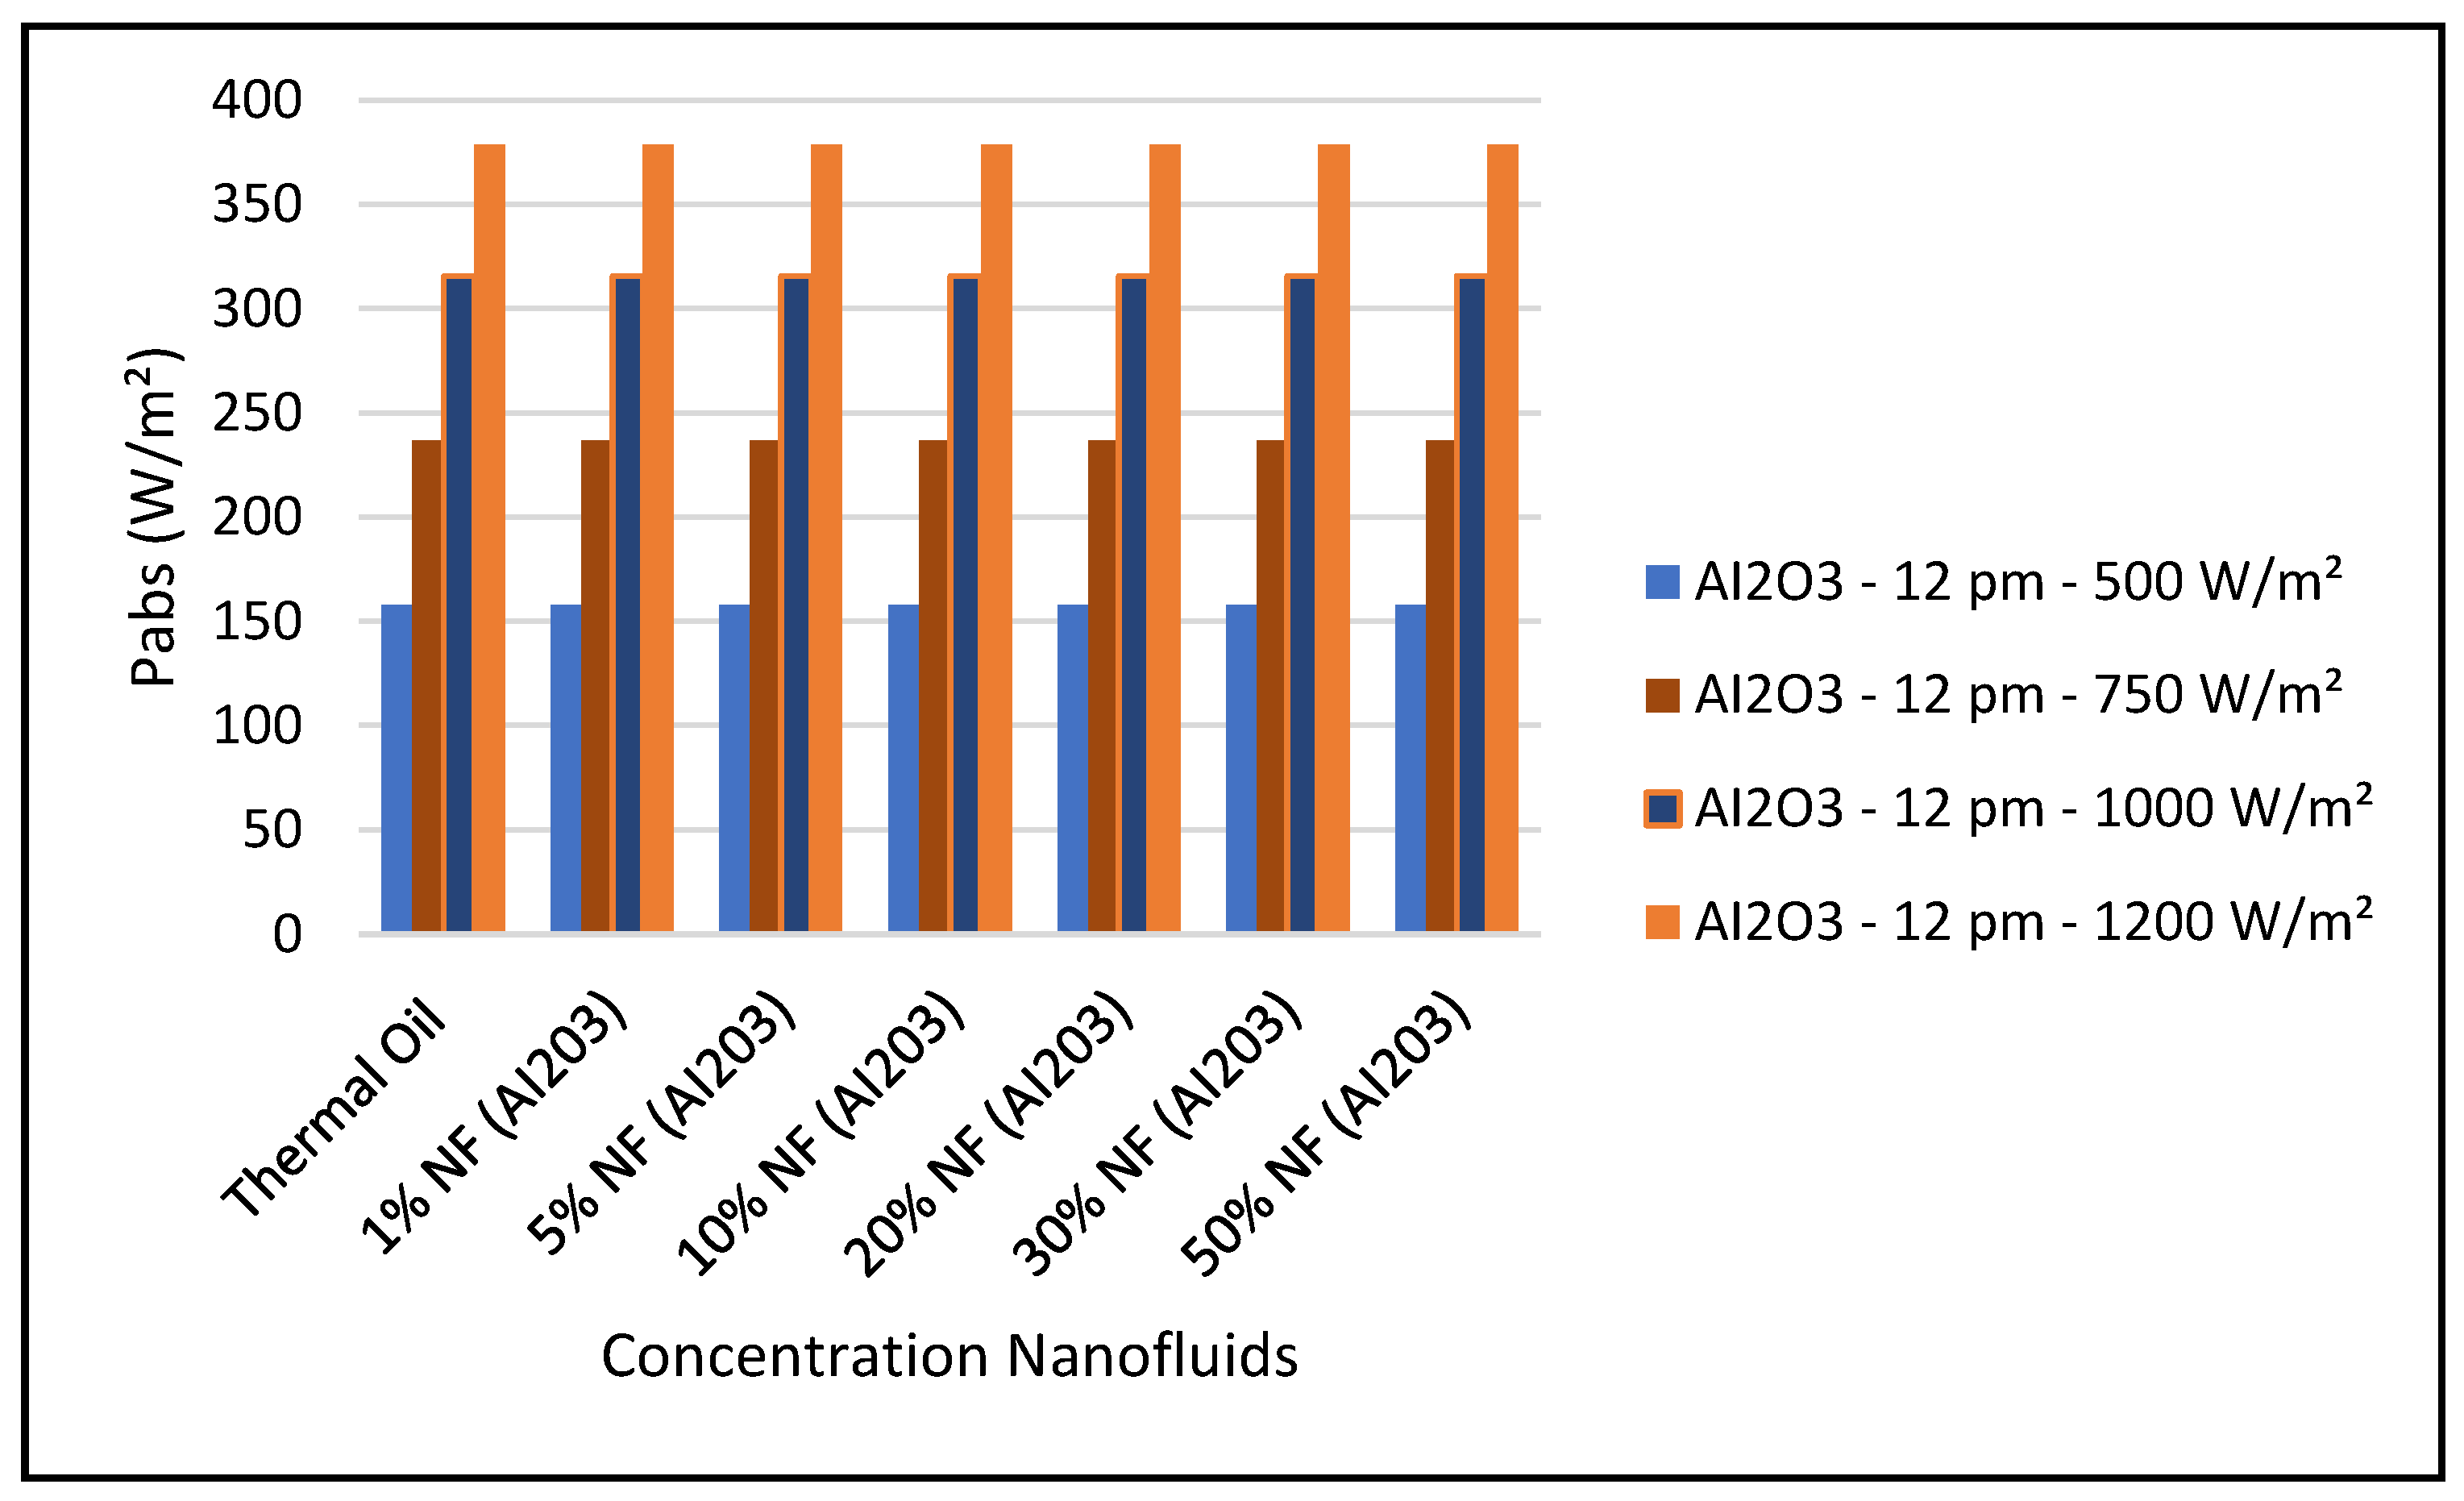
Furthermore, simulated results of characteristics of the CSP collector system under solar radiations of 500, 750, 1000, and 1200 w/m
2 occurring at different times of day and different angles of incidence of the solar radiation; 17.44° at 8:00 a.m., 77.44° at 12:00 p.m. and 137.44° at 16:00 p.m. have been conducted. The purpose of this exercise is to predict the impact of a wide range solar radiations other than those in the previous figures on the characteristics of the CSP collector system.
Figure 19 and Figure 24 present these characteristics at midday. As anticipated, the results displayed in these figures show that higher concentration of the nanofluid Al
2O
3 enhance the different key parameters of the characteristics of the CSP collector such and power absorbed and collected, thermal storage energy, the output work at the ORC, over thermal oil as base fluid. It is noticeable from the results that the ORC key parameters, such as waste heat boiler thermal energy and work produced (cf. Figures 22 and 23), are enhanced with the increase of the solar radiation and the nanofluid concentrations. However, the CSP power absorbed and storage tank thermal energy are only enhanced with the solar radiation. However, it is worthwhile pointing out that nanofluid concentration higher than 20% could result in higher pressure head losses and pumping power losses in the thermal oil loop and that is undesirable. Therefore, it is important for the designer of such systems to exercise caution when using the Al
2O
3 nanofluid [
25,
26,
30]. The data presented in
Figure 19,
Figure 20 and
Figure 21 illustrate that the power absorbed, and power collected by the CSP collector and thermal energy stored in the storage tank are enhanced with the increase of the solar radiation; however, they are independent from the nanofluid Al
2O
3 concentrations and thermophysical properties. This can be interpreted in light of Equations (1)–(6).
Figure 22 and
Figure 23 illustrate that the key parameters of the ORC are waste heat boiler thermal energy supplied to ORC, and the work produced by the vapor turbine of the ORC. The data is as follows.
The figures clearly demonstrate that these key parameters are enhanced by solar radiation and the nanofluid concentrations. Also, in
Figure 24, the CSP system hybrid efficiency is plotted at different concentrations of Al
2O
3 and solar radiations, showing that hybrid system efficiency was mainly enhanced by the increase of the solar radiation and at higher nanofluid Al
2O
3 concentrations over the thermal oil as base fluid. As expected, the maximum efficiency was observed at a solar radiation of 1200 w/m
2.
Other nanofluids, such as CuO, Fe
3O
4 and SiO
2, have received significant attention in the literature, namely, [
25,
26,
30]. In the following section, we will discuss the impact of using these nanofluids as heat transfer fluid in the thermal oil loop of the CSP solar collector on the characteristics of the CSP hybrid system;
Figure 25,
Figure 26,
Figure 27 and
Figure 28. It evident from the results depicted in these figures that the nanofluid CuO has the highest characteristic performance among the other nanofluids in the CSP solar collector system over the thermal oil as base heat transfer fluid. This can obviously be attributed to the higher thermodynamic and thermophysical and heat transfer properties of the nanofluid CuO which contribute to outperform other nanofluids over the base fluid thermal oil.
In particular,
Figure 26 clearly shows that the nanofluid CuO has the highest ORC work produced among the other nanofluids under investigation. This results in enhancing the hybrid CSP solar collector system efficiency compared to the other nanofluids under study. It can also be concluded from the results presented in these figures that, in general, the higher the nanofluid concentration, the higher the hybrid system performance characteristics.
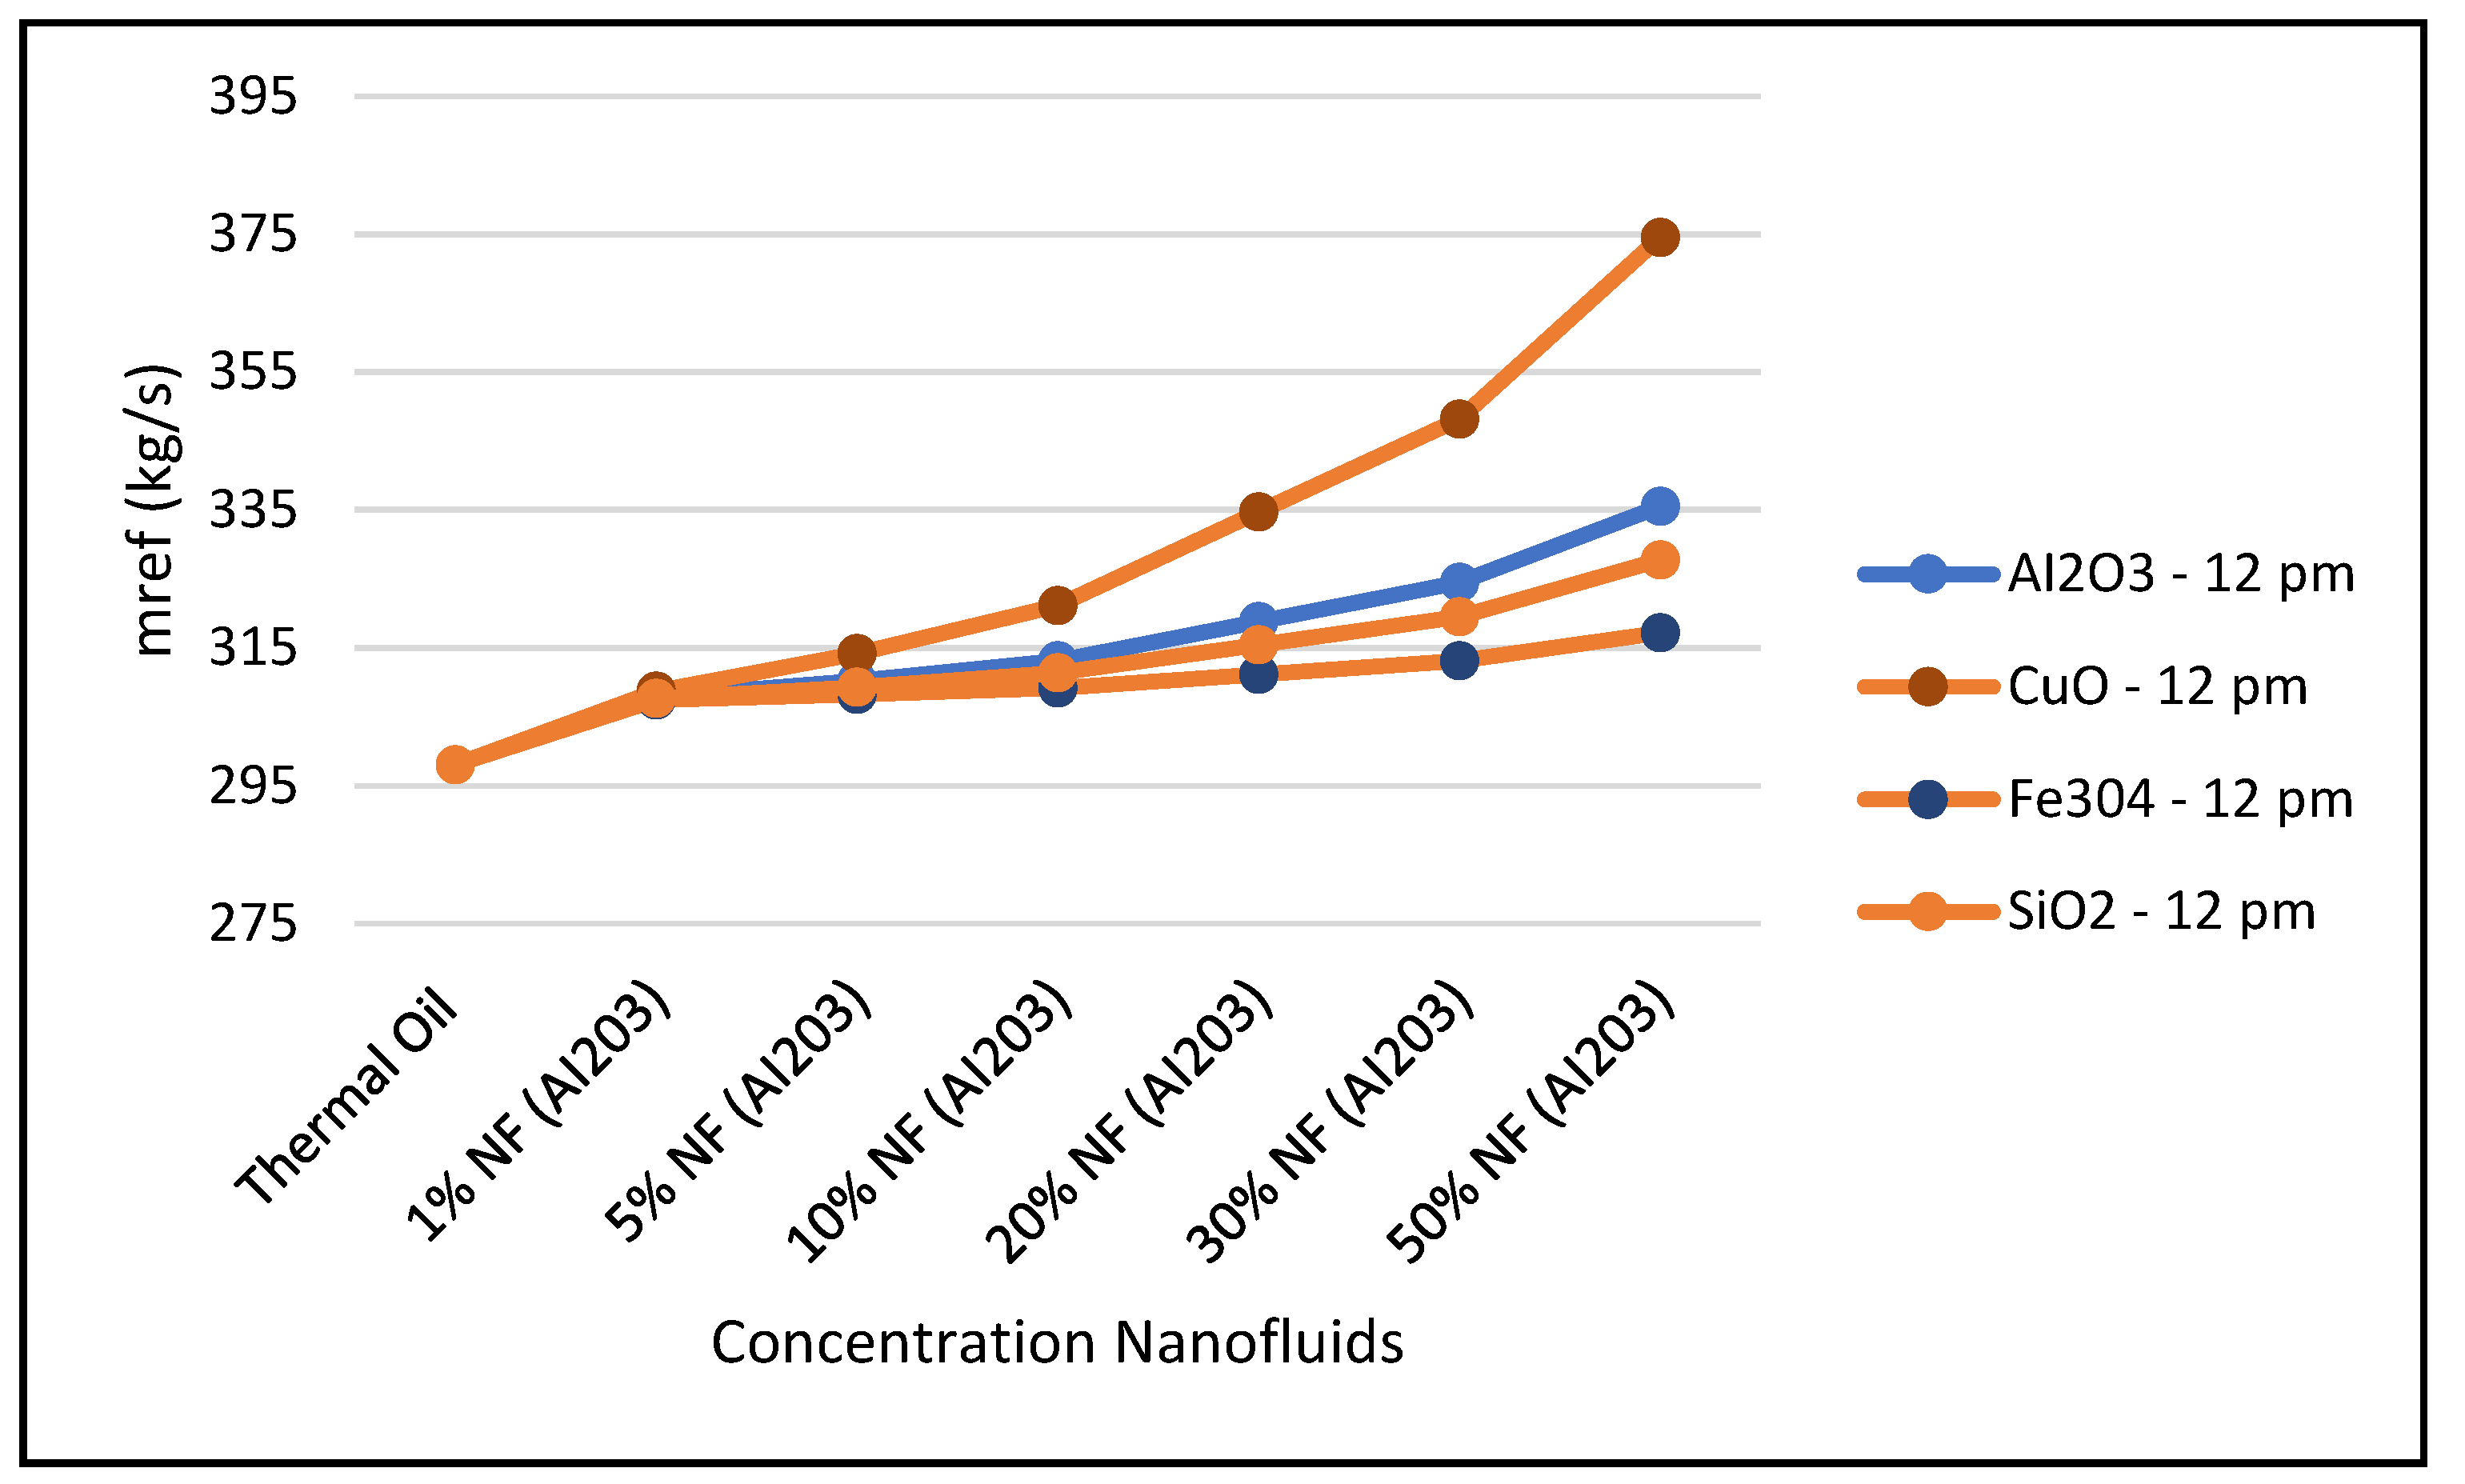
One of the significant parameters for demonstrating the enhancement of the CSP solar collector system is the ORC refrigerant mass flow rate, since this parameter impact the work produced by the ORC and the hybrid system efficiency.
Figure 27 and
Figure 28 show the impact of the various nanofluids considered in this study on the aforementioned parameters. It appears that the higher the concentrations of nanofluids and the higher the solar radiation, the higher the refrigerant mass flow rate and ORC work produced and consequently the CSP hybrid system efficiency. Furthermore,
Figure 25,
Figure 26,
Figure 27 and
Figure 28 also indicate that the nanofluid CuO outperforms other nanofluids Al
2O
3, Fe
3O
4 and SiO
2 and has the highest CSP solar collector performance compared to the other nanofluids and thermal oil base fluid under study.
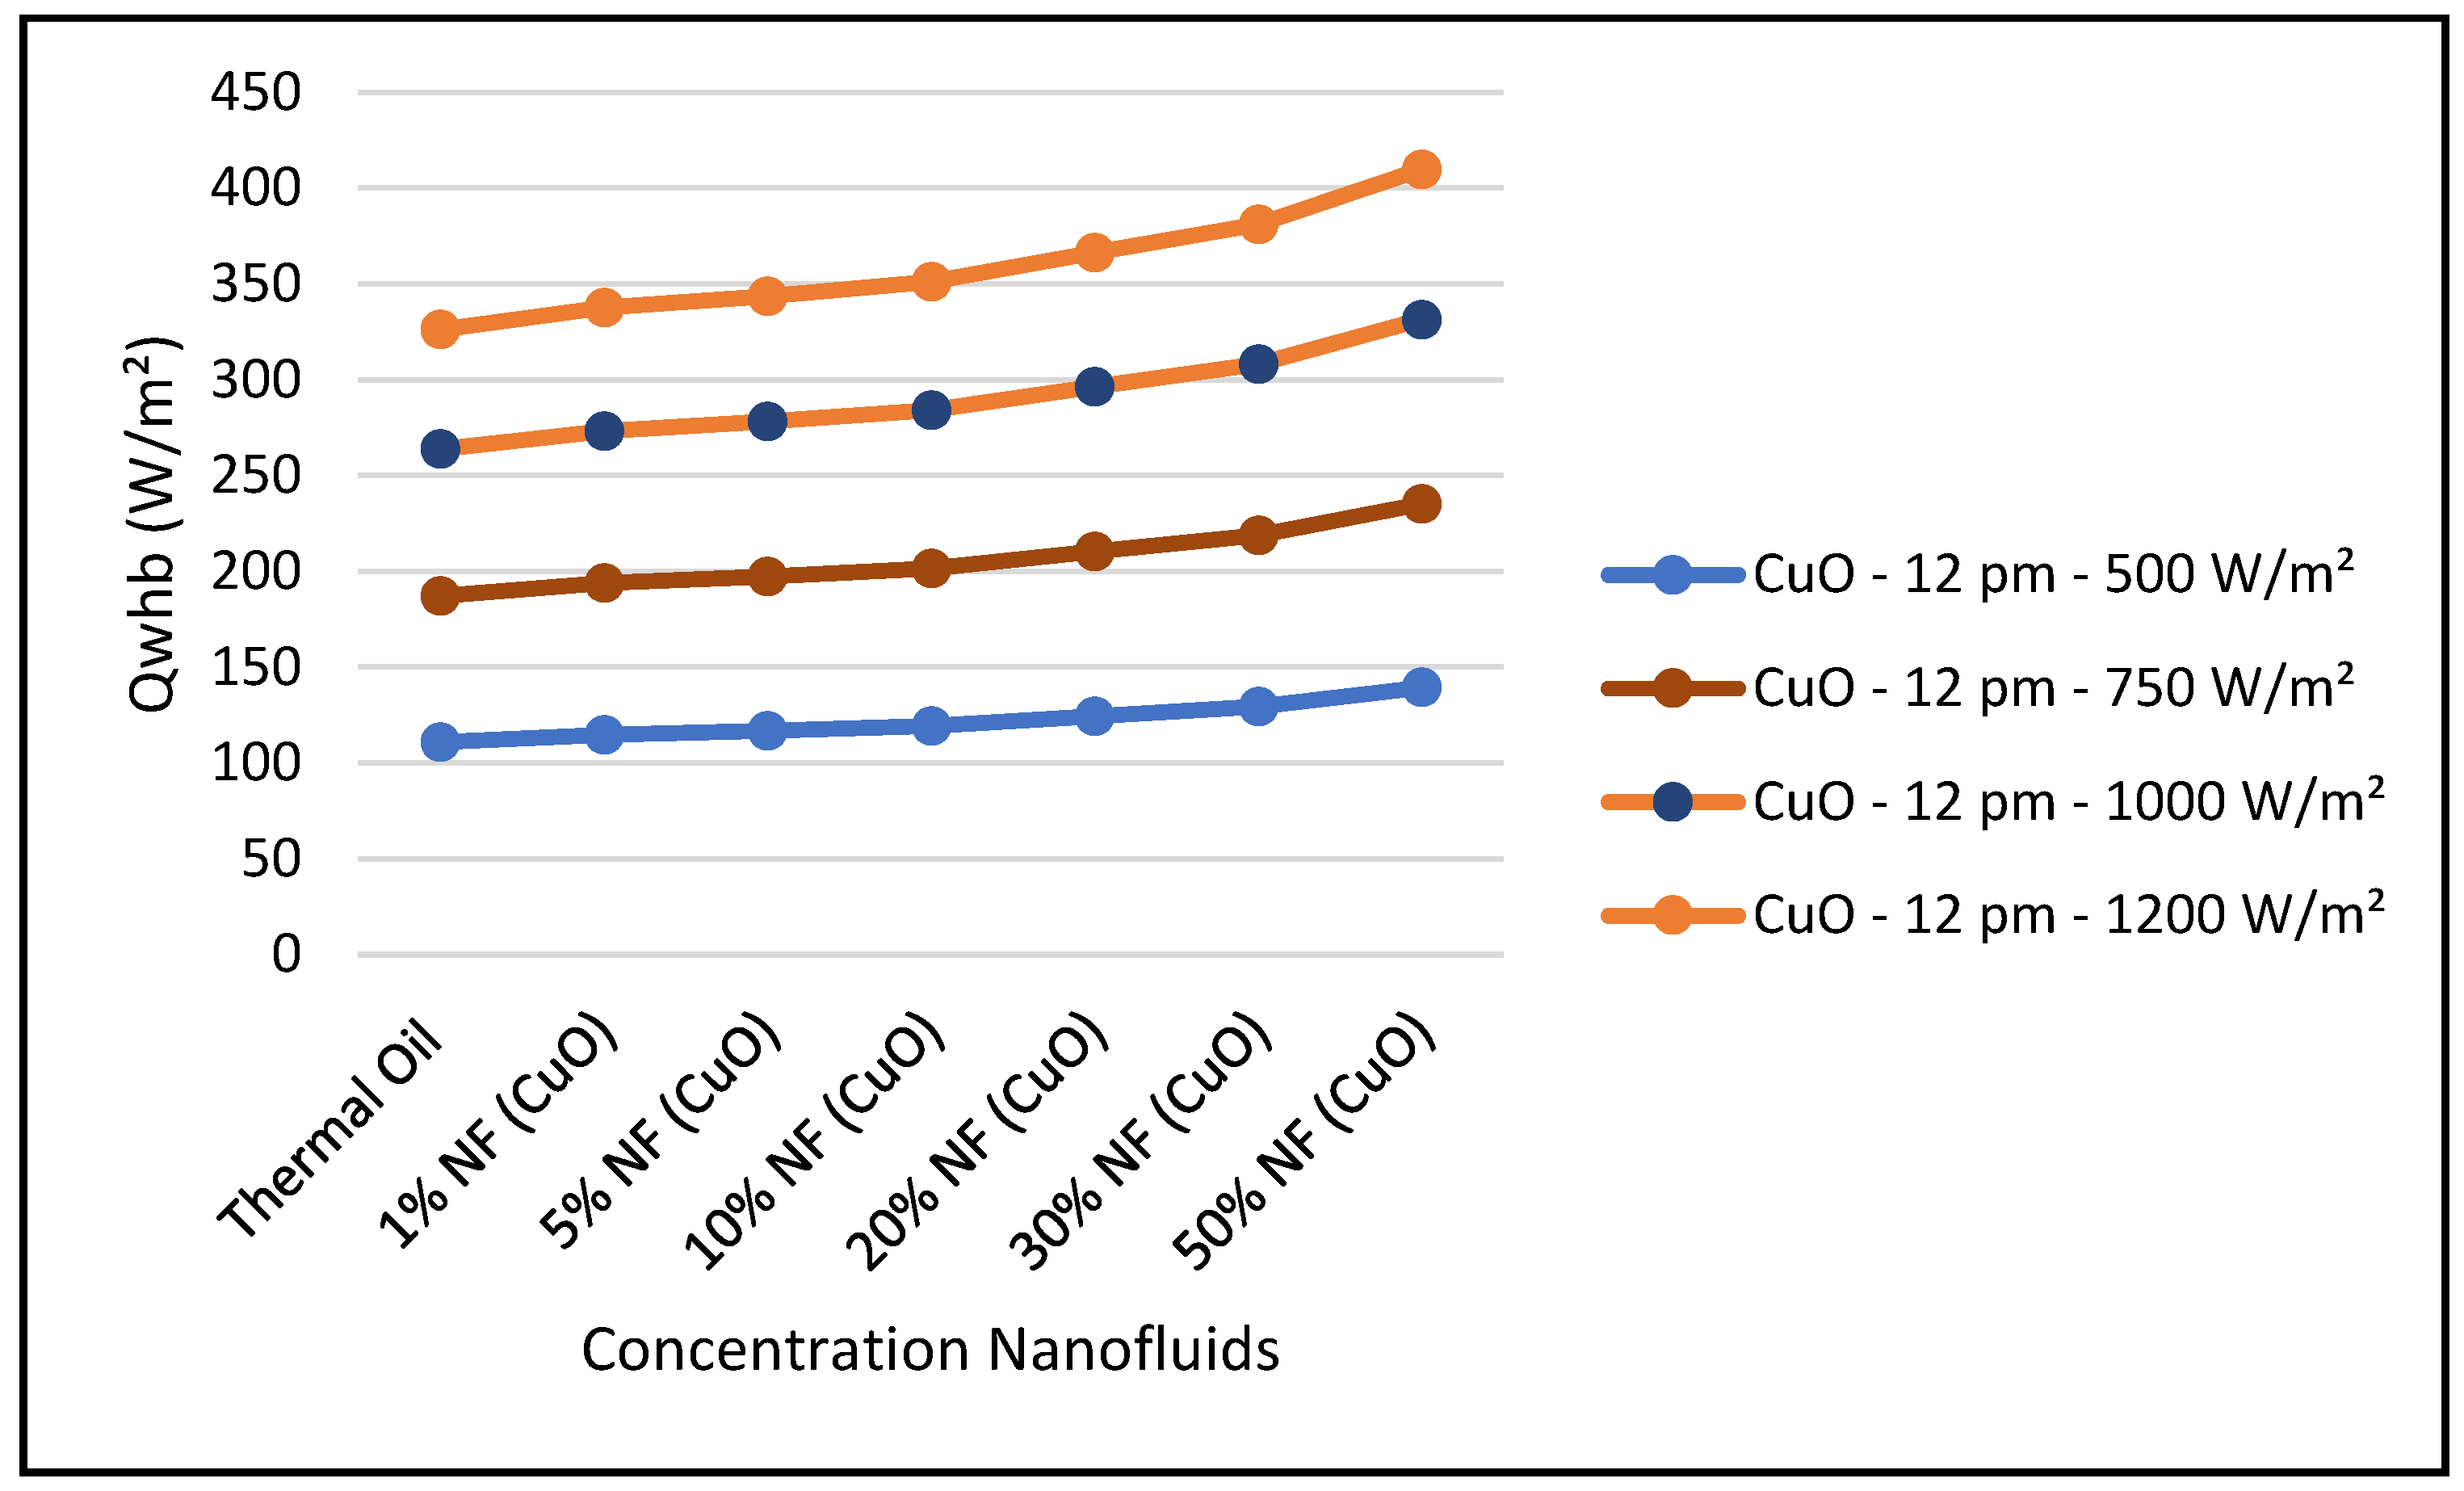
Therefore,
Figure 29,
Figure 30 and
Figure 31 were constructed to illustrate the impact of the concentrations of nanofluid CuO in the performance of the ORC system and the CSP hybrid system under different solar radiations at midday: 500, 750, 1000 and 1200 W/m
2. As can be seen in
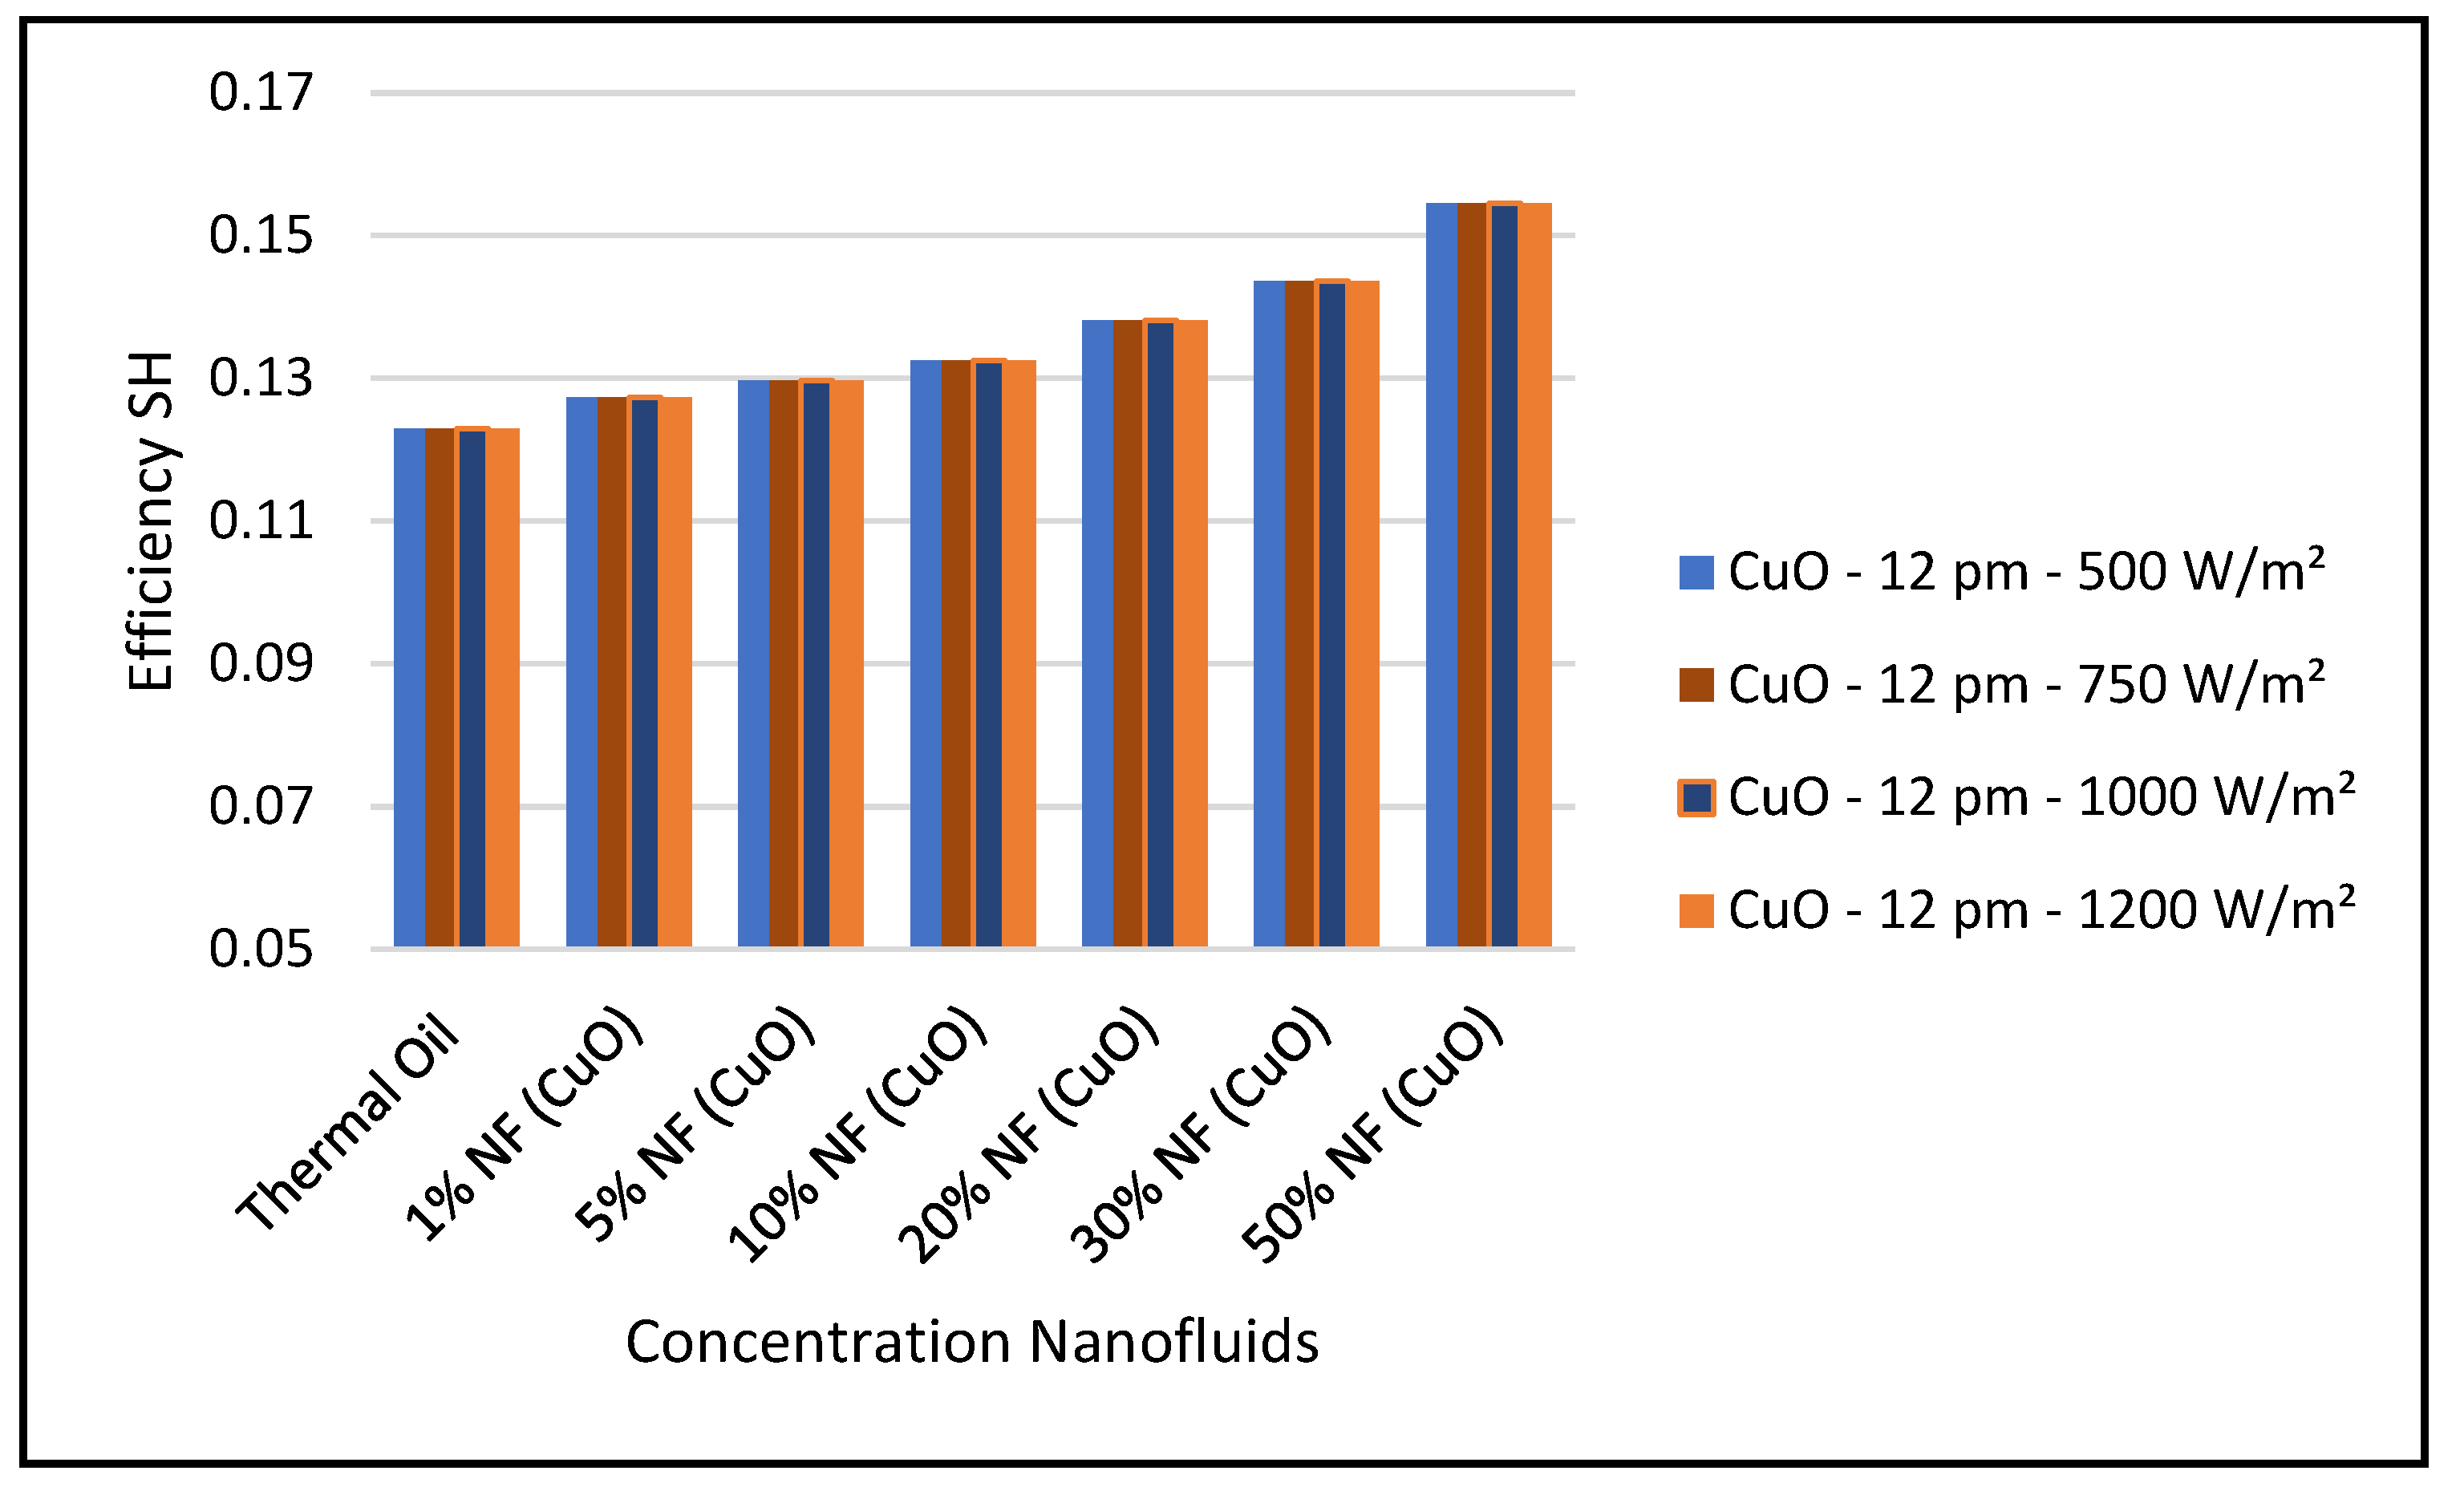
Figure 29, the thermal energy supplied by the CSP collector to the ORC loop was enhanced with higher concentrations of this nanofluid at constant solar radiation; and consequently, the ORC work produced was also increased at higher concentrations. It is found that the thermodynamic efficiencies with CuO nanofluid, under optimum conditions, are higher than those obtained from the base fluid. Also, the results displayed in this figure show that the higher the solar radiation the higher the ORC output. On the other hand,
Figure 31 shows that efficiency of the CSP solar collector hybrid system is increased with the increase of the solar radiation and as discussed earlier and is independent of the nanofluid concentrations as per Equation (18). Finally, our results conclude that the combination of the ORC with the CuO nanofluid is the optimum choice for the CSP solar hybrid system, which is in agreement with what has been reported in the literature, namely, [
31,
35].
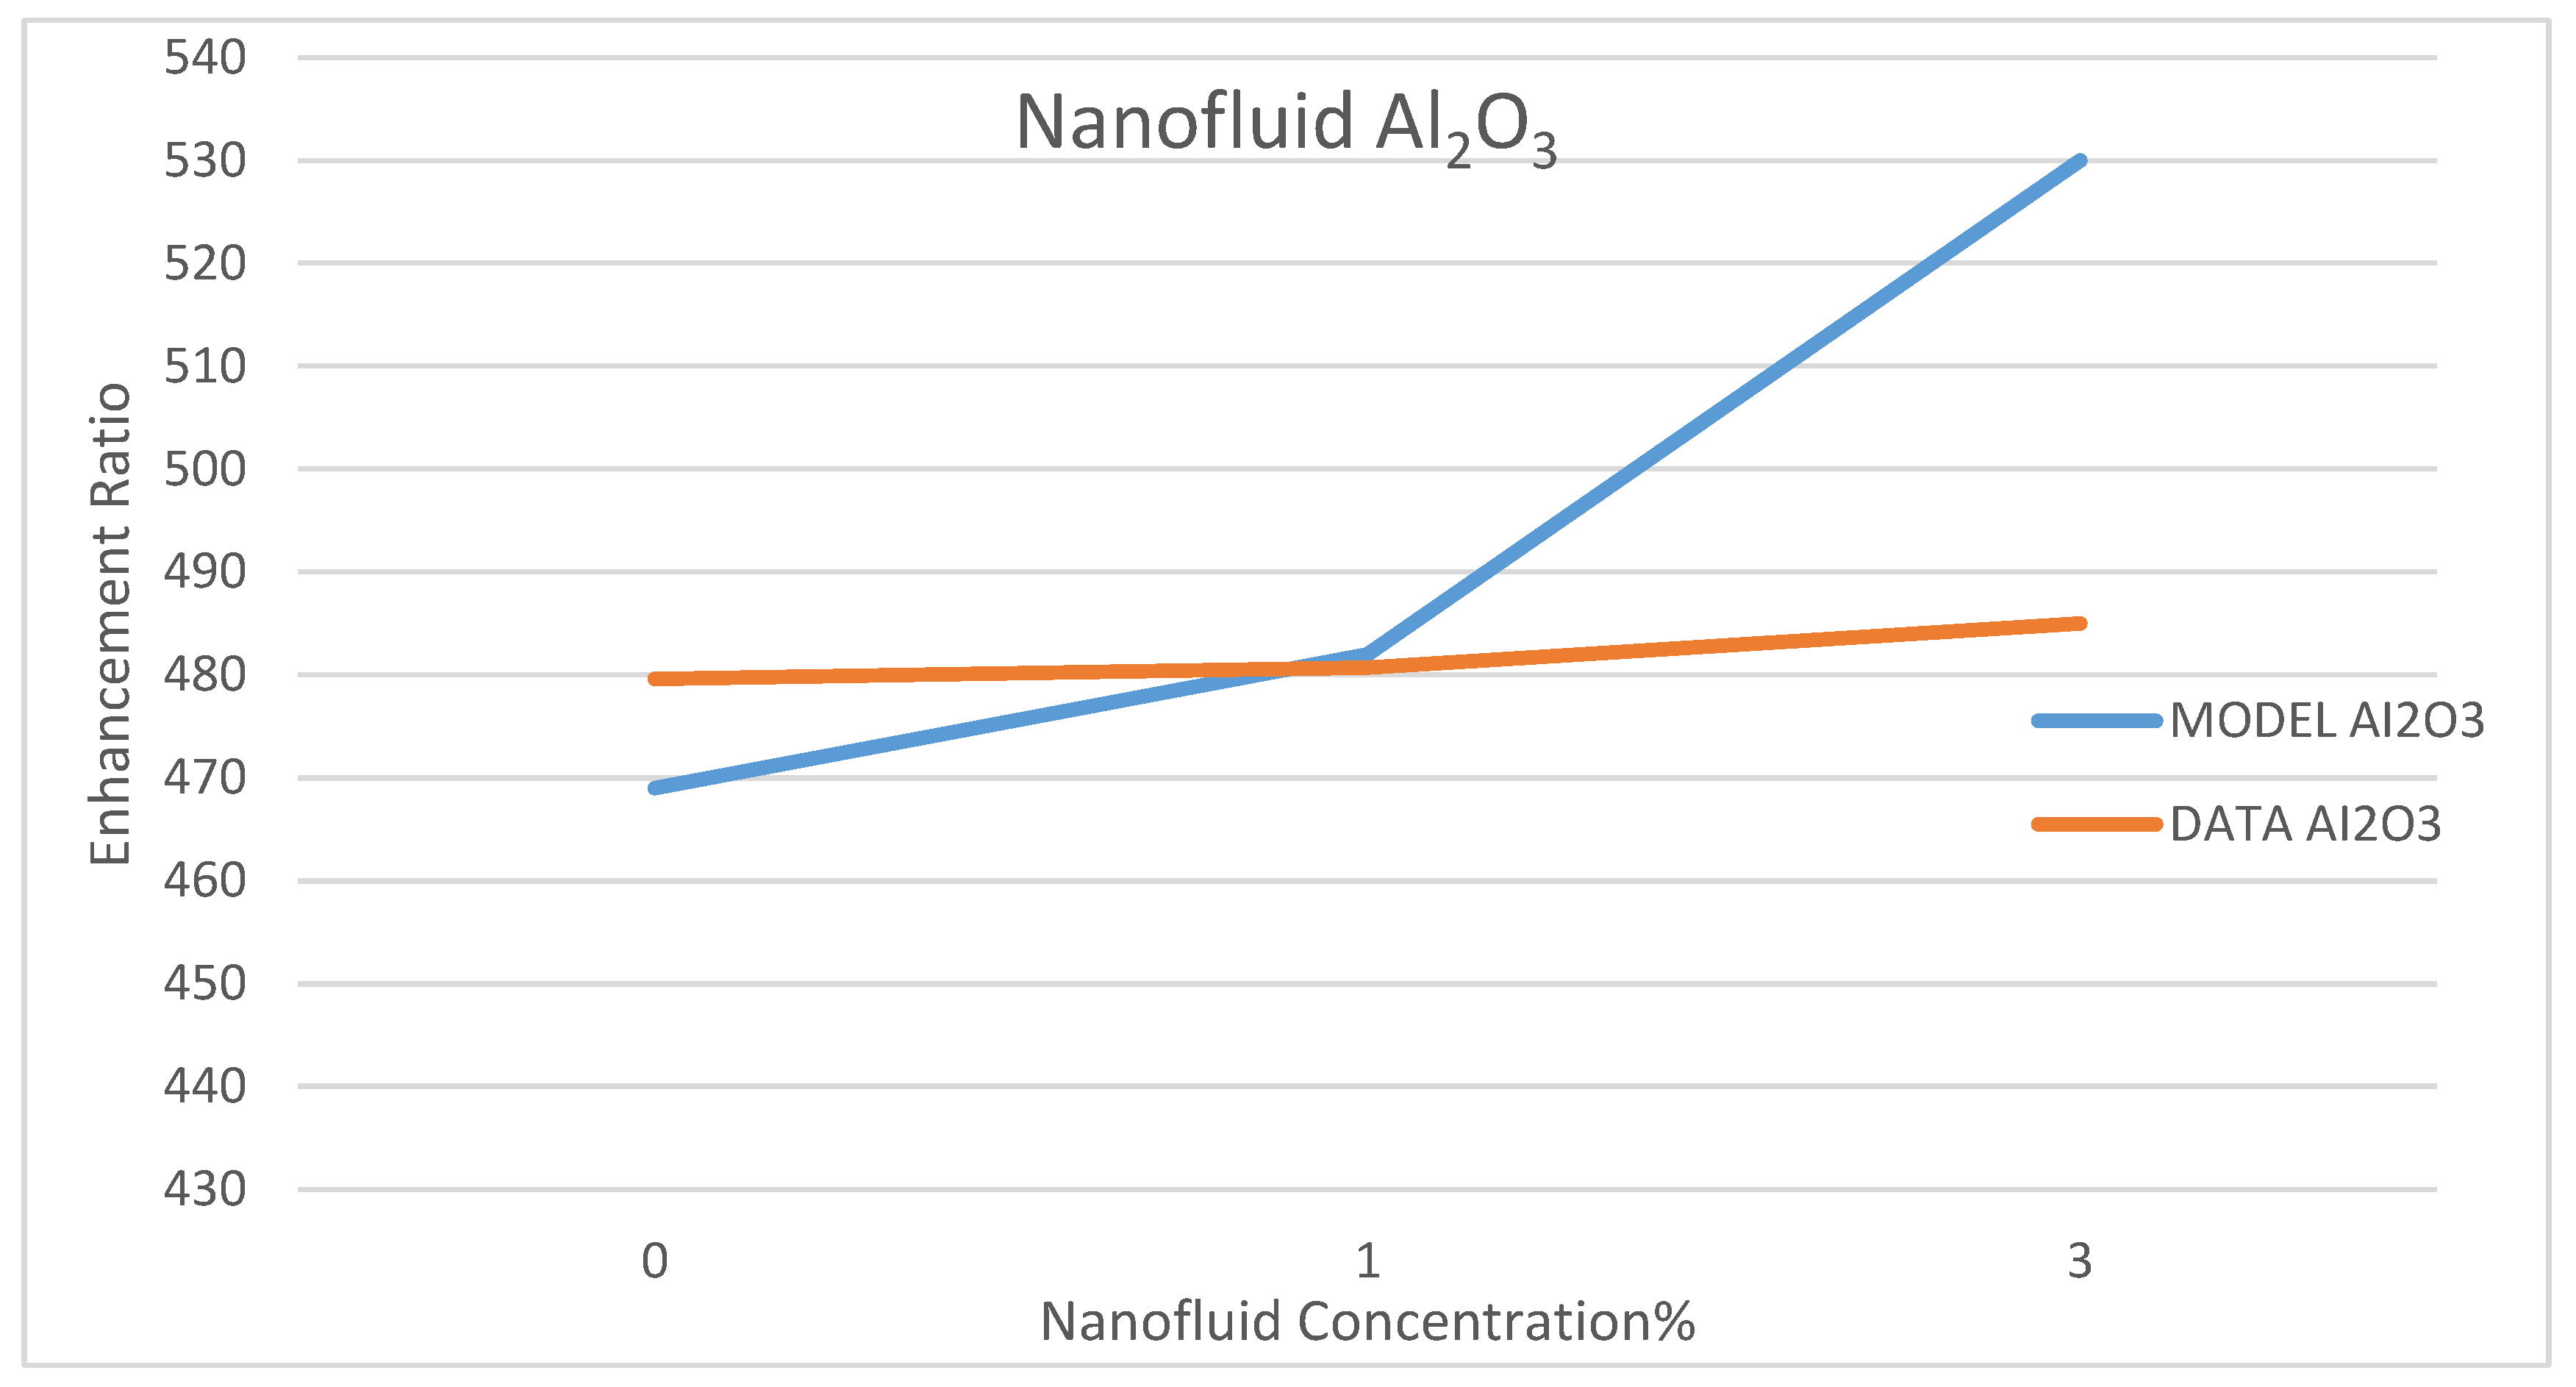
Model Validation
Among a few experimental data that have been reported in the literature on the use of nanofluids in CSP solar collectors, we compared the present model’s prediction of the enhancement ratio of the ORC work produced due to the use of the nanofluids; CuO and Al
2O
3 with the data reported by Bellos and Tzivanidis [
35]. This comparison is presented in
Figure 32 and
Figure 33, under nanofluid concentrations of 1–6%. The objective of their work was to optimize and evaluate a solar-driven trigeneration system that uses nanofluid-based parabolic trough solar collectors. The trigeneration system studied in reference [
35] included an organic Rankine cycle (ORC) and an absorption heat pump operating with LiBr-H
2O, which is powered by heat dissipated from condenser of the ORC. The comparison between the data of Bellos and Tzivanidis [
35] and our model’s prediction was conducted for the nanofluids CuO and Al
2O
3 on the basis of the enhancement of the work produced by the ORC with each nanofluid, respectively. It was found that the data and the model have the same trend; however, some discrepancies exit between the model’s prediction and the experimental data. It is believed that the selection of the basic operating parameters: the pressure in the turbine inlet, the temperature in the ORC condenser and the nanofluid concentration attributed to the discrepancies between model’s prediction and the data. In addition, reference [
35] did not disclose the aforementioned parameters, which are critical in the validation of the current model. Therefore, other references were consulted [
38,
39,
40].
Marefatoi et al. [
31] presented an optical and thermal analysis of parabolic trough solar collector (PTC) and evaluated the performance of the PTC, using four cities with different weather conditions. The analysis was performed using MATLAB software and shows an average annual thermal efficiency of 13.91%. Also, their work concluded that using the nanofluids CuO, SiO2 and Al
2O
3 as heat transfer fluid increased the heat transfer and system efficiency under average solar radiations of 344 w/m
2. Those results and conclusions were compared to our model’s predictions under similar average solar radiations and it was found that our prediction of the system efficiency was, on average, 13.15%, compared to 13.91% reported by reference [
31]. In addition, our model predictions were in agreement with the results of reference [
31] that nanofluids; CuO, SiO
2 and Al
2O
3 enhanced the heat transfer.
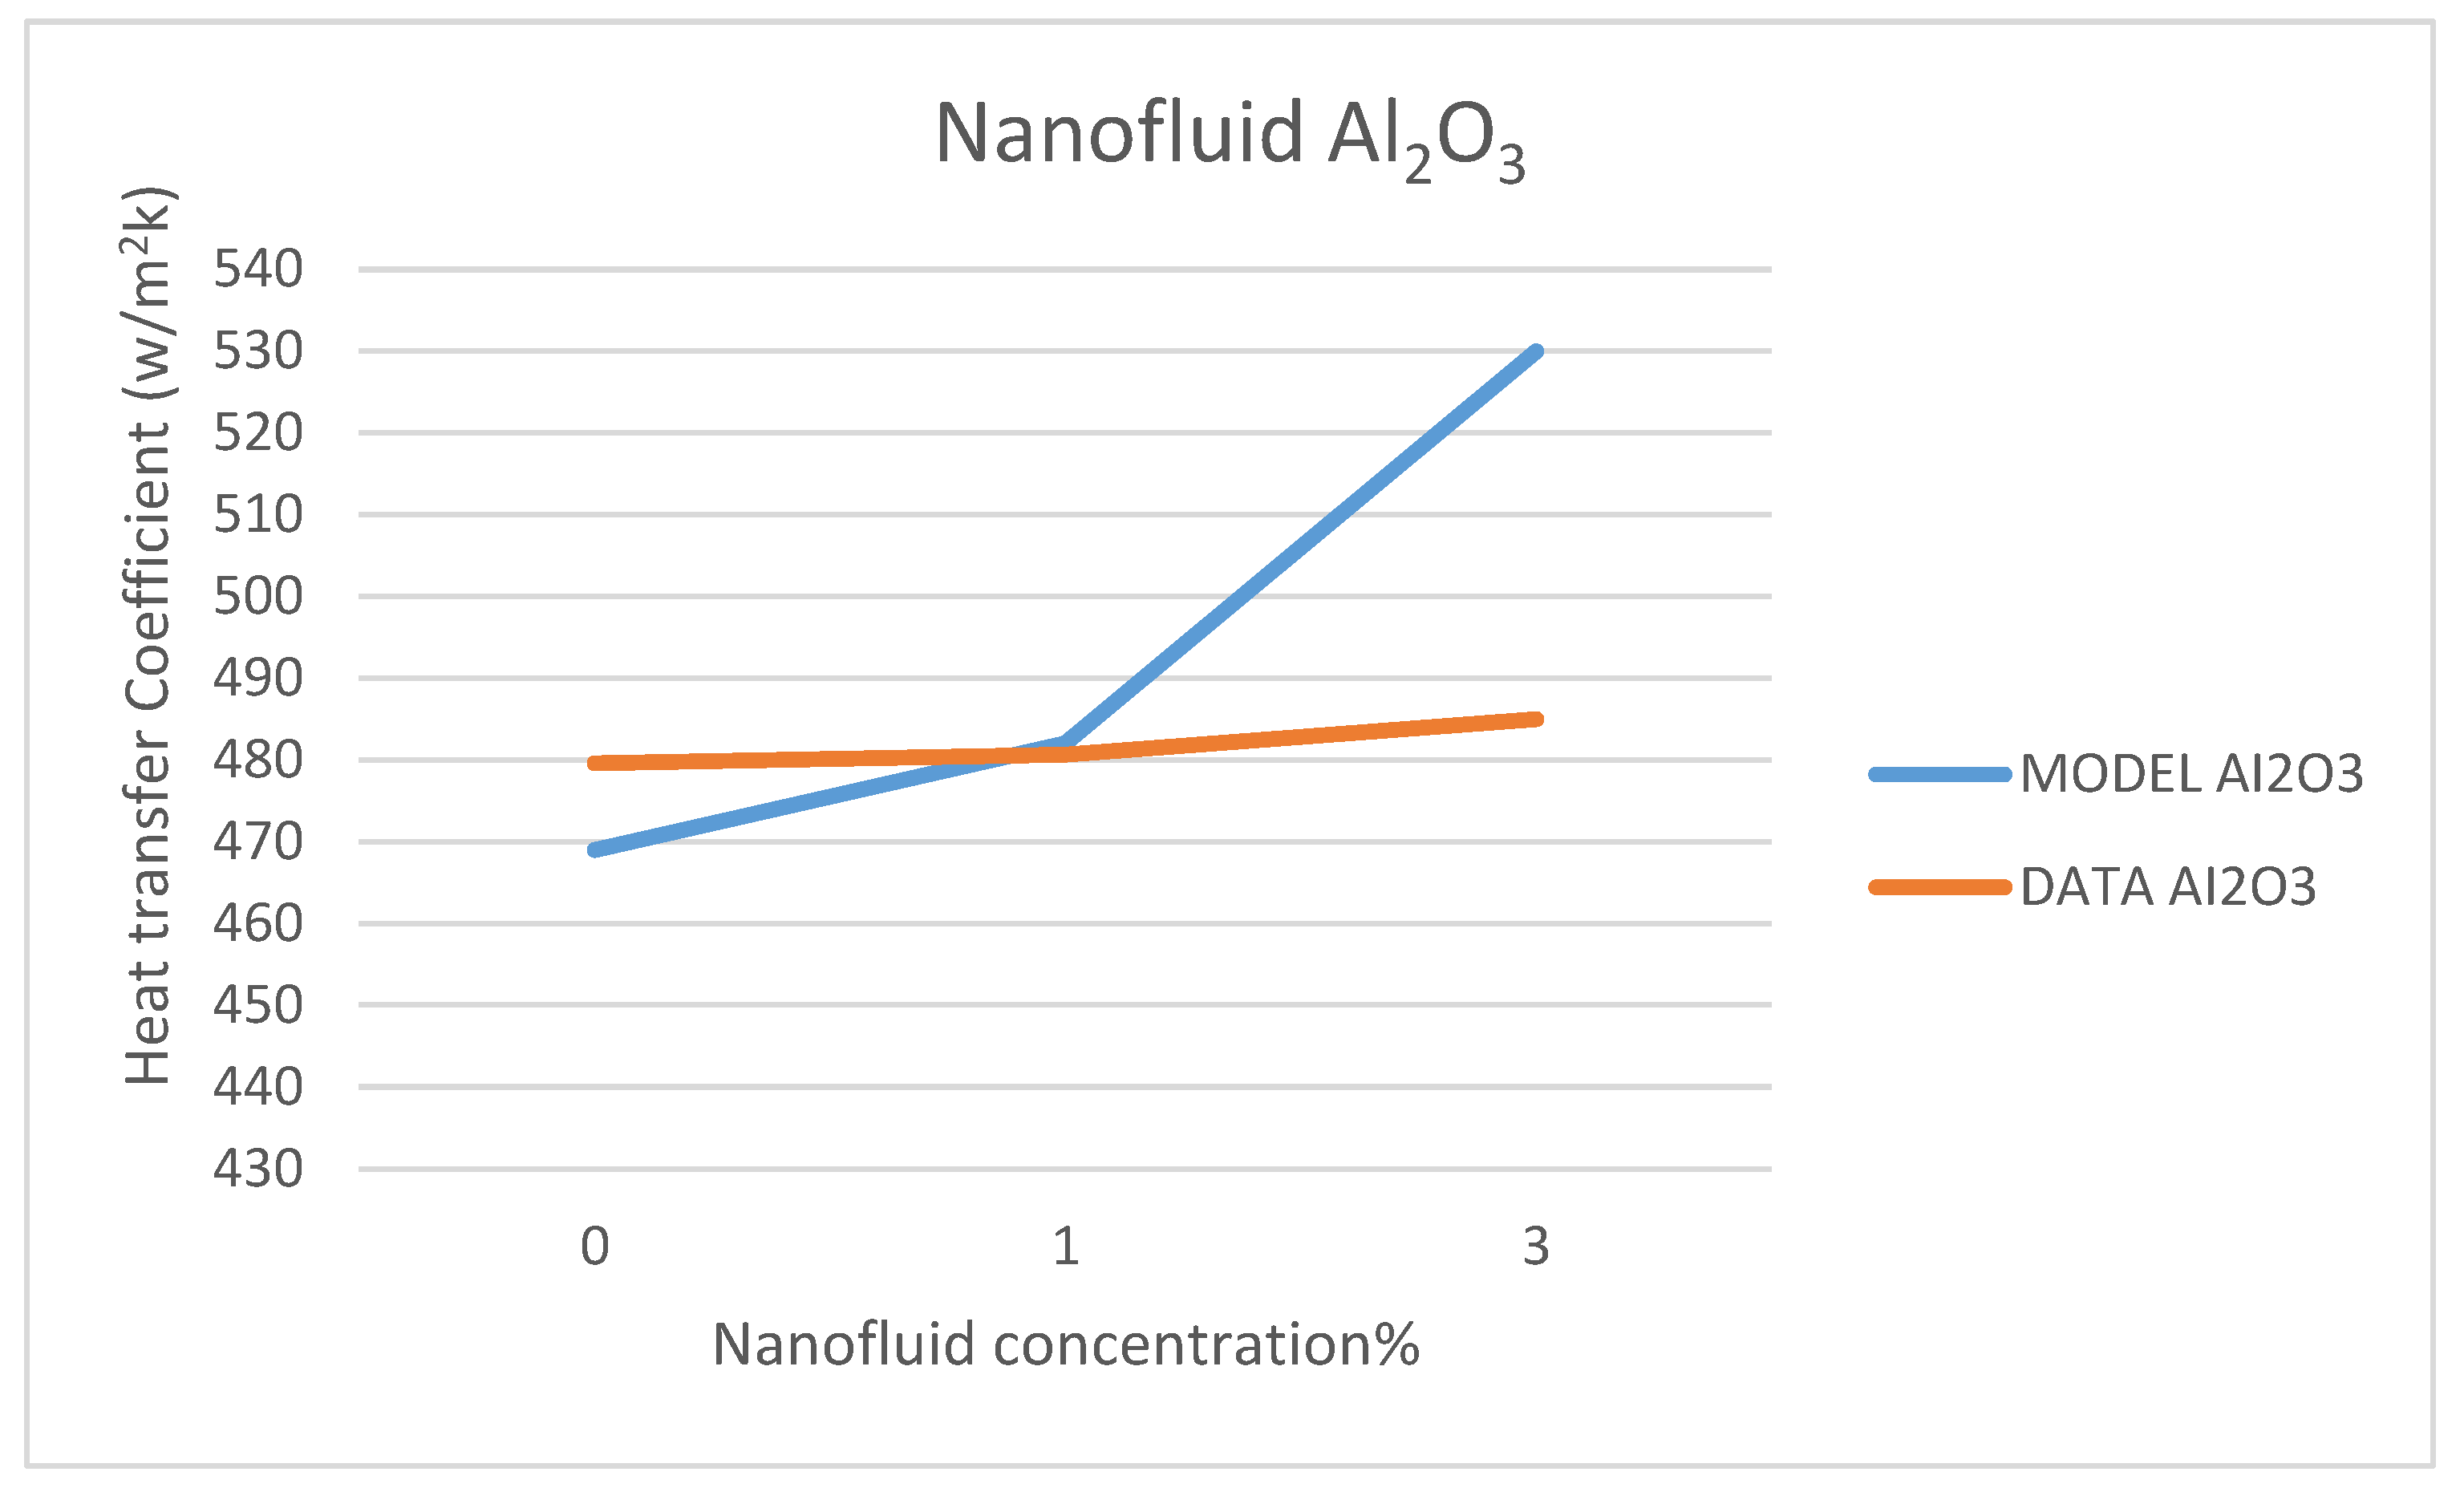
Other comparisons between our model’s prediction for the convection heat transfer coefficient and the data reported by Marefatoi et al. [
31] on Al
2O
3 and SiO
2 are presented in
Figure 34 and
Figure 35, respectively, at a solar radiation of 425 w/m
2. The comparison displayed in these figures shows that as the nanofluid concentration increases the heat transfer coefficient increases. Our model compares fairly with the data of reference [
31]; however, our model underpredicted the heat transfer coefficient by 9.3% and 8.8% for the nanofluids Al
2O
3 and SiO
2, respectively. This could be attributed to the different relationships used to calculate the thermophysical properties of the nanofluids in question and used in the Dittus-Bölter correlation [
36] to calculate the heat transfer coefficient.


