1. Introduction
Multimedia teaching has gradually substituted traditional teaching, as teachers have been selecting the right multimedia teaching material instead of hardcopy or static teaching material. However, before multimedia teaching material was used in teaching, teachers have to not only be familiar with the contents of multimedia teaching material, but also gather related teaching material. This brings burdens for teachers on preparing the multimedia material for class. This study applied TAM (technology acceptance model), in elementary school teachers to discuss if they are intent to use the multimedia material.
In the environment of high development of network information, the teaching mode has also been changed. Many teaching theories and research results indicated that the environment of digital learning facilitated the increase of teaching quality, and obviously affected the learning outcomes [
1]. In a research study analyzing the factors that affect students’ behavior to the use of digital learning [
2], the results show that students have a strong attitude towards using digital learning. Another study shows that digital learning is associated with positive student perceptions of collaborative learning [
3].
The authorities encouraged four cloud services in Taiwan in 2012. Education cloud was one of the four. It showed the importance of the education sector on the authorities. The education cloud service was the one that was expected to increase the learning outcomes of students and teaching effects of teachers through the advancement of so-called “future classes”. To cope with the requirement of present-day educational policies and innovative teaching concepts, integrated multimedia teaching material instruction has been heavily advertised and furthered and, thus, a common phenomenon employed by teachers.
However, the approach of selecting practical multimedia materials for a class is a new challenge for teachers. Teachers’ intention toward using multimedia teaching material has then become a critical issue for teaching quality. The teaching environment of elementary schools in Taiwan differed depending on the location of schools such as between big cities and small towns, in terms of multimedia hardware facilities. Therefore, some researchers investigated the intention and status of multimedia employed by teachers only in some cities, due to the limits of time and workforce, but not in large regions having large samples of teachers. In this study, we investigated the use intention of multimedia teaching material employed by the teachers of elementary schools in Chiyi County consisting of 122 elementary schools. The research results were provided as a reference for the planning and design of multimedia instruction furthered by educational department.
2. Literature Reviews
This study investigated the use intention of integrated multimedia teaching material instruction based on the theory of TAM, targeting the teachers of elementary schools in Chiyi County, Taiwan. This section consists of two subsections elucidating the related thoughtfulness of integrated multimedia teaching material instruction and the thoughtfulness and related research of TAM.
2.1. Applications of Integrated Multimedia Teaching Material Instruction
Multimedia teaching employs computers as teaching media, which integrates texts, data, pictures, images, animations, videos, and audio and special effects, to bring the teaching effects into full play with the aid of sound, light, color, and dynamism of real scenes, and assist in the teaching of teachers and the recognition of individual differences of adapted learning of students [
1].
The early traditional slides were multimedia. However, along with the advance of technology, the meaning of multimedia was also expanded in which videos consisted of the media of pictures, animations, and images, and texts and audio consisted of languages, speech from background narrators, stereo sound effects, and a variety of music. In this way, learners would be able to conduct learning through different media, instead of the unitary narration from the teacher, so as to create better learning outcomes. The other study also supports that the signaling principle emphasizes the multimedia effect [
4]. For the students with low prior knowledge, the application of signaled multimedia material enhances their performance.
Another study investigated the current status of multimedia teaching [
5]. They examine integrating technology into mathematics education. An approach on how to teach mathematics courses by integrating meaningful multimedia technology to foster the learning process was conducted. The results show that multimedia is an effective tool for teaching, especially modules like calculus and numerical methods, which have complex difficult concepts to understand using the theoretical way of teaching.
2.2. Applications of TAM
Davis [
6] proposed the TAM to predict or elucidate the factors affecting IT use, based on the TRA (theory of reasoned action) by Fishbein and Ajzen [
7] and the TPB (theory of planned behavior) by Ajzen [
8], in which the TAM was extended and developed, and consisted of two beliefs: perceived ease of use and perceived usefulness. The former referred to the ease of use of IT (information technology) subjectively perceived by users. The easier the use, the more accepted the IT. The latter referred to the extent of usefulness of IT subjectively perceived by users. The more extent the usefulness, the more adopted the IT. The recognition affected the attitudes and furthered the behaviors. TAM was employed to elucidate and predicate the acceptance of use of IT in which the use intention and behavior of individuals were affected by two key variables: perceived ease of use and perceived usefulness.
A study on using mobile devices was conducted in a university. The 678 participants were primary education teachers who achieved a Bachelor’s degree. The results showed that a strong relationship exists between perceived usefulness and behavioral intention [
9]. Another study considered the teaching–learning activity by using YouTube [
10]. One of the findings presented the significance of the relationship between different variables and the behavioral intention, validating the TAM. Another example is a study that focused on cognitive-oriented individual differences in order to integrate relevant features between users and systems. The results show that both the learning styles and teaching styles on using behaviors of e-Learning systems affected the intention [
11].
From the perspective of education, many researchers have also deliberated profoundly on TAM. One study examined YouTube as a learning resource in higher education. The research objectives were scale development and validated the TAM [
10]. Through the TAM model, a study examined the attitude of Turkish EFL learners towards technology. The results showed some of the TAM factors have effects on the learning performance [
12]. Another study also used TAM to study pre-service teachers’ intent to use Mobile-Learning, and the results showed that there was a significant difference between control and experimental groups [
9]. In this study, we examine the relationships among factors of TAM. Through the study, we understand the determinates on the intention to use.
However, the relationships among TAM model may not always be significant. A study aimed to investigate the attitude of learners toward an augmented reality (AR) learning activity. It was designed to help engineering students solve an electromagnetic problem. The participants were 122 students. The results of the evaluation show that intention of using the system is dependent on the perceived enjoyment, but not from the perceived usefulness of the learning tool [
13].
According to the related research above, TAM has mostly been extensively employed, effectively and suitably, to elucidate and predict the personal acceptance of use of multimedia.
This study investigated the use intention of multimedia teaching material of elementary school teachers.
3. Research Method
This paper investigated the acceptance of integrated multimedia teaching material of school teachers in Chiayi County based on TAM. Our research method consisted of five parts. In the first part, we created the research framework; second, we addressed research assumption; third, we elucidated the research method and steps; and fourth, we investigated research objects and sampling methods.
3.1. Research Framework
In this study, TAM was divided into four aspects: perceived usefulness, perceived ease of use, attitude toward using, and intention to use, as indicated in
Figure 1.
3.2. Research Method and Steps
1. We translated David’s questionnaires into Mandarin. In order to verify the suitability of questionnaires, we invited five experts and scholars, including two professors of information and media-related departments of a university, two chairs and related-superintendents of elementary schools, to go through the contents of questionnaires and propose their opinions for revisions, so as to enhance the validity of questionnaires.
2. Pilot test: The questionnaire was distributed to the teachers of six elementary schools in Chiayi County. The questionnaires for pilot test consisted of 17 questions.
There were 90 participants who replied to the survey. Item analysis, reliability analysis, and validity analysis was conducted. Reaching the reliability and validity of the questionnaires, some items of questions which resulted in less reliability and validity were deleted.
3. Distribution and collection of formal questionnaires: We verified the sampling sources and sampling mode. The distributed sampling was used to select the participants. According to the school scale of sampling schools, the follow-up statistical analysis was then conducted. Based on the statistical results, we finally analyzed and discussed the required data for this study to verify if the research assumptions were correct.
3.3. Research Objects and Sampling Mode
The population of this study was 2317 teachers spanning 1312 classes of 122 schools in 17 townships of Chiayi County in 2016. The number of classes were used to define school size. The sampling principle adopted was stratified random sampling according to school size, which divided all the elementary schools in Chiayi County into four categories: less than or equal to 6 classes, 7 to 12 classes, 13 to 24 classes, and greater than or equal to 25 classes, and average sampling was conducted. The distribution of schools was shown in
Table 1.
There were 460 questionnaires, of which 441 were used. The demographic information is shown in
Table 2. There were 295 females and 146 males. There were 30 participants under 30 years old, 135 were between 31 and 40 years old, 228 were between 41 and 50 years old, and 48 above 51 years of age. As these participants were school teachers, their education levels were all above Bachelor’s degree. Of these, 174 held a Bachelor’s degree and 267 a Master’s degree.
3.4. Research Tools
In this study, a questionnaire survey was employed to investigate the acceptance of integrated multimedia teaching material of school teachers in Chiayi County.
The survey instrument is based on constructs validated in Davis [
6], and adapted to the context of this study. The survey items include perceived usefulness, perceived ease of use, attitude, and intention to use. All questionnaire items were measured using a 5-point Likert scale ranging from “strongly agree” to “strongly disagree”. The survey instrument consists of 4 items for perceived ease of use, 4 items for perceived usefulness, 4 items for attitude toward using, and 5 items for intention to use. The survey questions were written as follows.
Perceived Usefulness
Q1. Using the multimedia material in my class helps me to control the pedagogy.
Q2. Using the multimedia material in my class enhances the teaching performance.
Q3. I find the multimedia material useful in my class.
Q4. Using multimedia materials makes it easier to catch individual students’ needs.
Perceived Ease of Use
Q5. It is easy to become skillful at using multimedia materials.
Q6. I find it easy to apply the multimedia material in my class.
Q7. Using multimedia materials is easy and understandable.
Q8. Using multimedia materials is more flexible to teach than traditional one.
Attitude Toward Using
Q9. Using multimedia material in class is good.
Q10. My using multimedia material in class is favorable.
Q11. It is a positive influence for me to use multimedia material in class.
Q12. I think it is valuable to use multimedia material in class.
Q13. I think it is a trend to use multimedia material in class.
Intention to Use
Q14. I tend to use using multimedia materials in my class.
Q15. I increase the occurrences of using multimedia materials in class.
Q16. Using multimedia materials in my class to enhance students’ learning interest.
Q17. I’d love to use multimedia materials in my class.
Q18. I use multimedia materials to provide multi-approaches on teaching.
3.5. Data Handling
Based on the theory of TAM, this study investigated all variables affecting the acceptance of integrated multimedia teaching material instruction of teachers of elementary schools in Chiayi County. We adopted the statistical methods to cope with the research purpose and assumption and elucidated as follows:
3.5.1. Items of Questions Analysis
In this study, we distinguished the questionnaires according to the CR (critical ratio) and calculated the correlation coefficient (Pearson’s product-moment correlation coefficient) to determine the correlation between items of questions. The results indicated that the CR of perceived usefulness was between 6.824 and 12.803, and the correlation coefficient was between 0.775 and 0.863. All 4 items of questions reached significance level 3.5, and the correlation coefficients were all above 0.400 and, thus, were retained. The CR of use attitude was between 9.411 and 11.076, and the correlation coefficient was between 0.845 and 0.903. All 4 items of questions reached significance level 3.5, and the correlation coefficients were all above 0.400 and, thus, were retained. The CR of use intention was between 9.084 and 14.099, and the correlation coefficient was between 0.811 and 0.901. All 5 items of questions reached significance level 3.5, and the correlation coefficients were all above 0.400 and, thus, were retained. These illustrations above are shown on the left of
Table 3.
3.5.2. Reliability Analysis
In this study, we employed Cronbach’s alpha (alpha reliability) to test the internal consistency of questionnaires. The results showed that the Cronbach’s alpha of perceived usefulness was 0.862, indicating the internal consistency of questionnaires was good; of perceived ease of use was 0.888, indicating good; of use attitude was 0.891, indicating good; and of use intention reached 0.911, indicating excellent. The reliability analysis is shown on the right of
Table 3.
3.5.3. Validity Analysis
The measurement criteria of this study were revised based on the related literature and discussed by the invited experts of practical and academic domains, and then the pilot test was conducted so as to verify the content validity in which the formal questionnaires were finalized, and consisted of 4 items of questions of perceived usefulness, 4 of perceived ease of use, 4 of use attitude, and 5 of use intention. The total number of items was 17 items.
3.5.4. Regression Analysis
Regression analysis is used to understand which of the independent variables are related to the dependent variable. In restricted circumstances, regression analysis can be used to infer causal relationships between the independent and dependent variables. In this study, we examine the relationships among perceived usefulness, perceived ease of use, attitude to use, and intention to use. We also explored the forms of these relationships. There were three relationships we examined to explore the coefficients and difference among these variables. They were:
The relationship between perceived ease of use and perceived usefulness.
The relationship among perceived ease of use, perceived usefulness, and attitude to use.
The relationship among perceived usefulness, attitude to use, and intention to use.
On the analysis approach, once a regression model has been created, confirmation of the goodness of fit of the model is the following step. The statistical significance of the estimated parameters, such as R2, residuals and hypothesis testing, F-test of the overall fit, followed by t-tests of individual parameters, have to be analyzed. Interpretations of these tests rest heavily on the model assumptions. In this study, we applied R2, F-test, and t-tests to identify the coefficient and the relationships among variables.
4. Research Results
This section investigated and analyzed the effect among all variables of TAM, based on the statistics and analysis of the collected questionnaires.
4.1. Regression Analysis of Perceived Ease of Use vs Perceived Usefulness
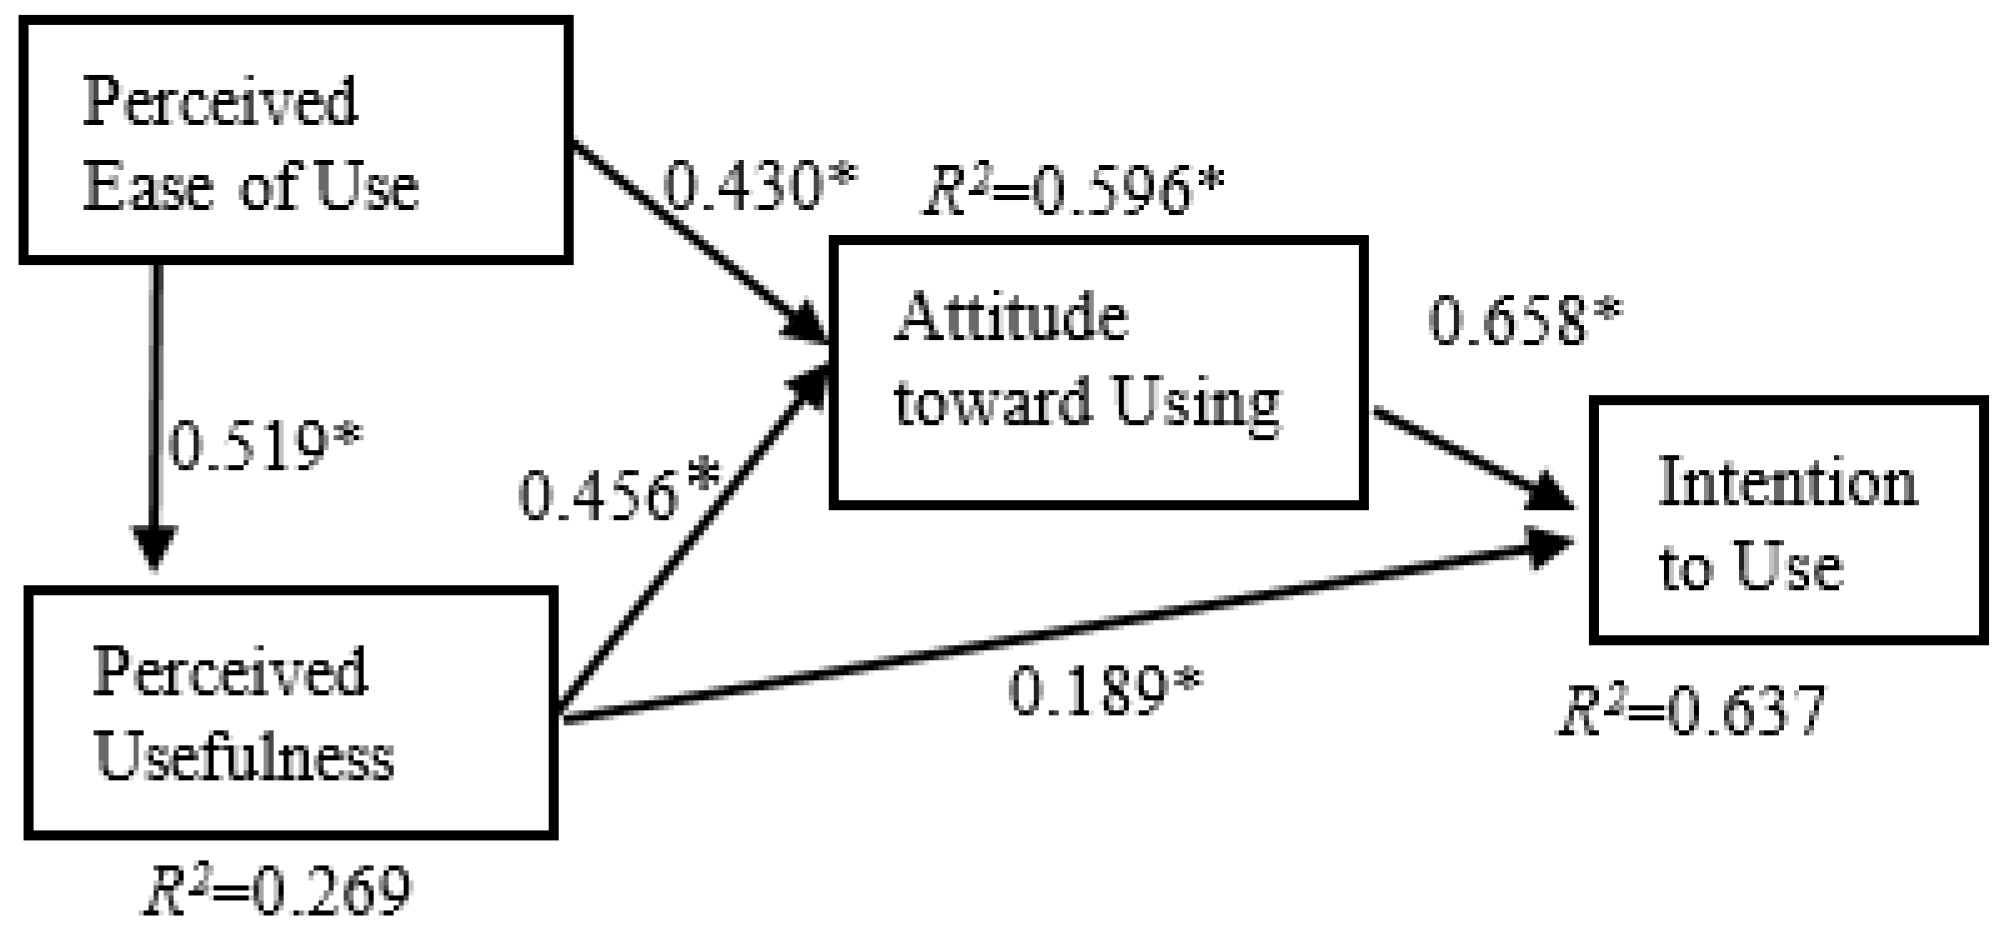
In the testing of goodness of fit, the perceived ease of use would be able to elucidate the R2 value of 0.269 of perceived usefulness, which had the capability of explanation of 26.9%, and the p-value 0.000 was less than 0.05, which reached the significance level, and the t value was positive, indicating that the perceived usefulness was significantly and proportionally affected by the perceived ease of use.
The coefficient is 0.519, which means that when increasing the perceived ease of use by one unit, the perceived usefulness will increase by 0.519 units. The statistical significance of the estimated parameters is shown in
Table 4.
4.2. Multiple Regression Analysis of Perceived Ease of Use and Perceived Usefulness vs Attitude Towards Using
In the testing of goodness of fit, both the perceived ease of use and perceived usefulness would be able to elucidate the R2 value of 0.596 of perceived usefulness, which had the capability of explanation of 59.6, and the p-value 0.000 was less than 0.05, which reached the significance level, and the t value was positive, indicating that the use attitude was significantly and proportionally affected by both the perceived ease of use and perceived usefulness.
The standardized regression equation is: attitude = 0.430 ease of use + 0.456 usefulness
Both perceived ease of use and perceived usefulness have almost the same influence on attitude: 0.430 and 0.456, respectively. The statistical significance of the estimated parameters is shown in
Table 5.
4.3. Multiple Regression Analysis of Perceived Usefulness and Attitude Towards Using vs Intention to Use
In the testing of goodness of fit, the perceived usefulness and attitude towards using would be able to elucidate the R2 value of 0.637 of use intention, which had the capability of explanation of 63.7, and the p value 0.000 was less than 0.05, which reached the significance level, and the t value was positive, indicating that the use intention was significantly and proportionally affected by both the perceived usefulness and attitude toward using.
The standardized regression equation is intention = 0.658 attitude + 0.189 usefulness.
Both attitude and perceived usefulness have significant influence on intention. Moreover, the attitude has stronger effect on intention (0.658) than perceived usefulness does (0.189). The statistical significance of the estimated parameters is shown in
Table 6.
Summing up above results, the results were indicated in
Figure 2.
5. Conclusions
This study mainly investigated the acceptance of integrated multimedia teaching material, analyzed the research results, made conclusions, and proposed suggestions.
For convenience of sampling, the specific only county that was selected which was Chiayi county, which represents a limitation of this study. The gap between urban and rural cities is another factor affecting teachers’ intention to use multimedia material. Future studies may examine teachers’ acceptance depending on different types of cities.
Summarizing the results, the intention of using multimedia teaching material for school teachers in Chiayi County was significantly affected by predicted usefulness and attitude towards using. The attitude towards using was, moreover, affected by perceived ease of use and perceived usefulness. The perceived usefulness was also affected by the perceived ease of use. The authorities then would enhance the ease of use of applying multimedia materials and make it easier for teachers to build the material. For example, in establishing equipment for building multimedia material and providing manpower for editing these materials. Teachers would provide the teaching content and the materials would be built by the extra manpower. This would reduce the material building load to teachers and provide the appropriate content for the class, thus enhancing the ease of use and the intention to use.
According to the research results and conclusions, we proposed some suggestions, for reference, as follows.
5.1. Building the Multimedia Teaching Environment
According to our research results, the multimedia teaching material would be able to predict the usefulness of teaching in a forward direction. As long as the IT environment has been mature and employed to aid teaching, the teachers would be able to feel the enhancement of teaching contents and the assistance of learning outcomes. Due to the old-fashioned computer and network facilities of the suburban schools in Chiayi County, the problems of computer shutdown and instability of network resulted in decreasing the use intention of using multimedia teaching material. Therefore, we suggest that the authorities should effectively build the multimedia teaching environment and flesh the information facilities out so as to aid the teachers and increase the teaching quality and effect.
5.2. Encouraging Teachers to Participate in Multimedia Teaching-Related Educational Training
In this study, we found that using multimedia teaching material would be able to more efficiently promote the teaching quality. However, along with the changing of IT with each passing day and the rapid “out with the old and in with the new” of computer facilities, encouraging teachers to participating in teaching-related educational training is essential.
Author Contributions
Conceptualization, H.-J.H. and H.-M.S.; Methodology, F.W. and H.-M.S.; Software, F.W. and R.-J.Y.; Validation, H.-J.H., F.W. and H.-M.S.; Formal Analysis, F.W.; Investigation, H.-M.S.; Resources, F.W. and R.-J.Y.; Data Curation, F.W. and H.-J.H.; Writing-Original Draft Preparation, F.W.; Writing-Review & Editing, R.-J.Y.; Visualization, H.-J.H.; Supervision, F.W.; Project Administration, H.-J.H.; Funding Acquisition, F.W.
Funding
This research received no external funding.
Conflicts of Interest
The authors declare no conflict of interest.
References
- Quarles, A.M.; Conway, C.S.; Harris, S.M.; Osler, J.E., II; Rech, L. Integrating digital/mobile learning strategies with students in the classroom at the historical black college/university (HBCU). In Handbook of Research on Digital Content, Mobile Learning, and Technology Integration Models in Teacher Education; IGI Global: Hershey, PA, USA, 2018; pp. 390–408. [Google Scholar]
- Briz-Ponce, L.; Pereira, A.; Carvalho, L.; Juanes-Méndez, J.A.; García-Peñalvo, F.J. Learning with mobile technologies—Students’ behavior. Comput. Hum. Behav. 2017, 72, 612–620. [Google Scholar] [CrossRef]
- Chu, C.-M. Special Education and Computer Technology; Wu Nan Publishing Co.: Taipei, Taiwan, 1999. [Google Scholar]
- Richter, J.; Scheiter, K.; Eitel, A. Signaling text-picture relations in multimedia learning: A comprehensive meta-analysis. Educ. Res. Rev. 2016, 17, 19–36. [Google Scholar] [CrossRef]
- GebreYohannes, H.M.; Bhatti, A.H.; Hasan, R. Impact of multimedia in Teaching Mathematic. Int. J. Math. Trends Technol. 2016, 39, 80–83. [Google Scholar] [CrossRef]
- Davis, F.D. Perceived Usefulness, Perceived Ease of Use, and User Acceptance of Information Technology. MIS Q. 1989, 13, 319–340. [Google Scholar] [CrossRef]
- Fishbein, M.; Ajzen, I. Belief, Attitude, Intention, and Behavior: An Introduction to Theory and Research; Addison-Wesley: Reading, MA, USA, 1975. [Google Scholar]
- Ajzen, I. From Intentions to Actions: A theory of Planned Behavior. In Action-Control: From Cognition to Behavior; Kuhl, J., Beckman, J., Eds.; Springer Science & Business Media: Berlin, Germany, 1985; pp. 11–39. [Google Scholar]
- Sánchez-Prieto, J.C.; Olmos-Migueláñez, S.; García-Peñalvo, F.J. MLearning and pre-service teachers: An assessment of the behavioral intention using an expanded TAM model. Comput. Hum. Behav. 2017, 72, 644–654. [Google Scholar] [CrossRef]
- Chintalapati, N.; Daruri, V.S.K. Examining the use of YouTube as a Learning Resource in higher education: Scale development and validation of TAM model. Telemat. Inform. 2017, 34, 853–860. [Google Scholar] [CrossRef]
- Lu, H.; Lin, P.; Chen, A.N. An empirical study of behavioral intention model: Using learning and teaching styles as individual differences. J. Discrete Math. Sci. Cryptogr. 2017, 20, 19–41. [Google Scholar] [CrossRef]
- Cakir, R.; Solak, E. Attitude of Turkish EFL Learners towards e-Learning through Tam Model. Procedia Soc. Behav. Sci. 2015, 176, 596–601. [Google Scholar] [CrossRef]
- Frydenberg, M.; Andone, D. Collaborative Learning about Augmented Reality from Technology and Business Perspectives. In Proceedings of the 2017 IEEE 17th International Conference on Advanced Learning Technologies (ICALT), Timisoara, Romania, 3–7 July 2017; pp. 493–495. [Google Scholar]
© 2018 by the authors. Licensee MDPI, Basel, Switzerland. This article is an open access article distributed under the terms and conditions of the Creative Commons Attribution (CC BY) license (http://creativecommons.org/licenses/by/4.0/).


