Insular Mid-Pleistocene Giant Rats from the So’a Basin (Flores, Indonesia)
Abstract
1. Introduction
2. The Papagomys group Fossil Context
2.1. Liang Toge (Mid-Holocene)
2.1.1. Papagomys armandvillei (Muridae, Mammalia) (Jentink, 1892)
2.1.2. Papagomys theodorverhoeveni (Muridae, Mammalia) (Musser, 1981)
2.2. Ola Bula and Boa Leza (Early–Middle Pleistocene)
Hooijeromys nusatenggara (Muridae, Mammalia) (Musser, 1981)
2.3. Liang Bua (Late Pleistocene-Holocene)
3. Materials and Methods
3.1. Mata Menge (Early Middle Pleistocene) Stratigraphic Context
3.2. Fossil Preparation
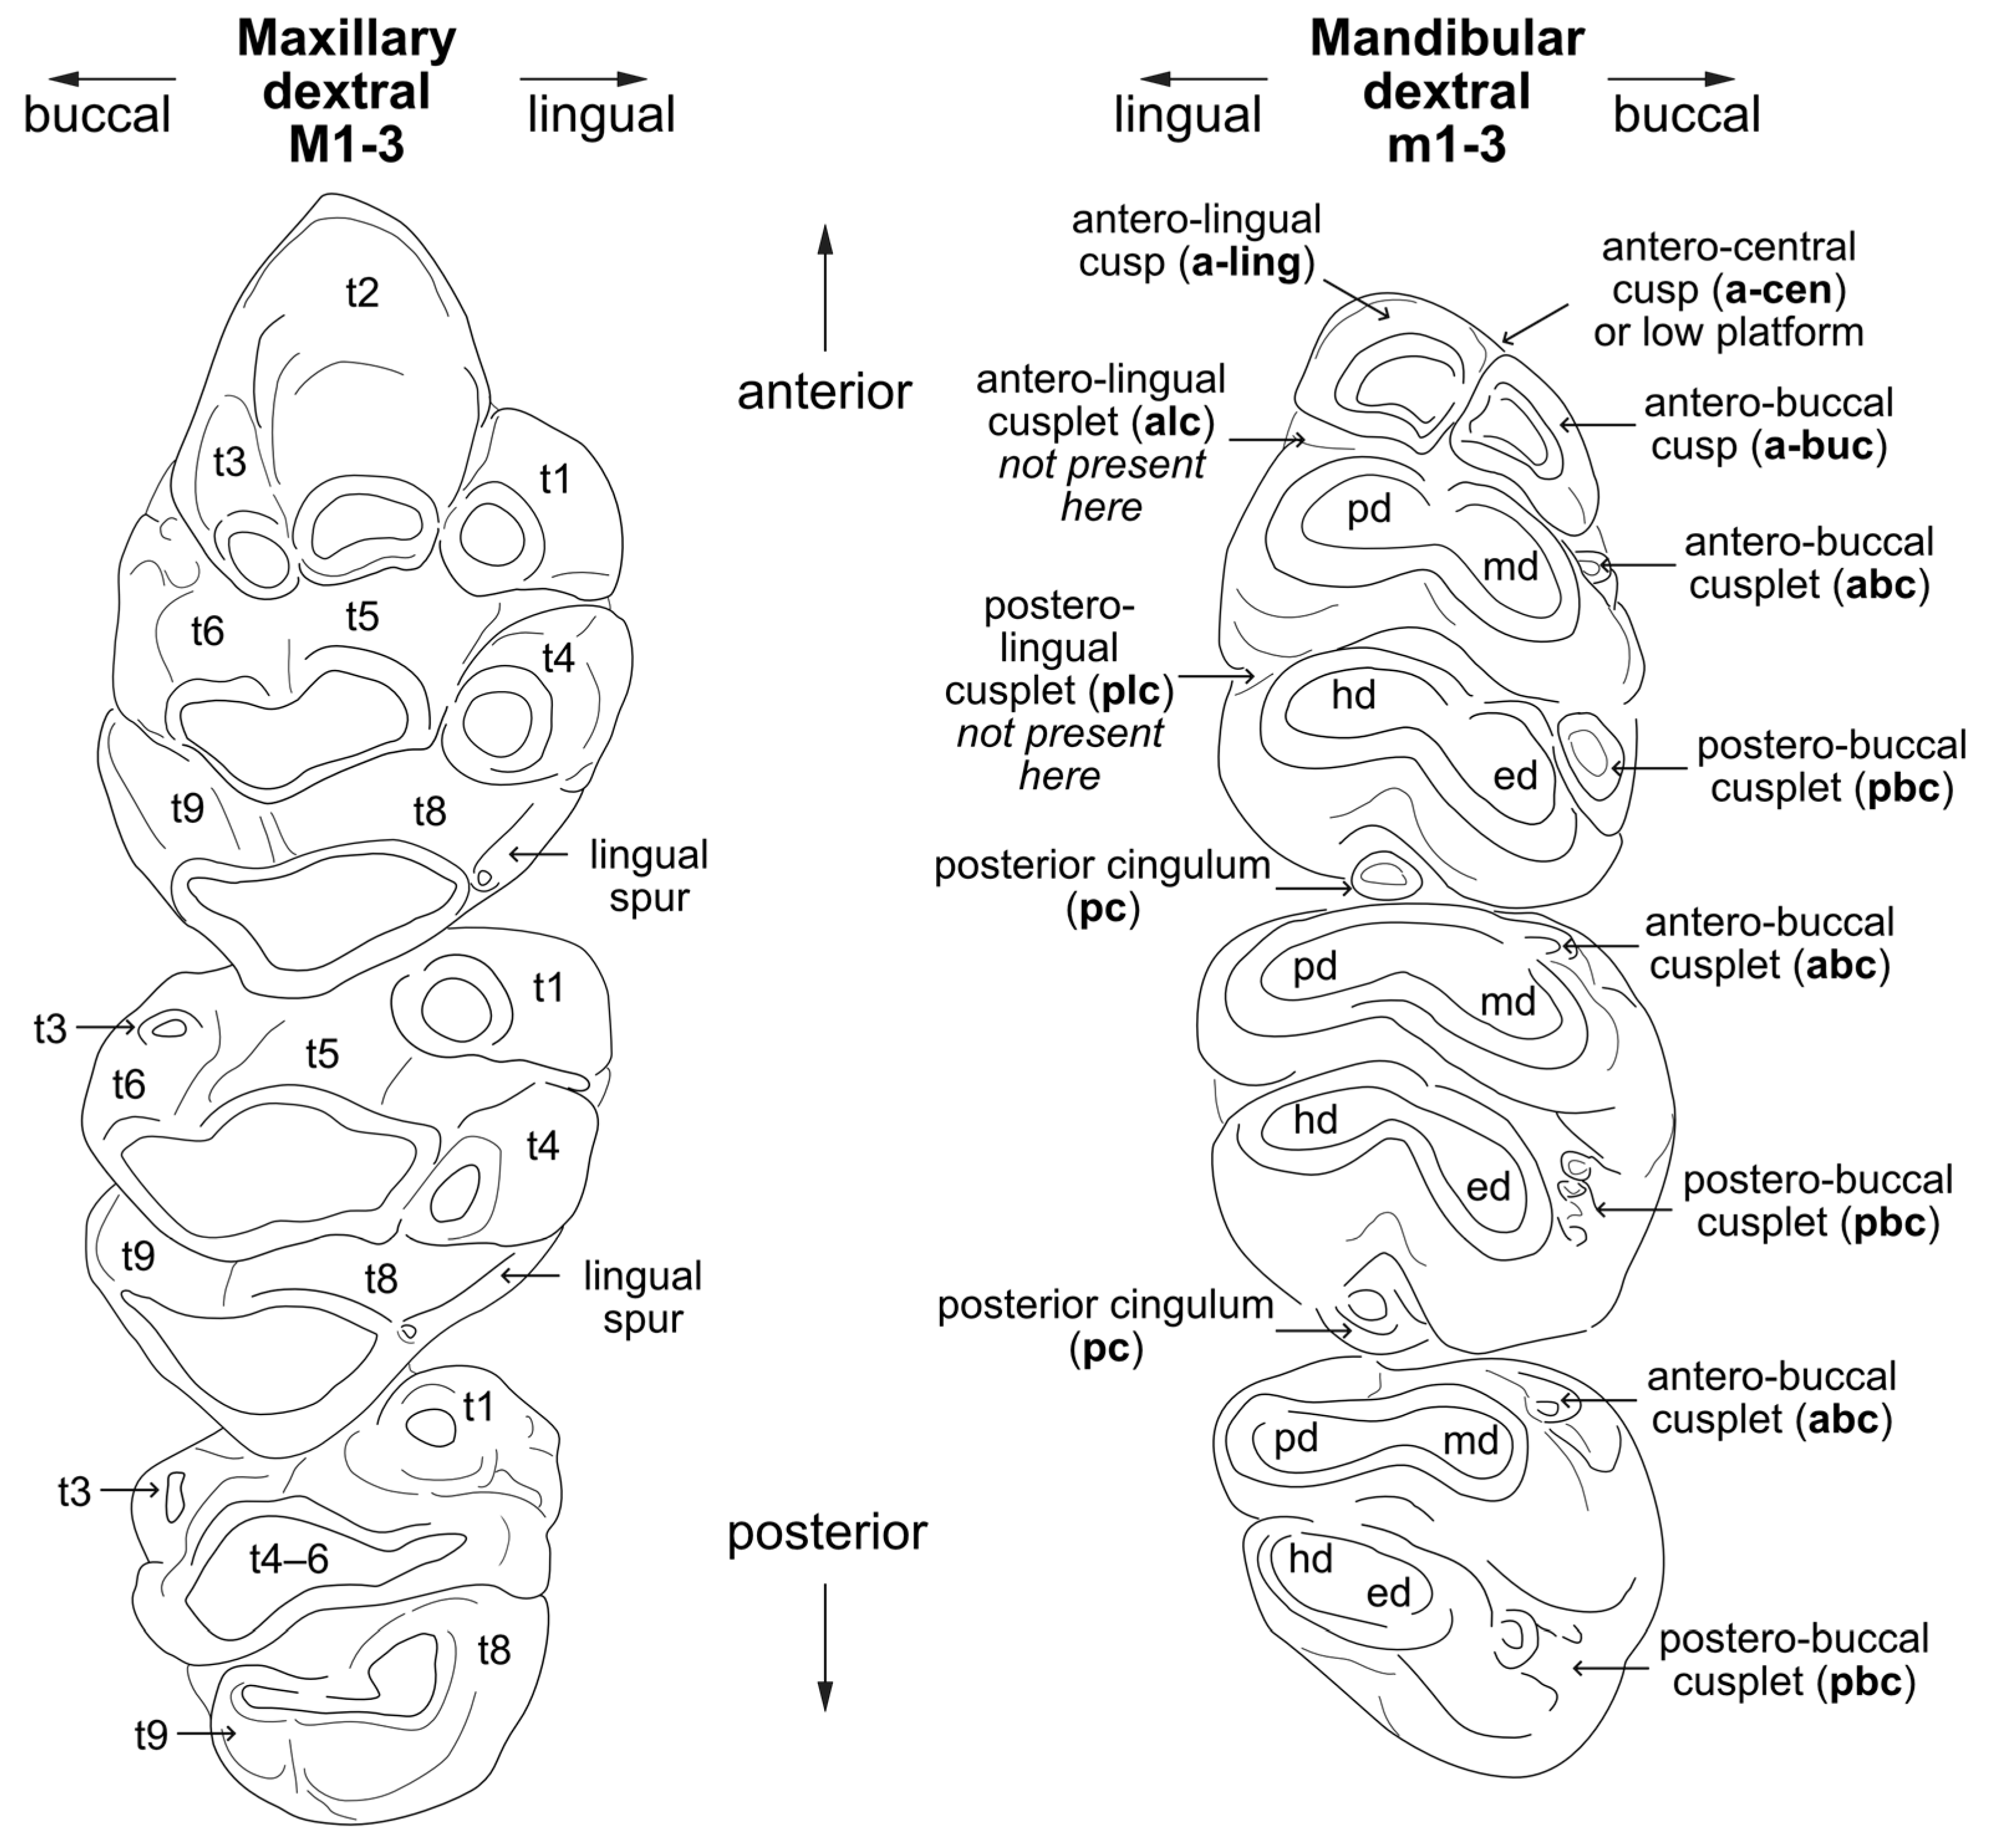
3.3. Nomenclature
3.4. Measurements of the Mata Menge Material
- Molar width: between the points that define the greatest width [14] (p. 72);
- Molar length: between the points that define the greatest length [14] (p. 72);
- Alveolar length: anterior edge of the alveolus of the first molar to the posterior edge of the alveolus of the third molar [31] (p. 332);
- Crown length: from the anterior enamel face of the first molar (excluding the root of the M1) to the posterior enamel face of the third molar, allowing that the presence of matrix renders this measure less reliable than alveolar length [32] (p. 12);
- Palate width: between the lingual alveolus borders of the M1 [14] (p. 92);
- Incisor width: transverse at, or near, the base of the mandibular incisor alveolus [16]
- Diastema length: from the anterior alveolar margins of the m1 to the posterior alveolar margin of the incisor [31] (p. 332).
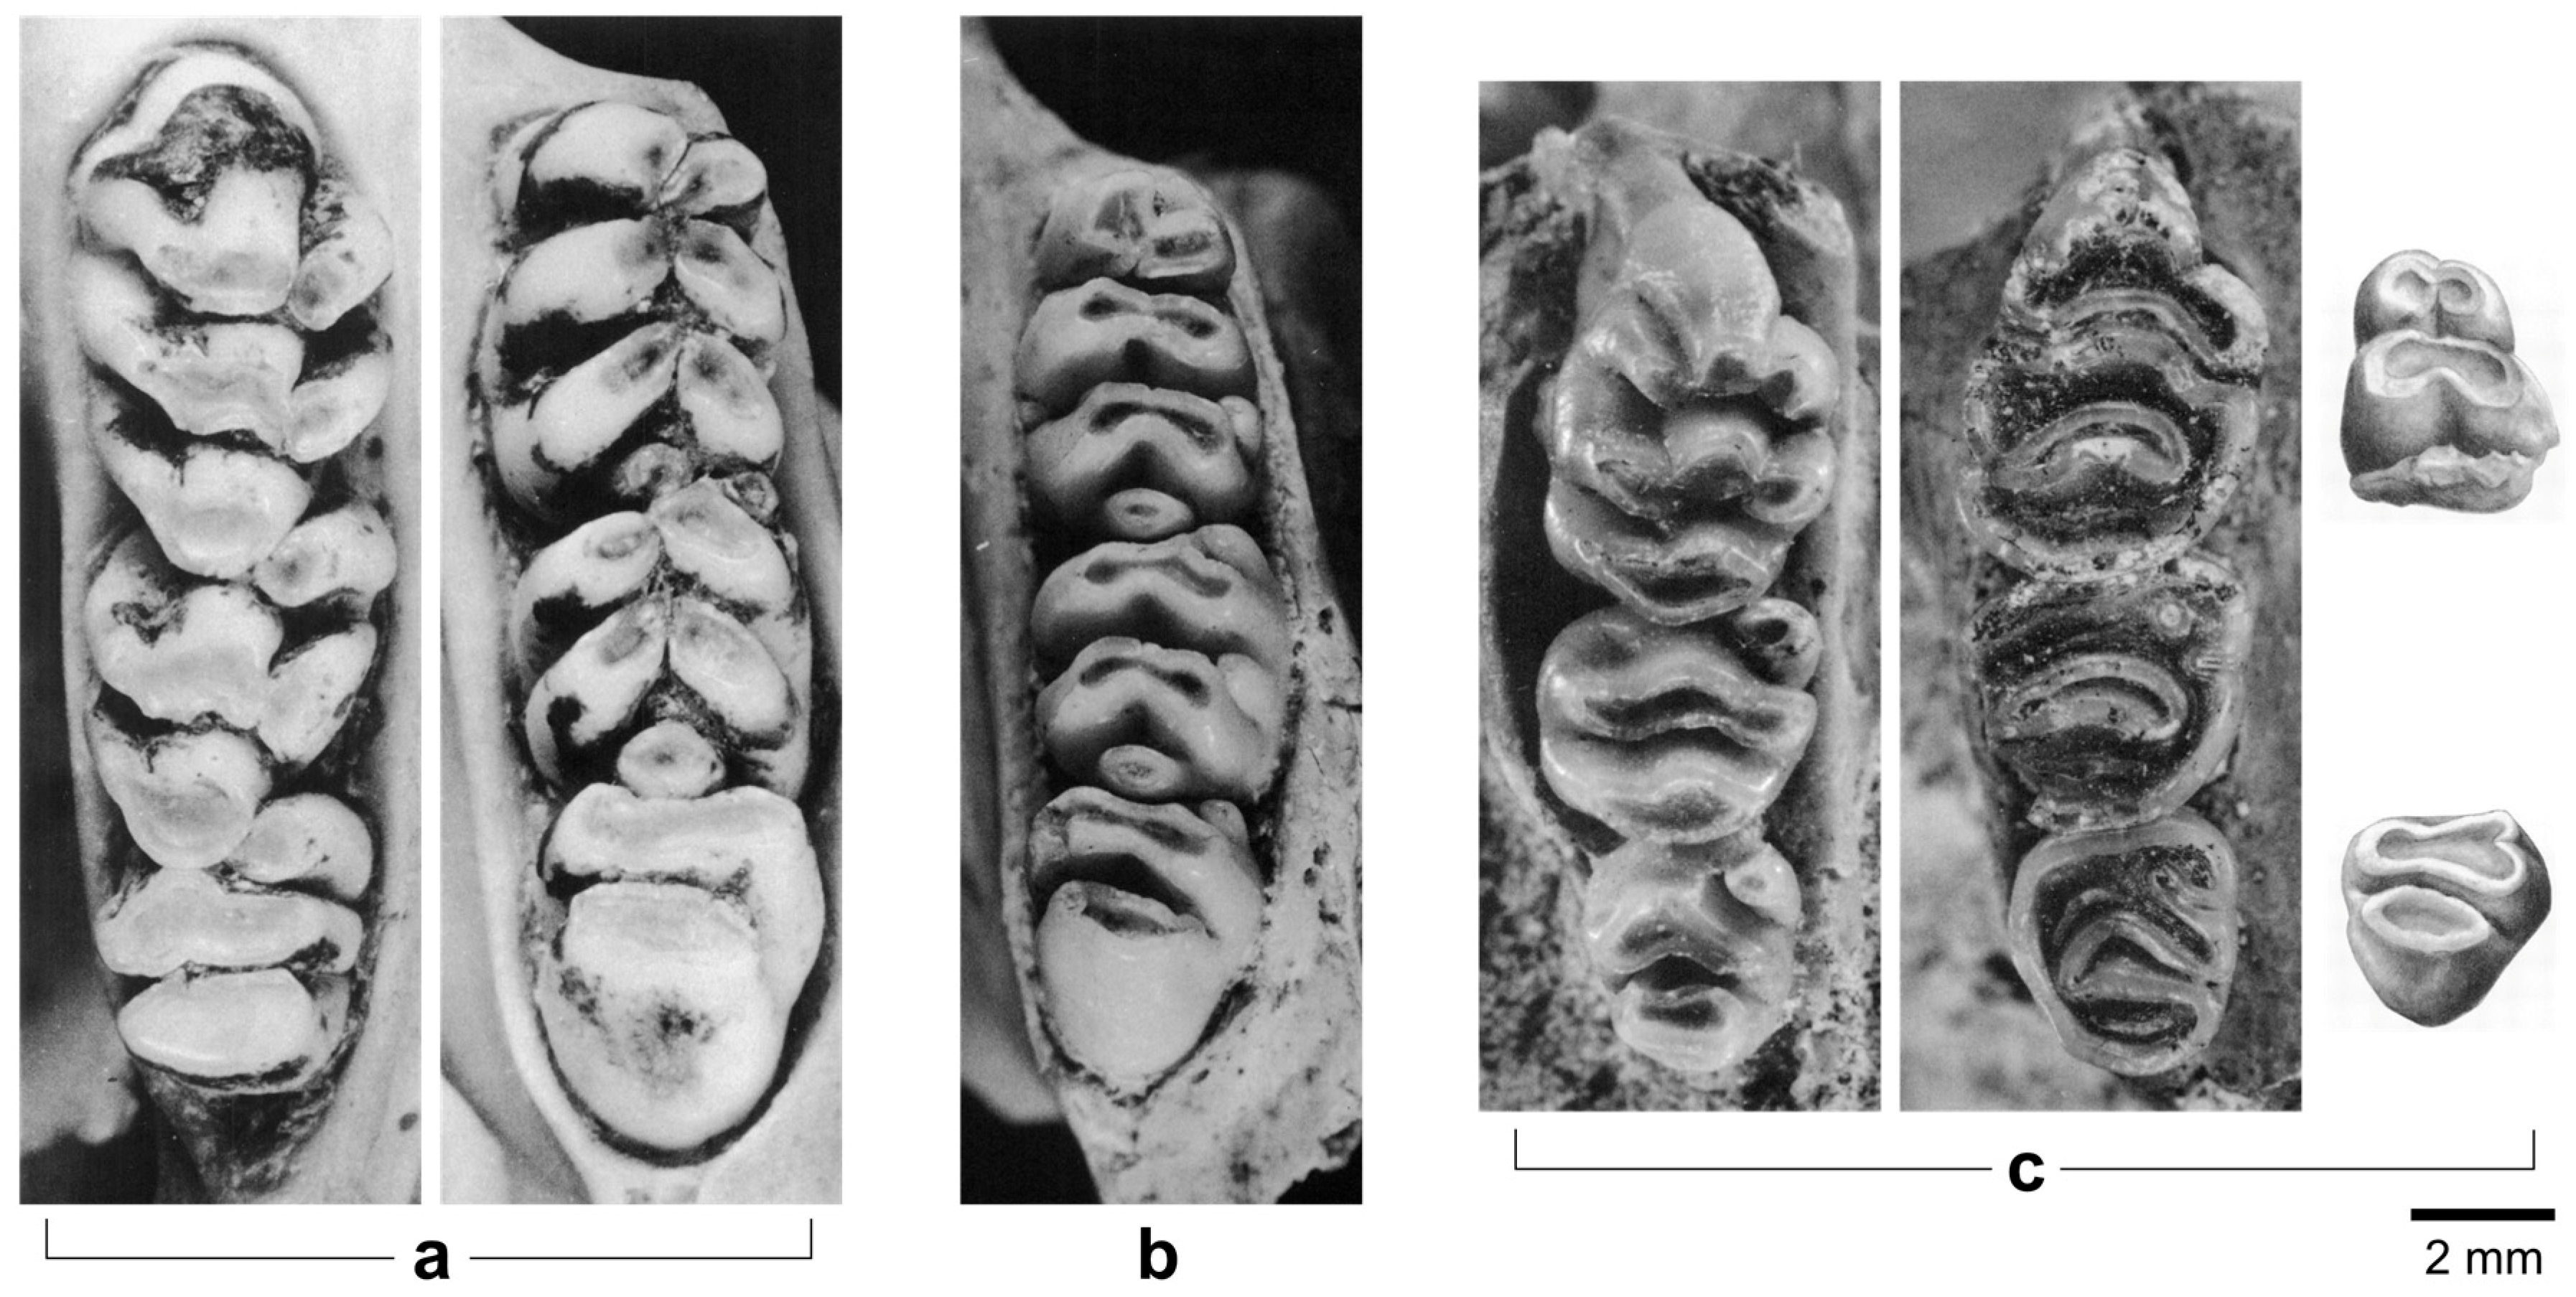
3.5. Molar Morphology
3.6. Calculation of Minimum Number of Individuals (MNI)
3.7. Image Processing
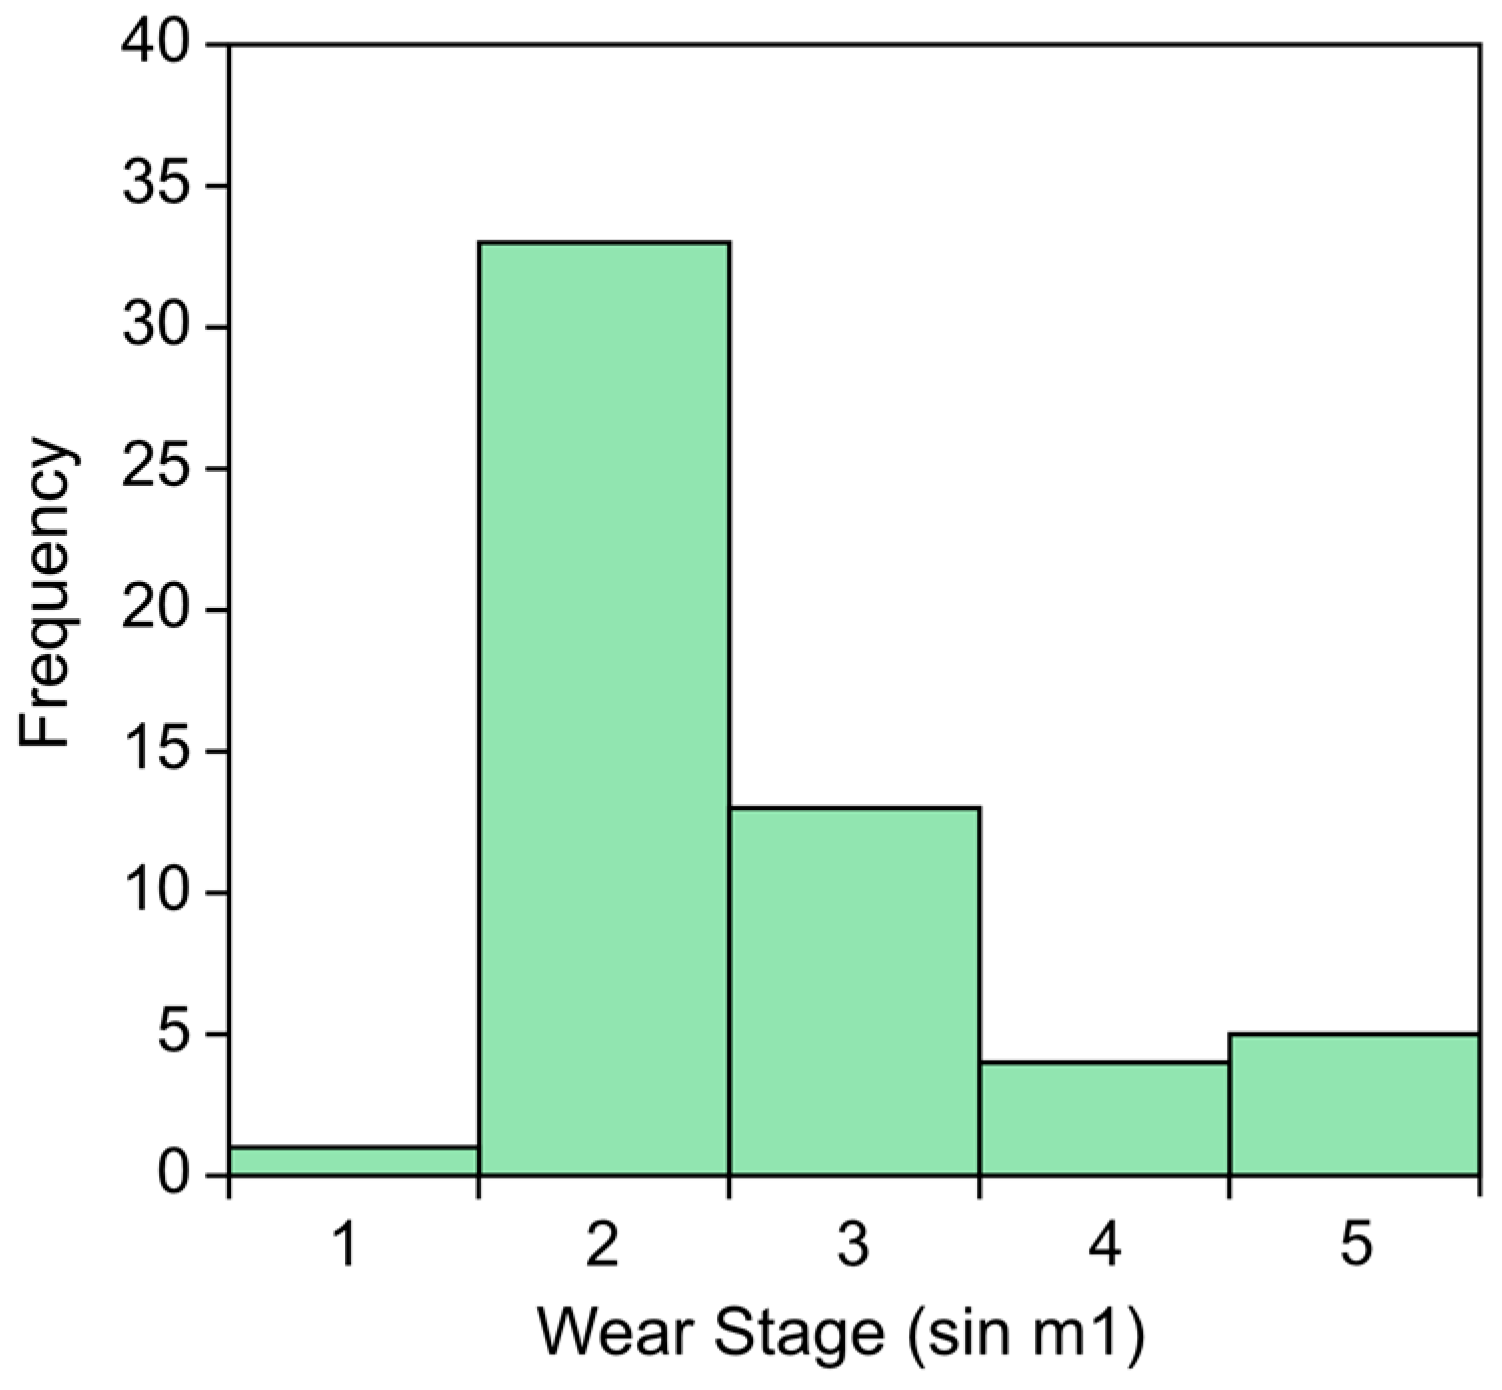
3.8. Wear Stage (WS) Estimates
3.9. Statistical Analyses
- Histograms: Each histogram is optimal, with the wider sets of bins indicating less variation in the dataset.
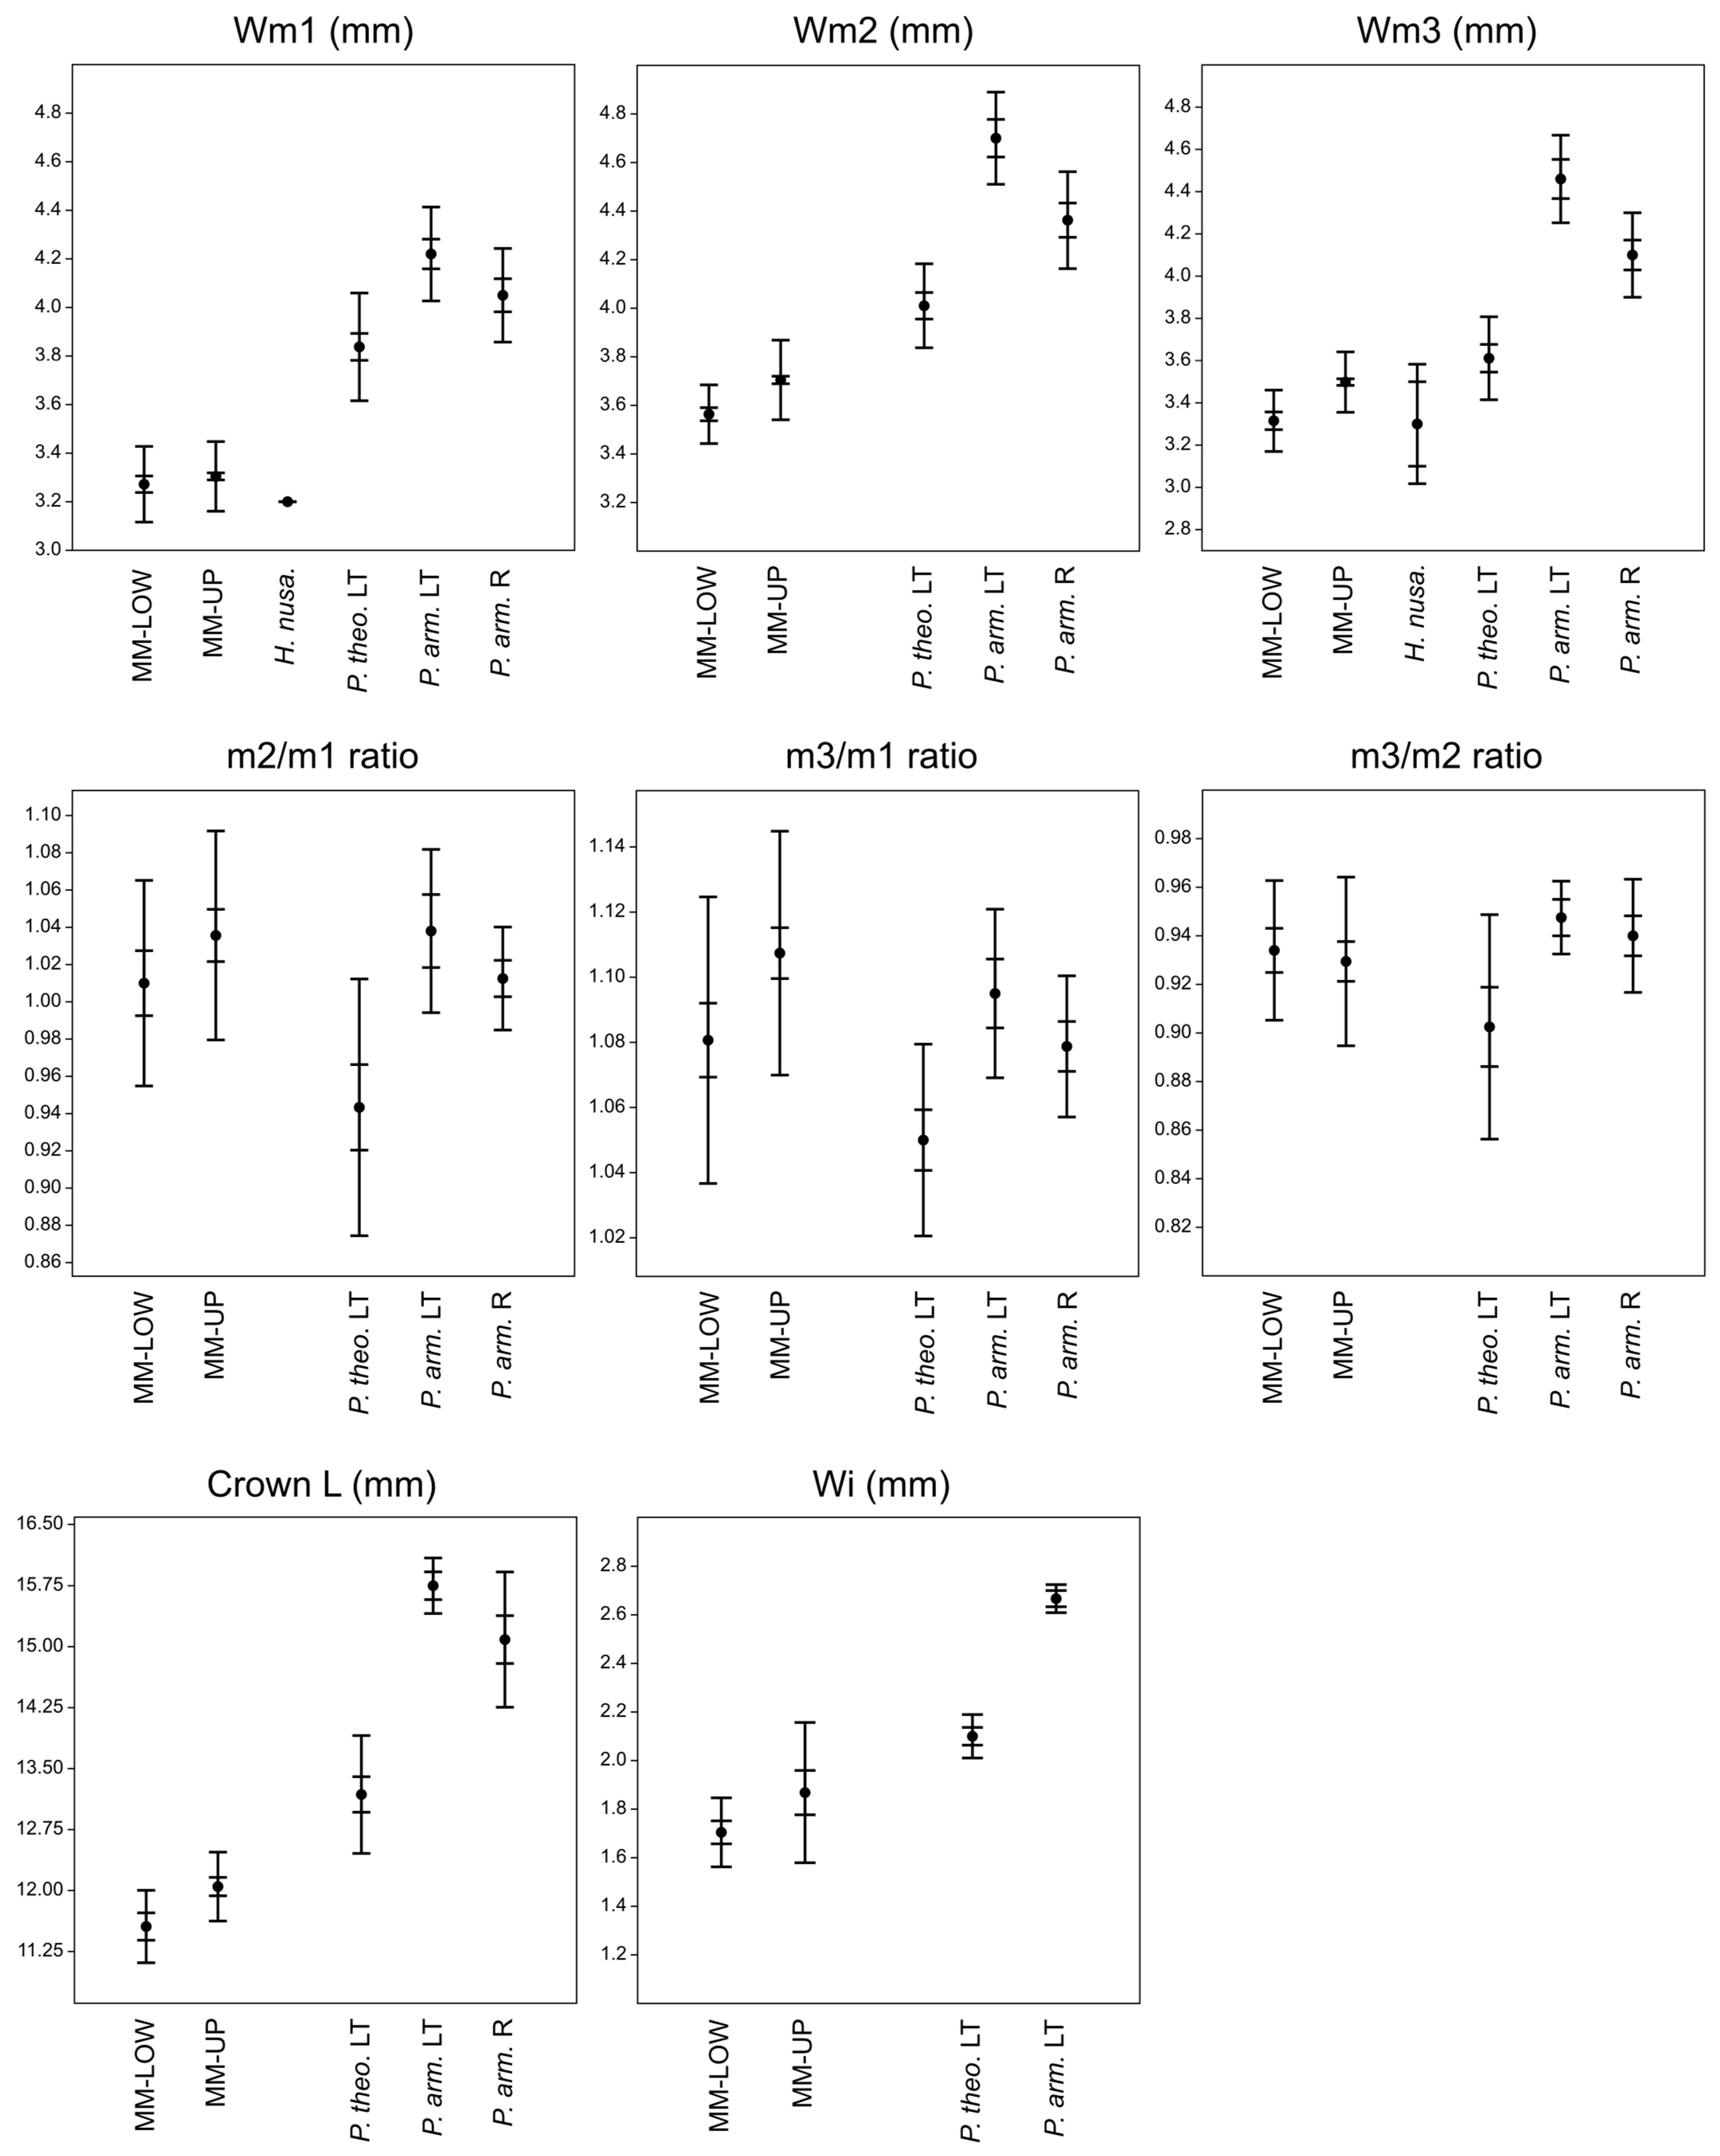
- Mean and whisker plots: Mean, standard error, and whisker length of one standard deviation (1 SD).
- Correlations (tau): Kendall’s coefficient of rank correlation (tau-b) is a robust and conservative parametric correlation that is recommended for comparing ordinal (e.g., estimated wear stage) and continuous (e.g., molar widths, lengths) data, especially when dealing with small sample sizes and/or when the sample values tend to clump (for a discussion, see [44]). Where our analyses meet the requirements for a Pearson’s correlation coefficient (r), this is applied. Significance is set at p < 0.05 for both.
- Two sample tests (U and A): Given our analyses typically involve substantially fewer specimens in one of the data sets, and/or one of the data sets is not normally distributed, the Mann–Whitney test for stochastic equality (U) is applied, reporting either the exact (when available) or Monte Carlo permutation for p, with significance set at p < 0.05. We apply these tests together with the Vargha–Delaney A (effect size) to indicate the size of the difference (~0.5x ≈ y, ~0x < y, ~1x > y).
- Coefficient of species variability (V1/√logN): According to Freudenthal and Cuenca Bescos [45], Pearson’s coefficient of variation is likely specific to a taxonomic group, and the limitation of this application is that it requires a normal distribution. This likely would not occur when the data contain molar measurements of more than one species, and furthermore, it is more typical that the different species are unequally represented. A consequence of unequal frequencies is that the presence of a small number of a different species will be subsumed into the standard deviations of the larger group. Focusing on fossil cricetid molars from the European Tertiary, Freudenthal and Cuenca Bescos developed a new coefficient, V’, which is 100 × (difference maximum-minimum)/mid-point of the range, divided by the square root of log N. Populations exhibiting an excessive degree of variation could be reasonably assumed to contain two different species and/or lack homogeneity due to other factors, such as errors in data entry. In a later publication, Freudenthal and Martín Suárez [46] applied V’ to the molars of more than 100 samples of fossil and recent Muridae, with each sample containing five or more specimens. The authors published the means and standard deviations of V’ for these samples as constituting the expected values when only one species is represented, and we apply these to the molar widths of the species involved in this analysis.
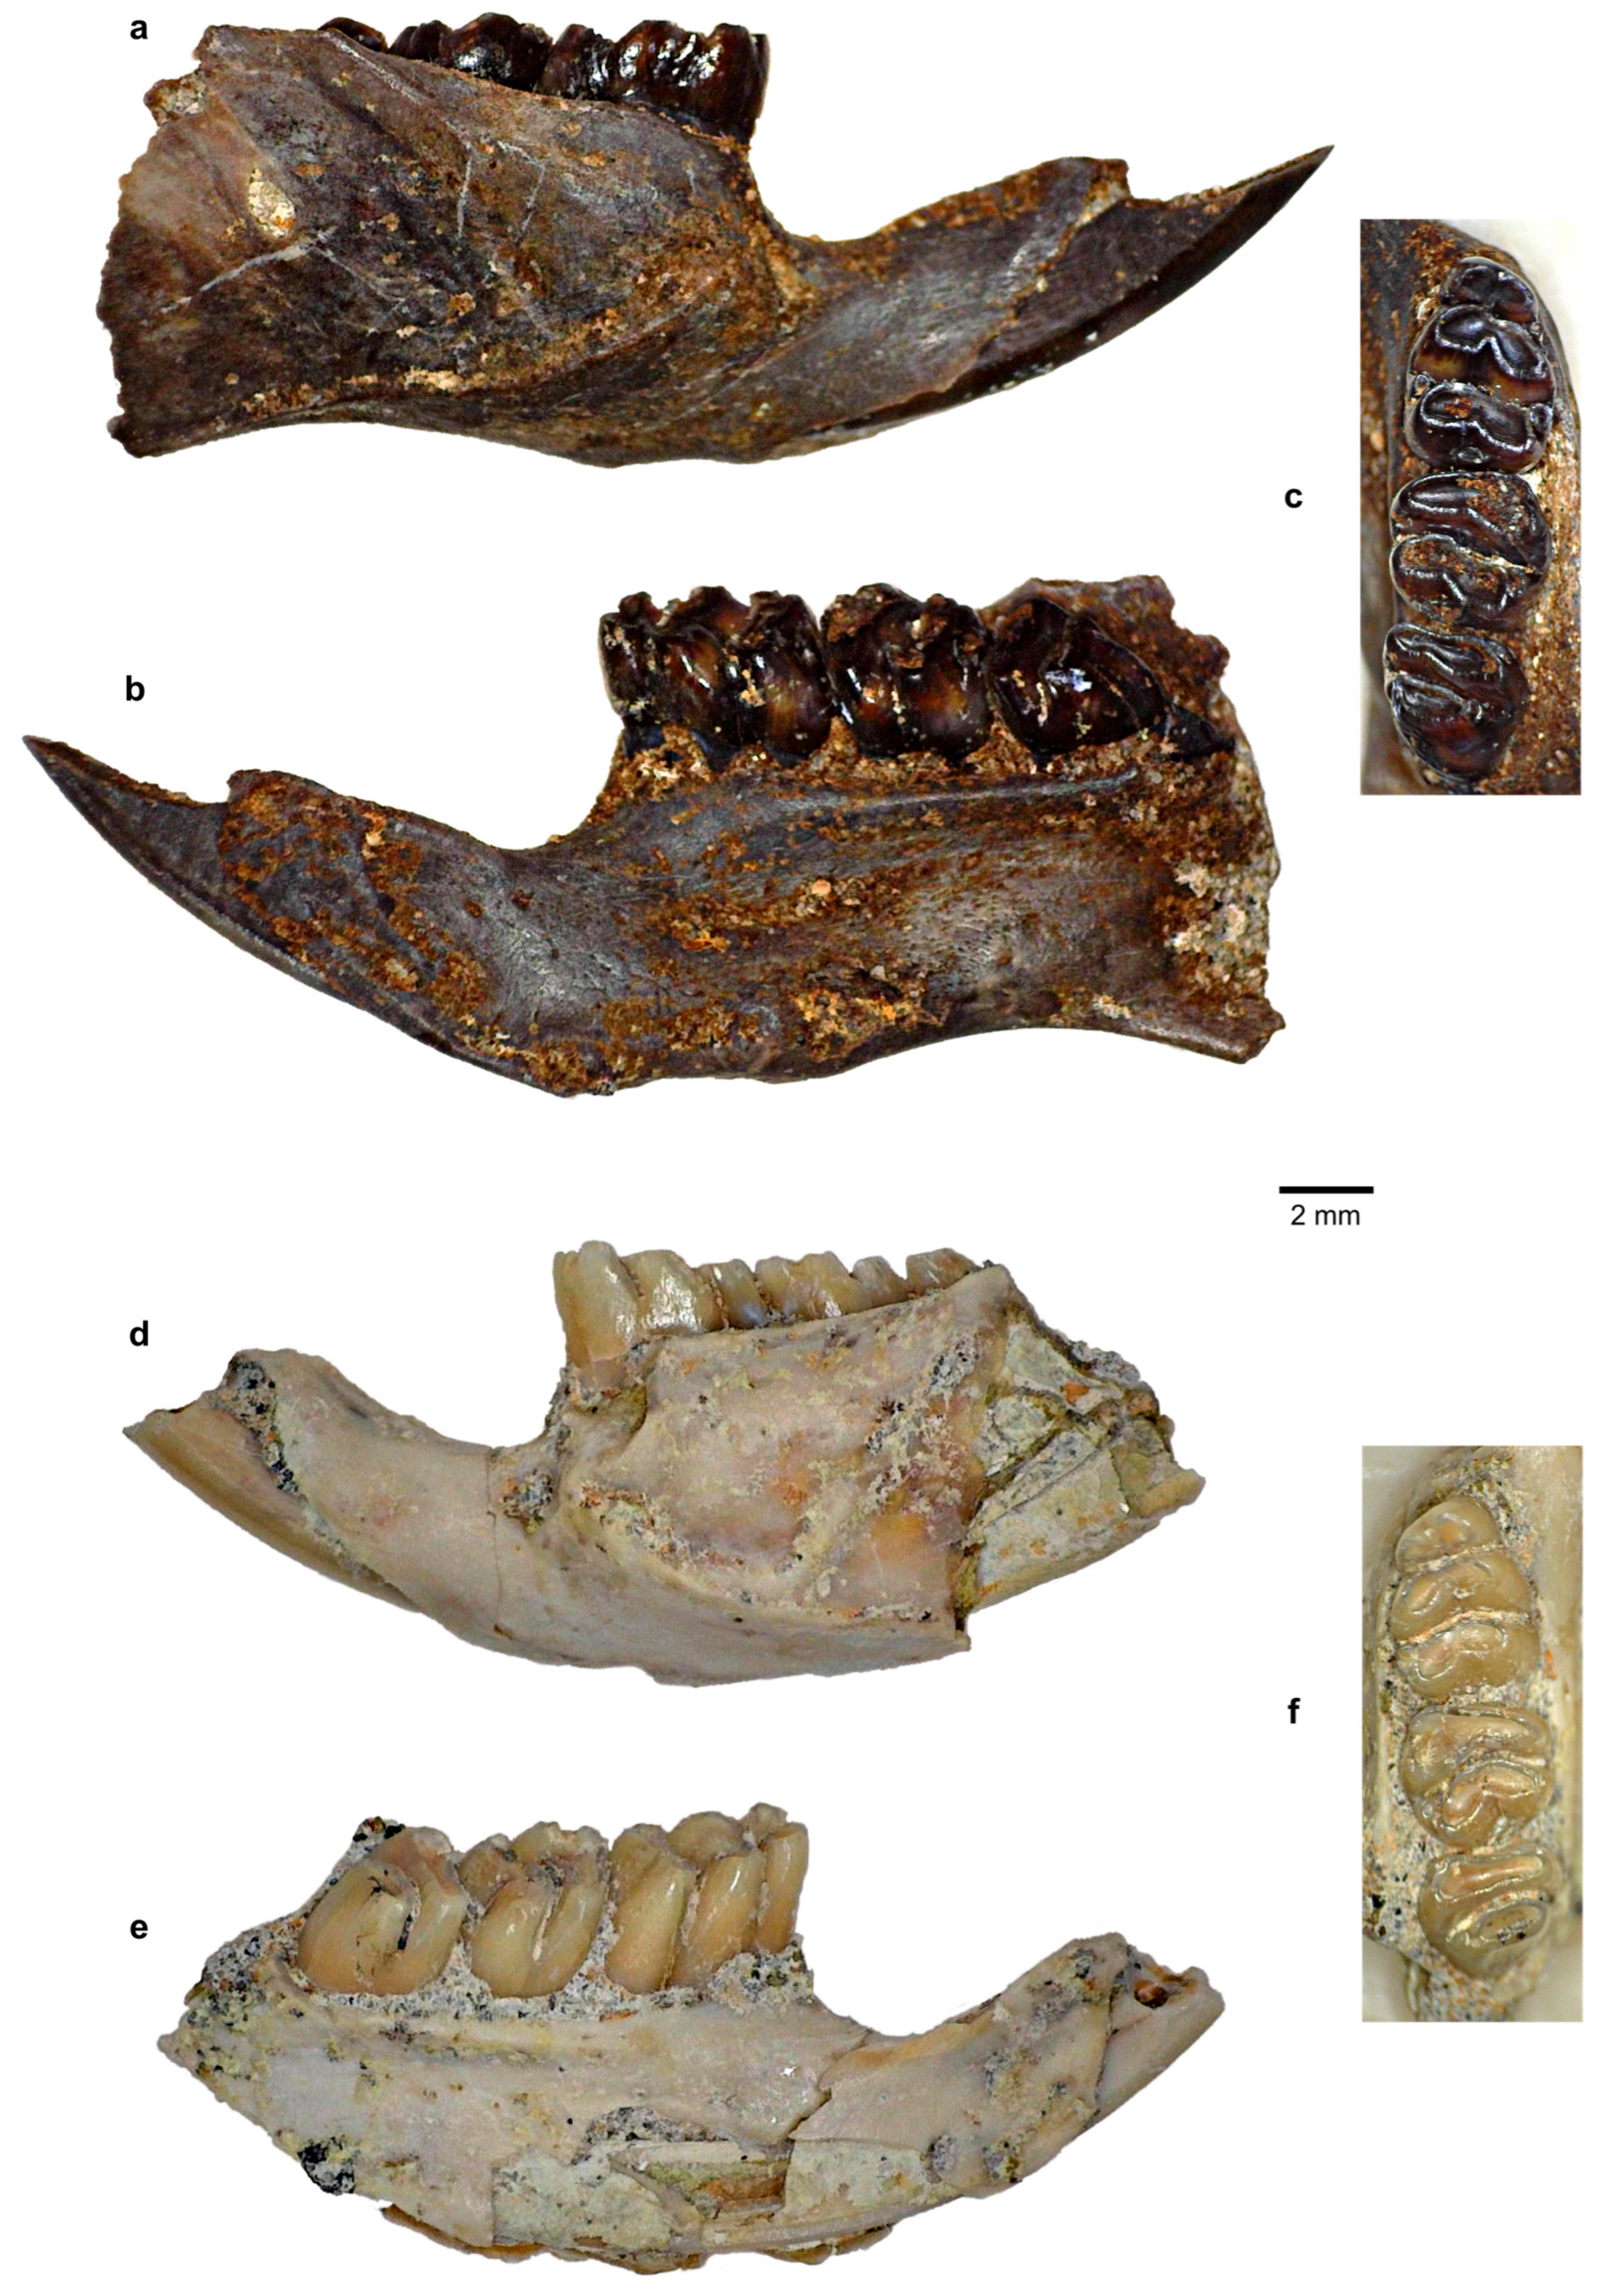
3.10. Association of the Maxillary and Mandibular Rows
3.11. Estimation of Molar Cusp Height
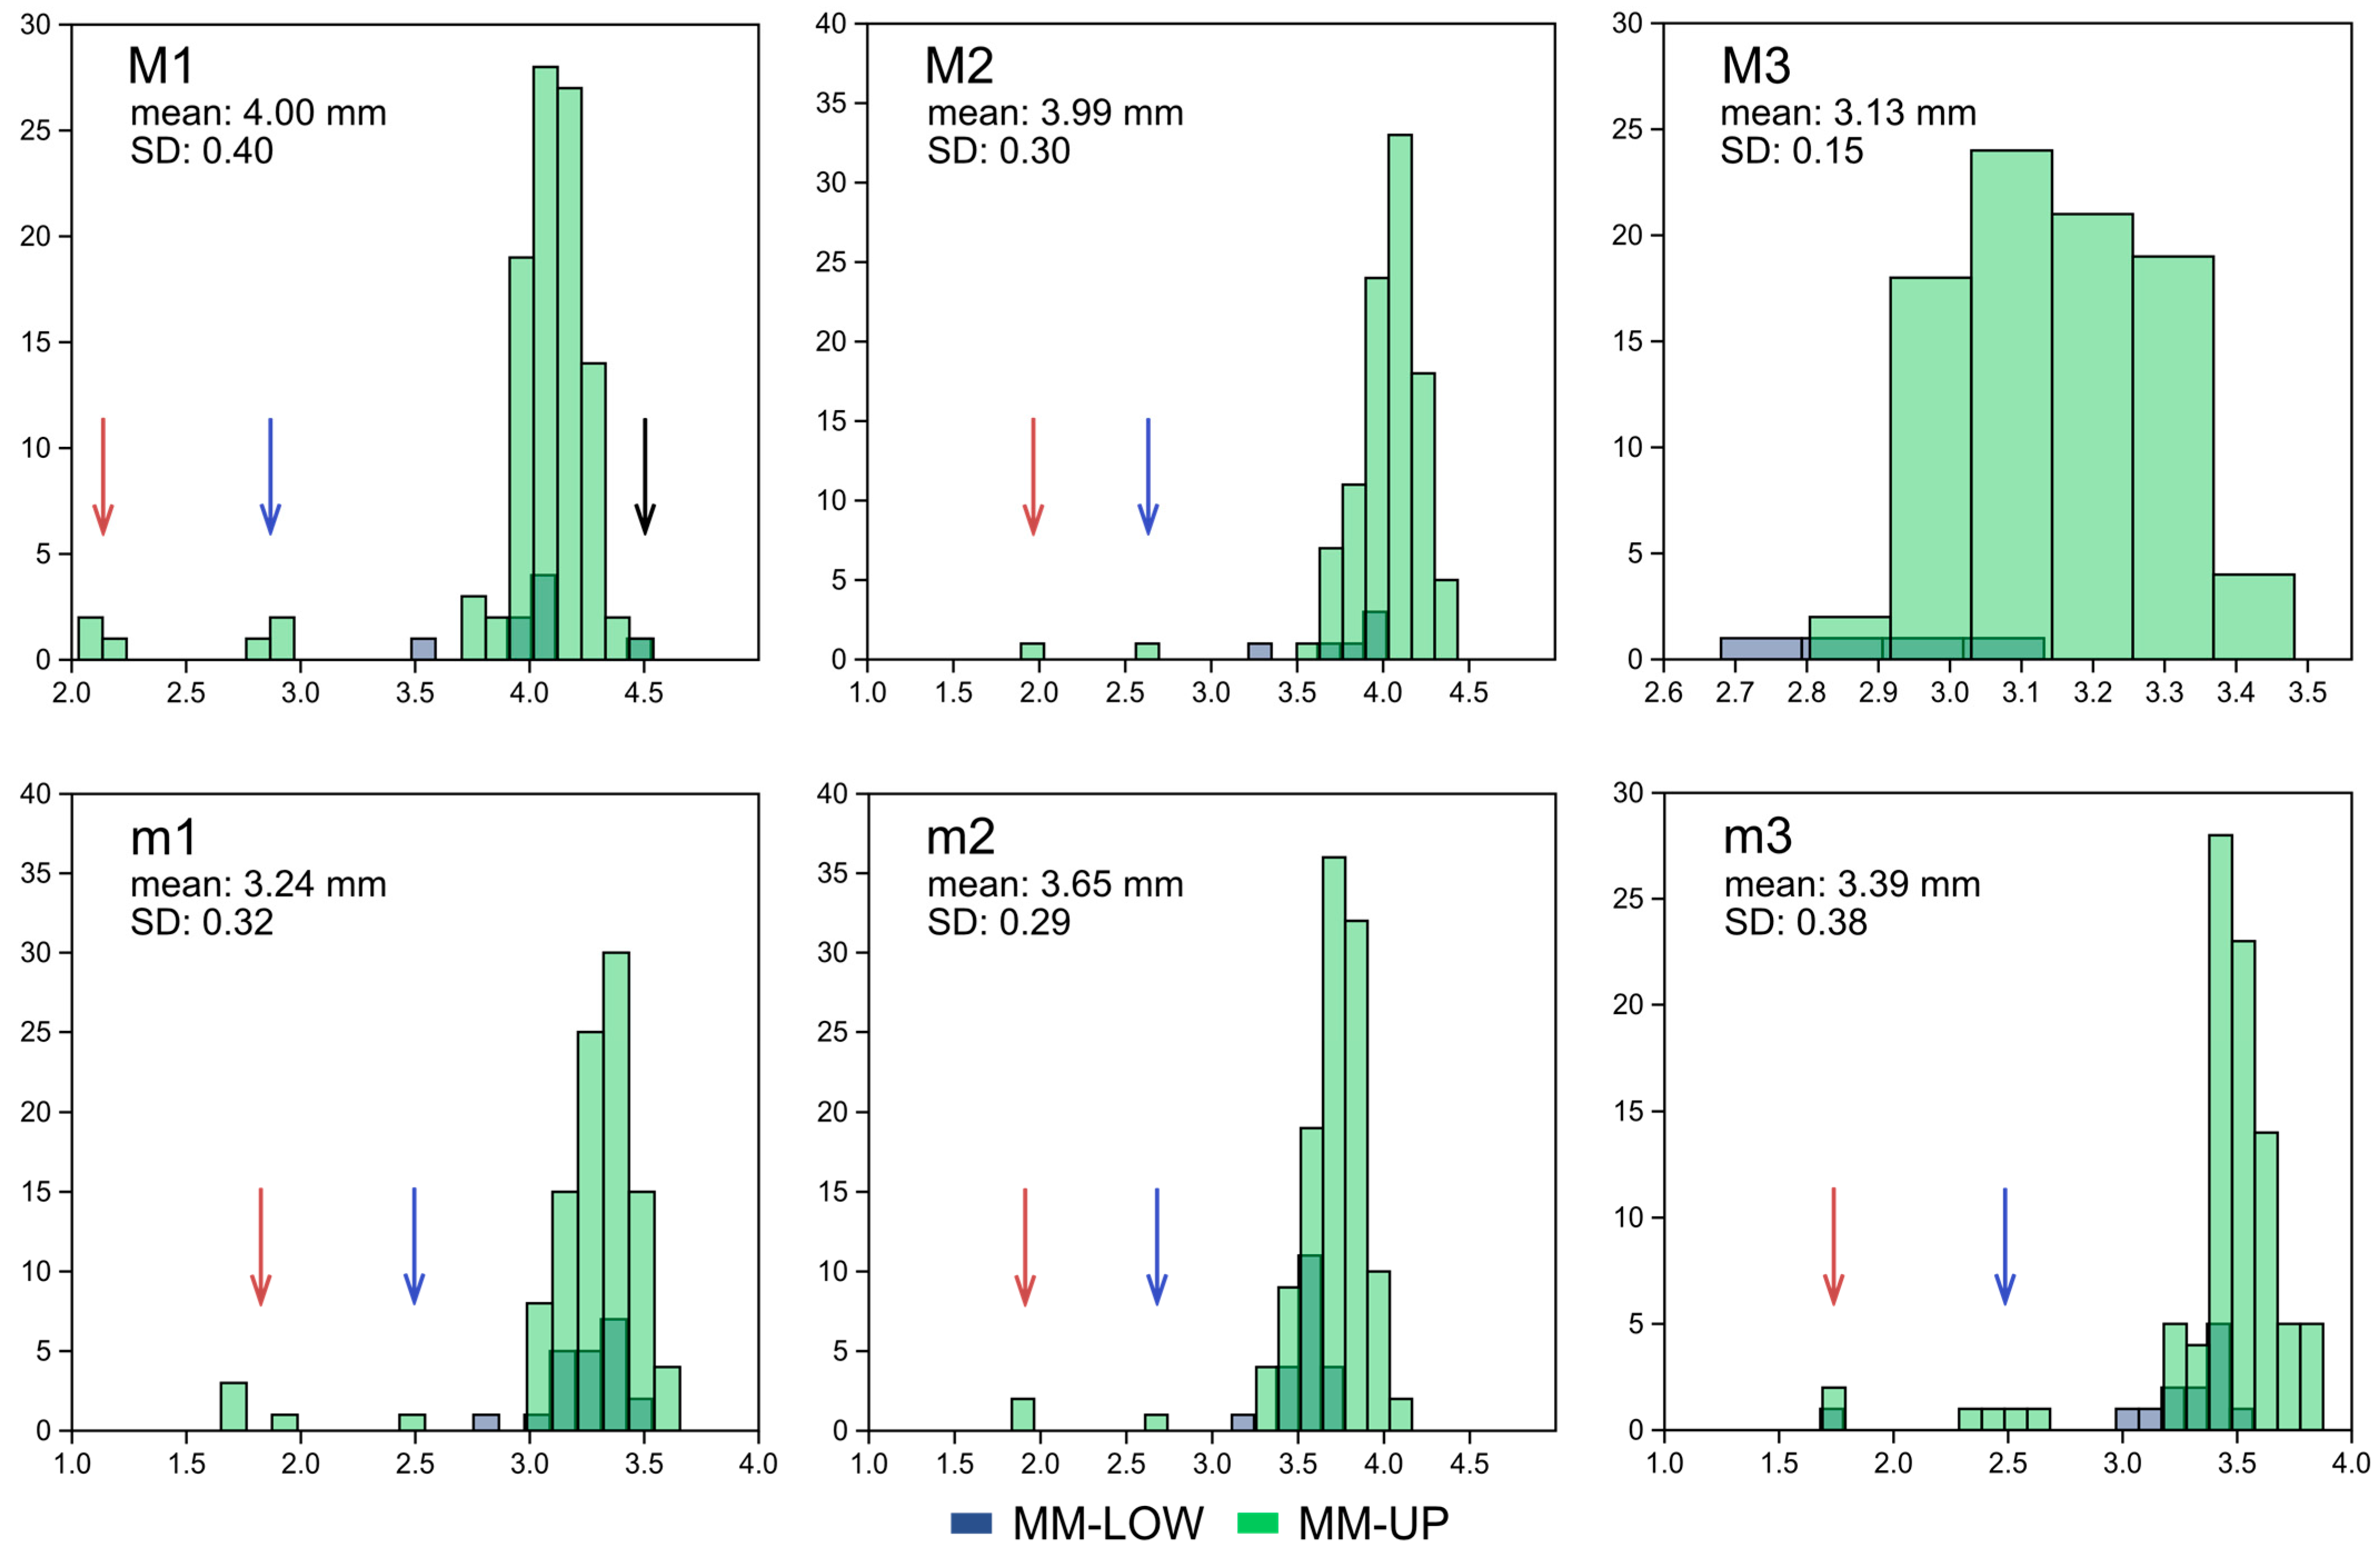
4. Results: Mata Menge Metric Analyses
4.1. Mata Menge Maxillary Molars
4.2. Mata Menge Mandibular Molars
4.3. Association of the Mata Menge Maxillary and Mandibular Rows
5. Results: Mata Menge Morphological Analyses
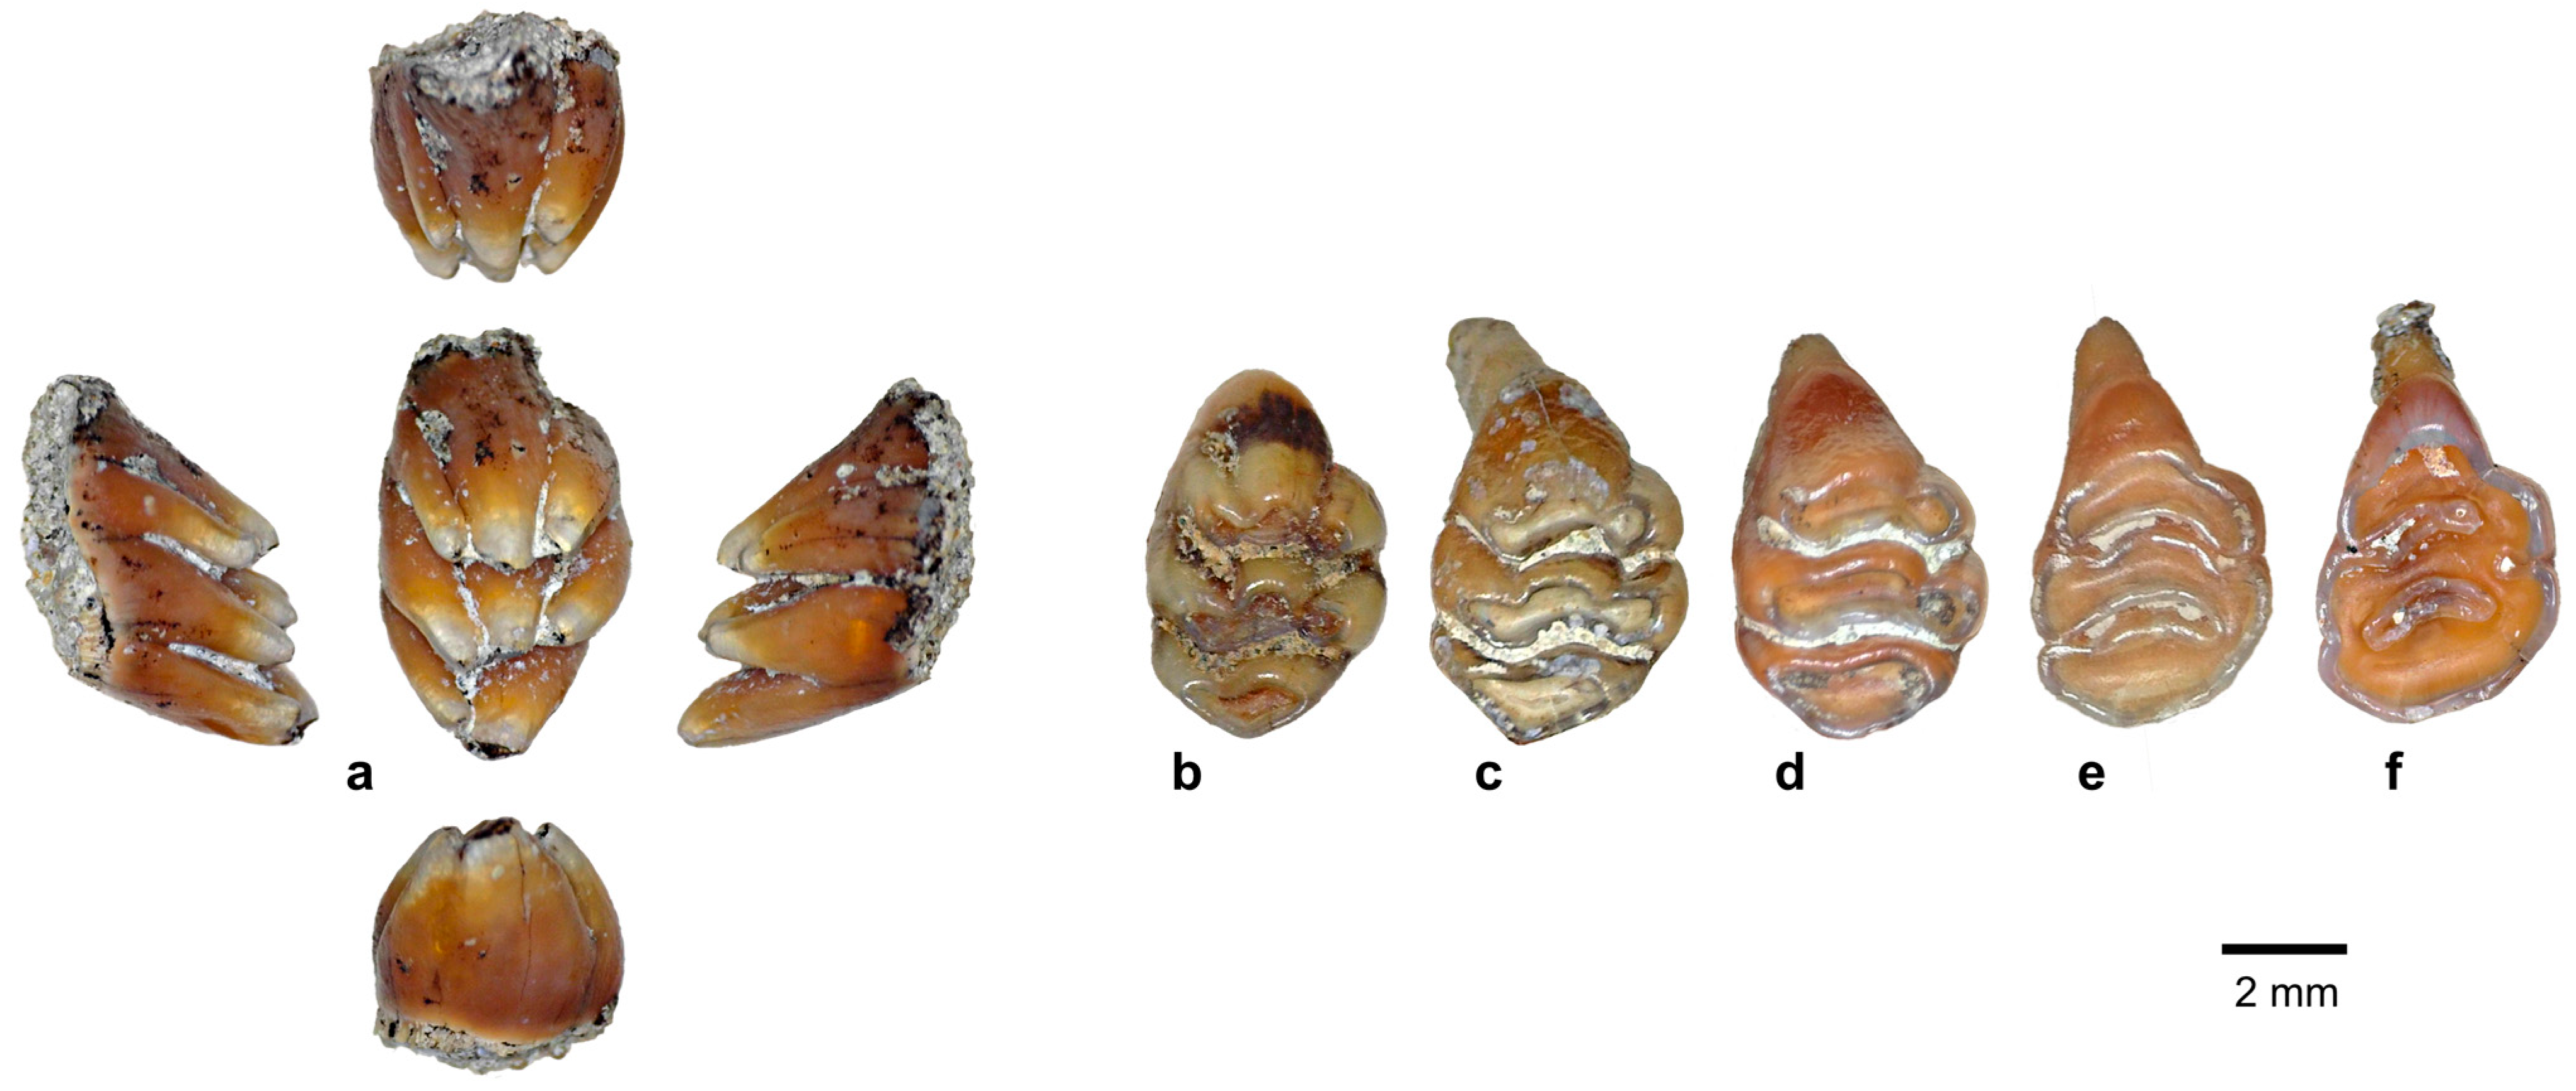
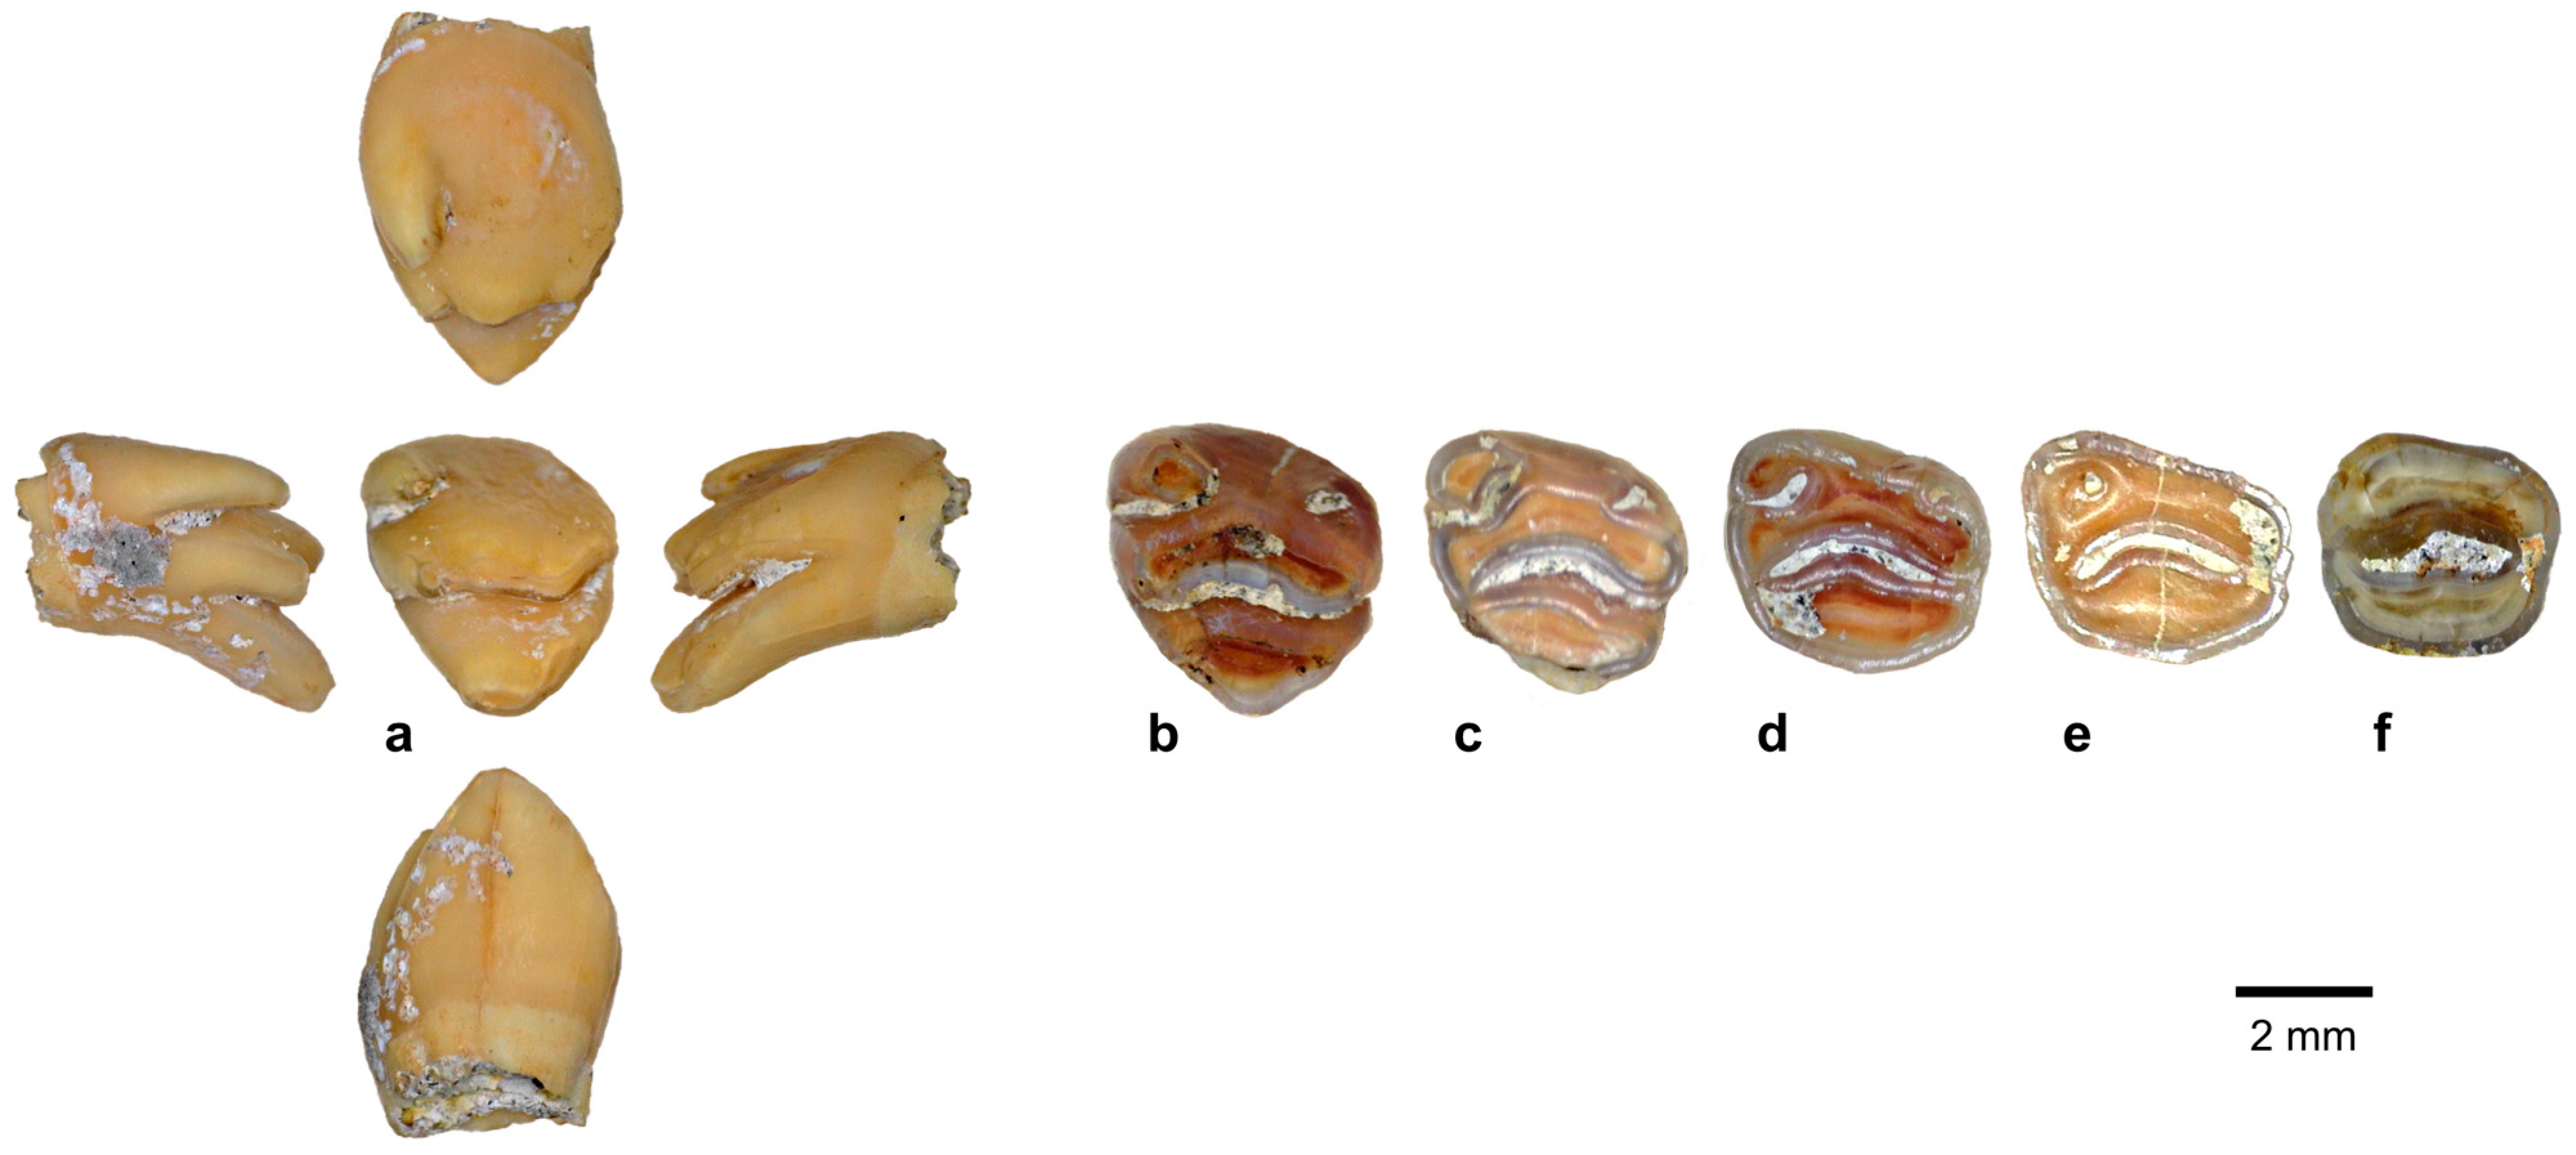
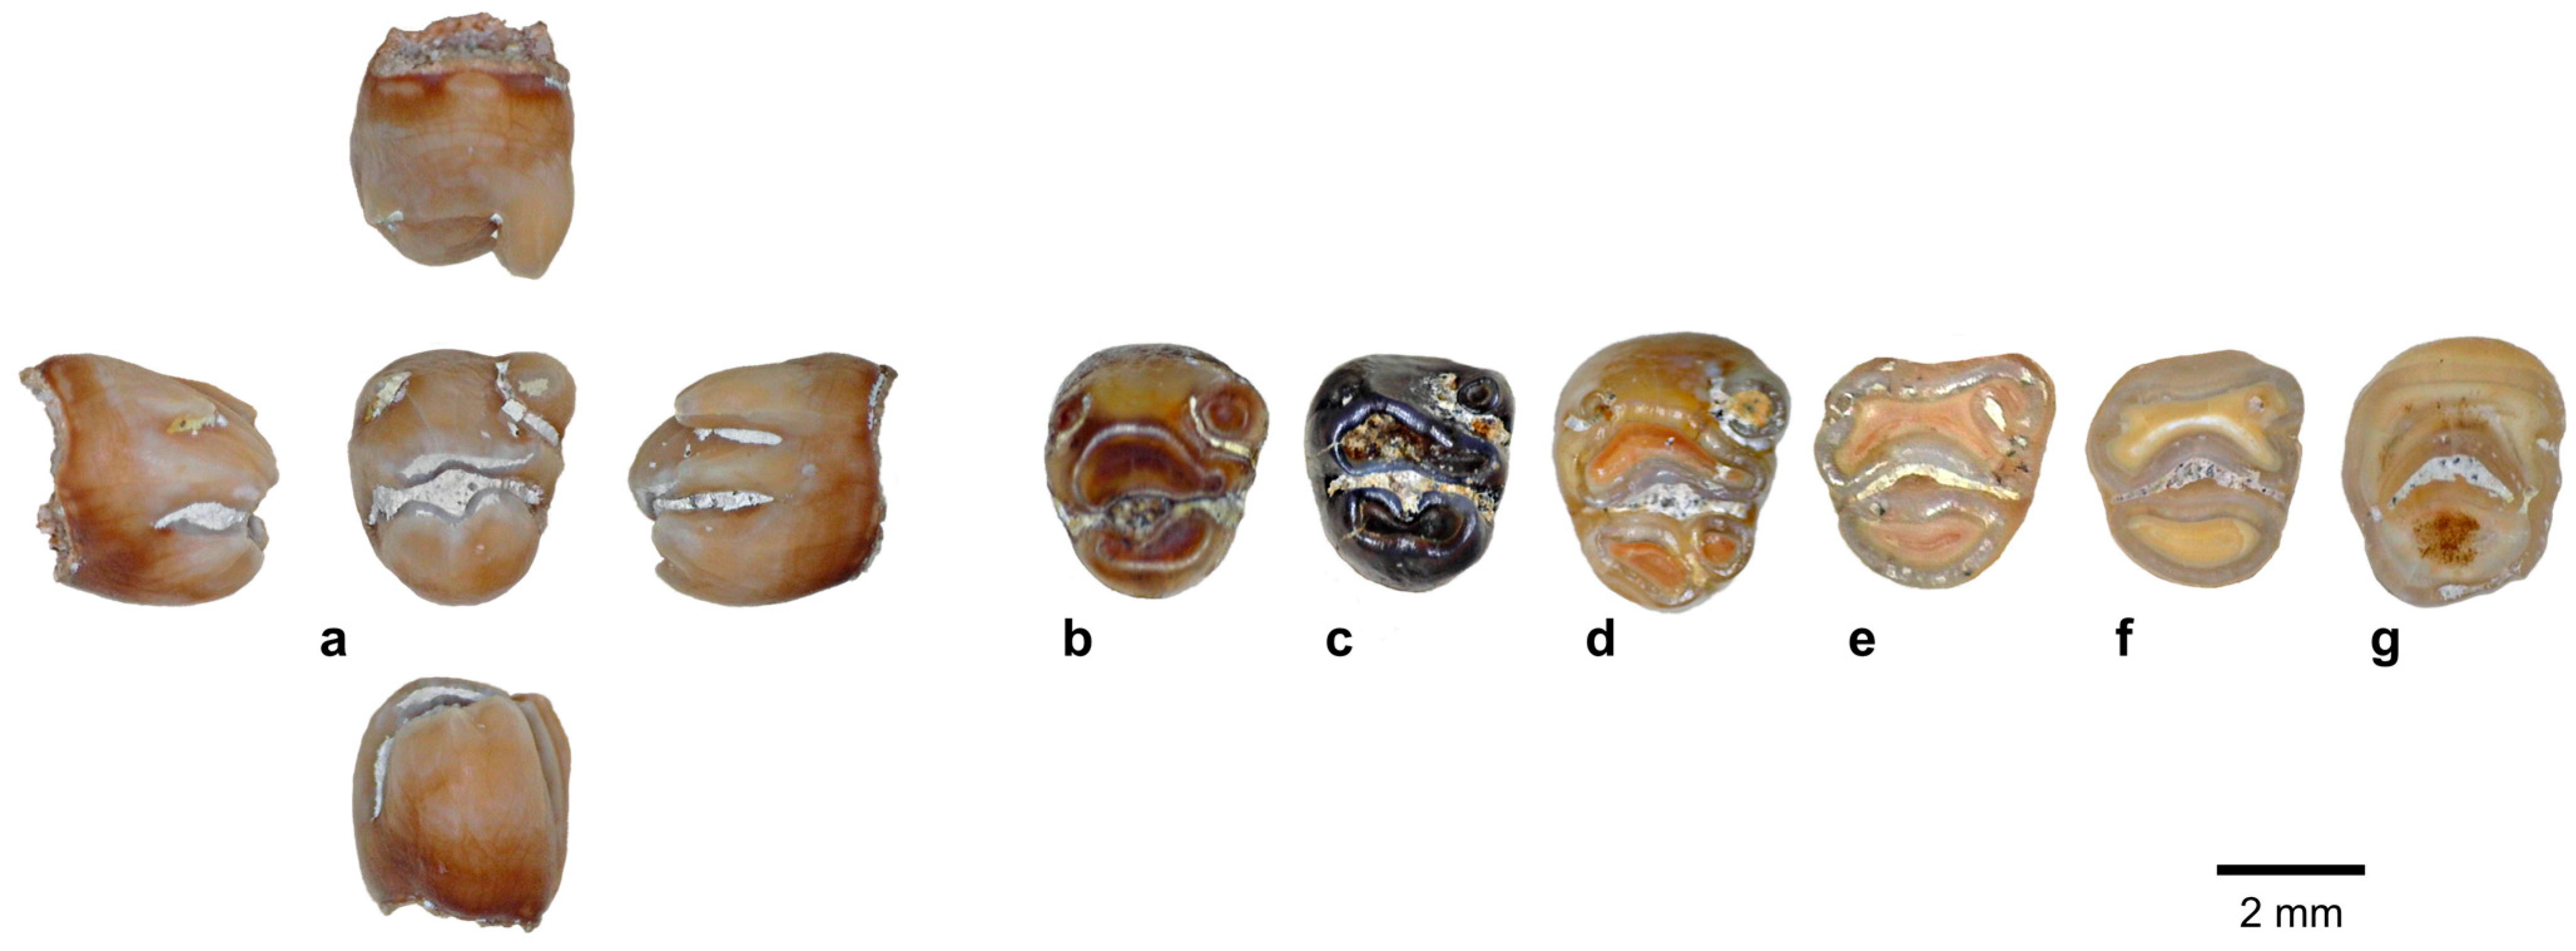
5.1. Mata Menge Maxillary Molar Morphology
5.1.1. M1 Morphology
5.1.2. M2 Morphology
5.1.3. M3 Morphology
5.2. Mata Menge Mandibular Molar Morphology
5.2.1. m1 Morphology
5.2.2. m2 Morphology
5.2.3. m3 Morphology
5.3. Mata Menge Molar Roots
5.4. Mata Menge Diet
6. Results: Comparisons of the Papagomys group with the Mata Menge Large Murines
6.1. Metric Comparisons of the Papagomys group with the Mata Menge Large Murines
6.1.1. Papagomys armandvillei
6.1.2. Papagomys theodorverhoeveni
6.1.3. Hooijeromys nusatenggara
6.1.4. Within-Row Molar Proportions
6.1.5. Palate Width Ratios
6.1.6. Incisor Widths
6.1.7. Molar Cusp Heights
6.2. Morphological Comparisons of the Papagomys group with the Mata Menge Large Murines
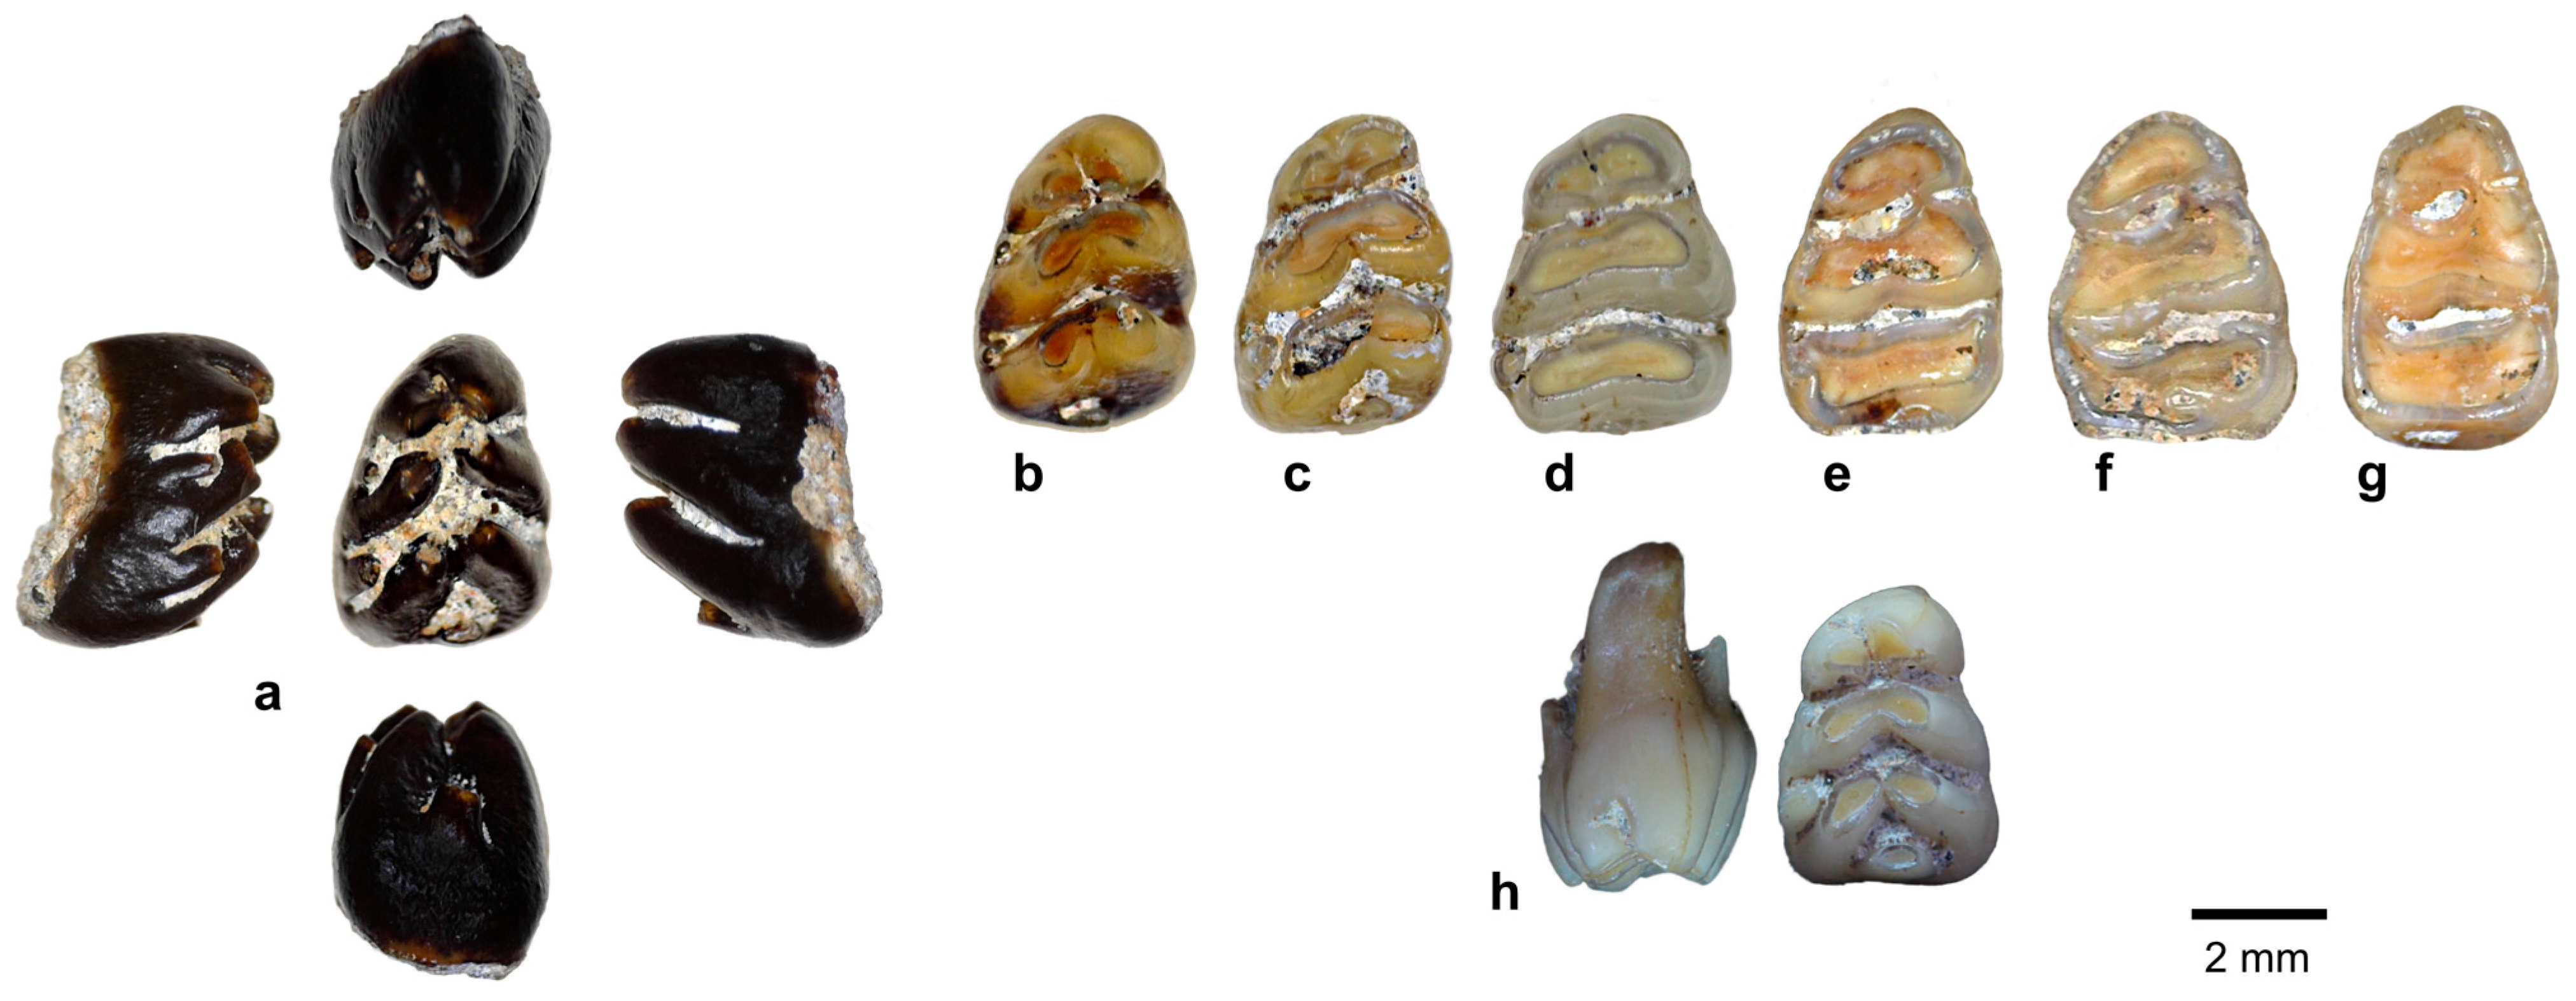
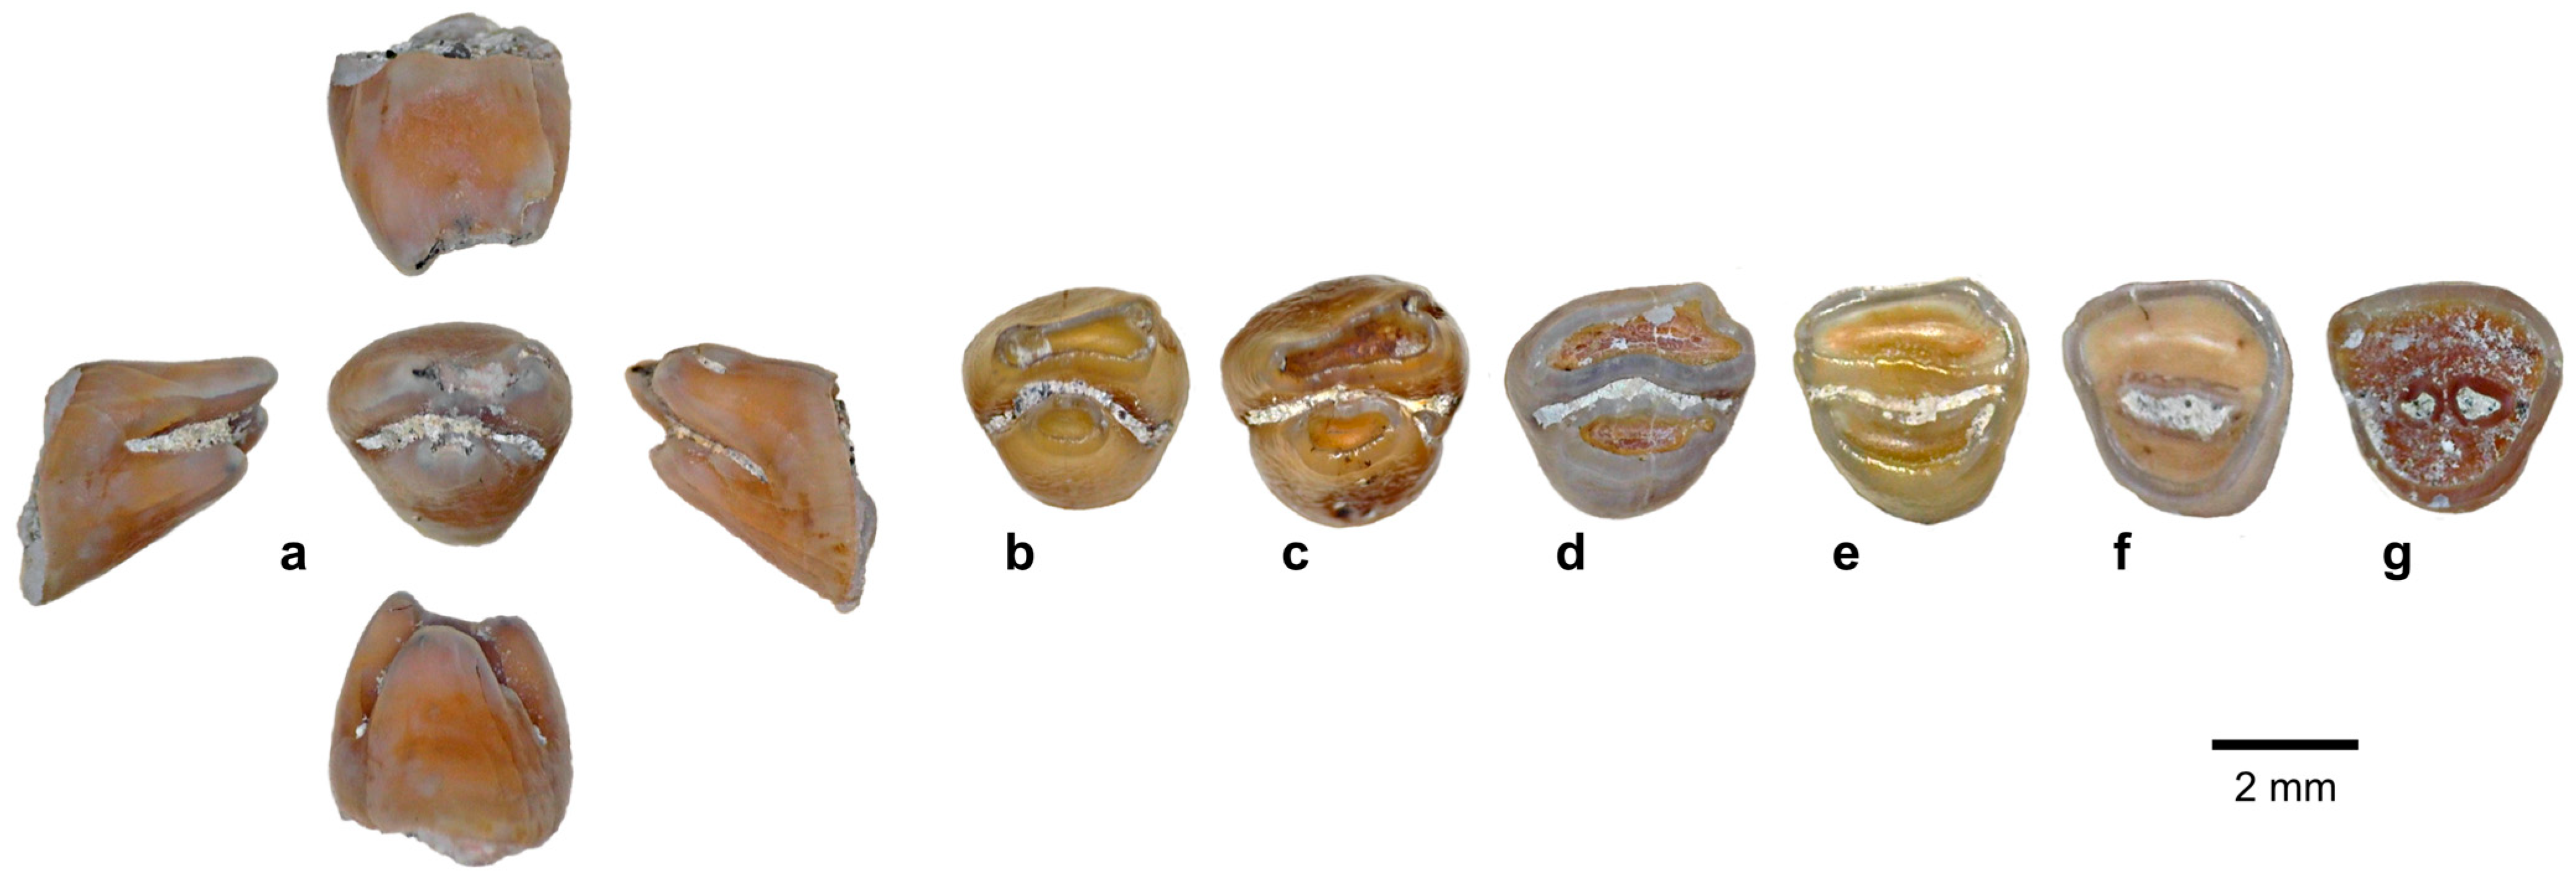
6.2.1. Maxillary Occlusal Characteristics
6.2.2. Mandibular Occlusal Characteristics
6.3. Papagomys group Molar Roots
6.4. Hooijeromys nusatengarra Diet
7. Discussion
8. Conclusions
Supplementary Materials
Author Contributions
Funding
Data Availability Statement
Acknowledgments
Conflicts of Interest
References
- Brumm, A.; van den Bergh, G.D.; Storey, M.; Kurniawan, I.; Alloway, B.V.; Setiawan, R.; Setiyabudi, E.; Grün, R.; Moore, M.W.; Yurnaldi, D.; et al. Age and context of the oldest known hominin fossils from Flores. Nature 2016, 534, 249. [Google Scholar] [CrossRef] [PubMed]
- van den Bergh, G.D.; Kaifu, Y.; Kurniawan, I.; Kono, R.T.; Brumm, A.; Setiyabudi, E.; Aziz, F.; Morwood, M.J. Homo floresiensis-like fossils from the early Middle Pleistocene of Flores. Nature 2016, 534, 245. [Google Scholar] [CrossRef]
- Kaifu, Y.; Kurniawan, I.; Mizushima, S.; Sawada, J.; Lague, M.; Setiawan, R.; Sutisna, I.; Wibowo, U.P.; Suwa, G.; Kono, R.T. Early evolution of small body size in Homo floresiensis. Nat. Commun. 2024, 15, 6381. [Google Scholar] [CrossRef]
- Morwood, M.J.; Soejono, R.P.; Roberts, R.G.; Sutikna, T.; Turney, C.S.M.; Westaway, K.E.; Rink, W.J.; Zhao, J.X.; van den Bergh, G.D.; Due, R.A.; et al. Archaeology and age of a new hominin from Flores in eastern Indonesia. Nature 2004, 431, 1087–1091. [Google Scholar] [CrossRef]
- Sutikna, T.; Tocheri, M.W.; Morwood, M.J.; Saptomo, E.W.; Jatmiko; Awe, R.D.; Wasisto, S.; Westaway, K.E.; Aubert, M.; Li, B.; et al. Revised stratigraphy and chronology for Homo floresiensis at Liang Bua in Indonesia. Nature 2016, 532, 366. [Google Scholar] [CrossRef]
- van den Bergh, G.D.; Alloway, B.V.; Storey, M.; Setiawan, R.; Yurnaldi, D.; Kurniawan, I.; Moore, M.W.; Brumm, A.; Flude, S.; Sutikna, T. An integrative geochronological framework for the pleistocene So’a basin (Flores, Indonesia), and its implications for faunal turnover and hominin arrival. Quat. Sci. Rev. 2022, 294, 107721. [Google Scholar] [CrossRef]
- Meijer, H.J.; Kurniawan, I.; Setiabudi, E.; Brumm, A.; Sutikna, T.; Setiawan, R.; van den Bergh, G.D. Avian remains from the Early/Middle Pleistocene of the So’a Basin, central Flores, Indonesia, and their palaeoenvironmental significance. Palaeogeogr. Palaeoclimatol. Palaeoecol. 2015, 440, 161–171. [Google Scholar] [CrossRef]
- van der Geer, A.; Lyras, G.; de Vos, J. Evolution of Island Mammals: Adaptation and Extinction of Placental Mammals on Islands; John Wiley & Sons: Hoboken, NJ, USA, 2021. [Google Scholar]
- Turvey, S.T.; Crees, J.J.; Hansford, J.; Jeffree, T.E.; Crumpton, N.; Kurniawan, I.; Setiyabudi, E.; Guillerme, T.; Paranggarimu, U.; Dosseto, A.; et al. Quaternary vertebrate faunas from Sumba, Indonesia: Implications for Wallacean biogeography and evolution. Proc. R. Soc. B Biol. Sci. 2017, 284, 20171278. [Google Scholar] [CrossRef]
- Aplin, K.P.; Helgen, K.M. Quaternary murid rodents of Timor Part I: New material of Coryphomys buehleri Schaub, 1937, and description of a second species of the genus. Bull. Am. Mus. Nat. Hist. 2010, 2010, 1–80. [Google Scholar] [CrossRef]
- Louys, J.; O’Connor, S.; Higgins, P.; Hawkins, S.; Maloney, T. New genus and species of giant rat from Alor Island, Indonesia. J. Asia-Pac. Biodivers. 2018, 11, 503–510. [Google Scholar] [CrossRef]
- Veatch, E.G.; Fabre, P.H.; Tocheri, M.W.; Sutikna, T.; Saptomo, E.W.; Musser, G.G.; Helgen, K.M. A New Giant Shrew Rat (Rodentia: Muridae: Murinae) from Flores, Indonesia and a Comparative Investigation of its Ecomorphology. Rec. Aust. Mus. 2023, 75, 741. [Google Scholar] [CrossRef]
- Gerrie, R.; Kennerley, R. Papagomys armandvillei. The IUCN Red List of Threatened Species 2017: e.T15975A22399875. 2017. Available online: https://doi.org/10.2305/IUCN.UK.2017-2.RLTS.T15975A22399875.en (accessed on 10 April 2025).
- Musser, G.G. The giant rat of Flores and its relatives east of Borneo and Bali. Bull. Am. Mus. Nat. Hist. 1981, 169, 69–175. [Google Scholar]
- Hooijer, D. Indo-Australian insular elephants. Genetica 1967, 38, 143–162. [Google Scholar] [CrossRef] [PubMed]
- Hooijer, D.A. Three new giant prehistoric rats from Flores, Lesser Sunda Islands. Zool. Meded. 1957, 35, 299–314. [Google Scholar]
- Knepper, G.M. Floresmens. Het Leven van Theo Verhoeven, Missionaris en Archeoloog; Uitgeverij Boekscout Soest: Utrecht, The Netherlands, 2019. [Google Scholar]
- van der Plas, M. A new model for the evolution of Homo sapiens from the Wallacean islands. PalArch’s J. Vertebr. Palaeontol. 2007, 4, 1–121. Available online: https://archives.palarch.nl/index.php/jvp/article/view/657 (accessed on 10 December 2023).
- Hogg, A.G.; Heaton, T.J.; Hua, Q.; Palmer, J.G.; Turney, C.S.; Southon, J.; Bayliss, A.; Blackwell, P.G.; Boswijk, G.; Ramsey, C.B. SHCal20 Southern Hemisphere calibration, 0–55,000 years cal BP. Radiocarbon 2020, 62, 759–778. [Google Scholar] [CrossRef]
- Jentink, F.A. On a new species of Rat from the island of Flores. In Zoologische Ergebnisse Einer Reise in Niederländisch Ost-Indien; Weber, M., Brill, E.J., Eds.; Bremen University Press: Bremen, Germany, 1890–1907; Leiden, The Netherlands, 1893; Volume 3, pp. 78–83, Plate V. [Google Scholar]
- Sody, H.J.V. On a collection of rats from the Indo-Malayan and Indo-Australian regions. Treubia 1941, 18, 255–325. [Google Scholar]
- Bellucci, G. Jesuits Yearbook of the Society of Jesus 2010; General Curia of the Society of Jesus: Roma, Italy, 2009; p. 143. Available online: https://www.jesuits.global/sj_files/2020/05/annuario2010_en.pdf (accessed on 25 January 2025).
- Misonne, X. African and Indo-Australian Muridae. Evolutionary trends. Ann. Mus. Roy. Afr. Centr. Tervuren Zool. 1969, 172, 1–219. [Google Scholar]
- Maringer, J.; Verhoeven, T. Die steinartefakte aus der Stegodon-fossilschicht von Mengeruda auf Flores, Indonesien. Anthropos 1970, 229–247. [Google Scholar]
- O’Sullivan, P.B.; Morwood, M.; Hobbs, D.; Suminto, F.A.; Situmorang, M.; Raza, A.; Maas, R. Archaeological implications of the geology and chronology of the Soa basin, Flores, Indonesia. Geology 2001, 29, 607–610. [Google Scholar] [CrossRef]
- Sutikna, T.; Tocheri, M.W.; Faith, J.T.; Awe, R.D.; Meijer, H.J.; Saptomo, E.W.; Roberts, R.G. The spatio-temporal distribution of archaeological and faunal finds at Liang Bua (Flores, Indonesia) in light of the revised chronology for Homo floresiensis. J. Hum. Evol. 2018, 124, 52–74. [Google Scholar] [CrossRef]
- Locatelli, E. Insular Small Mammals from Quaternary Deposits of Sicily and Flores. Ph.D. Thesis, Università degli Studi di Ferrara, Ferrara, Italy, 2010. [Google Scholar]
- Locatelli, E.; Due, R.A.; van den Bergh, G.D.; van den Hoek Ostende, L.W. Pleistocene survivors and Holocene extinctions: The giant rats from Liang Bua (Flores, Indonesia). Quat. Int. 2012, 281, 47–57. [Google Scholar] [CrossRef]
- Zijlstra, J.S.; van den Hoek Ostende, L.W.; Due, R.A. Verhoeven’s giant rat of Flores (Papagomys theodorverhoeveni, Muridae) extinct after all? Contrib. Zool. 2008, 77, 25–31. [Google Scholar] [CrossRef]
- Veatch, E.G.; Tocheri, M.W.; Sutikna, T.; McGrath, K.; Saptomo, E.W.; Helgen, K.M. Temporal shifts in the distribution of murine rodent body size classes at Liang Bua (Flores, Indonesia) reveal new insights into the paleoecology of Homo floresiensis and associated fauna. J. Hum. Evol. 2019, 130, 45–60. [Google Scholar] [CrossRef]
- Musser, G.G.; Newcomb, C. Malaysian murids and the giant rat of Sumatra. Bull. Am. Mus. Nat. Hist. 1983, 174, 4. [Google Scholar]
- Musser, G.G. A systematic review of Sulawesi Bunomys (Muridae, Murinae) with the description of two new species. Bull. Am. Mus. Nat. Hist. 2014, 2014, 1–313. [Google Scholar] [CrossRef]
- Reyes, M.C.; Ingicco, T.; Piper, P.J.; Amano, N.; Pawlik, A.F. First fossil evidence of the extinct Philippine cloud rat Crateromys paulus (Muridae: Murinae: Phloeomyini) from Ilin Island, Mindoro, and insights into its Holocene abundance. Proc. Biol. Soc. Wash. 2017, 130, 84–97. [Google Scholar] [CrossRef] [PubMed][Green Version]
- Lazzari, V.; Tafforeau, P.; Aguilar, J.-P.; Michaux, J. Topographic maps applied to comparative molar morphology: The case of murine and cricetine dental plans (Rodentia, Muroidea). Paleobiology 2008, 34, 46–64. [Google Scholar] [CrossRef]
- Lyman, R.L. Quantitative units and terminology in zooarchaeology. Am. Antiq. 1994, 59, 36–71. [Google Scholar] [CrossRef]
- Westin, C.-F.; Kikinis, R.; Knutsson, H. Adaptive image filtering. In Handbook of Medical Imaging: Processing and Analysis Management; Bankman, I., Ed.; Elsevier Science & Technology: Chantilly, VA, USA, 2000; pp. 19–31. [Google Scholar]
- Lazzari, V.; Charles, C.; Tafforeau, P.; Vianey-Liaud, M.; Aguilar, J.-P.; Jaeger, J.-J.; Michaux, J.; Viriot, L. Mosaic convergence of rodent dentitions. PLoS ONE 2008, 3, e3607. [Google Scholar] [CrossRef]
- Hikida, T. Age determination of the Japanese wood mouse, Apodemus speciosus. Jap. J. Ecol. 1980, 30, 109–116. [Google Scholar] [CrossRef]
- Adamczewska-Andrzejewska, K. Growth, variations and age criteria in Apodemus agrarius (Pallas, 1771). Acta Theriol. 1973, 18, 353–394. [Google Scholar] [CrossRef]
- Valenzuela-Lamas, S.; Baylac, M.; Cucchi, T.; Vigne, J.-D. House mouse dispersal in Iron Age Spain: A geometric morphometrics appraisal. Biol. J. Linn. Soc. 2011, 102, 483–497. [Google Scholar] [CrossRef]
- Freudenthal, M.; Martin-Suárez, E.; Bendala, N. Estimating age through tooth wear. A pilot study on tooth abrasion in Apodemus (Rodentia, Mammalia). Mammalia 2002, 66, 275–284. [Google Scholar] [CrossRef]
- Musser, G.G. Characterisation of the endemic Sulawesi Lenomys meyeri (Muridae, Murinae) and the description of a new species of Lenomys. In Taxonomic Tapestries: The Threads of Evolutionary, Behavioural and Conservation Research; Behie, A.M., Oxenham, M.F., Eds.; ANUPress: Canberra, Australia, 2015; pp. 13–50. [Google Scholar]
- Hammer, Ø.; Harper, D.; Ryan, P. PAST-Palaeontological Statistics. 2001. Available online: www.uv.es/~pardomv/pe/2001_1/past/pastprog/past.pdf (accessed on 30 July 2025).
- Khamis, H. Measures of association: How to choose? J. Diagn. Med. Sonogr. 2008, 24, 155–162. [Google Scholar] [CrossRef]
- Freudenthal, M.; Cuenca Bescós, G. Size variation of fossil rodent populations. Scr. Geol. 1984, 76, 1–28. [Google Scholar]
- Freudenthal, M.; Martín Suárez, E. Size variation in samples of fossil and recent murid teeth. Scr. Geol. 1990, 93, 1–34. [Google Scholar]
- Lyman, R.L. On the analysis of vertebrate mortality profiles: Sample size, mortality type, and hunting pressure. Am. Antiq. 1987, 52, 125–142. [Google Scholar] [CrossRef]
- Gomes Rodrigues, H.; Merceron, G.; Viriot, L. Dental microwear patterns of extant and extinct Muridae (Rodentia, Mammalia): Ecological implications. Naturwissenschaften 2009, 96, 537–542. [Google Scholar] [CrossRef]
- Puspaningrum, M.R. Proboscidea as Palaeoenvironmental Indicators in Southeast Asia. Ph.D. Thesis, University of Wollongong, Wollongong, Australia, 2016. [Google Scholar]
- Musser, G.G.; Brothers, E.M. Identification of bandicoot rats from Thailand (Bandicota, Muridae, Rodentia). Am. Mus. Novit. 1994, 3110, 1–56. [Google Scholar]
- Patnaik, R. Diet and habitat changes among Siwalik herbivorous mammals in response to Neogene and Quaternary climate changes: An appraisal in the light of new data. Quat. Int. 2015, 371, 232–243. [Google Scholar] [CrossRef]
- Fernández-Jalvo, Y.; Andrews, P. Atlas of Taphonomic Identifications: 1001+ Images of Fossil and Recent Mammal Bone Modification; Springer: Dordrecht, The Netherlands, 2016. [Google Scholar]
- Musser, G.G.; Durden, L.A. Sulawesi rodents: Description of a new genus and species of Murinae (Muridae, Rodentia) and its parasitic new species of sucking louse (Insecta, Anoplura). Am. Mus. Novit. 2002, 3368, 1–50. [Google Scholar] [CrossRef]
- Achmadi, A.S.; Rowe, K.C.; Esselstyn, J.A. New records of two rarely encountered, endemic rats (Rodentia: Muridae: Murinae) from Gunung Gandangdewata, West Sulawesi province. Treubia 2014, 41, 51–60. [Google Scholar] [CrossRef]
- Musser, G.G. A new genus of arboreal rat from West Java, Indonesia. Zool. Verh. 1981, 189, 3–35. [Google Scholar]
- Rowe, K.C.; Achmadi, A.S.; Fabre, P.H.; Schenk, J.J.; Steppan, S.J.; Esselstyn, J.A. Oceanic islands of Wallacea as a source for dispersal and diversification of murine rodents. J. Biogeogr. 2019, 46, 2752–2768. [Google Scholar] [CrossRef]
- Seo, H.; Kim, J.; Hwang, J.J.; Jeong, H.-G.; Han, S.-S.; Park, W.; Ryu, K.; Seomun, H.; Kim, J.-Y.; Cho, E.-S. Regulation of root patterns in mammalian teeth. Sci. Rep. 2017, 7, 12714. [Google Scholar] [CrossRef]
- Al-Qudah, A.A.; Bani Younis, H.A.B.; Awawdeh, L.A.; Daud, A. Root and canal morphology of third molar teeth. Sci. Rep. 2023, 13, 6901. [Google Scholar] [CrossRef] [PubMed]









| Species | 1B (120–60 kya) | 2 (60–50 kya) | 8C (≤3 kya) |
|---|---|---|---|
| Papagomys armandvillei | 11 | 4 | |
| Papagomys theodorverhoeveni | 7 | 9 | 2 |
| Hooijeromys cf. nusatenggara | 4 | 2 | |
| Papagomys sp. | 2 | 1 |
| Estimated Wear Stage | Occlusal Characteristics |
|---|---|
| WS1 (Juvenile) | Nearly unworn, little or no merging of the cusps |
| WS2 (Young Adult) | Lightly worn, cusps discrete and/or discernible |
| WS3 (Adult) | Nearly all, or all, cusp rows form discrete laminae |
| WS4 (Old Adult) | Laminae are beginning to merge |
| WS5 (Senescent) | Occlusal surface mostly a single dentin pool |
| WM1 | WM2 | WM3 | Wm1 | Wm2 | Wm3 | ||
|---|---|---|---|---|---|---|---|
| Freudenthal and Martín Suárez (Table 2 in [46]) | V’/√logN Mean | (183) 13.02 | (144) 14.15 | (84) 19.26 | (192) 15.89 | (163) 14.30 | (99) 16.57 |
| SD | 3.95 | 5.26 | 7.13 | 5.24 | 4.33 | 5.46 | |
| Range | 9.07–16.97 | 8.89–19.41 | 12.13–26.39 | 10.65–21.13 | 9.97–18.63 | 11.11–22.03 | |
| Mata Menge | All molars, including outliers | (110) 43.11 | (107) 44.13 | - | (123) 42.03 | (135) 43.50 | (103) 44.77 |
| All molars, excluding outliers | (103) 14.82 | (105) 19.15 | (92) 18.07 | (118) 16.79 | (132) 16.98 | (96) 16.81 | |
| MM-LOW, excluding outliers | (7) 13.90 | (6) 20.10 | (4) 15.08 | (21) 17.66 | (20) 12.66 | (12) 12.89 | |
| MM-UP, excluding outliers | (96) 12.65 | (99) 14.30 | (88) 13.72 | (97) 13.25 | (112) 16.21 | (84) 13.92 |
| (a) | |||||||||||||||||
| Maxillary | Statistic | Alveolar L | Crown L | WM1 | WM2 | WM3 | M2/M1 | M3/M1 | M3/M2 | LM1 | LM2 | LM3 | W/L M1 | W/L M2 | W/L M3 | W Palate at M1 | WM1/W Palate |
| MM-LOW | N | 2 | 1 | 7 | 6 | 4 | 1 | 1 | 2 | 5 | 3 | 1 | 5 | 3 | 1 | ||
| Min. | 11.48 | 10.94 | 3.57 | 3.32 | 2.68 | 0.96 | 0.74 | 0.77 | 5.39 | 3.92 | 3.39 | 0.65 | 0.89 | 0.86 | |||
| Max. | 12.41 | 4.09 | 4.00 | 3.02 | 0.81 | 6.28 | 4.22 | 0.68 | 1.01 | ||||||||
| Mean | 3.96 | 3.76 | 2.88 | 5.88 | 4.05 | 0.66 | 0.93 | ||||||||||
| Std. error | 0.07 | 0.10 | 0.07 | 0.14 | 0.09 | 0.01 | 0.04 | ||||||||||
| Var. | 0.03 | 0.07 | 0.02 | 0.10 | 0.02 | 0.00 | 0.00 | ||||||||||
| St. dev. | 0.19 | 0.26 | 0.14 | 0.32 | 0.15 | 0.01 | 0.07 | ||||||||||
| MM-UP | N | 6 | 5 | 96 | 99 | 88 | 20 | 11 | 14 | 29 | 27 | 34 | 29 | 27 | 34 | 1 | 1 |
| Min. | 12.08 | 11.66 | 3.70 | 3.60 | 2.87 | 0.88 | 0.73 | 0.76 | 5.50 | 3.28 | 3.21 | 0.57 | 0.82 | 0.80 | 5.00 | 0.80 | |
| Max. | 13.64 | 12.53 | 4.43 | 4.42 | 3.47 | 1.00 | 0.78 | 0.88 | 7.04 | 4.75 | 3.98 | 0.75 | 1.28 | 1.02 | |||
| Mean | 12.68 | 12.10 | 4.09 | 4.03 | 3.14 | 0.97 | 0.76 | 0.79 | 6.38 | 4.19 | 3.53 | 0.64 | 0.95 | 0.89 | |||
| Std. error | 0.22 | 0.14 | 0.01 | 0.02 | 0.02 | 0.01 | 0.01 | 0.01 | 0.08 | 0.07 | 0.04 | 0.01 | 0.02 | 0.01 | |||
| Var. | 0.29 | 0.10 | 0.02 | 0.03 | 0.02 | 0.00 | 0.00 | 0.00 | 0.18 | 0.15 | 0.04 | 0.00 | 0.01 | 0.00 | |||
| St. dev. | 0.54 | 0.32 | 0.13 | 0.17 | 0.14 | 0.03 | 0.02 | 0.03 | 0.42 | 0.39 | 0.21 | 0.05 | 0.11 | 0.06 | |||
| (b) | |||||||||||||||||
| Mandibular | Statistic | Alveolar L | Crown L | Wm1 | Wm2 | Wm3 | m2/m1 | m3/m1 | m3/m2 | Lm1 | Lm2 | Lm3 | W/Lm1 | W/Lm2 | W/Lm3 | Wi | Diastema L |
| MM-LOW | N | 9 | 7 | 21 | 20 | 12 | 15 | 10 | 10 | 3 | 4 | 1 | 3 | 4 | 1 | 9 | 3 |
| Min. | 10.91 | 11.10 | 2.85 | 3.24 | 3.05 | 1.01 | 0.92 | 0.89 | 4.58 | 3.34 | 3.23 | 0.62 | 0.92 | 0.99 | 1.48 | 7.74 | |
| Max. | 12.26 | 12.38 | 3.52 | 3.74 | 3.50 | 1.18 | 1.09 | 0.98 | 4.80 | 3.91 | 0.74 | 1.03 | 1.92 | 9.98 | |||
| Mean | 11.47 | 11.56 | 3.27 | 3.56 | 3.32 | 1.08 | 1.01 | 0.93 | 4.66 | 3.57 | 0.68 | 0.98 | 1.70 | 8.79 | |||
| Std. error | 0.17 | 0.17 | 0.03 | 0.03 | 0.04 | 0.01 | 0.02 | 0.01 | 0.07 | 0.12 | 0.03 | 0.03 | 0.05 | 0.65 | |||
| Var. | 0.26 | 0.20 | 0.02 | 0.01 | 0.02 | 0.00 | 0.00 | 0.00 | 0.02 | 0.06 | 0.00 | 0.00 | 0.02 | 1.27 | |||
| St. dev. | 0.51 | 0.45 | 0.16 | 0.12 | 0.15 | 0.04 | 0.06 | 0.03 | 0.12 | 0.24 | 0.06 | 0.06 | 0.14 | 1.13 | |||
| MM-UP | N | 16 | 14 | 97 | 112 | 84 | 23 | 16 | 18 | 28 | 29 | 23 | 28 | 29 | 23 | 8 | 4 |
| Min. | 11.40 | 11.34 | 3.03 | 3.29 | 3.20 | 1.06 | 0.95 | 0.89 | 4.60 | 3.38 | 2.96 | 0.56 | 0.86 | 0.89 | 1.74 | 7.28 | |
| Max. | 12.52 | 12.68 | 3.65 | 4.15 | 3.87 | 1.19 | 1.19 | 1.00 | 5.51 | 4.32 | 3.92 | 0.74 | 1.10 | 1.14 | 2.01 | 8.50 | |
| Mean | 12.00 | 12.05 | 3.30 | 3.70 | 3.50 | 1.11 | 1.04 | 0.93 | 5.05 | 3.81 | 3.38 | 0.66 | 0.96 | 1.03 | 1.90 | 7.85 | |
| Std. error | 0.08 | 0.11 | 0.01 | 0.02 | 0.02 | 0.01 | 0.01 | 0.01 | 0.05 | 0.05 | 0.05 | 0.01 | 0.01 | 0.01 | 0.03 | 0.31 | |
| Var. | 0.11 | 0.18 | 0.02 | 0.03 | 0.02 | 0.00 | 0.00 | 0.00 | 0.08 | 0.08 | 0.06 | 0.00 | 0.00 | 0.00 | 0.01 | 0.39 | |
| St. dev. | 0.33 | 0.42 | 0.14 | 0.16 | 0.14 | 0.04 | 0.06 | 0.03 | 0.28 | 0.28 | 0.25 | 0.04 | 0.05 | 0.06 | 0.10 | 0.63 | |
| Alveolar Length | W 1st Molar | W 2nd Molar | W 3rd Molar | ||
|---|---|---|---|---|---|
| MM-LOW articulating rows | Maxillary | 12.41 | 4.09 | 3.91 | 3.02 |
| Mandibular | 11.89 | 3.43 | 3.66 | 3.33 | |
| Maxillary/Mandibular | 1.04 | 1.19 | 1.07 | 0.91 | |
| MM-UP Means | N | 6 | 23 | 24 | 16 |
| Maxillary Mean | 12.68 | 4.16 | 4.02 | 3.23 | |
| N | 16 | 25 | 26 | 20 | |
| Mandibular Mean | 12.00 | 3.40 | 3.78 | 3.54 | |
| Mean Maxillary/Mean Mandibular | 1.06 | 1.22 | 1.06 | 0.91 |
| Morphological Characteristic | N | Observable | Present | Absent | Worn/Merged | Indet. | ||
|---|---|---|---|---|---|---|---|---|
| M1 | lingual spur | Total images | 62 | 21 | 14 | 7 | 34 | 7 |
| % presence | 67% | 33% | ||||||
| MM-UP | 55 | 19 | 13 | 6 | 30 | 6 | ||
| MM-LOW | 7 | 2 | 1 | 1 | 4 | 1 | ||
| M2 | lingual spur | Total images | 67 | 21 | 4 | 17 | 26 | 20 |
| % presence | 19% | 81% | ||||||
| MM-UP | 61 | 19 | 3 | 16 | 23 | 19 | ||
| MM-LOW | 6 | 2 | 1 | 1 | 3 | 1 | ||
| m1 | antero-central platform | Total images | 75 | 47 | 11 | 36 | 16 | 12 |
| % presence | 23% | 77% | ||||||
| MM-UP | 55 | 32 | 7 | 25 | 12 | 11 | ||
| MM-LOW | 20 | 15 | 4 | 11 | 4 | 1 | ||
| antero-buccal cusplet | Total images | 75 | 41 | 21 | 20 | 9 | 25 | |
| % presence | 51% | 49% | ||||||
| MM-UP | 55 | 28 | 9 | 19 | 5 | 22 | ||
| MM-LOW | 20 | 13 | 12 | 1 | 4 | 3 | ||
| postero-buccal cusplet | Total images | 75 | 69 | 69 | 4 | 2 | ||
| % presence | 100% | |||||||
| MM-UP | 55 | 50 | 50 | 3 | 2 | |||
| MM-LOW | 20 | 19 | 19 | 1 | ||||
| m2 | antero-buccal cusplet | Total images | 89 | 50 | 50 | 33 | 6 | |
| % presence | 100% | |||||||
| MM-UP | 67 | 38 | 38 | 24 | 5 | |||
| MM-LOW | 22 | 12 | 12 | 9 | 1 | |||
| postero-buccal cusplet | Total images | 89 | 74 | 73 | 1 | 6 | 9 | |
| % presence | 99% | 1% | ||||||
| MM-UP | 67 | 56 | 55 | 1 | 3 | 8 | ||
| MM-LOW | 22 | 18 | 18 | 3 | 1 | |||
| m3 | antero-buccal cusplet | Total images | 65 | 50 | 50 | 12 | 3 | |
| % presence | 100% | |||||||
| MM-UP | 52 | 41 | 41 | 8 | 3 | |||
| MM-LOW | 13 | 9 | 9 | 4 | ||||
| postero-buccal cusplet | Total images | 65 | 34 | 32 | 2 | 19 | 12 | |
| % presence | 94% | 6% | ||||||
| MM-UP | 52 | 29 | 27 | 2 | 12 | 11 | ||
| MM-LOW | 13 | 5 | 5 | 7 | 1 |
| Species | Site | Age | Statistic | Or. | WS | Cr. L | WM1 | WM2 | WM3 | M2/M1 | M3/M1 | M3/M2 | LM2 | LM3 | W/L M2 | W/L M3 | W Palate at M1 | WM1/ W Palate |
|---|---|---|---|---|---|---|---|---|---|---|---|---|---|---|---|---|---|---|
| Papagomys armandvillei | Liang Toge | MH | 10 | sin | YA | 5.2 | 5.0 | 0.96 | 5.3 | 0.94 | ||||||||
| P. verhoeveni | dex | A | 14.1 | 4.6 | 4.4 | 3.6 | 0.96 | 0.78 | 0.82 | 4.6 | 3.9 | 0.96 | 0.92 | 4.8 | 1.0 | |||
| Recent | H | N | 8 | 8 | 8 | 8 | 8 | 8 | 8 | 3 | 3 | 3 | 3 | 6 | 6 | |||
| Minimum | 14.6 | 4.3 | 4.3 | 3.6 | 0.9 | 0.8 | 0.8 | 4.8 | 3.9 | 0.9 | 0.9 | 3.1 | 0.8 | |||||
| Maximum | 16.0 | 5.0 | 4.9 | 4.2 | 1.0 | 0.9 | 0.9 | 5.2 | 4.1 | 0.9 | 1.0 | 5.1 | 1.6 | |||||
| Mean | 15.39 | 4.71 | 4.54 | 3.90 | 0.97 | 0.83 | 0.86 | 4.97 | 3.97 | 0.91 | 0.97 | 4.13 | 1.20 | |||||
| Std. error | 0.17 | 0.08 | 0.06 | 0.07 | 0.01 | 0.02 | 0.01 | 0.12 | 0.07 | 0.01 | 0.03 | 0.36 | 0.12 | |||||
| Variance | 0.22 | 0.06 | 0.03 | 0.04 | 0.00 | 0.00 | 0.00 | 0.04 | 0.01 | 0.00 | 0.00 | 0.79 | 0.09 | |||||
| Stand. dev. | 0.47 | 0.24 | 0.18 | 0.19 | 0.03 | 0.05 | 0.03 | 0.21 | 0.12 | 0.02 | 0.05 | 0.89 | 0.30 | |||||
| Hooijeromys nusatenggara | Ola Bula | E-MP | 1 (Holotype) | dex | YA | 12.4 | 4.1 | 3.8 | 2.9 | 0.93 | 0.71 | 0.76 | 3.7 | 3.2 | 1.03 | 0.91 | 3.8 | 1.1 |
| Ola Bula | 2 | dex | OA | 11.5 | 3.7 | 3.6 | 2.8 | 0.97 | 0.76 | 0.78 | 5.0 | 0.7 | ||||||
| Boa Leza | 3 | dex | A | 3.0 |
| Species | Site | Age | Statistic | Or. | WS | Cr. L | Wm1 | Wm2 | Wm3 | m2/m1 | m3/m1 | m3/m2 | L m1 | L m2 | L m3 | Wi |
|---|---|---|---|---|---|---|---|---|---|---|---|---|---|---|---|---|
| Papagomys armandvillei | Liang Toge | MH | N | 4 | 10 | 6 | 5 | 6 | 5 | 4 | 3 | |||||
| Minimum | 15.3 | 3.9 | 4.5 | 4.2 | 1.05 | 0.98 | 0.93 | 2.6 | ||||||||
| Maximum | 16.1 | 4.5 | 4.9 | 4.7 | 1.12 | 1.1 | 0.96 | 2.7 | ||||||||
| Mean | 15.75 | 4.22 | 4.70 | 4.46 | 1.10 | 1.04 | 0.95 | 6.2 | 4.7 | 4.8 | 2.67 | |||||
| Std. error | 0.17 | 0.06 | 0.08 | 0.09 | 0.01 | 0.02 | 0.01 | 0.03 | ||||||||
| Variance | 0.12 | 0.04 | 0.04 | 0.04 | 0.00 | 0.00 | 0.00 | 0.00 | ||||||||
| Stand. dev. | 0.34 | 0.19 | 0.19 | 0.21 | 0.03 | 0.04 | 0.02 | 0.2 | 0.3 | 0.1 | 0.06 | |||||
| Recent | H | N | 8 | 8 | 8 | 8 | 8 | 8 | 8 | |||||||
| Minimum | 13.8 | 3.7 | 4.1 | 3.9 | 1.05 | 0.98 | 0.91 | |||||||||
| Maximum | 16 | 4.4 | 4.8 | 4.5 | 1.11 | 1.05 | 0.98 | |||||||||
| Mean | 15.09 | 4.05 | 4.36 | 4.10 | 1.08 | 1.01 | 0.94 | 5.7 | ||||||||
| Std. error | 0.29 | 0.07 | 0.07 | 0.07 | 0.01 | 0.01 | 0.01 | |||||||||
| Variance | 0.69 | 0.04 | 0.04 | 0.04 | 0.00 | 0.00 | 0.00 | |||||||||
| Stand. dev. | 0.83 | 0.19 | 0.20 | 0.20 | 0.02 | 0.03 | 0.02 | 0.3 | ||||||||
| Papagomys theodorverhoeveni | Liang Toge | MH | N | 11 | 16 | 10 | 9 | 10 | 9 | 8 | 6 | |||||
| Minimum | 12.0 | 3.5 | 3.6 | 3.3 | 1.0 | 0.83 | 0.83 | 2.0 | ||||||||
| Maximum | 14.0 | 4.2 | 4.2 | 4.0 | 1.1 | 1.08 | 0.98 | 2.2 | ||||||||
| Mean | 13.18 | 3.84 | 4.01 | 3.61 | 1.05 | 0.94 | 0.90 | 2.10 | ||||||||
| Std. error | 0.22 | 0.06 | 0.05 | 0.07 | 0.01 | 0.02 | 0.02 | 0.04 | ||||||||
| Variance | 0.53 | 0.05 | 0.03 | 0.04 | 0.00 | 0.00 | 0.00 | 0.01 | ||||||||
| Stand. dev. | 0.73 | 0.22 | 0.17 | 0.20 | 0.03 | 0.07 | 0.05 | 0.09 | ||||||||
| Hooijeromys nusatenggara | Boa Leza | E-MP | 4 | sin | A | 3.2 * | ||||||||||
| 5 | sin | YA | 3.5 |
| WM1 | WM2 | WM3 | Wm1 | Wm2 | Wm3 | ||
|---|---|---|---|---|---|---|---|
| Freudenthal and Martín Suárez (Table 2 [46]) | V’/√logN Mean | (183) 13.02 | (144) 14.15 | (84) 19.26 | (192) 15.89 | (163) 14.30 | (99) 16.57 |
| 1 SD | 3.95 | 5.26 | 7.13 | 5.24 | 4.33 | 5.46 | |
| Range | 9.07–16.97 | 8.89–19.41 | 12.13–26.39 | 10.65–21.13 | 9.97–18.63 | 11.11–22.03 | |
| P. armandvillei Recent | (8) 15.51 | (8) 14.03 | (8) 16.40 | (8) 18.19 | (8) 17.13 | (8) 15.59 | |
| P. armandvillei Liang Toge | - | - | - | (10) 14.29 | (6) 9.65 | (5) 13.29 | |
| P. armandvillei Liang Toge and Recent | (10) 18.95 | (10) 15.56 | (9) 16.16 | (18) 17.42 | (14) 16.79 | (13) 18.05 | |
| P. armandvillei Liang Toge and Recent, MM-LOW and MM-UP | (113) 22.75 | (115) 28.75 | (101) 34.19 | (136) 33.82 | (146) 30.45 | (109) 33.22 | |
| P. theodorverhoeveni Liang Toge | - | - | - | (16) 16.79 | (10) 14.63 | (9) 19.91 | |
| P. theodorverhoeveni and P. armandvillei Liang Toge | - | - | - | (26) 21.02 | (16) 28.90 | (14) 35.34 | |
| P. theodorverhoeveni and P. armandvillei Liang Toge and Recent | - | - | - | (34) 20.20 | (24) 25.73 | (22) 30.21 | |
| P. theodorverhoeveni and MM-LOW | - | - | - | (37) 31.52 | (30) 21.76 | (21) 24.16 | |
| P. theodorverhoeveni and MM-UP | - | - | - | (113) 24.45 | (122) 16.91 | (93) 16.38 | |
| P. theodorverhoeveni, MM-LOW and MM-UP | - | - | - | (134) 27.76 | (142) 17.69 | (105) 19.26 | |
| H. nusatenggara, P. armandvillei Liang Toge and Recent | (12) 31.05 | (12) 29.95 | (12) 35.46 | (19) 28.04 | - | (15) 35.13 | |
| H. nusatenggara and P. theodorverhoeveni | - | - | - | (17) 23.72 | - | (11) 24.50 | |
| H. nusatenggara and MM-LOW | (9) 13.33 | (8) 18.93 | (7) 12.75 | (22) 17.58 | - | (14) 12.51 | |
| H. nusatenggara and MM-UP | (98) 12.62 | (101) 14.27 | (91) 15.34 | (98) 13.25 | - | (86) 15.95 | |
| H. nusatenggara, MM-LOW and MM-UP | (105) 14.79 | (107) 19.11 | (95) 18.06 | (119) 16.78 | - | (98) 16.77 | |
Disclaimer/Publisher’s Note: The statements, opinions and data contained in all publications are solely those of the individual author(s) and contributor(s) and not of MDPI and/or the editor(s). MDPI and/or the editor(s) disclaim responsibility for any injury to people or property resulting from any ideas, methods, instructions or products referred to in the content. |
© 2025 by the authors. Licensee MDPI, Basel, Switzerland. This article is an open access article distributed under the terms and conditions of the Creative Commons Attribution (CC BY) license (https://creativecommons.org/licenses/by/4.0/).
Share and Cite
Hayes, S.; van den Bergh, G.D.; Sutisna, I.; Insani, H.; Wibowo, U.P.; Setiawan, R.; Kurniawan, I.; Turvey, S.T. Insular Mid-Pleistocene Giant Rats from the So’a Basin (Flores, Indonesia). Quaternary 2025, 8, 44. https://doi.org/10.3390/quat8030044
Hayes S, van den Bergh GD, Sutisna I, Insani H, Wibowo UP, Setiawan R, Kurniawan I, Turvey ST. Insular Mid-Pleistocene Giant Rats from the So’a Basin (Flores, Indonesia). Quaternary. 2025; 8(3):44. https://doi.org/10.3390/quat8030044
Chicago/Turabian StyleHayes, Susan, Gerrit D. van den Bergh, Indra Sutisna, Halmi Insani, Unggul P. Wibowo, Ruly Setiawan, Iwan Kurniawan, and Samuel T. Turvey. 2025. "Insular Mid-Pleistocene Giant Rats from the So’a Basin (Flores, Indonesia)" Quaternary 8, no. 3: 44. https://doi.org/10.3390/quat8030044
APA StyleHayes, S., van den Bergh, G. D., Sutisna, I., Insani, H., Wibowo, U. P., Setiawan, R., Kurniawan, I., & Turvey, S. T. (2025). Insular Mid-Pleistocene Giant Rats from the So’a Basin (Flores, Indonesia). Quaternary, 8(3), 44. https://doi.org/10.3390/quat8030044


