Article

Insular Mid-Pleistocene Giant Rats from the So’a Basin (Flores, Indonesia)

1
Environmental Futures, School of Science, University of Wollongong, Wollongong, NSW 2522, Australia
2
Direktorat Jenderal Diplomasi, Promosi, dan Kerja Sama Kebudayaan, Kementerian Kebudayaan, Jl. Jenderal Sudirman, Jakarta 10270, Indonesia
3
Museum Geologi, Badan Geologi Indonesia, Jl. Diponegoro No. 57, Bandung 40122, Indonesia
4
Pusat Survei Geologi, Badan Geologi Indonesia, Jl. Diponegoro No. 57, Bandung 40122, Indonesia
5
Institute of Zoology, Zoological Society of London, Regent’s Park, London NW1 4RY, UK
*
Authors to whom correspondence should be addressed.
Quaternary 2025, 8(3), 44; https://doi.org/10.3390/quat8030044
Submission received: 25 May 2025 / Revised: 19 June 2025 / Accepted: 31 July 2025 / Published: 4 August 2025

Abstract

Excavations undertaken at Mata Menge, the securely dated Middle Pleistocene open site on the Indonesian island of Flores, have resulted in the recovery of over 670 well-preserved fossil murine molars from two distinct stratigraphic intervals. This research is the first systematic metric and morphological analysis of this material, with the results indicating the predominance of a single murine species, though the finds from the lower interval (0.7 million years ago) are for the most part significantly smaller than those recovered from the ~70,000-year-younger upper interval. Comparison of our findings with the analyses of the Flores endemic recent and fossil giant rats undertaken by Hooijer in 1957 and Musser in 1981 indicates the Mata Menge large murine maxillary molars, and, in particular, those from the lower interval are very similar to the limited Middle Pleistocene material Musser designated to be Hooijeromys nusatenggara. However, the associated Mata Menge mandibular molars are most similar to, though smaller than, the mid-Holocene Papagomys theodorverhoeveni. In addition to providing a detailed reference for future studies of large fossil murines excavated from Wallacea, our findings indicate Musser’s reassignment of Hooijer’s maxillary holotype of P. verhoeveni to P. armandvillei would benefit from re-examination.

1. Introduction

In 1994 and during 2011–2023, a large number of fossil finds have been recovered from the Middle Pleistocene open site of Mata Menge on the Indonesian island of Flores. Mata Menge is located in the So’a Basin in Central Flores (Figure 1) and contains two distinct fossil-bearing intervals. The youngest interval (hereinafter MM-UP) is estimated at 0.70 mya (million years ago), bracketed by securely dated ages of 0.77 and 0.65 mya (million years ago) [1]. This interval notably includes the recovery of fossil hominins attributable to the diminutive Homo floresiensis [2,3], remains of which were first recovered in 2003 from the Late Pleistocene cave site of Liang Bua in Western Flores [4,5]. The older fossil-bearing interval was excavated prior to MM-UP and is located 150 m to the ESE. This lower interval (hereinafter MM-LOW) is situated 11 m lower in the stratigraphy and has been securely dated to 0.77 mya [6]. While separated by a period of ~70,000 years, both intervals have yielded stone artefacts [1] and a limited diversity of faunal remains. The fauna includes fossils of the extinct diminutive proboscidean, Stegodon florensis, and the still extant Komodo dragon, Varanus komodoensis, as well as crocodiles and a diverse avifauna [6,7]. The predominant fossil fauna, however, are the remains of large murine rodents (i.e., comparable in size to a rabbit), and this paper constitutes the first systematic metric and morphological analysis of the abundant and relatively well-preserved dental material, all of which is stored in the collections of the Geological Museum and Centre for Geological Survey of the Geological Agency of Indonesia, Bandung. A complete list of the dental elements analysed here is provided in the Supplementary Material (SM) Tables S1 and S2, with the fossil numbers including the excavation site (Mata Menge = MM), interval (LOW, UP), year of excavation, trench number (T), as well as the fossil’s unique numerical identifier (F).
Palaeontological evidence suggests that up until the late Holocene, endemic giant and large rats were fairly common in Wallacea (refer to Figure 1, inset), the oceanic region consisting of islands that have always been isolated from the Asian and Australian continental shelves, even during glacial periods of low sea level [8]. This includes the recovery of at least two distinct species from the Pleistocene and Holocene excavation sites on the island of Sumba to the south of Flores [9], five from Late Pleistocene and Holocene sites on Timor to the southeast [10], and at least one from the Holocene site of Alor to the east [11]. Flores has also recovered a minimum of four genera of large murines from Pleistocene and Holocene sites, including most recently a new giant shrew rat [12], but differs from the islands of Sumba, Timor, and Alor in that one of the giant Holocene rats, Papagomys armandvillei, is still living on the island, albeit classified as near threatened in 2016 [13].
The metric and morphological features of the dental characteristics of the extant and extinct Flores giant rats are the main comparative focus of this analysis of the Mata Menge Mid-Pleistocene material, and specifically those that the U.S. zoologist, Guy Musser, has identified as having a close phylogenetic relationship [14] (p. 165). These are the large-bodied members of what Musser has termed the Papagomys group, based on their dental characteristics: the extant and Holocene Papagomys armandvillei, the likely extinct Holocene P. theodorverhoeveni, and the extinct Pleistocene Hooijeromys nusatenggara. Musser’s inclusion of H. nusatenggara within the Papagomys group agrees with the earlier work of the Dutch palaeontologist, Dirk Hooijer [15], who briefly speculated that the molars of these specimens were possibly of a large murine directly ancestral to the Holocene Papagomys fossils and presumably considered them to potentially belong to the same genus. The third endemic giant rat genus from Flores is also extinct, Spelaeomys florensis [16]. S. florensis has a distinctly different dental morphology, and we follow Musser [14] in excluding this giant murine from the Papagomys group. In any event, only one isolated tooth of S. florensis has been recovered from Mata Menge: an upper first molar from MM-LOW, which has been reported elsewhere [6].
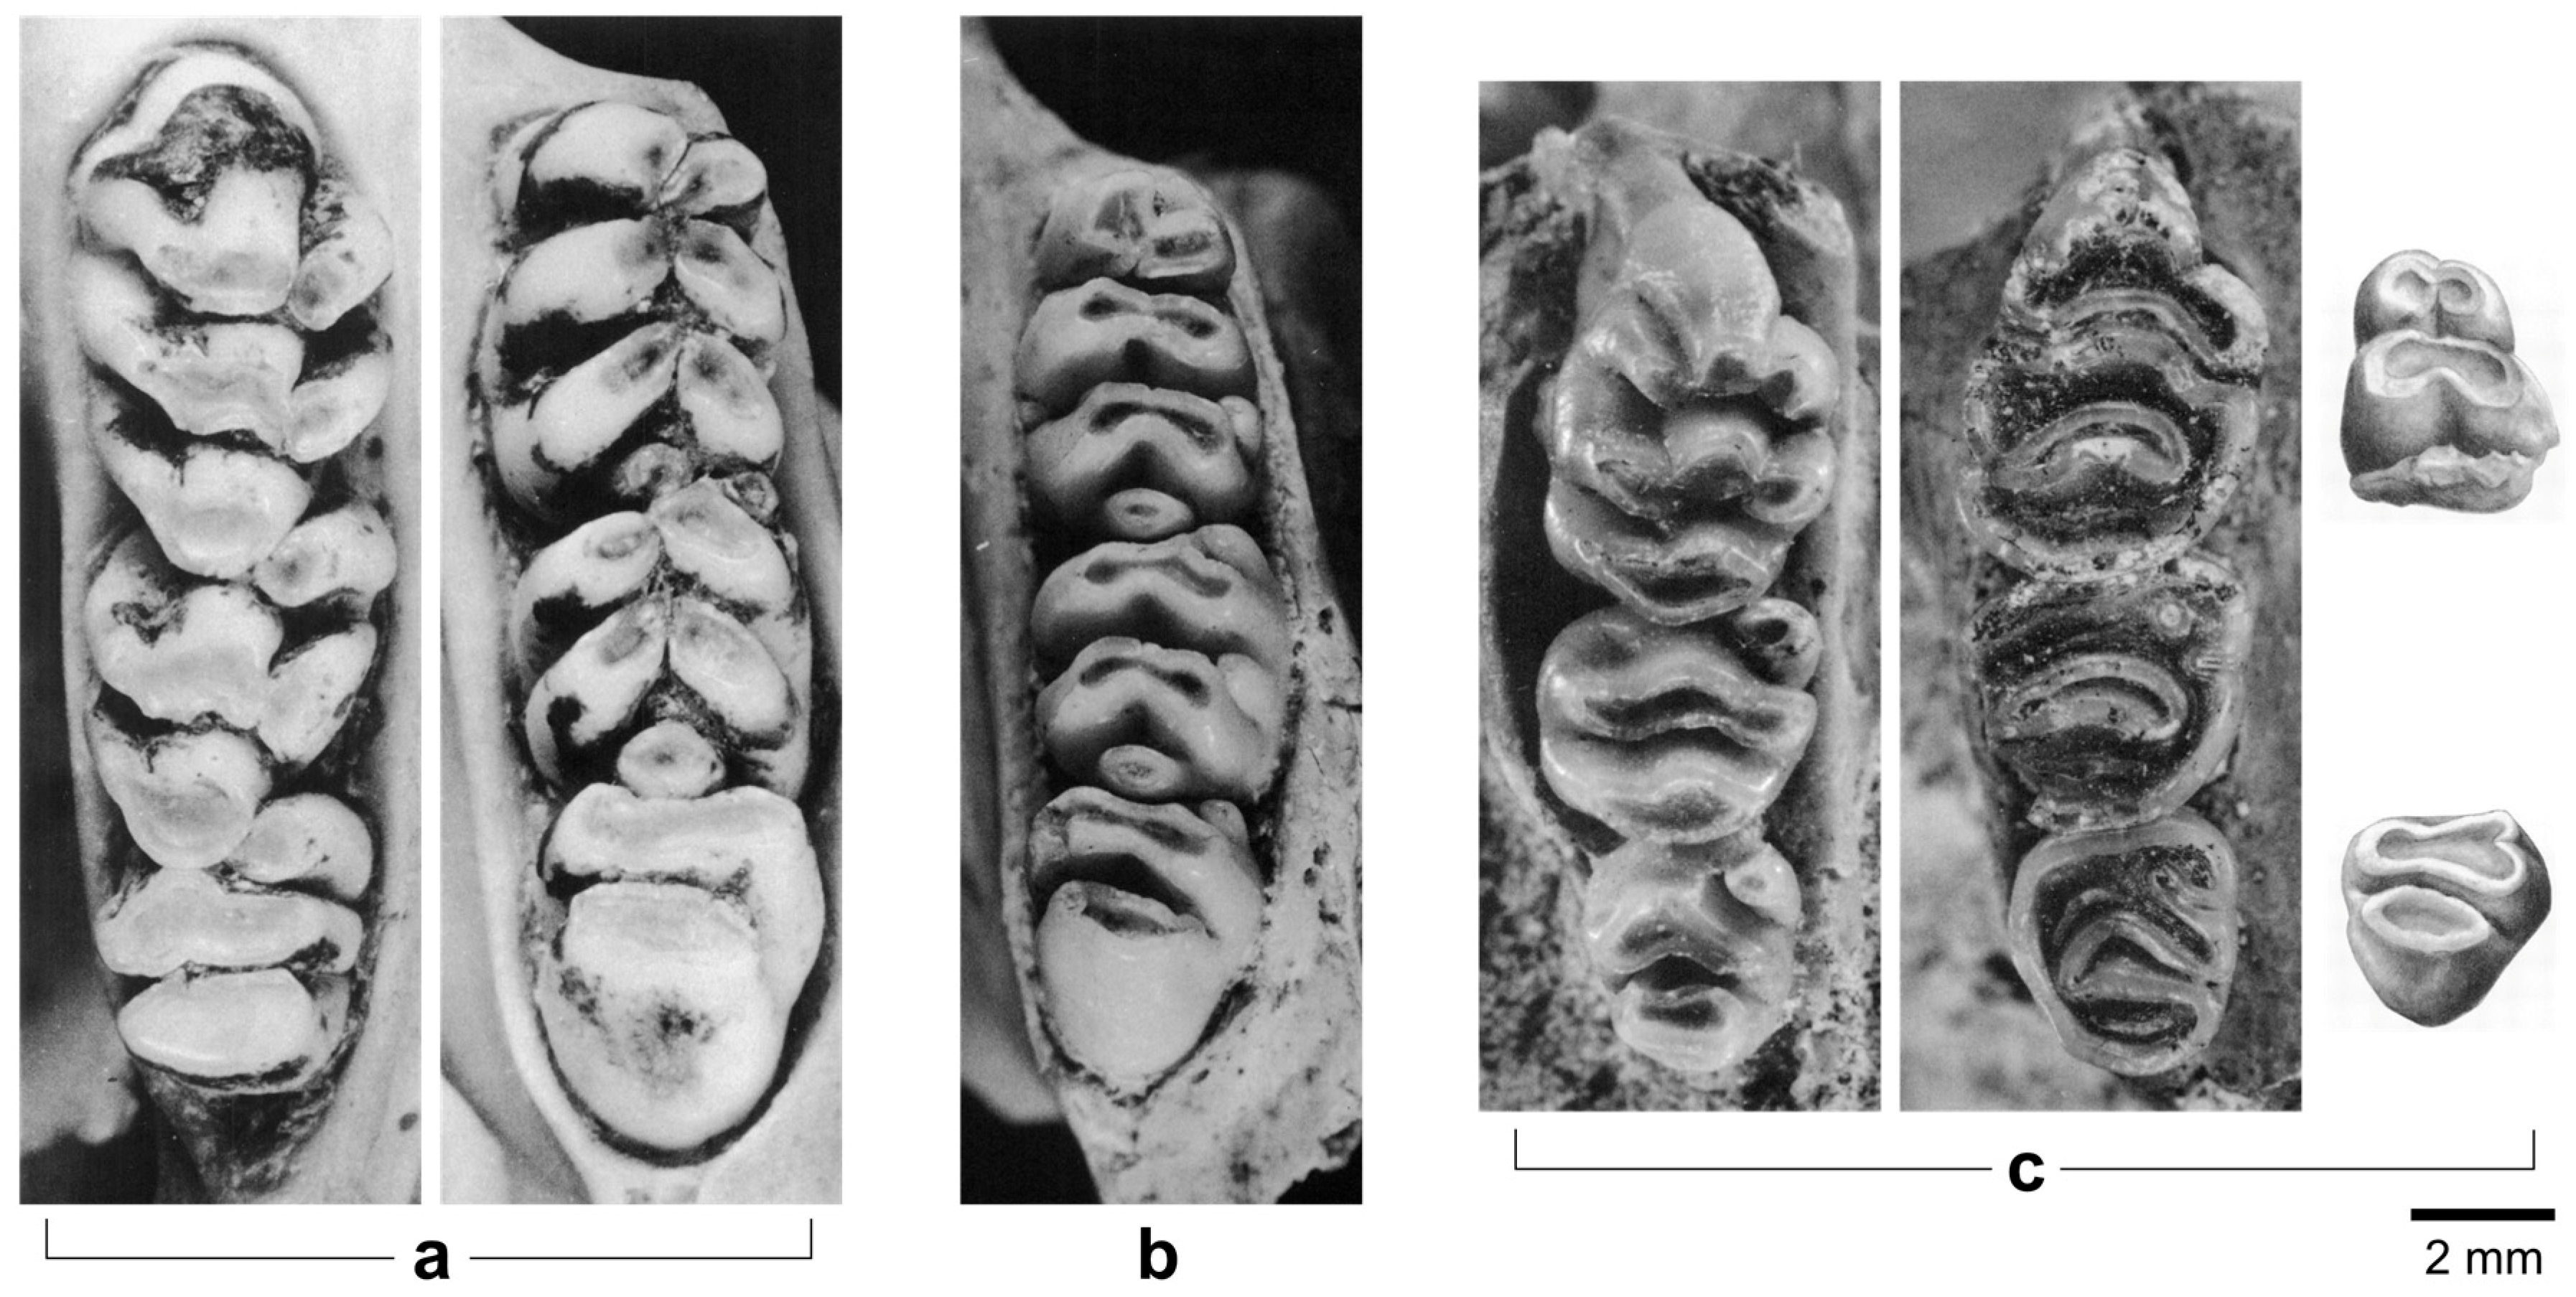
The general excavation and taxonomic contexts of Musser’s [14] large-bodied Papagomys group murines are described below. This is followed by the materials and methods we apply to the Mata Menge finds, including the stratigraphic context, metric analyses, and morphological descriptions. The metric analyses are primarily concerned with the diagnostic elements Musser applied to differentiate P. armandvillei, P. theodorverhoeveni, and Hooijeromys nusatenggara: dental widths and lengths and the relationships of molar widths within preserved tooth rows (e.g., which is the widest molar in the tooth row). Given the size of the Mata Menge sample, we are also able to examine the impact of tooth wear on both the measurements and morphology of the molars, with this impact ranging from very young rats to senescent. Having established these parameters of the Mata Menge large murines across and within both excavation intervals, we then compare our results to Musser’s large-bodied Papagomys group metrics and morphologies to identify the likely affiliations of the Mata Menge large murines. Complicating this identification is that while the Mata Menge upper molars are closely aligned to, and form a single species with, H. nusatenggara, the associated lower molars, while smaller, are more similar, morphologically, to P. theodorverhoeveni. The images of the molars identified as P. armandvillei, P. theodorverhoeveni, and H. nusatenggara in Figure 2 are modified (cropped) from Musser (Figures 9A, 15A,B, 17 and 18 in [14]).

2. The Papagomys group Fossil Context

There are four main excavation sites on Flores that have published findings of molars identified as belonging to the large-bodied Papagomys group: Liang Toge, Ola Bula, Boa Leza, and Liang Bua. As can be seen in Figure 1, Liang Toge, Ola Bula, and Boa Leza are located relatively close to Mata Menge. Liang Toge is a rockshelter (often referred to as a cave) located 30 km northwest of Mata Menge, while the open sites of Ola Bula and Boa Leza are in close proximity and also located in the So’a Basin: Ola Bula is 4.4 km east of Mata Menge, while Boa Leza is within walking distance (885 m) to the northeast. The cave site of Liang Bua is the most distant, being 74 km west-northwest of Mata Menge. All of these sites were originally excavated by the Dutch missionary and archaeologist, Theodorus Verhoeven [17].

2.1. Liang Toge (Mid-Holocene)

The Liang Toge rockshelter was excavated by Verhoeven in 1954, with the sediments subsequently radiocarbon dated by the Indonesian palaeoanthropologist, Teuku Jacob, to 3550 ± 525 years BP, which Verhoeven considered to be a minimum age [18]. Using the SHCal-20 calibration curve in OxCal4.4 [19], the calibrated age of the sample would lie between 3378 and 754 cal BCE (95% probability). However, because the analysis was carried out in 1967, the original radiocarbon age might be unreliable; moreover, it is not clear what material was dated (bone, charcoal, shell?). We therefore assume a Holocene age for the Liang Toge material. Hooijer [16] originally examined the large murine material excavated from Liang Toge, which was later reviewed, re-measured, and substantially revised by Musser [14] as representing two Papagomys group murines: Papagomys armandvillei and P. theodorverhoeveni.

2.1.1. Papagomys armandvillei (Muridae, Mammalia) (Jentink, 1892)

Based on extant material collected by the Dutch Jesuit missionary Le Cocq d’Armandville, the type specimen of Papagomys armandvillei (refer to Figure 2a) was originally named Mus armandvillei by the Dutch zoologist Fredericus Jentink, in collaboration with the then University of Amsterdam Professor of Zoology, Max Weber [20]. It was later assigned to the genus Papagomys by the Dutch mammalogist, Henri Sody [21], but without explanation as to the etymology of the genus. It is possible that Papa refers to Father Le Cocq d’Armandville (who is referred to as such in [22] (p. 105)), with papa being colloquial for father in many languages, including Indonesian, Dutch, and English.
Hooijer [16] originally identified 10 specimens (one partial maxillary row, seven mandibular rows, and two isolated lower molars) as sharing morphological similarities with the holotype of Papagomys armandvillei. However, because these molars tended to be wider than the holotype, Hooijer designated them to a new subspecies, P. armandvillei besar. Musser’s [14] review included a comparison of this material with seven additional extant specimens. Musser concurred with Hooijer that the fossil molars are P. armandvillei and that the Liang Toge lower molars tend to be wider than the recent material but found the mandibular crown row lengths to be very similar. On this basis, Musser disagreed with Hooijer that the mid-Holocene P. armandvillei molars are substantially larger and concluded that they should not be designated as a new subspecies.
According to Musser [14], the main dental characteristics of Papagomys armandvillei are that the molars are large, robust, high cusped, and relatively simple in cuspidation and that the cusps form laminae with very little wear. The maxillary tooth row widths follow the pattern of M1 ≥ M2 > M3, have 5:4:3 roots, lack cusp t7, have a small or absent t3, and have the M1 and M2 slant anteriorly and interlock. The lower molar widths follow the pattern of m2 > m1 = m3, have 4:4:3 roots, and the cusps form chevron or arcuate transverse laminae that are set close together. In addition, small accessory cusplets are rare, there is no antero-central cusp on the m1, and the m1 and m2 each have a posterior cingulum and slant anteriorly (see Section 3.3 in the Materials and Methods for the definitions of the nomenclature applied to the molars).

2.1.2. Papagomys theodorverhoeveni (Muridae, Mammalia) (Musser, 1981)

On the basis of 18 Liang Toge mandibular fossils sharing distinctive morphological characteristics and being smaller than the available fossil specimens of Papagomys armandvillei, Hooijer [16] named a new Papagomys species, P. verhoeveni, after Verhoeven. Although the distinctiveness of this new species was primarily greater complexity due to the presence of accessory cusplets on the lower molars, Hooijer’s type specimen was a maxillary tooth row that Musser [14] subsequently reassigned as a small P. armandvillei. This removal of the type specimen necessitated a revision of the species name, which Musser chose to be theodorverhoeveni, in keeping with Hooijer’s original intent, and selected a complete dextral mandibular row of a young adult (Specimen 12; refer to Figure 2b) as the neotype. Musser also reassigned an isolated m1 (Specimen 17) to P. armandvillei, leaving P. theodorverhoeveni consisting of only mandibular molars and representing, according to Musser, 17 individuals. Overall, Musser considered P. theodorverhoeveni to be a murine of about the same size as the smaller Recent P. armandvillei.
The Belgian palaeontologist, Xavier Misonne [23], thought Hooijer’s Papagomys verhoeveni “interesting in many respects” (p. 76), but concentrated on the characteristics of the lower molars. As with Musser [14] and Hooijer [16], Misonne considered the main features distinguishing these fossils from P. armandvillei to be their smaller size and greater complexity. To this, Musser [14] added that the P. theodorverhoeveni lower molars, while high cusped and following the molar width pattern of m2 > m1 > m3, 4:3:3 roots, have thinner and wider-spaced laminae that are more erect than in P. armandvillei. Furthermore, the P. theodorverhoeveni m1 tends to have a small antero-central cusp or low mound, while the anterior cusps meet at right angles and remain discrete until advanced wear.

2.2. Ola Bula and Boa Leza (Early–Middle Pleistocene)

The Ola Bula murine material was recovered from a sandstone layer by Verhoeven, likely during his ~1957 excavation at Ola Bula (unpublished report). Although this site is yet to be reliably dated, it sits stratigraphically above the accurately dated Wolo Sege Tephra (see [6] for the direct date of the WST at Ola Bula/Tangi Talo) and is therefore younger than 1 mya. Ola Bula is also stratigraphically below the Gero Limestone Member, a lacustrine unit the base of which has been dated at 0.65 mya [1]. Together these dates (1–0.65 mya) place the Ola Bula site either in the late Early Pleistocene or the early Middle Pleistocene; the boundary between the Early and Middle Pleistocene being 0.774 mya. The Boa Leza murine material was excavated from tuffaceous sandstones by Verhoeven in 1963 [24] from a similar sedimentary facies as at Mata Menge, with the fossil-bearing layers having since been dated at 0.84 ± 0.07 mya [25], suggesting a broad similarity in age with the Mata Menge interval, MM-LOW [6]. Musser [14] associates these finds with Hooijeromys nusatenggara, and as far as we are aware, no other large-bodied Papagomys group molars have been described from Ola Bula, Boa Leza, or any other Middle Pleistocene site in the So’a Basin or on Flores.

Hooijeromys nusatenggara (Muridae, Mammalia) (Musser, 1981)

The genus Hooijeromys and type species H. nusatenggara (refer to Figure 2c) were first described by Musser [14] (pp. 99–107), with the fossil holotype consisting of a dextral maxillary fragment with a complete, and only moderately worn, molar tooth row (Specimen 1). This fossil, excavated from Ola Bula and which Musser describes as belonging to a rat with a moderately large body size, was named by Musser in recognition of Hooijer’s contribution to the field. The referred H. nusatenggara material consists of a dextral maxillary fragment, also recovered from the Ola Bula sediment. This fossil is a complete, but very worn, upper tooth row containing an incomplete M2 (Specimen 2, depicted in Figure 2c), which appears to be chipped buccally. There is also an isolated sinistral third upper molar from the nearby site of Boa Leza, together with three isolated lower molars. These are the first two laminae of a sinistral first molar belonging to an adult (Specimen 4, depicted reversed in Figure 2c) and two isolated third molars: sinistral from a very young adult (Specimen 5) and dextral from another adult (Specimen 6, Figure 2c). Although Musser was confident that the Boa Leza lower molars are not from Rattus or any of the smaller murines endemic to Flores, he was cautious in associating these finds with H. nusatenggara (p. 100). Apart from the two maxillary fragments, no other cranial elements attributable to H. nusatenggara were recovered from Verhoeven’s excavations.
Based on this limited material, Musser [14] noted that the upper molars of Hooijeromys nusatenggara are similar to Papagomys armandvillei but mainly differ in being low cusped, smaller (both absolutely and in relation to palate width), and having thinner and straighter cusps that form more transverse laminae, and that the M1 has a uniquely “gourd-shaped” cusp t2 (p. 99). Musser considered the tentatively associated lower molars to be more similar to P. armandvillei than P. theodorverhoeveni, in that the cuspidation is similarly simple and that the m1 fragment lacks both an antero-central cusp and evidence of accessory cusplets.

2.3. Liang Bua (Late Pleistocene-Holocene)

Liang Bua was discovered as an archaeological site by Verhoeven in 1950, which he first excavated in 1965. Subsequent excavations were led by the Indonesian archaeologist, Raden Pandji Soejono (1978–1989), and the Australian archaeologist, Mike Morwood (2001–2012). Since Morwood’s death in 2013, work has periodically continued to the present but has consistently involved the Indonesian archaeologist, Thomas Sutikna. Sutikna’s revision and resolving of the stratigraphy of Liang Bua [5] has meant that the dating of this site is problematic for the faunal material recovered during earlier excavations, and specifically from Sectors I, III, IV, VII, and XI [26]. This material includes a doctoral analysis of the Liang Bua murine molars undertaken by Elisa Locatelli [27], which informed the later publication by Locatelli et al. [28] and was itself informed by the Liang Bua murine lower molars analysed by Zijlstra et al. [29]. While Locatelli’s research included attributing maxillary molars to Papagomys theodorverhoeveni, and Zijlstra et al. argued that the main difference between the P. theodorverhoeveni and P. armandvillei molars was size, Hooijeromys nusatenggara was found to be absent from the entire Liang Bua assemblage. Unfortunately, and in addition to the dating being unreliable, the protocols applied in these studies prevent comparison with calliper-based measurements. Initiated in Zijlstra et al. [29], these protocols are based on microscopy images, differ from the more commonly applied calliper measurements as to what constitutes molar width, do not include molar row lengths, and do not differentiate the metric data according to the extent of molar wear.
Drawing on the revised Liang Bua stratigraphy, and in a paper primarily focusing on murine post-cranial size differences, Veatch et al. [30] have produced counts (NISP) of murine dentaries from the Liang Bua Sectors XXI and XII, both of which contain three reliably dated stratigraphic units (1B, 2, 8C) spanning 120 kya (thousand years ago) to recent. A summary of their findings concerning the large Papagomys group murines is in Table 1, including what the authors tentatively associated with Hooijeromys nusatenggara and what they considered to be a probable third species of Papagomys.
Although Veatch et al. [30] did not provide any molar measurements, they described P. armandvillei as ‘giant’, P. theordorverhoeveni as ‘huge’ and Hooijeromys cf. nusatenggara and Papagomys sp. as ‘large’ murines, based on the size of the dentaries recovered and published body mass estimate ranges. This categorisation is clearly reflected in the quite marked differences in the paper’s scaled photographs of maxillary first molars. In this illustration, the Liang Bua H. cf. nusatenggara M1 is approximately ⅔ the width and length of the holotype of P. armandvillei and ¾ the width and length of a Liang Bua P. theodorverhoeveni. The authors’ probable third species of Papagomys from Liang Bua appears to be slightly longer than the Liang Bua H. cf. nusatenggara and considerably wider—allowing that 2D images may have a distorted perspective.

3. Materials and Methods

3.1. Mata Menge (Early Middle Pleistocene) Stratigraphic Context

The stratigraphy of MM-UP and MM-LOW, together with the provenance of the finds that were excavated (i.e., not recovered from sieving) and have associated GPS coordinates, are illustrated in Figure 3, which follows the stratigraphic layers detailed in van den Bergh et al. [6].
Between 2013 and 2023, the MM-UP interval resulted in the recovery of a large number of relatively well-preserved and measurable murine molars: 28 maxillary and 31 mandibular rows, 227 isolated maxillary molars, and 230 isolated mandibular molars (noting that not all of the MM-UP molars excavated in 2017 were able to be accessed for this study). Likely due, in part, to the earlier MM-LOW excavations (1994–2014) being undertaken by comparatively inexperienced excavators and that systematic wet-sieving was not implemented until 2012, comparatively low numbers of murine molars have been recovered from this interval. The relatively well-preserved and measurable MM-LOW specimens include two maxillary and 17 mandibular rows, 13 isolated maxillary molars, and 12 isolated mandibular molars.
The dental elements from MM-LOW all originate from a c. 2-m-thick fluvio-volcanic cut-and-fill sequence consisting of massive fine-grained and poorly sorted mass flow deposits alternating with water-laid tuffaceous fine- to coarse-grained sandstone layers and white tuffaceous siltstone layers containing freshwater diatoms. This sequence has a maximum age of 0.77 myr (based on a Normal geomagnetic polarity at the base of the Brunhes Chron: [6]). Most of the specimens that were provenanced with a total station were recovered from a poorly sorted, brown, cross-bedded, coarse-grained sandy layer of variable (0–65 cm) thickness with a scouring base or the underlying tuffaceous silt (Layer 8b). The boundary between these two layers is irregular and characterised by soft-sediment deformation structures, indicating that these two layers were both deposited during a short time interval (Figure 3b). In total, 45% of the securely provenanced dental elements originate from the combined Layers 8a and 8b. In addition, 21.3% of the provenanced dental murine fossils originate from overlying mudflow layers (Layers 5–7), and 12.8% from the underlying layers (Layers 9a–9b, 10). None occurred above the base of a poorly sorted fine-grained volcaniclastic mudflow overprinted by a paleosol (Layer 4). This sequence has been interpreted as deposited on a distal alluvial fan originating from a caldera lake 5 km north-northwest of Mata Menge. The generation of fine-grained ashy mudflows with freshwater diatoms is thought to be associated with explosive volcanism inside this caldera, causing an overflow of the caldera lake.
The much more abundant dental specimens from MM-UP originate primarily from a water-laid sandstone layer (Layer II) deposited in a small stream bed (Figure 3d). Layer II fills in a scoured irregular surface eroded in a paleosol (Layer III) and wedges out towards the west [1], as shown in Figure 3e. The flat top surface of Layer II is covered by a sequence of fine-grained mudflows (from top to base, Layers 1a–1f) that sealed off the stream bed and also contains freshwater diatoms. In total, 77% of the provenanced fossils occur dispersed throughout Layer II, while a smaller number (11.9%) occurred in Layer I, mostly at the base of the mudflow directly overlying Layer II. From Layer III only a few fossils were recovered (1.8%), while for 9.3% no provenance data and/or layer number was recorded.
MM-UP almost certainly represents a much shorter time interval than MM-LOW. Layer II of MM-UP has a maximum thickness of 60 cm and is sealed off with a mudflow that picked up some sand-sized clasts from the stream bed, including murine dental elements. The mudflow sequence of Layer I is not overprinted by a paleosol, and hence this sequence of mudflows must have accumulated in a short period of time, perhaps months or even days. MM-LOW is c. 2 m in thickness and has multiple erosional cut and fill structures. Although a large portion of the MM-LOW fossils occur in Layers 8a and 8b, which were also deposited during a short time interval, the time depth of MM-LOW must be much larger than MM-UP. The two fossil-bearing intervals are separated by 11 m of stratigraphy from which no fossils have been recovered to date. The two fossil-bearing intervals may therefore be separated in time by a gap of ~70,000 years and are consequently treated separately in this analysis.

3.2. Fossil Preparation

Due to most of the MM-LOW fossils being excavated from fluvial sandstone and many of the MM-UP fossils being excavated from tuffaceous siltstone and fine- to medium-grained sandstone, the specimens tend to be encrusted with sediment. Both an ultrasonic bath and a mildly acidic solution failed to remove the matrix, requiring the use of a dental pick or needle to clean specific areas of interest. It was not, however, possible to remove the matrix from where it occurs in some specimens between the molars of the maxillary and mandibular rows.

3.3. Nomenclature

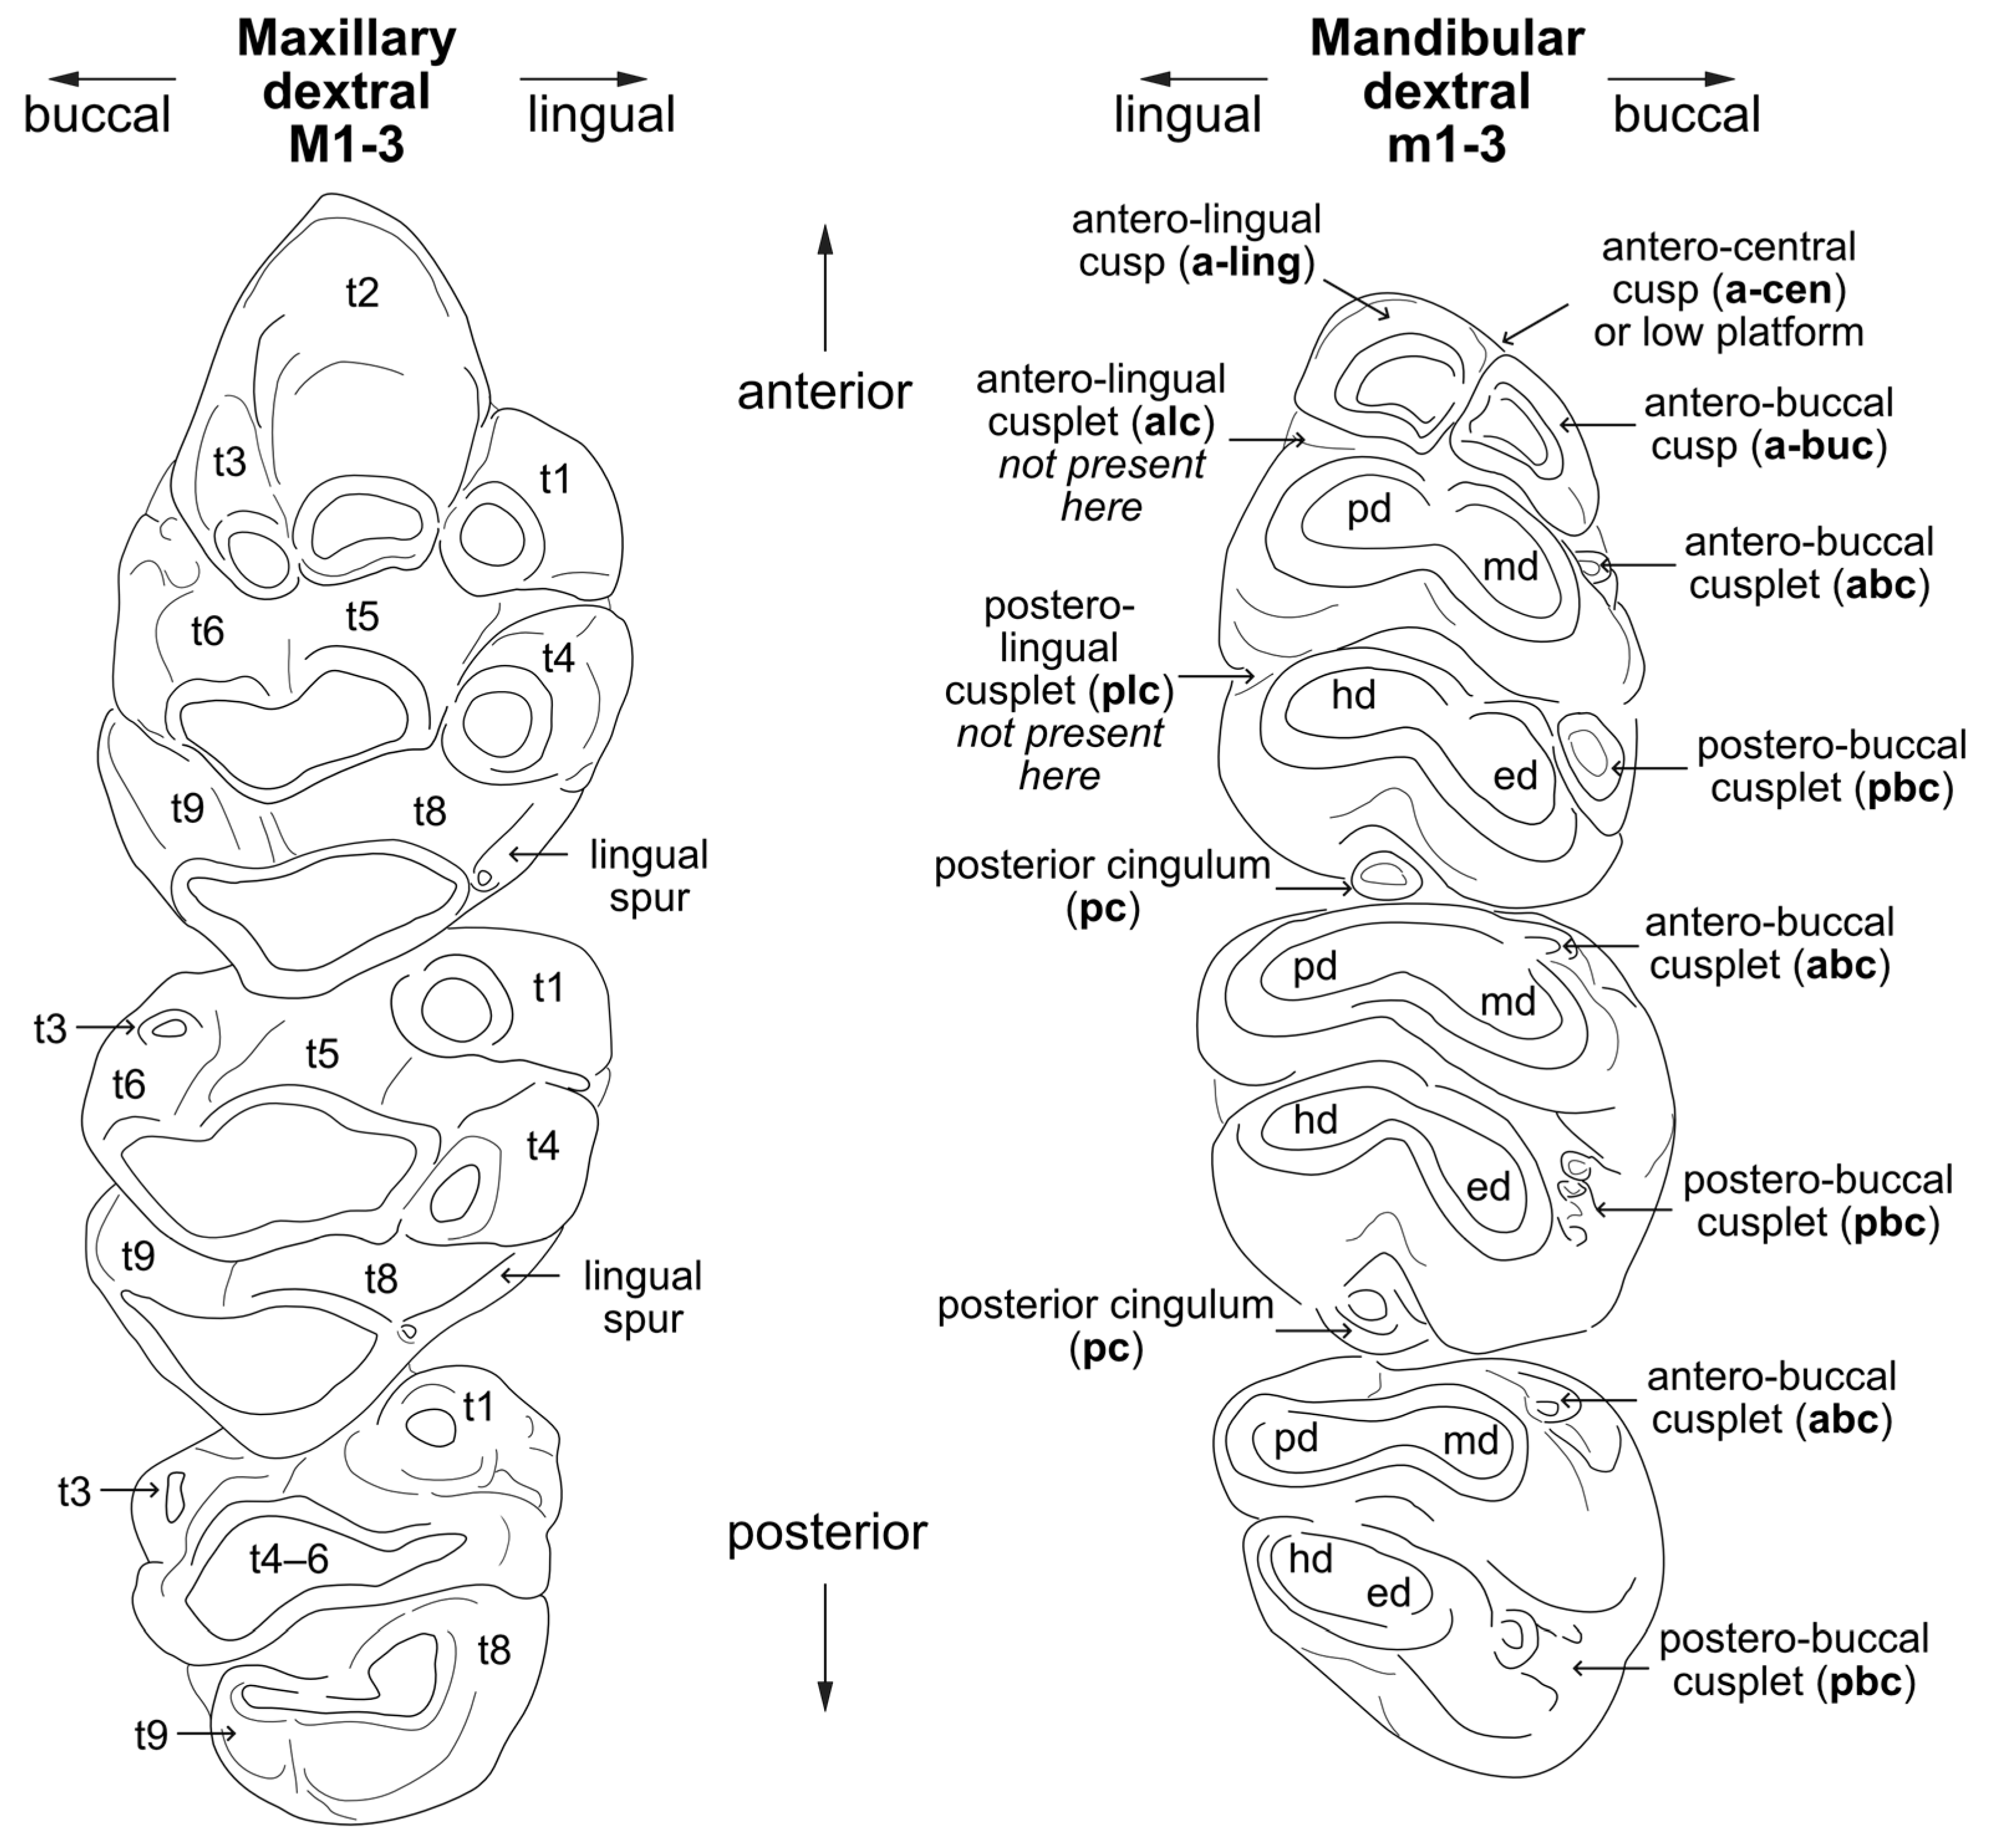
The nomenclature applied in this study is illustrated in Figure 4 and generally follows Musser [14] (pp. 73–74) and Aplin and Helgen [10] (p. 10). For this study, however, the side of the tooth adjacent to the cheek is referred to as buccal.

3.4. Measurements of the Mata Menge Material

The alveolar and crown length of each well-preserved molar row, and the individual molar maximum widths, were measured three times on three separate days using a dial calliper graduated to 0.01 mm while being viewed through a 10× magnifying lamp. This primarily enables the Mata Menge measurements to be comparable with Musser [14], noting that Musser’s calliper graduation was 0.1 mm, and there is no definition as to the calliper orientation. For this study, the calliper was held parallel to the occlusal plane for the measurements of the molar widths and lengths, following Aplin and Helgen [10] and Louys et al. [11]. All well-preserved isolated molars were measured for maximum width, and a selection (105 maxillary, 100 mandibular) for maximum length. Only one specimen enabled a measure of palate width, though a limited number of finds provided mandibular incisor widths and approximate mandibular diastema lengths. These measurements are defined, and their main sources referenced, as follows:
  • Molar width: between the points that define the greatest width [14] (p. 72);
  • Molar length: between the points that define the greatest length [14] (p. 72);
  • Alveolar length: anterior edge of the alveolus of the first molar to the posterior edge of the alveolus of the third molar [31] (p. 332);
  • Crown length: from the anterior enamel face of the first molar (excluding the root of the M1) to the posterior enamel face of the third molar, allowing that the presence of matrix renders this measure less reliable than alveolar length [32] (p. 12);
  • Palate width: between the lingual alveolus borders of the M1 [14] (p. 92);
  • Incisor width: transverse at, or near, the base of the mandibular incisor alveolus [16]
  • Diastema length: from the anterior alveolar margins of the m1 to the posterior alveolar margin of the incisor [31] (p. 332).
In addition to our use of a dial calliper producing measurements that are compatible with Musser [14] and most of the published measurements of murines excavated from the region (e.g., [10,11,16,33]), we also found that measurements taken using a portable digital microscope (Dyno-Lite AF4915ZTL, mounted on a stand) tended to result in an unacceptable level of variation when performed on different days. This variation (e.g., ±0.06–0.09 mm for molar width) was due to slight shifts in the positioning of the fossils, and, because of the varying levels of jaw preservation and adhered matrix, frequent and time-consuming adjustments were required for the magnification levels and subsequent calibration. Accurate measurements involving image microscopy have been achieved; Lazzari et al. [34], for example, have devised and applied reproducible alignment protocols, but these require 3D scans of un-encrusted finds. Our use of a digital microscope was useful, however, for checking whether any relatively large or small calliper measurements were due to the presence of small cracks or chips. If so, these measurements were excluded; if not, the molars were remeasured twice.

3.5. Molar Morphology

The Dyno-Lite digital microscope was primarily used to visually assess the occlusal, lingual, and buccal views of the finds and, when discernible, the molar roots. For a selection of the Mata Menge material, these views were recorded as digital images using the microscope’s associated software, which includes an indicative scale (e.g., 1 mm, 2 mm). These images are of all of the molar rows from both intervals, all of the isolated molars from MM-LOW, and 122 isolated maxillary and 122 isolated mandibular molars from MM-UP.

3.6. Calculation of Minimum Number of Individuals (MNI)

We follow the method popularised by T. E. White in 1953 and reported in Lyman [35], where elements (in this case individual molars) are separated according to being either dextral or sinistral, and the greatest frequency is identified as the minimum number of individuals present.

3.7. Image Processing

The microscopy images that we use to illustrate the Mata Menge finds in this paper were extracted using the mask function in Affinity Photo 2 (versions 2.5.5–2.6.2) and enhanced using the software’s ‘unsharp mask’ feature to increase clarity without increasing noise [36]. Filter levels are the same for most illustrations: radius 36 pixels, factor 0.5, threshold 0%, and blend mode normal. Outline schematics representing molar rows were undertaken in Affinity Designer 2 (version 2.5.7). The scales on all of the images reference the digital microscope scale, cross-checked with the molar widths.

3.8. Wear Stage (WS) Estimates

There are precedents for estimating wear stages in murine maxillary (e.g., [37,38,39]) and mandibular (e.g., [40,41]) dentitions, with most focusing on the occlusal surface of the first molar. While useful as general guides, rodent molar wear patterns vary according to the genus and species of interest, and, within a particular species, wear patterns will also reflect seasonal and regional dietary adaptations (e.g., [38]). Musser [14] generally referred to the wear patterns of the Flores endemics as indicating the individual was juvenile, young adult, adult, or old adult. In a later study of extant Lenomys endemic to Sulawesi, Musser [42] defined occlusal wear as slight (young adult), moderate (adult), and well worn (old adults) (p. 16). Zijlstra et al. [29], in their analysis of what they identified as Papagomys armandvillei and P. theodorverhoeveni mandibular molars recovered from Liang Bua (prior to the revised stratigraphy), also defined three wear stages: (1) discrete cusps, (2) discrete laminae, and (3) merged laminae.
On the basis of the material recovered from Mata Menge, and referring to Musser [14] and Zijlstra et al. [29], we estimate 5 wear stages, which are defined in Table 2. Where the specimen constitutes a molar row, the wear stage of each molar can differ slightly. The purpose of these relatively simplistic categories is to identify any impact of estimated wear on the individual molar widths and lengths and to ascertain a mortality profile. The most common shape changes due to wear are described in Section 6, which contains the results of the morphological analyses of the Mata Menge material.

3.9. Statistical Analyses

Statistical analyses and plots were undertaken with the palaeontological statistical software PAST, versions 4.16c-5.2.1 [43], as follows:
  • Histograms: Each histogram is optimal, with the wider sets of bins indicating less variation in the dataset.
  • Mean and whisker plots: Mean, standard error, and whisker length of one standard deviation (1 SD).
  • Correlations (tau): Kendall’s coefficient of rank correlation (tau-b) is a robust and conservative parametric correlation that is recommended for comparing ordinal (e.g., estimated wear stage) and continuous (e.g., molar widths, lengths) data, especially when dealing with small sample sizes and/or when the sample values tend to clump (for a discussion, see [44]). Where our analyses meet the requirements for a Pearson’s correlation coefficient (r), this is applied. Significance is set at p < 0.05 for both.
  • Two sample tests (U and A): Given our analyses typically involve substantially fewer specimens in one of the data sets, and/or one of the data sets is not normally distributed, the Mann–Whitney test for stochastic equality (U) is applied, reporting either the exact (when available) or Monte Carlo permutation for p, with significance set at p < 0.05. We apply these tests together with the Vargha–Delaney A (effect size) to indicate the size of the difference (~0.5x ≈ y, ~0x < y, ~1x > y).
  • Coefficient of species variability (V1/√logN): According to Freudenthal and Cuenca Bescos [45], Pearson’s coefficient of variation is likely specific to a taxonomic group, and the limitation of this application is that it requires a normal distribution. This likely would not occur when the data contain molar measurements of more than one species, and furthermore, it is more typical that the different species are unequally represented. A consequence of unequal frequencies is that the presence of a small number of a different species will be subsumed into the standard deviations of the larger group. Focusing on fossil cricetid molars from the European Tertiary, Freudenthal and Cuenca Bescos developed a new coefficient, V’, which is 100 × (difference maximum-minimum)/mid-point of the range, divided by the square root of log N. Populations exhibiting an excessive degree of variation could be reasonably assumed to contain two different species and/or lack homogeneity due to other factors, such as errors in data entry. In a later publication, Freudenthal and Martín Suárez [46] applied V’ to the molars of more than 100 samples of fossil and recent Muridae, with each sample containing five or more specimens. The authors published the means and standard deviations of V’ for these samples as constituting the expected values when only one species is represented, and we apply these to the molar widths of the species involved in this analysis.

3.10. Association of the Maxillary and Mandibular Rows

We follow Aplin and Helgen [10], who noted that the length of a murine maxillary molar row typically exceeds the associated mandibular row by 4–6%. The authors applied alveolar length as one of the criteria to associate the upper and lower dentitions of fossil murines excavated from Timor and to differentiate between two “giant” fossil species with dentitions of similar morphology (p. 9).

3.11. Estimation of Molar Cusp Height

Although Musser [14] describes the Papagomys group molars as being either low or high cusped, this is not quantified. The eight Recent P. armandvillei are described as high cusped and are the only large molar rows depicted in buccal view in both Musser [14] and Hooijer [16]. Therefore, an estimate of the Mata Menge molar cusp height involved entering Musser’s buccal view of the dextral maxillary molar row of the young adult P. armandvillei holotype (Figure 11 in [14]) into Affinity Photo 2 and scaling this to the crown length, together with buccal views of two dextral maxillary molar rows of young adult (WS2) specimens from Mata Menge, one from each interval (MM2012-T23C- F1647 and MM2014-T32D-F245). Both of the Mata Menge molar rows were then scaled to the crown length of the P. armandvillei holotype, and the resulting crown heights were compared.

4. Results: Mata Menge Metric Analyses

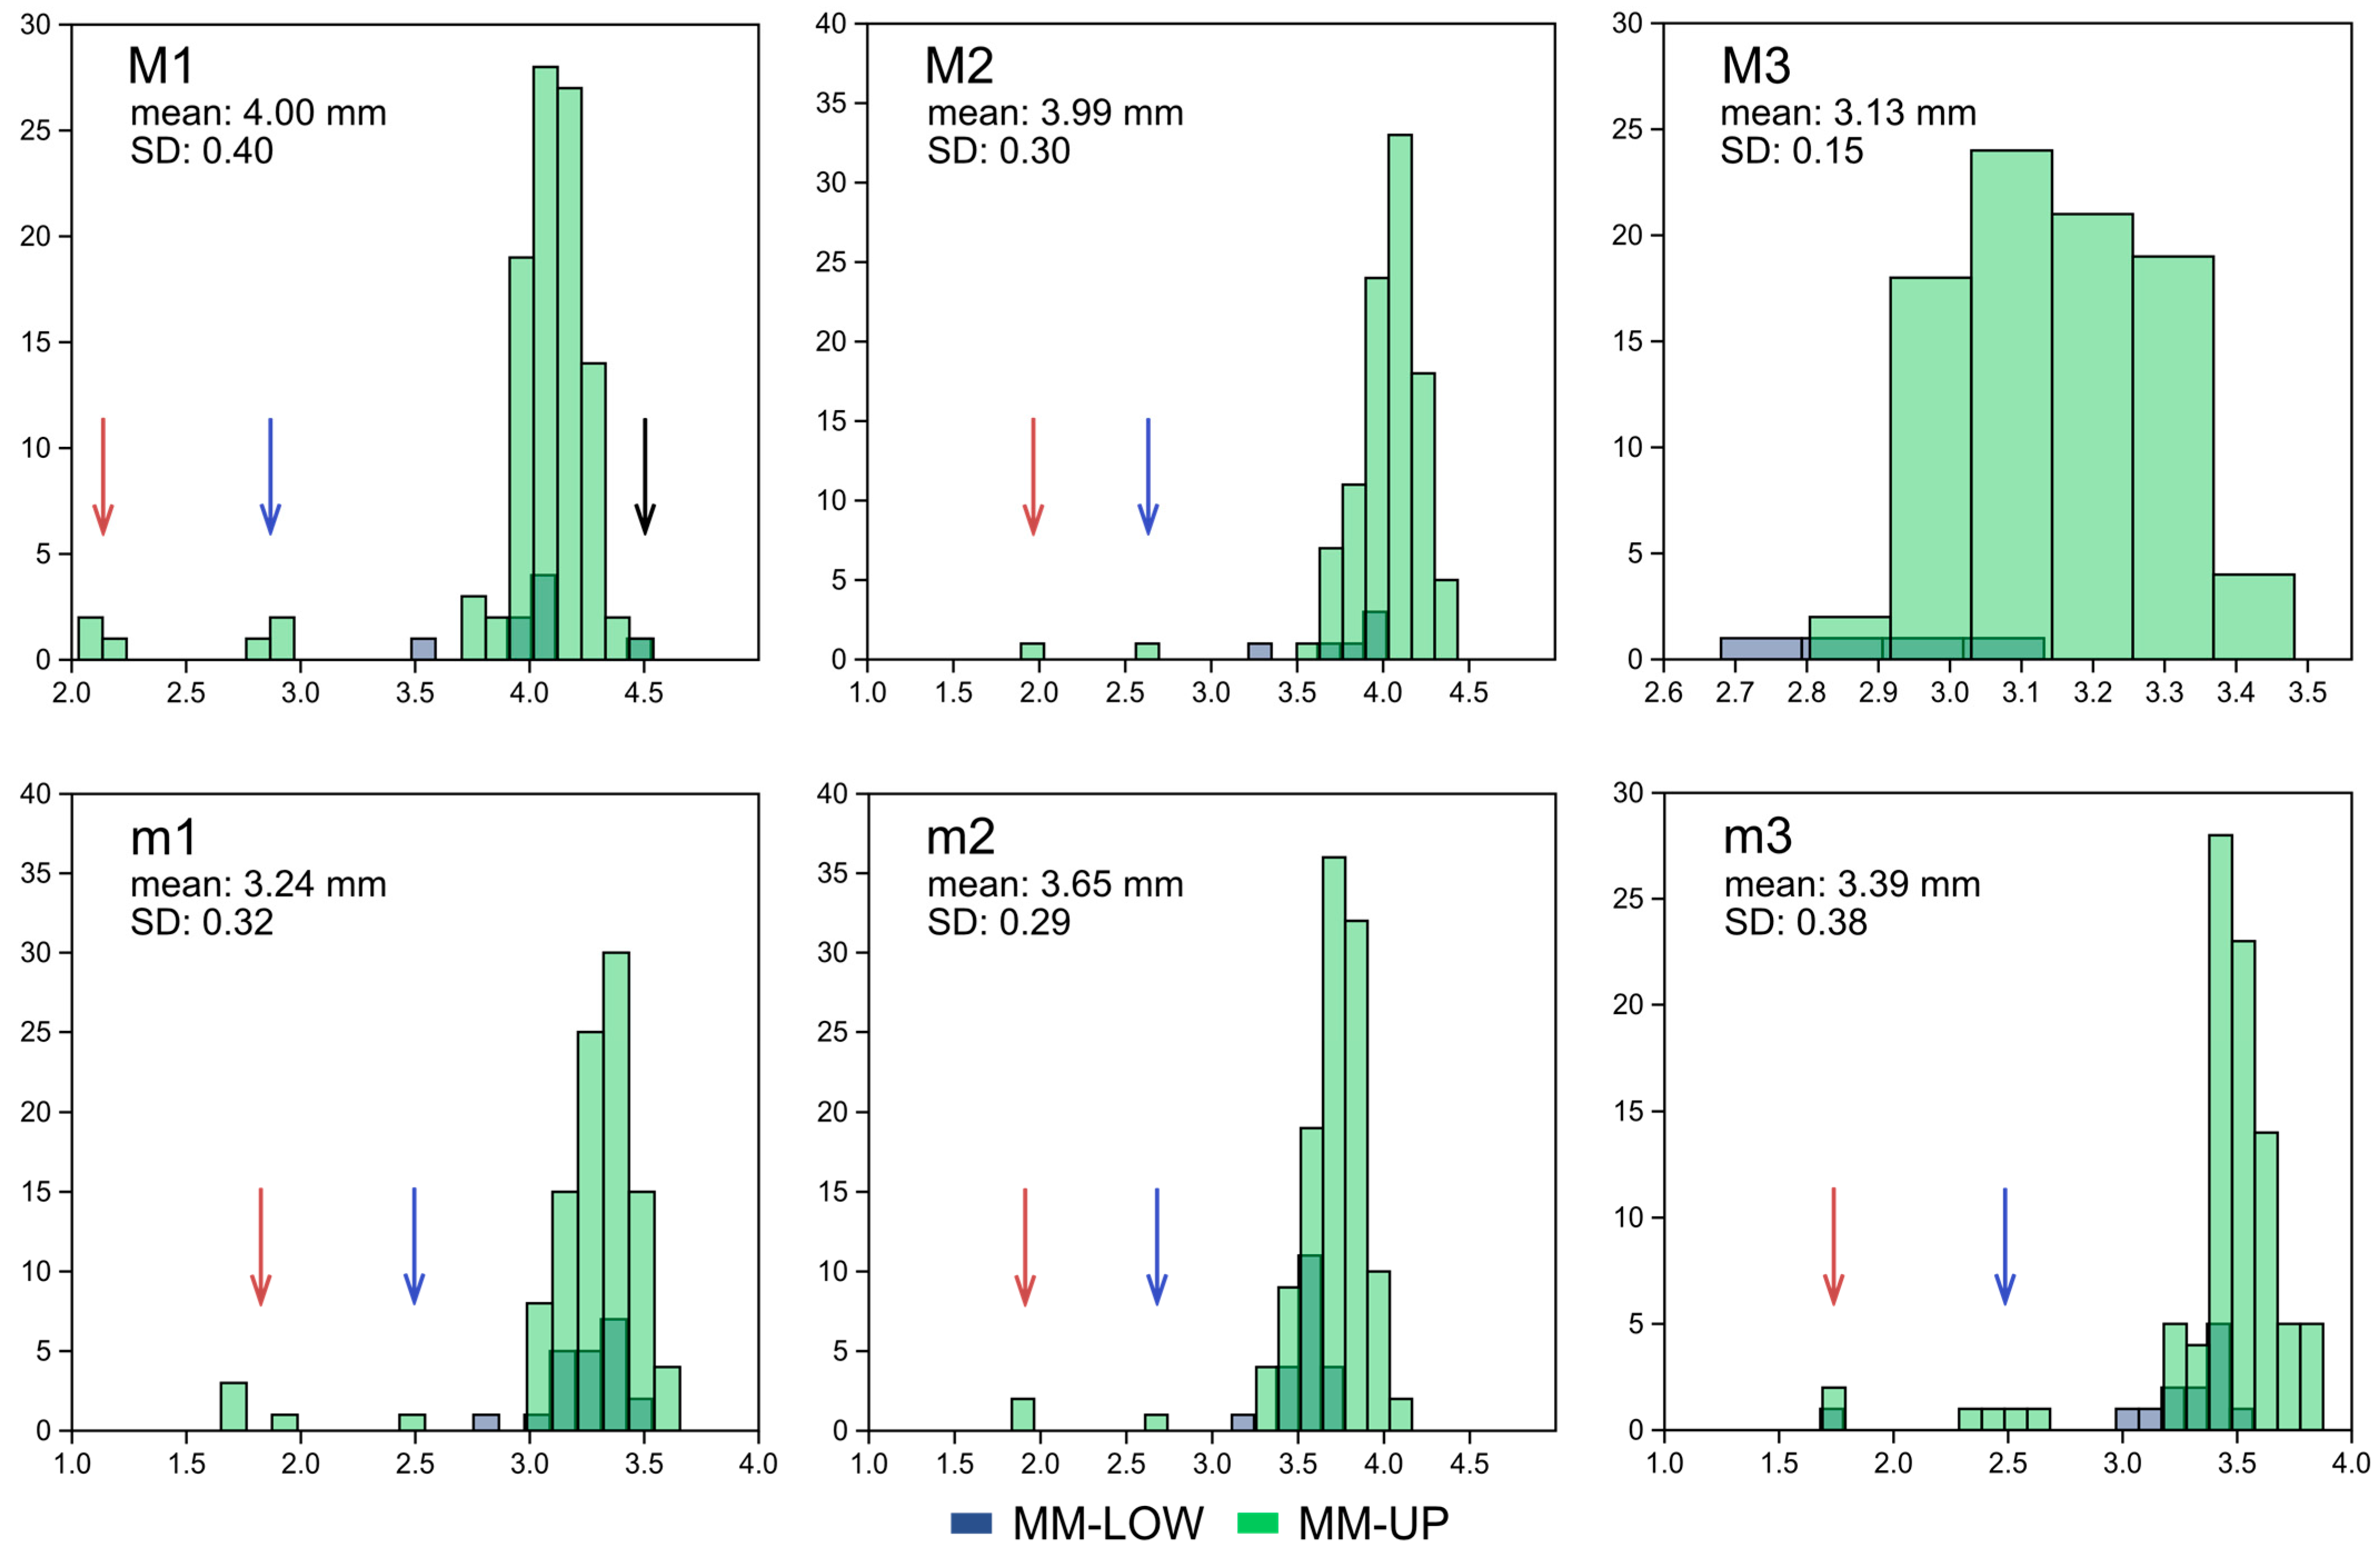
As can be seen from the histogram distributions of maximum molar widths in Figure 5, most of the Mata Menge molars form one large cluster. The optimal histogram bin widths show that the maxillary M3 has the least variability. The remaining upper molars and all of the lower molars are more variable (have narrower bin widths) due to two small but distinct clusters of molars that are narrower by more than 1 SD (standard deviation). With the exception of a mandibular fragment containing an isolated m3 and incisor, all are from the upper interval (MM-UP). The minimum number of individuals (MNI) forming the outlier groups are likely from a small murine rodent (MNI = 4, based on three dextral m1 from MM-UP and the isolated m3 from MM-LOW), while the other outlier group suggests a slightly larger rodent (MNI = 3, based on the dextral m3). In addition to the outlier clusters of distinctly narrower molars, an isolated M1 from the MM-LOW interval is the widest (4.53 mm) and longest (6.25 mm), has the distinctive morphological characteristics of Spelaeomys florensis, and, as mentioned previously, has been reported elsewhere [6].
Comparing the Mata Menge murine coefficient of variability (V’) of molar widths to the Freudenthal and Martín Suárez [46] means (Table 3) indicates that when the small, medium, and Spelaeomys florensis molars are excluded, the large Mata Menge have molar widths having a variability that is within the range of a single species of murid. Given, therefore, that the large Mata Menge murines appear to be conspecific, and that the focus of this paper is a comparative analysis including the large-bodied Papagomys group murines (Papagomys armandvillei, P. theordorverhoeveni, Hooijeromys nusatenggara), the Mata Menge small and medium molars, together with the isolated M1 of Spelaeomys florensis, are removed from further analysis.
Examining the variability of the large Mata Menge murines, Table 3 also shows that the M2 widths fall close to the V’ 1 SD boundary, with the remainder of the molars being close to the single species variability mean. This is likely due to an MM-LOW M2 molar being relatively narrow, as can also be seen in the Figure 5 M2 histogram. This molar (MM2012-T27B-F4988b) is retained, however, because it is only 0.05 mm narrower, it falls within 1 SD (0.19 mm) of the large M2 widths, and it serves to indicate the sensitivity of this method to identifying species variability. Related to this, the results of V’ additionally show that the variability is lower when just the large MM-UP molars are analysed. This indicates that, while both intervals contain the same single species, inclusion of the MM-LOW molar widths increases the overall variability due to these molars tending to be narrower.
Based on the most frequent large, conspecific molar for both intervals (sinistral m1), the Mata Menge molars have a conservative MNI of 11 from MM-LOW and 56 from MM-UP. The main statistical analyses of the large Mata Menge finds are the identification of significant differences between the two intervals (MM-LOW and MM-UP) and the extent to which the estimated wear stages impact these measurements. Summary statistics (number of specimens, range, mean, standard error, variance, standard deviation) arising from the maxillary and mandibular measurements are in Table 4, and scatter plots illustrating the frequencies of the estimated Wear Stages (WS) are given in Figure 6. Individual specimen measurements and estimated wear stage are provided in Supplementary Tables S1 and S2.

4.1. Mata Menge Maxillary Molars

All of the maxillary molars were measured for maximum molar width (N = 300), and a subset of the 232 isolated molars with well-preserved end-points were measured for length (n = 99). The MM-LOW M2 and M3 molars are significantly narrower than MM-UP, and the effect is large: M2 U = 97.5, p = 0.006, A = 0.16; M3 U = 26, p = 0.004, and A = 0.07. There is no statistically significant difference in the width of the M1 (U: p > 0.05).
Although the MM-LOW M1 is similar in width to MM-UP, it is significantly shorter in length, and the effect is large: U = 23, p = 0.01, and A = 0.16. The length of the M2 is not significantly different (U) between the intervals (p > 0.05), and only one isolated M3 was recovered from MM-LOW. This M3 is shorter than the MM-UP mean but falls within the MM-UP range.
The M1 and M2 molar width/length ratios for both intervals are not significantly different (U: p > 0.05), and the isolated MM-LOW M3 has a similar ratio as the MM-UP mean. For both intervals the M1 width is ~⅔ the length, the M2 occlusal surface tends to be square, and the M3 is slightly longer than wide. None of the molar width/length measurements, however, are significantly correlated (r: p > 0.05).
Within-row width proportions were able to be calculated for 30 specimens (12 complete rows, 18 partial). The single MM-LOW maxillary row and partial M2-M3 row have similar within-molar-row width proportions as MM-UP. For both intervals the M2 is close to the M1 in width, while the M3 is the narrowest. In general, the pattern is M1 ≥ M2 > M3.
Six of the molar rows are sufficiently well-preserved to be measured for crown and alveolar length, and an additional two for alveolar length. Both measurements are significantly correlated (r = 0.94, p = 0.005). The less worn, well-preserved, and only complete maxillary molar row recovered from MM-LOW is shorter in crown length than the five recovered from MM-UP. The two alveolar lengths from MM-LOW fall within the MM-UP range but cluster with the lower MM-UP values.
All of the maxillary molars were estimated for wear. A subset (n = 185) was imaged using the digital microscope and informed the wear stage estimates. The wear stage frequencies are illustrated in Figure 6, and it can be seen that there is a predominance of maxillary molars estimated to be young adult (WS2) and adult (WS3) for both the lengths and widths. This occurs for both intervals, and there is no significant difference (U: p > 0.05) between MM-UP and MM-LOW in wear stage frequency. However, because the MM-LOW molars tend to be both narrower and shorter than the corresponding molars from MM-UP, this confounds analyses of the impact of molar wear on width and length. Therefore, the impact of the wear stage is only explored with the molars recovered from MM-UP, which removes the possibility of any significant size difference being due to interval, not wear.
Both the M2 and M3 molar widths are unaffected by estimated wear stage (Kendall’s tau, p > 0.05). The M1 molars return a small, but significant, positive correlation (tau = 0.16, p = 0.02), suggesting these molars may become wider with advanced wear. The M1 wear stage frequency plot (Figure 6), however, shows that the less worn (WS1–2) and more worn (WS4–5) are within the range of the adult (WS3) molar widths, and therefore the correlation is due to the M1 distribution frequencies, not wear.
It would be anticipated that the length of the M1 and M2 would be affected by advanced wear given that the posterior laminae of these molars interlock. That is, with wear, the interlocking overlay is gradually worn away, reducing the molar’s length (refer to Section 5.1 regarding the impact of wear on maxillary molar morphology). There is only one MM-UP M1 with advanced wear (WS4) that was measured for length, and therefore the estimated wear stages are not significantly correlated with length. However, although only three of the measured M2 molars have advanced wear (WS4–5), this is significantly and negatively correlated with length (tau = −0.38, p = 0.005). This correlation is evident from the M2 length wear stage frequency in Figure 6, though it is notable that these molars all fall within the width ranges of the less worn M2 molars.
Only one of the large Mata Menge fossils was recovered with a complete and measurable anterior palate fragment. This fossil is from MM-UP, has both M1 in situ, and is estimated to be of an older adult (WS4). Measuring from the lingual margins of the M1, the palate width is 5.00 mm.

4.2. Mata Menge Mandibular Molars

All of the mandibular molars were measured for maximum width (N = 346), while a subset of the 233 isolated molars with well-preserved end points (n = 88) were measured for length. There is no statistically significant difference (U) between MM-LOW and MM-UP in the m1 widths (p > 0.05), but there is in the lengths, with the MM-LOW molars being significantly shorter (U = 7, p = 0.01, A = 0.08). The MM-LOW m2 widths are significantly narrower than MM-UP with a large effect size (U = 527.5, p < 0.001, A = 0.24), but not the m2 lengths (p > 0.05). The MM-LOW m3 widths are also significantly narrower (U = 194.5, p < 0.001, A = 0.19), while the isolated m3 length from MM-LOW clusters with the lower values of the MM-UP lengths (this same specimen also clusters with the lower values of the MM-UP widths). In essence, the lower molar results echo the results of the upper molars.
The width/length ratios of the isolated m1 and m2 molars are similar for both intervals (U: p > 0.05), and the isolated MM-LOW m3 is close to the mean of MM-UP. The m1 width tends to be ~⅔ the length; the m2 has a square occlusal surface, while the m3, on average, is wider than long. Although the m1 width has no linear relationship to length, these measurements are significantly correlated for both the m2 (r = 0.65, p < 0.0001) and m3 (r = 0.53, p = 0.007).
Within-row width proportions were able to be calculated for 43 specimens (25 complete, 17 partial), with four rows having only one measurable molar. Statistical comparison (U) of the within-molar row width proportions by interval shows they are not significantly different (p > 0.05), and the m2 is the widest molar for both intervals. The m3/m1 width ratio is more variable, with m3 ranging from slightly wider to slightly narrower than m1. In general, the pattern is m2 > m1 ≈ m3.
There are 21 well-preserved mandibular molar rows that were able to be measured for crown and alveolar length, and four for only alveolar length. The measurements are significantly correlated where both measurements could be taken (r = 0.82, p < 0.0001). The seven MM-LOW crown lengths are significantly shorter than MM-UP, with a large effect size (U = 20, exact p = 0.03, A = 0.20). Similarly, the alveolar length of the seven MM-LOW rows is significantly shorter than the 16 MM-UP alveolar rows (U: = 30.5, exact p = 0.02, A = 0.21).
Scatter plots of the frequencies of estimated wear stage for the mandibular molars are given in Figure 6, and as with the maxillary molars, there is a greater frequency of young adult (WS2) and adult (WS3) estimated wear stages in both intervals. There is no significant difference (U: p > 0.05) between MM-UP and MM-LOW. Because the MM-LOW molars tend to be narrower than MM-UP, only the MM-UP molars are analysed for identifying the impact of wear.
The width of the MM-UP m1 is significantly correlated with estimated wear (tau = 0.24, p = 0.02), as is the width of the m2 (tau = 0.24, p < 0.001), but not the m3. That these significant correlation coefficients are positive suggests that ~6% of the m1 and m2 become wider with increased wear. However, as with the maxillary M1, the scatter plots indicate that these results are largely due to the width variation of the less worn molars (WS1–3). The scatter plots also show that, echoing the case with the maxillary molars, the more worn molars (WS4–5) fall within the width range of the less worn (WS1–3). As with the m1 widths, the m1 lengths are positively significant for wear (tau = 0.32, p = 0.02), but not the m2 or m3. Again, the wear stage scatter plots (Figure 6) show that the juvenile (WS1) and adult (WS3) lengths fall within the range of the young adult (WS2), and that the positive correlation for the m1 is an artefact of distribution, not wear.
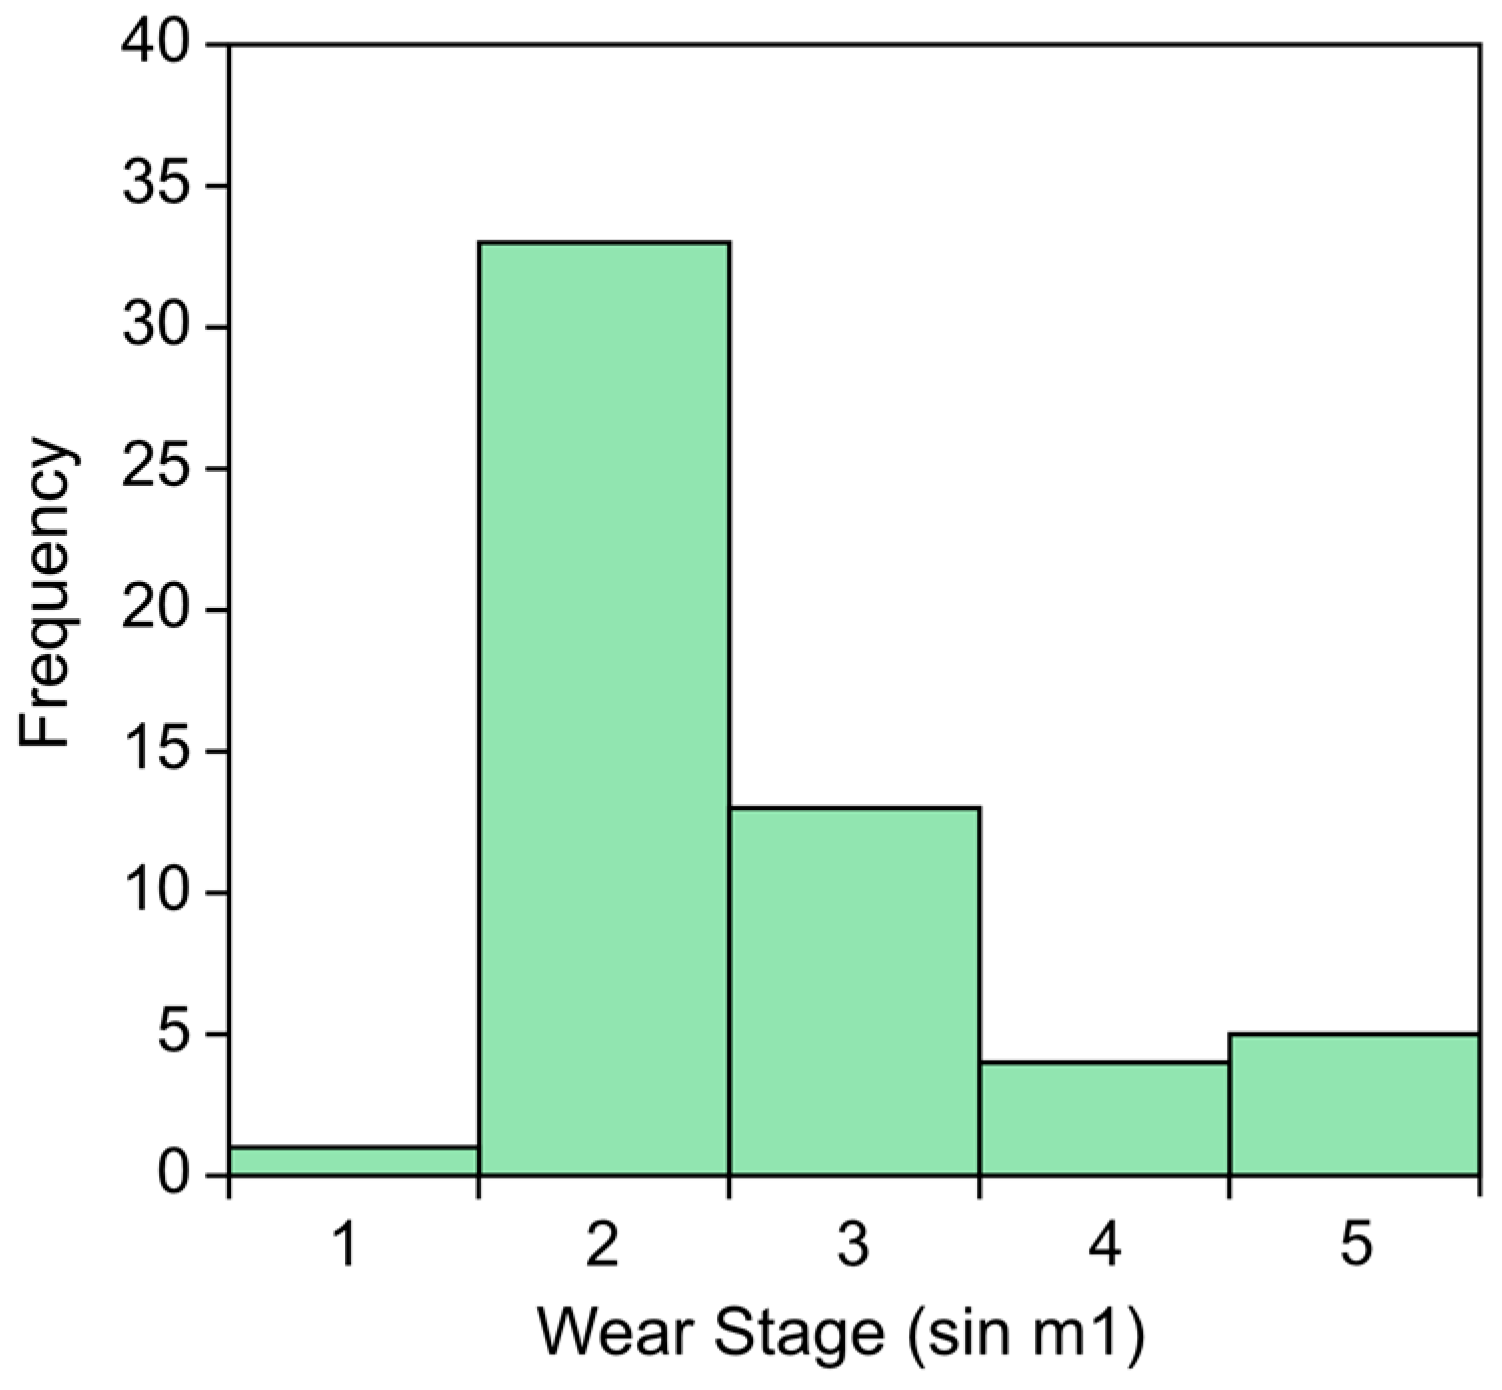
MM-UP has a conservative estimate of 56 individuals, based on the most frequent molar being the sinistral m1. The histogram of the wear stages estimated for these molars is in Figure 7. MM-UP has nearly double the minimum individuals (N = 30) required to plot a mortality profile and forms an “L” shape. This could be interpreted as a death assemblage arising from a catastrophic event [47], but could also be the result of predation by raptors.
Mandibular fragments with the incisor in situ within the alveolar base and with an associated lower molar (to include estimated wear stage) were recovered from both intervals (nine from MM-LOW and eight from MM-UP). Because of the frequency of matrix adhered to the superior edge, only transverse incisor measurements were undertaken. The MM-LOW incisors are significantly narrower than MM-UP, with a large effect size (U = 8.5, exact p = 0.006, A = 0.12). The distribution of MM-LOW young adult and adult molar wear stages (WS2–3) results in wear being significant for incisor width (tau = 0.76, p = 0.005), but the more representative spread of estimated wear stages in the MM-UP interval (WS2–5) shows that wear stages do not, as would be expected, relate to incisor transverse width (tau p > 0.05).
Diastema length is an estimate for only seven mandibles with an associated molar (three MM-LOW; four MM-UP) due to the varying degrees of preservation and the presence of sediment. There is no statistically significant difference (U) between the two intervals (p > 0.05). However, while these measurements are relatively few and very approximate, diastema length is significantly and positively correlated with estimated wear stage (tau = 0.65, p = 0.04).

4.3. Association of the Mata Menge Maxillary and Mandibular Rows

One of the two maxillary rows recovered from the MM-LOW interval (MM2012-T23C-F1647) is dextral with a low wear stage (WS2). As indicated in Figure 3a,c, this specimen was recovered 5.5 m from a mandibular row (MM2012-T23B-F2127) that is also dextral and independently estimated to have the same wear stage. Both are similar in appearance regarding the colouration of the fossilised molars and bone and may (or may not) come from the same individual. Table 5 contains the proportions of the corresponding upper and lower molars, together with the mean maxillary and mandibular alveolar lengths (which, unlike crown length, are not influenced by sediment between the molars) and mean molar widths of the molar rows from the MM-UP interval. As can be seen, the MM-LOW specimen’s alveolar maxillary row length is 4% longer than the mandibular. Although it is also unknown whether any of the MM-UP molar rows are paired, the MM-UP mean alveolar maxillary length is 6% longer than the mean mandibular length. Both of these relative lengths agree with Aplin and Helgen’s [10] 4–6% association for murines and are therefore taken to be associated.

5. Results: Mata Menge Morphological Analyses

The morphological assessments of the Mata Menge finds include all of the MM-LOW molar rows and isolated molars. While all of the MM-UP molar rows are analysed, only 122 isolated maxillary molars and 122 isolated mandibular molars from MM-UP were digitally imaged (refer to Methods Section 3.5). The total number of molars analysed for their morphological characteristics constitutes 186 maxillary (17 from MM-LOW) and 229 mandibular (55 from MM-LOW). These assessments have been greatly facilitated by the recovery of well-preserved, isolated molars that display little evidence of wear (WS1). Although the majority of the molars are from MM-UP, nearly all of the morphological features are similar across, and within, both intervals. Table 6 lists the frequencies of specific characteristics of interest and includes the frequencies where advanced wear and/or poor preservation has either obscured or rendered these characteristics indeterminate.

5.1. Mata Menge Maxillary Molar Morphology

As can be seen in Figure 8a,b, the M1–M2 of the maxillary molar rows from both intervals slant posteriorly and interlock. Interlocking is thought to add strength to the occlusal surface and involves the third lamina of the M1 and M2 overlapping the first lamina of, respectively, the M2 and M3 [23] (p. 53). Due to the presence of sediment, the extent of interlocking was only able to be estimated for one of the maxillary rows from the MM-UP interval (Figure 8b): M1/M2~14%, M2/M3~18%. All of the Mata Menge maxillary molars lack a cusp t7 and a posterior cingulum.

5.1.1. M1 Morphology

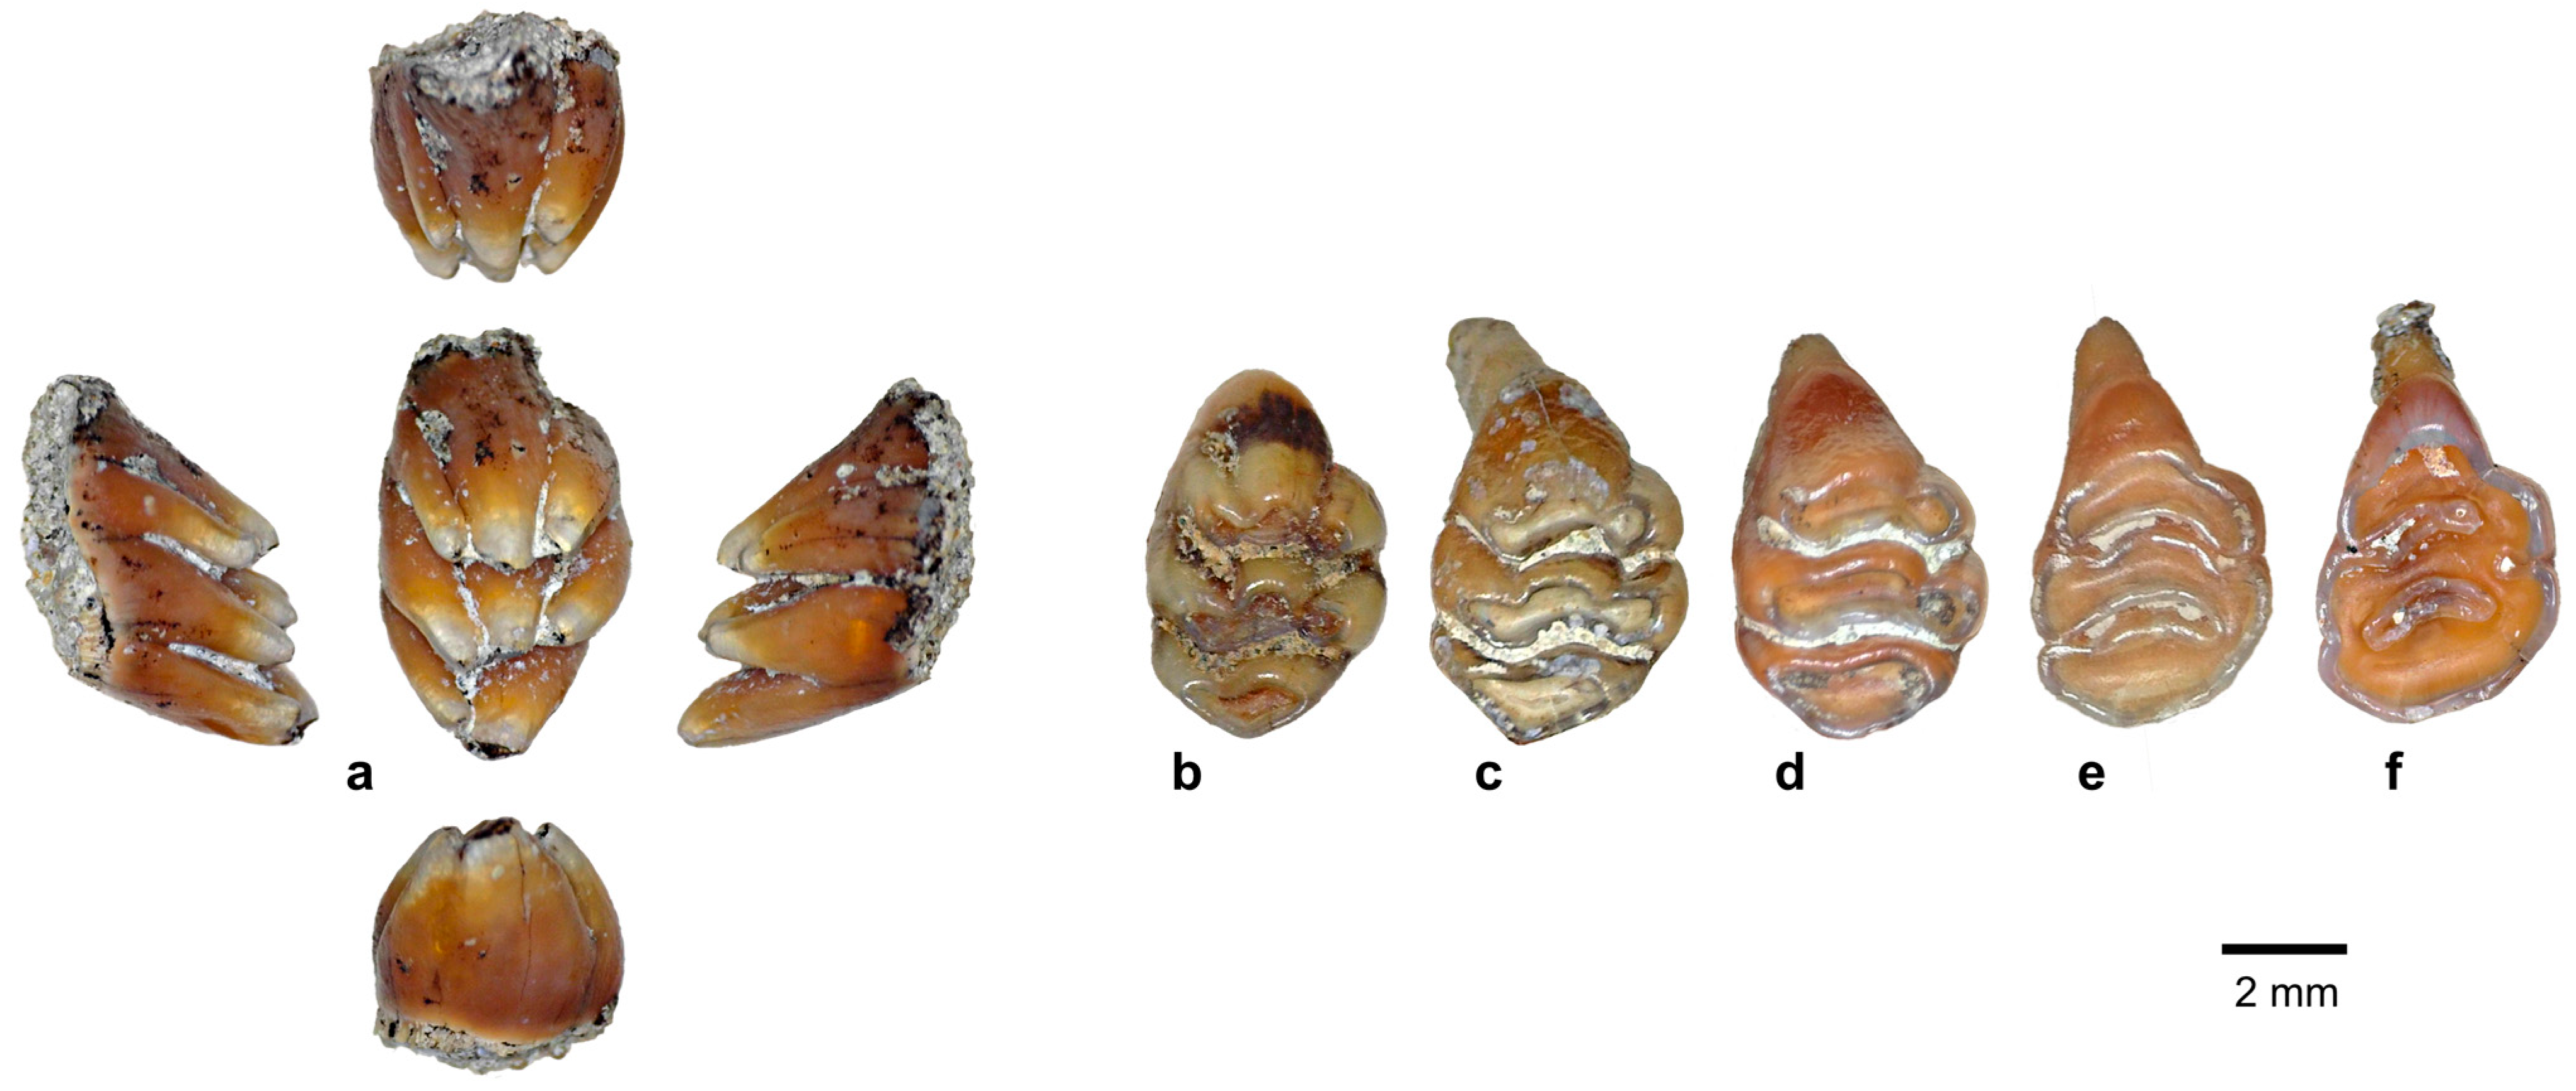
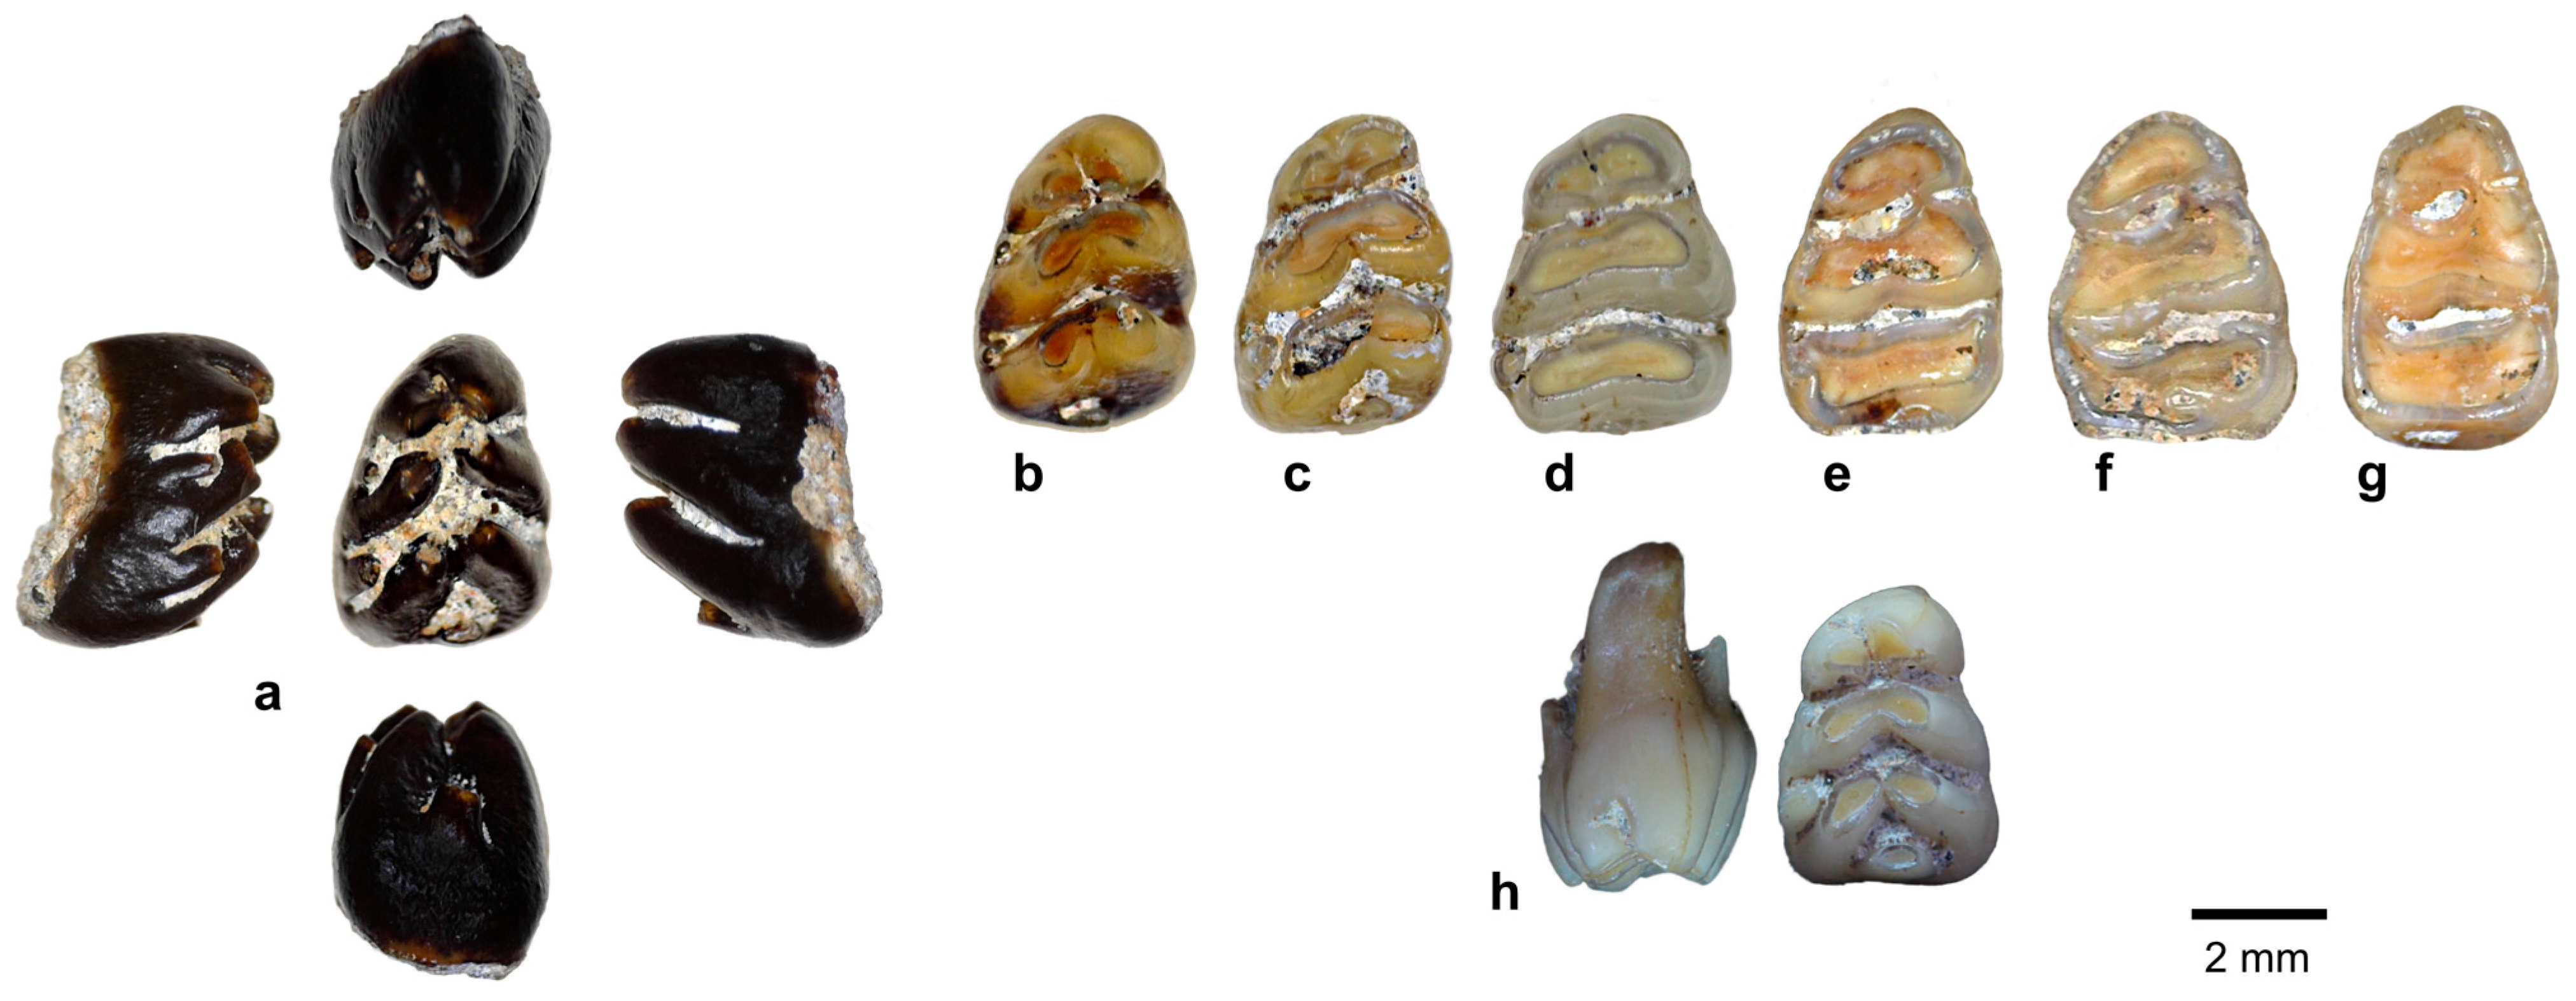
The relatively unworn M1 cusps of the Mata Menge molars (e.g., Figure 9a) have a small occlusal surface, with the cusps bulging out to the base. The lingual cusps (t1, t4, and t8) are larger than the buccal cusps (t3, t6, and t9).
Cusp t2 has a wide base and is the largest cusp. Investigation of the lingual and buccal images of the preserved molar rows using the graphics program Affinity Photo 2 shows that the t2 is angled ~45° from the occlusal surface. Cusp t1 is angled medially and remains distinct until after appreciable wear (Figure 8b–d). Cusps t1–3 are also fairly transverse until WS4, after which the orientations of cusps t1 and t3 become more evident. With increased wear, cusps t1–3 no longer form a transverse lamina. Instead, the posterior edge of cusp t1 is lower than cusps t2 and t3, and this is the point at which this anterior lamina merges with the lamina formed by cusps t4–6.
In relatively unworn molars, the M1 cusp t4 is angled medially with a squarish occlusal surface, while the thinner and longer cusp, t6, is orientated more posteriorly and with a more oval occlusal surface. After increased wear, cusps t4 and t6 are transverse, with the more anteriorly positioned cusp t5 contributing to the arcuate shape of the anterior and posterior edges when these cusps form a lamina. As with the anterior lamina, it is the postero-lingual edge of this central lamina that merges with the posterior lamina formed by cusps t8–9.
Cusp t8 is considerably larger than cusp t9. Cusp t9 has a medial orientation, is shorter in length than cusp t8, and is only discrete in unworn molars. The posterior lamina formed by the merging of cusps t8–9 constitutes a distinct angle. These cusps form the interlocking structure that overlays the M2, which begins to wear away shortly after the M1 has formed three laminae (i.e., WS3).
Of the 62 M1 molars examined for morphological characteristics, 21 are well-preserved and have clear cusps t8–9. For 14 of these (i.e., 67%), there is a thickening on the lingual edge that forms a narrow pipe-shaped structure. Such a structure, which we agree with Aplin and Helgen [10] as constituting a “lingual spur” (p. 51), can be clearly seen in the lingual and occlusal images of the MM-LOW molar row (Figure 8a) and is present, but less distinct, in the lingual and posterior images of the unworn M1 (Figure 9a). This characteristic is not, therefore, confined to a particular Mata Menge interval. However, because this spur appears to be a lateral extension of the t8 with increased levels of wear, it becomes indistinguishable from the lingual wall of the posterior lamina, such as with the examples of M1 advanced wear patterns in Figure 9d–f.

5.1.2. M2 Morphology

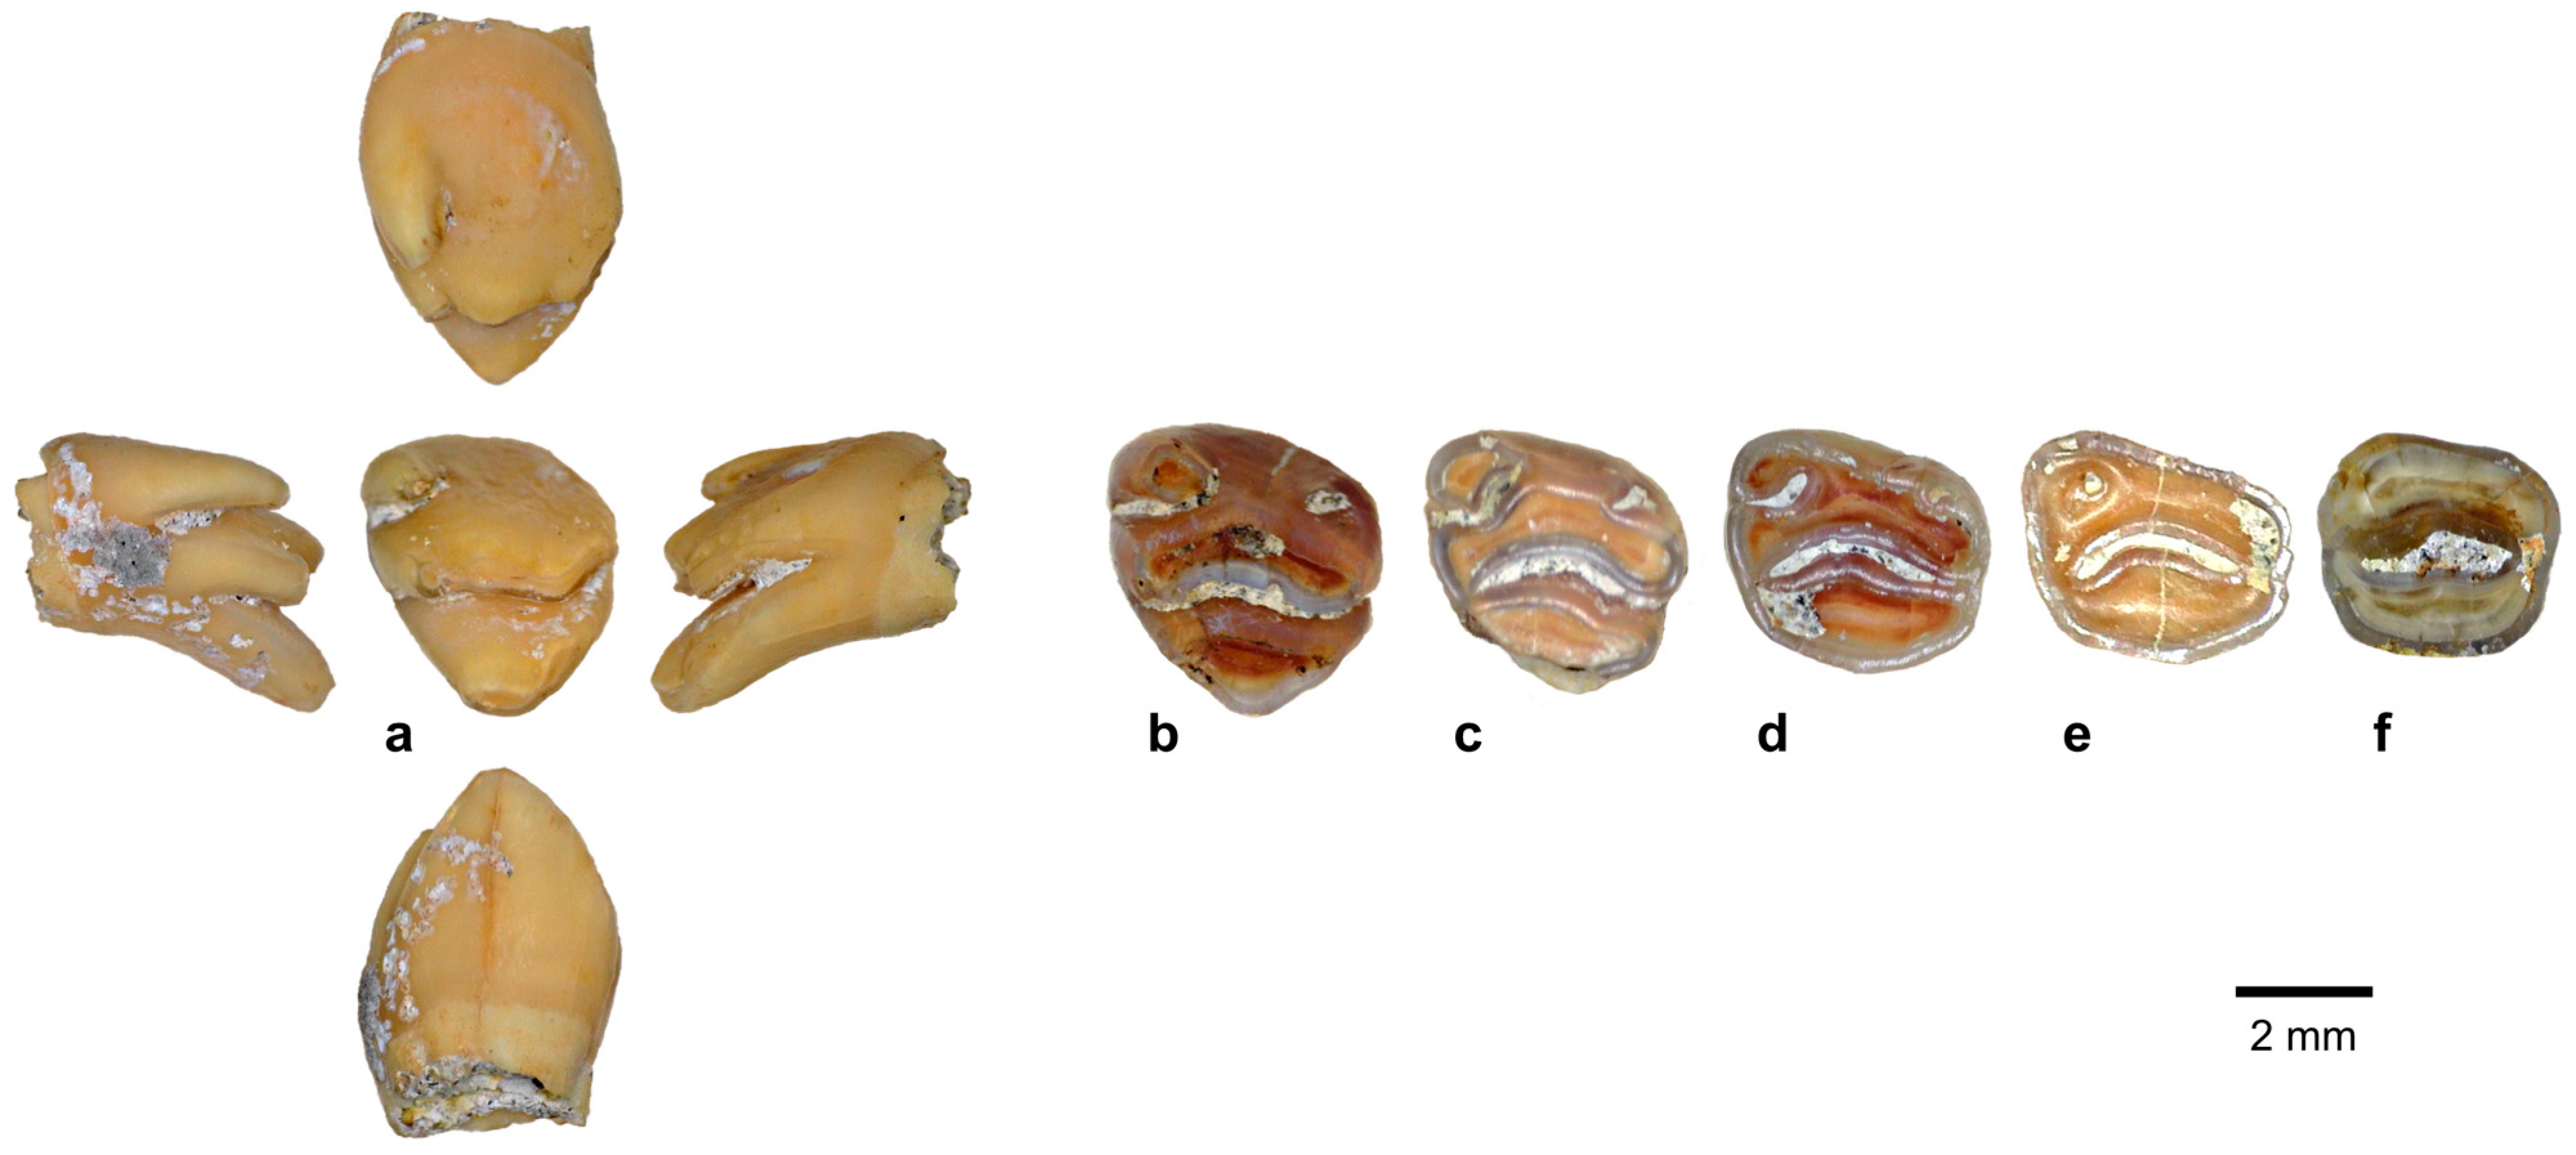
Of the isolated M2 molars recovered from MM-UP, 10 are relatively unworn (WS1; e.g., Figure 10a). These molars indicate that, prior to being modified by wear, cusp t1 is distinct, cylindrical, and bends medially. Cusp t1 is also approximately ¾ the height of the central cusp, t5, and has a small circular wear surface bulging out to a wider base. Cusp t1 remains fairly discrete until late adulthood (WS3–4), after which it merges medially with the lamina formed by cusps t4–t6 (refer to Figure 10a–f for the morphological changes with increased wear).
Cusp t3 is present on all of the Mata Menge M2 molars, though reduced. Of the 50 where this could be assessed (45 MM-UP, five MM-LOW), the size is variable. The t3 ranges from very small (n = 13; e.g., the unworn M2 in Figure 10a) to comparatively distinct (n = 7; e.g., the MM-LOW molar depicted in Figure 10c), with most falling in between (n = 30; i.e., 60%). No small t3, however, were observed on the MM-LOW M2 molars.
The relatively unworn molars indicate t4 is initially a separate cylindrical cusp that bends medially and has a vertical oval occlusal surface. Because the lingual edge of the cusp is less rounded, this can produce an angular appearance with increased wear. Cusp t6, which adjoins the central cusp t5, is smaller, has a more circular occlusal surface than t4, and is on a similar occlusal plane as cusp t4. The central cusp t5 is broad, and up to early adulthood (WS3), the posterior edge is slightly concave while the anterior edge is rounded. These characteristics contribute to the formation of a slightly arcuate anterior of an otherwise transverse lamina.
Cusp t9 is visible in the unworn M2 molars and has an oval wear surface. Although cusp t9 abuts cusp t8, it is slightly shorter in length. Cusp t8 is broad, with a narrow elliptical wear surface that becomes slightly more worn along the anterior edge. This cusp protrudes past the wear surface of cusp t5 and projects downwards to overlap with the M3 enamel surface between t1 and t3 (refer to Figure 8a,b). Evidence of cusp t8 interlocking with the M3 is discernible until ~WS4 but is prone to being recovered chipped along the posterior edge.
As indicated in Table 6, a relatively clear lingual spur is present on four of the less worn (WS1–2) M2. This includes an isolated molar from MM-LOW and three from MM-UP (refer to the MM-UP molar row illustrated in Figure 8b). This characteristic, however, appears absent for the remaining 17 M2 molars.

5.1.3. M3 Morphology

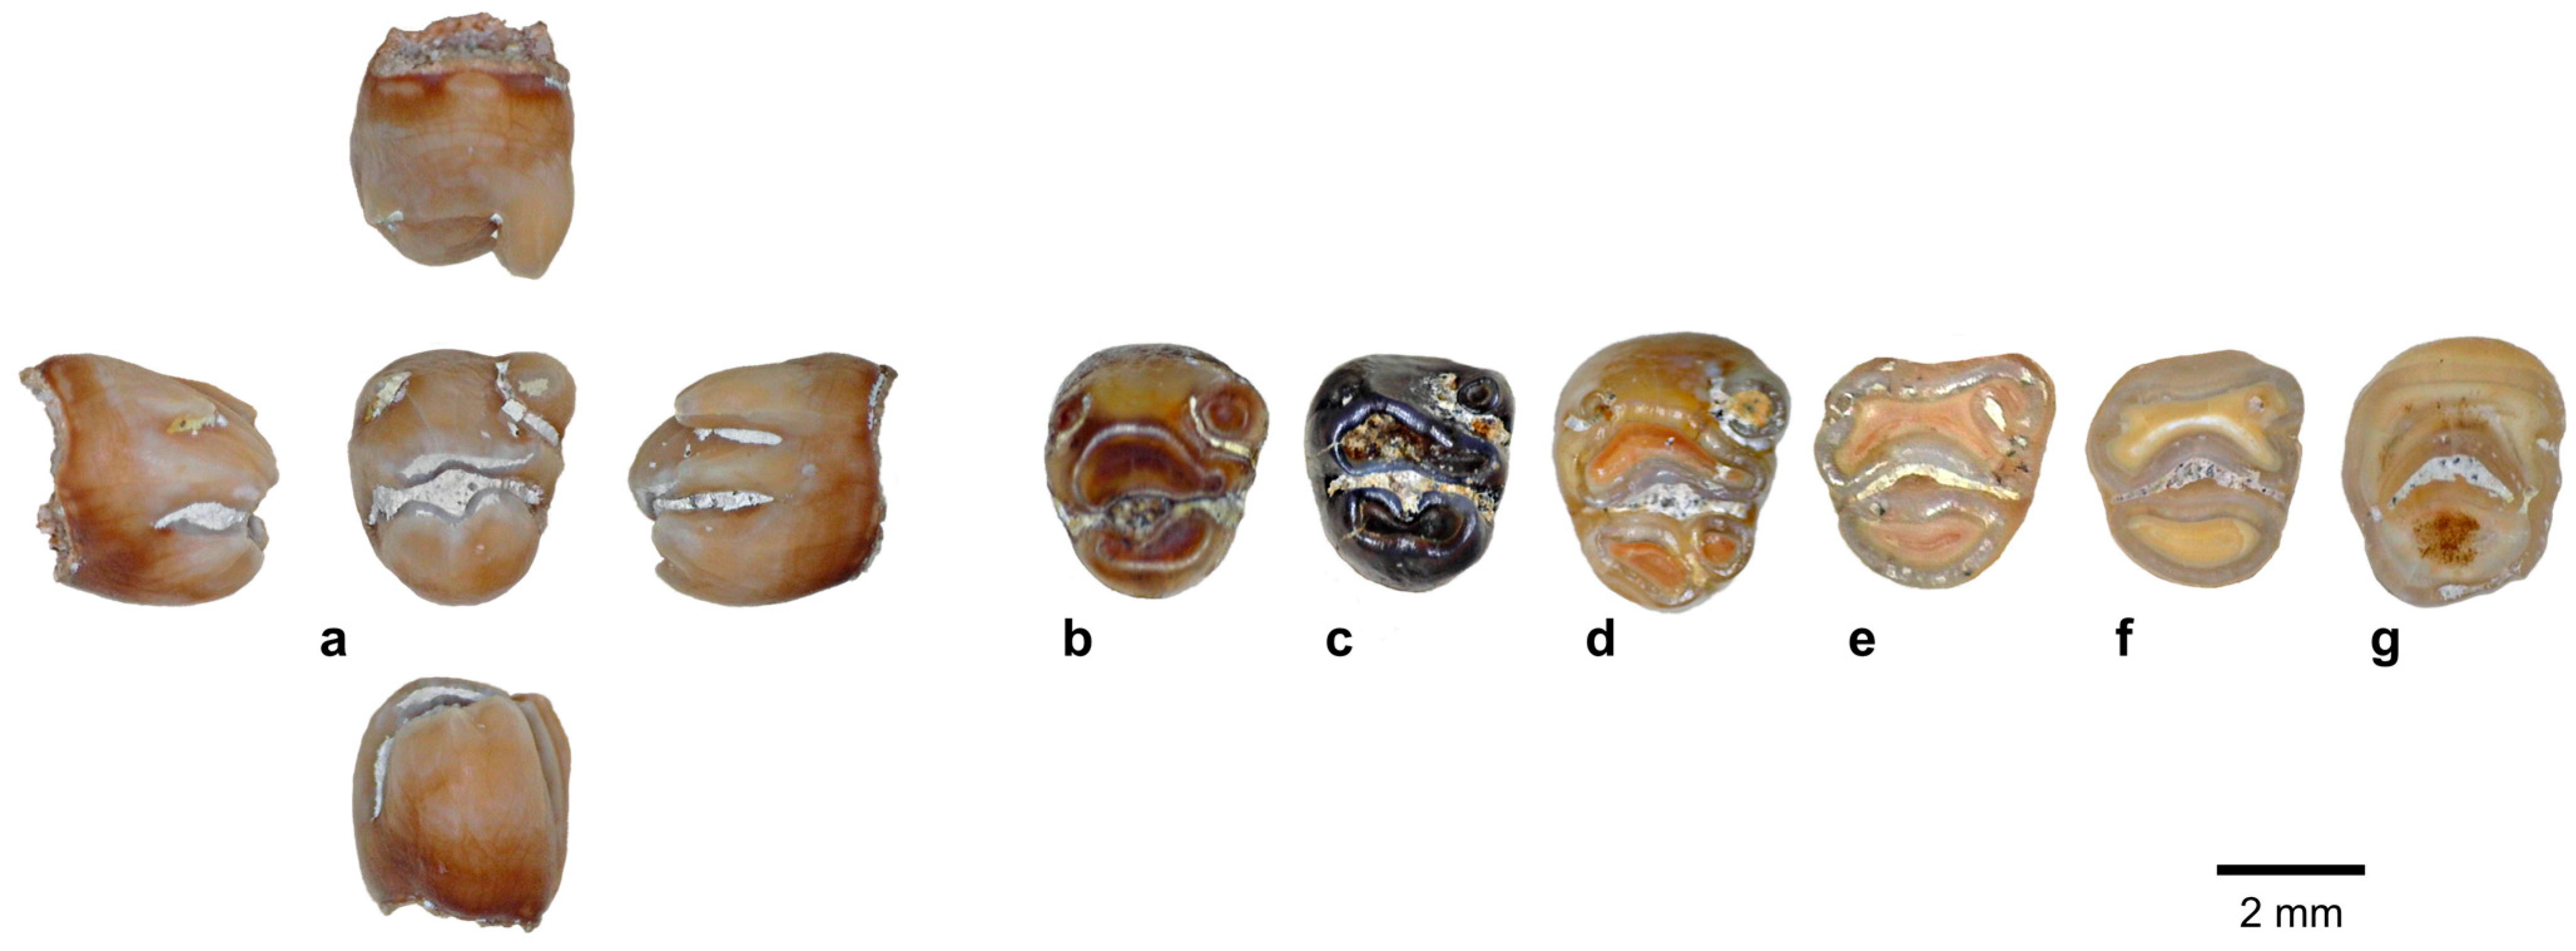
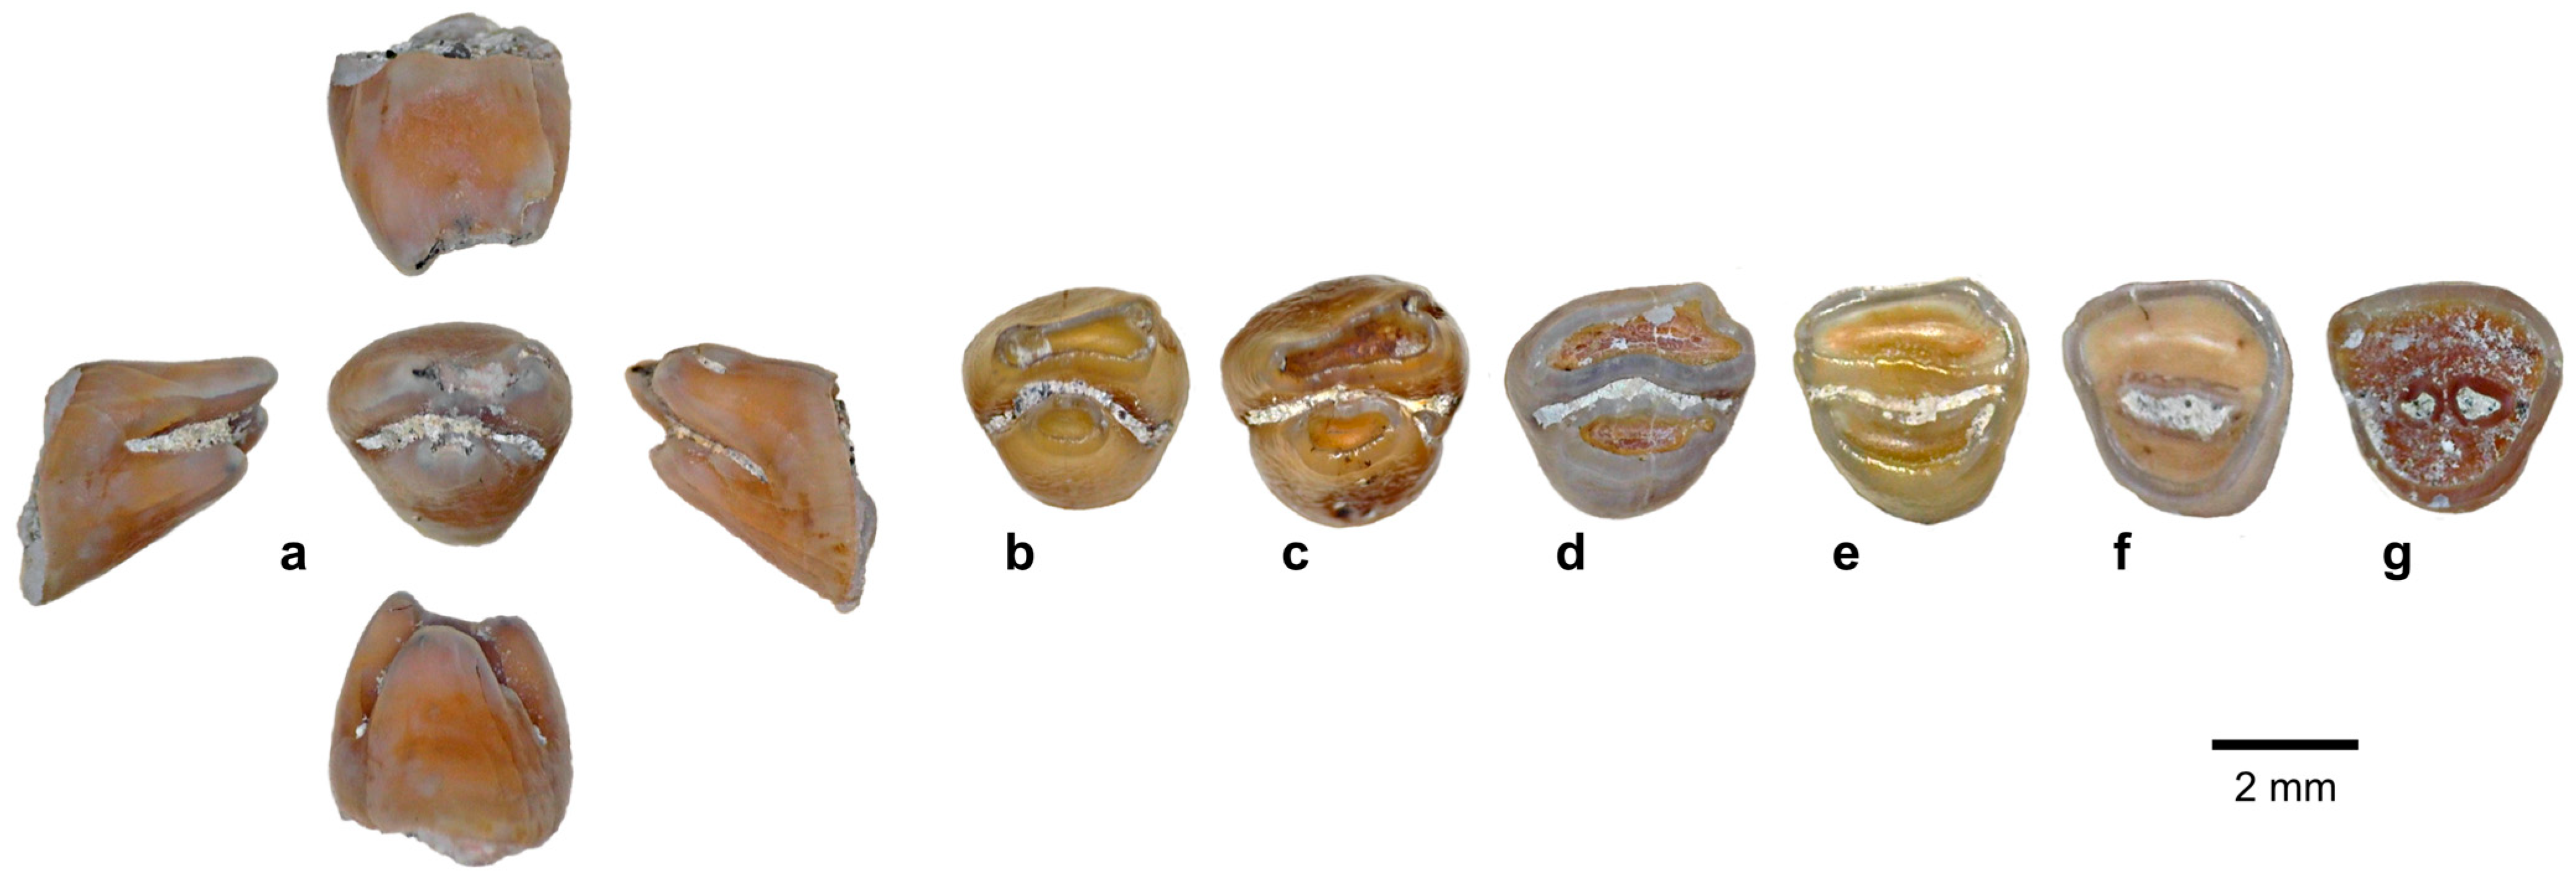
In the unworn M3 (e.g., Figure 11a), cusp t1 is distinct, mostly circular in cross-section, bends slightly medially, and varies in size. This cusp remains discrete until late adulthood (WS3–4; refer to Figure 11c–f).
All of the M3 where this could be observed have a cusp t3 (36 of the 57 molars: 33 from MM-UP and three from MM-LOW). The size of this cusp is variable, but not as variable as the M2 cusp t3. Approximately half (52%) display a relatively small cusp t3, while for the remainder (48%) the t3 appears to be larger. One of the small t3 is from the lower interval (see Figure 11c), which also displays relatively small t1. However, two of the MM-LOW molars have a larger t3 and a similar-sized t1 as the MM-UP molars, and therefore the size of the t3 is not related to a Mata Menge interval.
The relatively unworn M3 cusp t4 is small, slightly cylindrical, and angled anteriorly and medially, and, in the unworn molars, has already formed a lamina with cusps t5 and t6. The t4 cusp, however, retains a clearly distinct occlusal outline into WS3. Cusps t5 and t6 have also merged in the unworn molars. Cusp t6 is wider disto-medially than cusp t4, appears to have a more oval wear surface, and is angled posteriorly and slightly medially. Cusp t5 is initially a broad, narrow oval, but with wear appears more rounded and contributes to the arcuate shape of the anterior edge of the lamina.
The posterior M3 cusps (t8–9) are initially distinct and are narrower in overall width than the lamina formed by cusps t4–6. Cusp t9 is narrower than cusp t8, and it is angled anteriorly and medially. Cusp t9 forms a more rounded occlusal surface and sits lower than cusp t8. With wear these cusps may initially form a relatively transverse ellipsis, but most take on a ‘v’-shaped lamina, with cusp t8 generally being larger and more rounded. Exceptions are an isolated M3 from MM-LOW with cusps t8 and t9 of a similar size (Figure 11c) and an isolated M3 from MM-UP where the two cusps are discrete at WS3 and cusp t9 is larger (Figure 11d).

5.2. Mata Menge Mandibular Molar Morphology

The mandibular molars recovered from both intervals slant anteriorly, and a posterior cingulum is present on all of the m1 and m2 where this characteristic could be observed. The Mata Menge lower molar morphology is relatively complex, with most having clear evidence of numerous accessory cusplets. Overall, the MM-LOW m1 molars tend to have a greater frequency of accessory cusplets than those recovered from MM-UP. The frequencies of the characteristics of interest are given in Table 6.
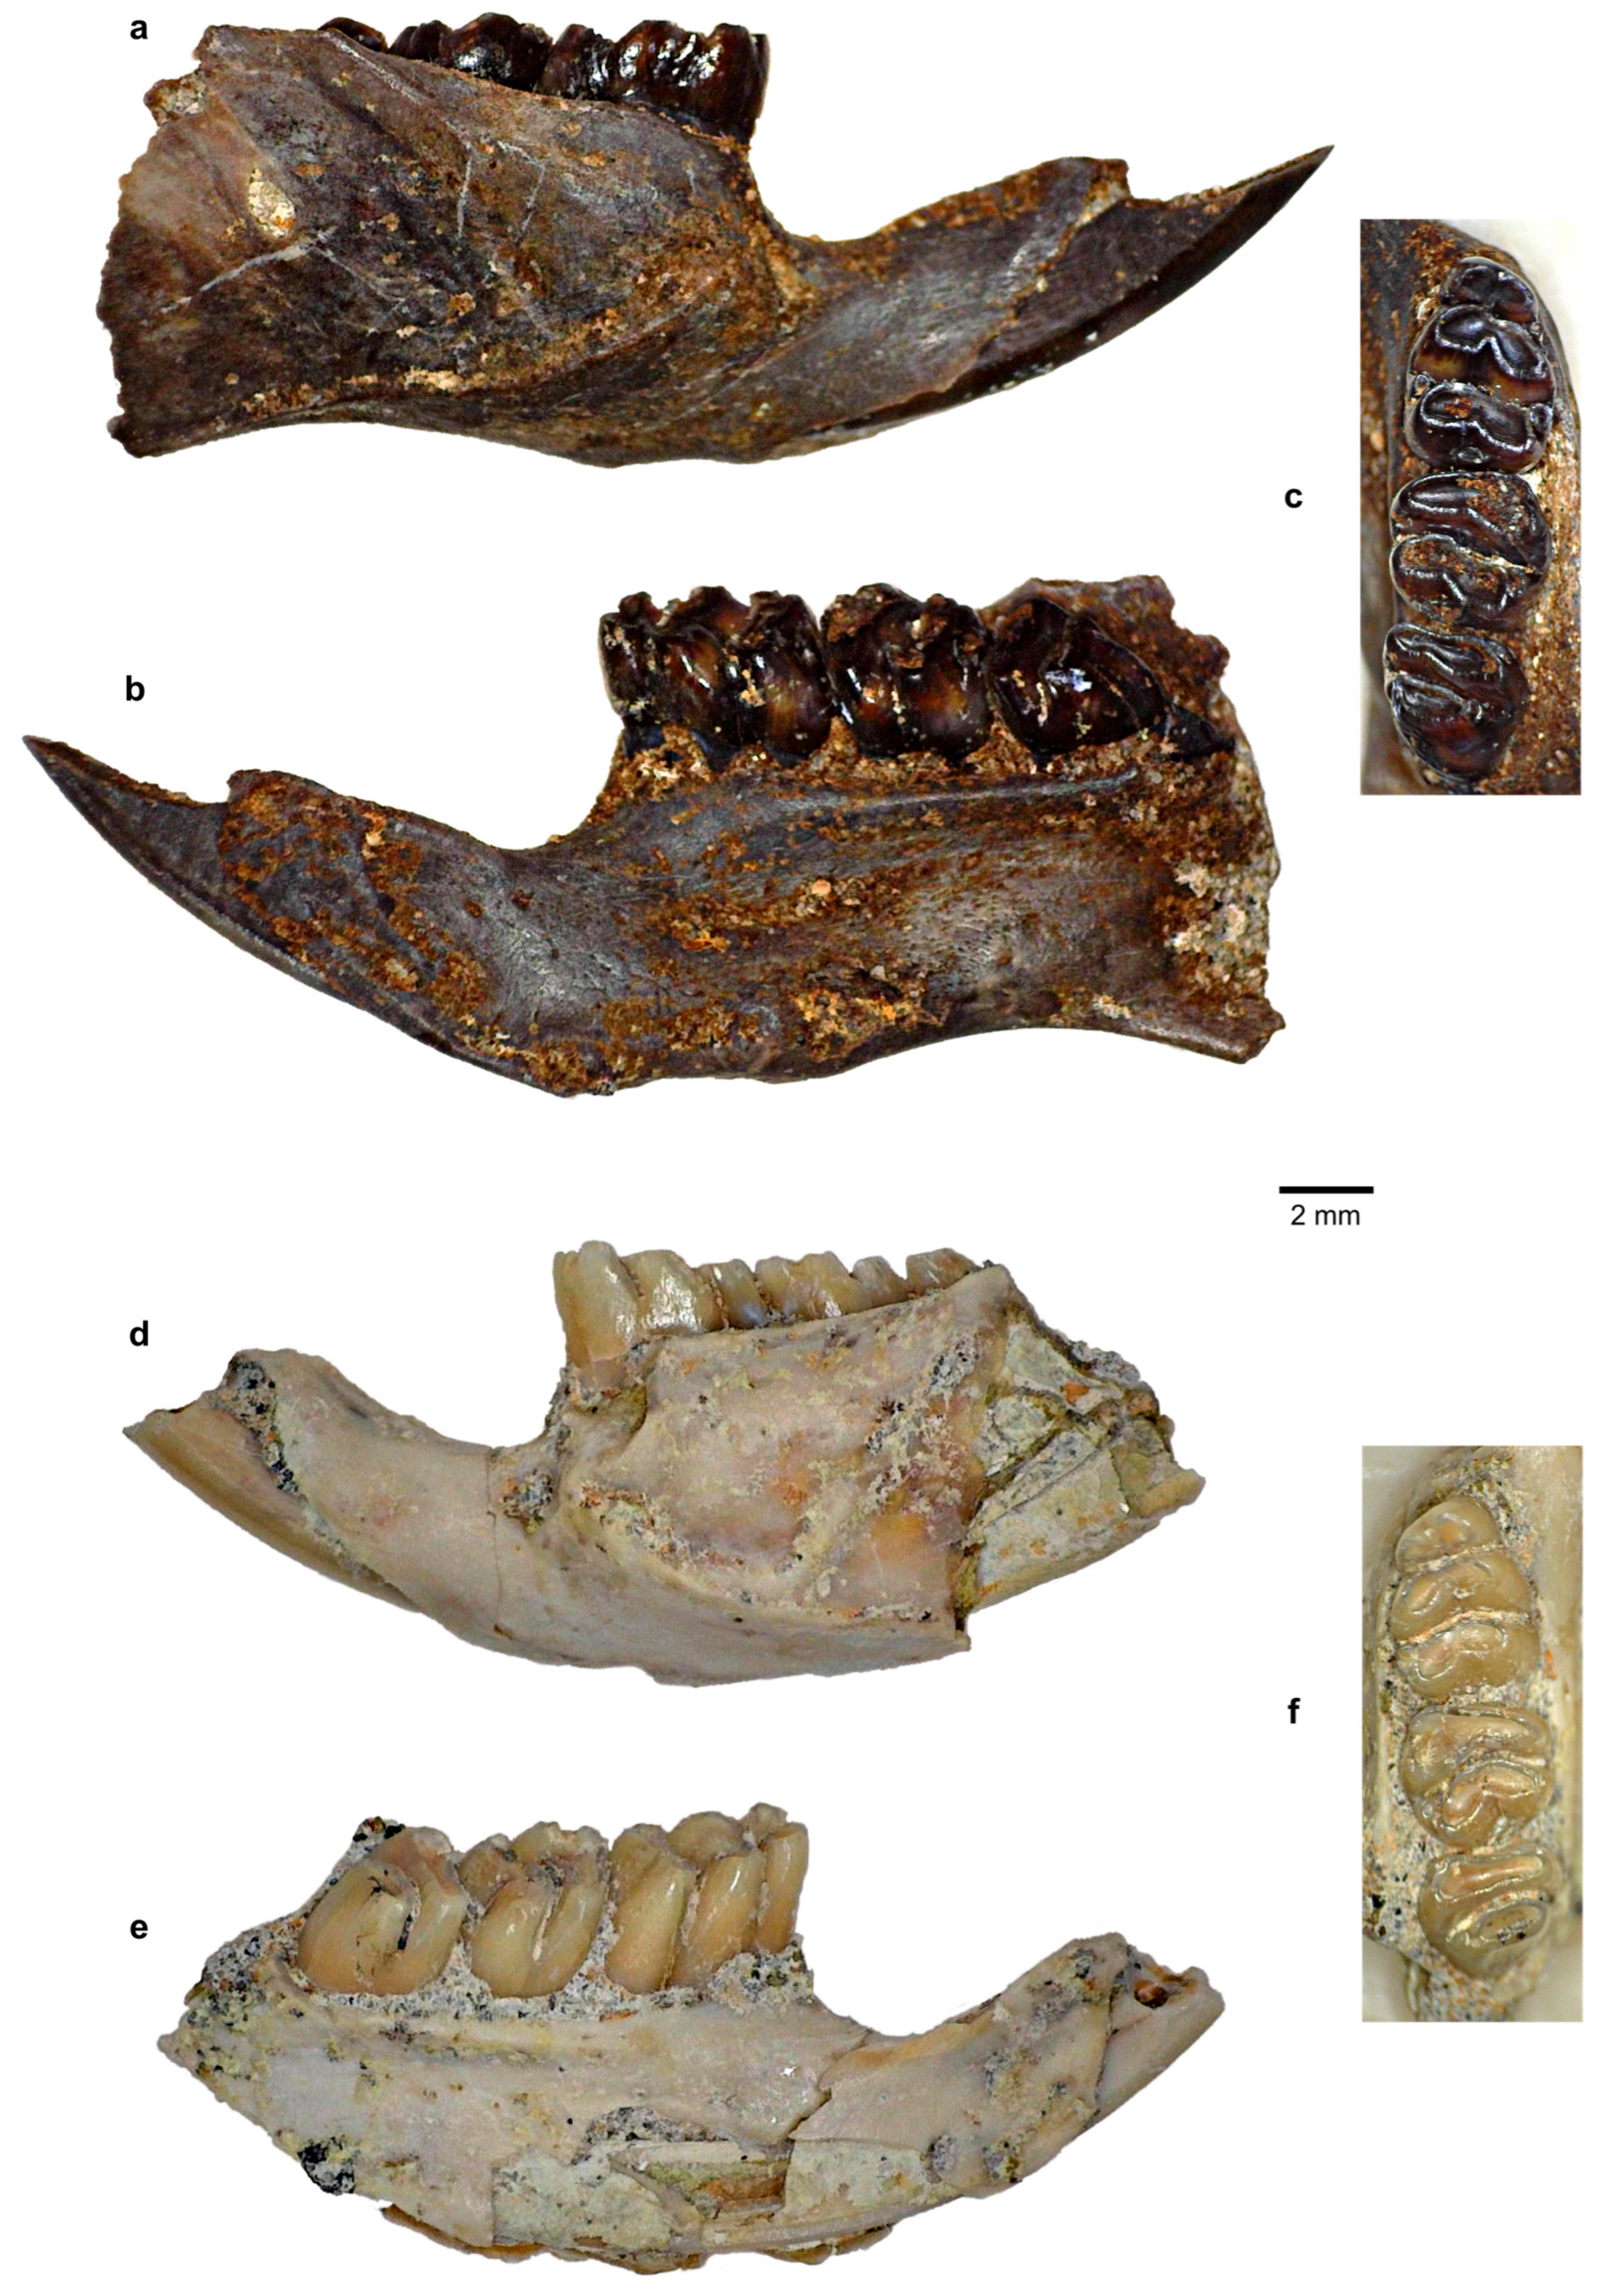
No complete mandible has been recovered from either interval, and the MM-UP fossils are more fragmentary with regard to the extent of preserved bone. For 13 of the 28 MM-LOW specimens, the fossilisation process has resulted in a marked darkening of the bone and enamel, with this occurring in the excavation trenches 24, 27, and predominantly, though not exclusively, 27B.
The dentaries illustrated in Figure 12 have the same estimated wear stage (WS2, corresponding to a young adult). The specimen depicted in Figure 12a–c is from MM-LOW, while the specimen depicted in Figure 12d–f is from MM-UP. Although the MM-LOW molars tend to be significantly smaller than those recovered from MM-UP, this is not a consistent pattern, and in this particular instance the MM-UP mandibular molar row is ~5% shorter in alveolar length than the MM-LOW.

5.2.1. m1 Morphology

Well-preserved, isolated m1 molars displaying minimal wear have been recovered from both Mata Menge intervals: two from MM-LOW and two from MM-UP. As illustrated in Figure 13a, the m1 cusps are initially angled towards the central longitudinal axis of the molar, and each of the lingual cusps is positioned more anteriorly than the corresponding buccal cusps.
The m1 antero-lingual cusp is both more rounded and larger than the antero-buccal. The antero-buccal cusp is a relatively narrow oval in cross section, though it becomes more rounded with wear. These cusps initially join at their medial posterior edges, forming a heart-shaped lamina that becomes more transverse with wear. The remaining pairs of cusps (protoconid and metaconid; hypoconid and entoconid) form asymmetrical chevrons that, with wear, also form transverse laminae. Wear stages are illustrated in Figure 13a–g.
A low, but distinct, posterior cingulum was able to be observed on 50 of the 75 m1 molars examined for morphological characteristics. For 15 of the remaining 25 molars, the posterior cingulum is obscured. The remainder display advanced wear (n = 10), with the posterior cingulum beginning to merge with the cusp t8 posterior wall at WS4. Where the posterior cingulum is distinct and visible, the scaled images indicate that the relative size varies. These were visually estimated to comprise 20 relatively small, 22 medium, and 8 relatively large. The medium and relatively large cingula occur with equal frequency in both intervals, but only two of the 20 MM-LOW molars had evidence of a relatively small posterior cingulum.
All of the 69 m1 molars that were able to be assessed (i.e., not excessively worn or obscured) have evidence of a postero-buccal cusplet. For four of the MM-LOW molars, a posterior cusplet occurs bilaterally (i.e., there is a corresponding posterior labial cusplet), and this includes both the molar row illustrated in Figure 12c and the isolated molar in Figure 13e. With wear, these cusplets merge with the lateral, anterior edges of the posterior (third) lamina and form distinct ‘ears’. These ‘ears’ are initially rounded, becoming more pointed with wear.
An antero-buccal cusplet was found to be present on 21 of the m1 molars, all of which also have a postero-buccal cusplet. Both buccal cusplets can be clearly seen in the buccal view of the unworn MM-LOW molar in Figure 12a. Molars that lack an antero-buccal cusplet are more frequent for the MM-UP molars (68%), whereas all except one of the MM-LOW molars have this cusplet. As with the postero-buccal cusplet, the antero-buccal forms a rounded-pointed ‘ear’ when merging with the anterior buccal edge of the central (second) lamina (e.g., Figure 13f–g).
Although none of the Mata Menge m1 molars have clear evidence of an antero-central cusp, 23% (four molar rows from MM-LOW; seven isolated molars from MM-UP) of the 47 less worn observed molars have a small platform located between the antero-lingual and antero-buccal cusps. This is most clearly evident in the anterior and occlusal views of an isolated m1 from MM-UP, which is depicted in Figure 13h. A small platform is also evident, though on a smaller scale, in the isolated MM-UP m1 depicted in Figure 13b.

5.2.2. m2 Morphology

Each Mata Menge interval recovered two relatively unworn (WS1) m2 molars. These molars show that the anterior cusps are merged medially at the outset. They comprise a rounded metaconid with an anterior edge that is located more anteriorly than the protoconid. The protoconid is equally wide but thinner and slopes postero-lingually at an angle of approximately 45°. The posterior cusps (hypoconid and entoconid) are of a similar size, initially discrete, and meet antero-medially to form a chevron.
An antero-buccal cusplet was able to be observed on the m2 molars estimated to be WS1–3. This is initially an elliptical ridge terminating before the occlusal height of the protoconid (e.g., the MM-LOW molar row depicted in Figure 12c). This cusplet, which varies in size, begins to merge with the metaconid in early adulthood (WS2), becoming fully merged by late adulthood (WS3–4), where it accentuates the anterior angle of the anterior (first) lamina. One of the MM-UP m2 molars (MM2014-T32E-F337) is recorded as indeterminate due to dissolution pitting but has either a minute or no antero-buccal cusplet (Figure 14c).
A postero-buccal cusplet is present on all but one of the m2s where this characteristic is observable. This cusplet typically begins to merge with the antero-buccal rim of the posterior (second) lamina later than the antero-buccal cusplet. At this stage it initially forms an ‘ear’, and for most only becomes fully merged after advanced wear (WS5).
A posterior cingulum is observable on 65 of the m2s. This is obscured for 11, and for 13, it is likely that the posterior cingulum is fully merged with the posterior lamina. As with the accessory cusplets, the size varies within both intervals. For most of the m2, this characteristic is distinct until WS4, but for a few, merging has commenced during earlier wear stages.

5.2.3. m3 Morphology

Four relatively unworn m3s were recovered from the MM-UP interval. As illustrated in Figure 15a, the m3 forms two laminae very early in the molar development, and both pairs of cusps are angled medially. There is no posterior cingulum on all of the 65 observed molars. An antero-buccal cusplet is present where this could be observed. This cusplet is initially close to the height of the occlusal surface of the metaconid and merges with the protoconid of the anterior lamina at WS2 (young adult). At the time of merging, the cusplet forms a distinctive hook and contributes to the angulation of the anterior edge of the lamina. This angulation remains evident until advanced stages of wear (refer to Figure 15d–f).
The posterior m3 lamina has a narrower occlusal surface than the anterior lamina, giving a triangular shape to the molar, and this remains characteristic throughout the wear stages. A postero-buccal cusplet is present on most of the molars where this could be observed (i.e., only absent for two). This cusplet is located adjacent to, and slightly anterior to, the posterior lamina and is evident on the molars with minimal wear (e.g., posterior view in Figure 15a). The two molars lacking this morphological characteristic are both from MM-UP (e.g., Figure 15b,c). With wear the cusplet forms a rounded ‘ear’ that becomes increasingly angular.

5.3. Mata Menge Molar Roots

Only a limited number of isolated molars were recovered with the roots preserved, and of these, very few are sufficiently free of sediment and/or fragments of fossilised bone to identify the morphological character and number.
M1: n = 6 (2 MM-LOW). All of the M1 appear to have five roots. The clearest example is from MM-UP (Figure 16), which has a large, long anterior root, a small broken buccal, a wide broken postero-buccal root, and two broken lingual roots.
M2: n = 6 (3 MM-LOW). All of the MM-LOW and one of the MM-UP molars appear to have 4 roots: two anterior and two posterior. One M2 from MM-UP (depicted in Figure 16) has a broken postero-lingual root that appears to be a fusion of two roots.
M3: n = 10 (2 MM-LOW). The two MM-LOW molars have three roots: two anterior and a large posterior. The MM-UP molars are much more varied, having 4 or more roots and no particular pattern as to whether this includes an additional lingual root, a divided anterior root, a divided posterior root, or all of the foregoing plus a small nubbin between the anterior roots, as is the case with the unusually well-preserved M3 molar illustrated in Figure 16.
m1: n = 11 (1 MM-LOW). All appear to have four long roots: a large anterior, a large posterior, a small buccal, and a larger lingual, as is illustrated in Figure 16.
m2: n = 11 (2 MM-LOW). The m2 molars recovered from both intervals have three roots: two anterior and a large posterior. The MM-UP m2 illustrated in Figure 16 indicates that the posterior can appear to be comprised of two fused roots.
m3: n = 5. None of the MM-LOW m3 molars are sufficiently well preserved to discern the number of roots. Most of the MM-UP molars are recorded as having three: two anterior and a large posterior root. This may be variable, however. As is illustrated in Figure 16, the m3 has an extra, though small, anterior root.

5.4. Mata Menge Diet

Five of the Mata Menge maxillary molar rows (2 from MM-LOW, 3 from MM-UP) and five of the mandibular rows (2 MM-LOW, 3 MM-UP) lack evidence of fluvial transport. All have longitudinal striations on the enamel that follow the standard murine plan of propalinal mastication (e.g., [37]). These striations are clearly evident at 40× magnification as fine parallel scratches, which are associated with a grass-dominated dietary class [48], allowing that modifications to the enamel only relate to a murine’s diet during the period prior to its death. Although a microwear analysis has yet to be undertaken with the Mata Menge murines, Puspaningrum [49] has conducted stable isotope analyses of isolated incisors, two from MM-LOW and five from MM-UP. The results of this study are that the murines from both intervals had a diet dominated by C4, meaning they were predominantly ingesting grasses.

6. Results: Comparisons of the Papagomys group with the Mata Menge Large Murines

Given the unreliability of the Liang Bua murine analyses prior to 2018 and the absence of measurements from the studies conducted after the Liang Bua stratigraphy was revised, the comparative metric data describing the large-bodied Papagomys group are sourced from Musser [14] and Hooijer [16]. The raw values collated from these publications for the recent Papagomys armandvillei, together with the mandibular values for the Liang Toge P. theodorverhoeveni and P. armandvillei, are provided in Supplementary Table S3, and an explanation regarding the sources for this comparative data is in the Supplementary Materials notes. Statistical summaries that were able to be calculated from this data are in Table 7 (maxillary) and Table 8 (mandibular). Because of the limited number of specimens, these tables include the individual values of the two Liang Toge maxillary rows Musser assigned to Papagomys armandvillei and the Hooijeromys nusatenggara specimens.
As is evident, neither Musser [14] nor Hooijer [16] were consistent or comprehensive regarding the data provided; molar row alveolar and mandibular diastema lengths were not measured, and the molar length data is very limited. We therefore restrict our metric comparisons to the crown lengths of the molar rows, molar widths, within-row molar width proportions, transverse incisor widths, and palate width at the M1.

6.1. Metric Comparisons of the Papagomys group with the Mata Menge Large Murines

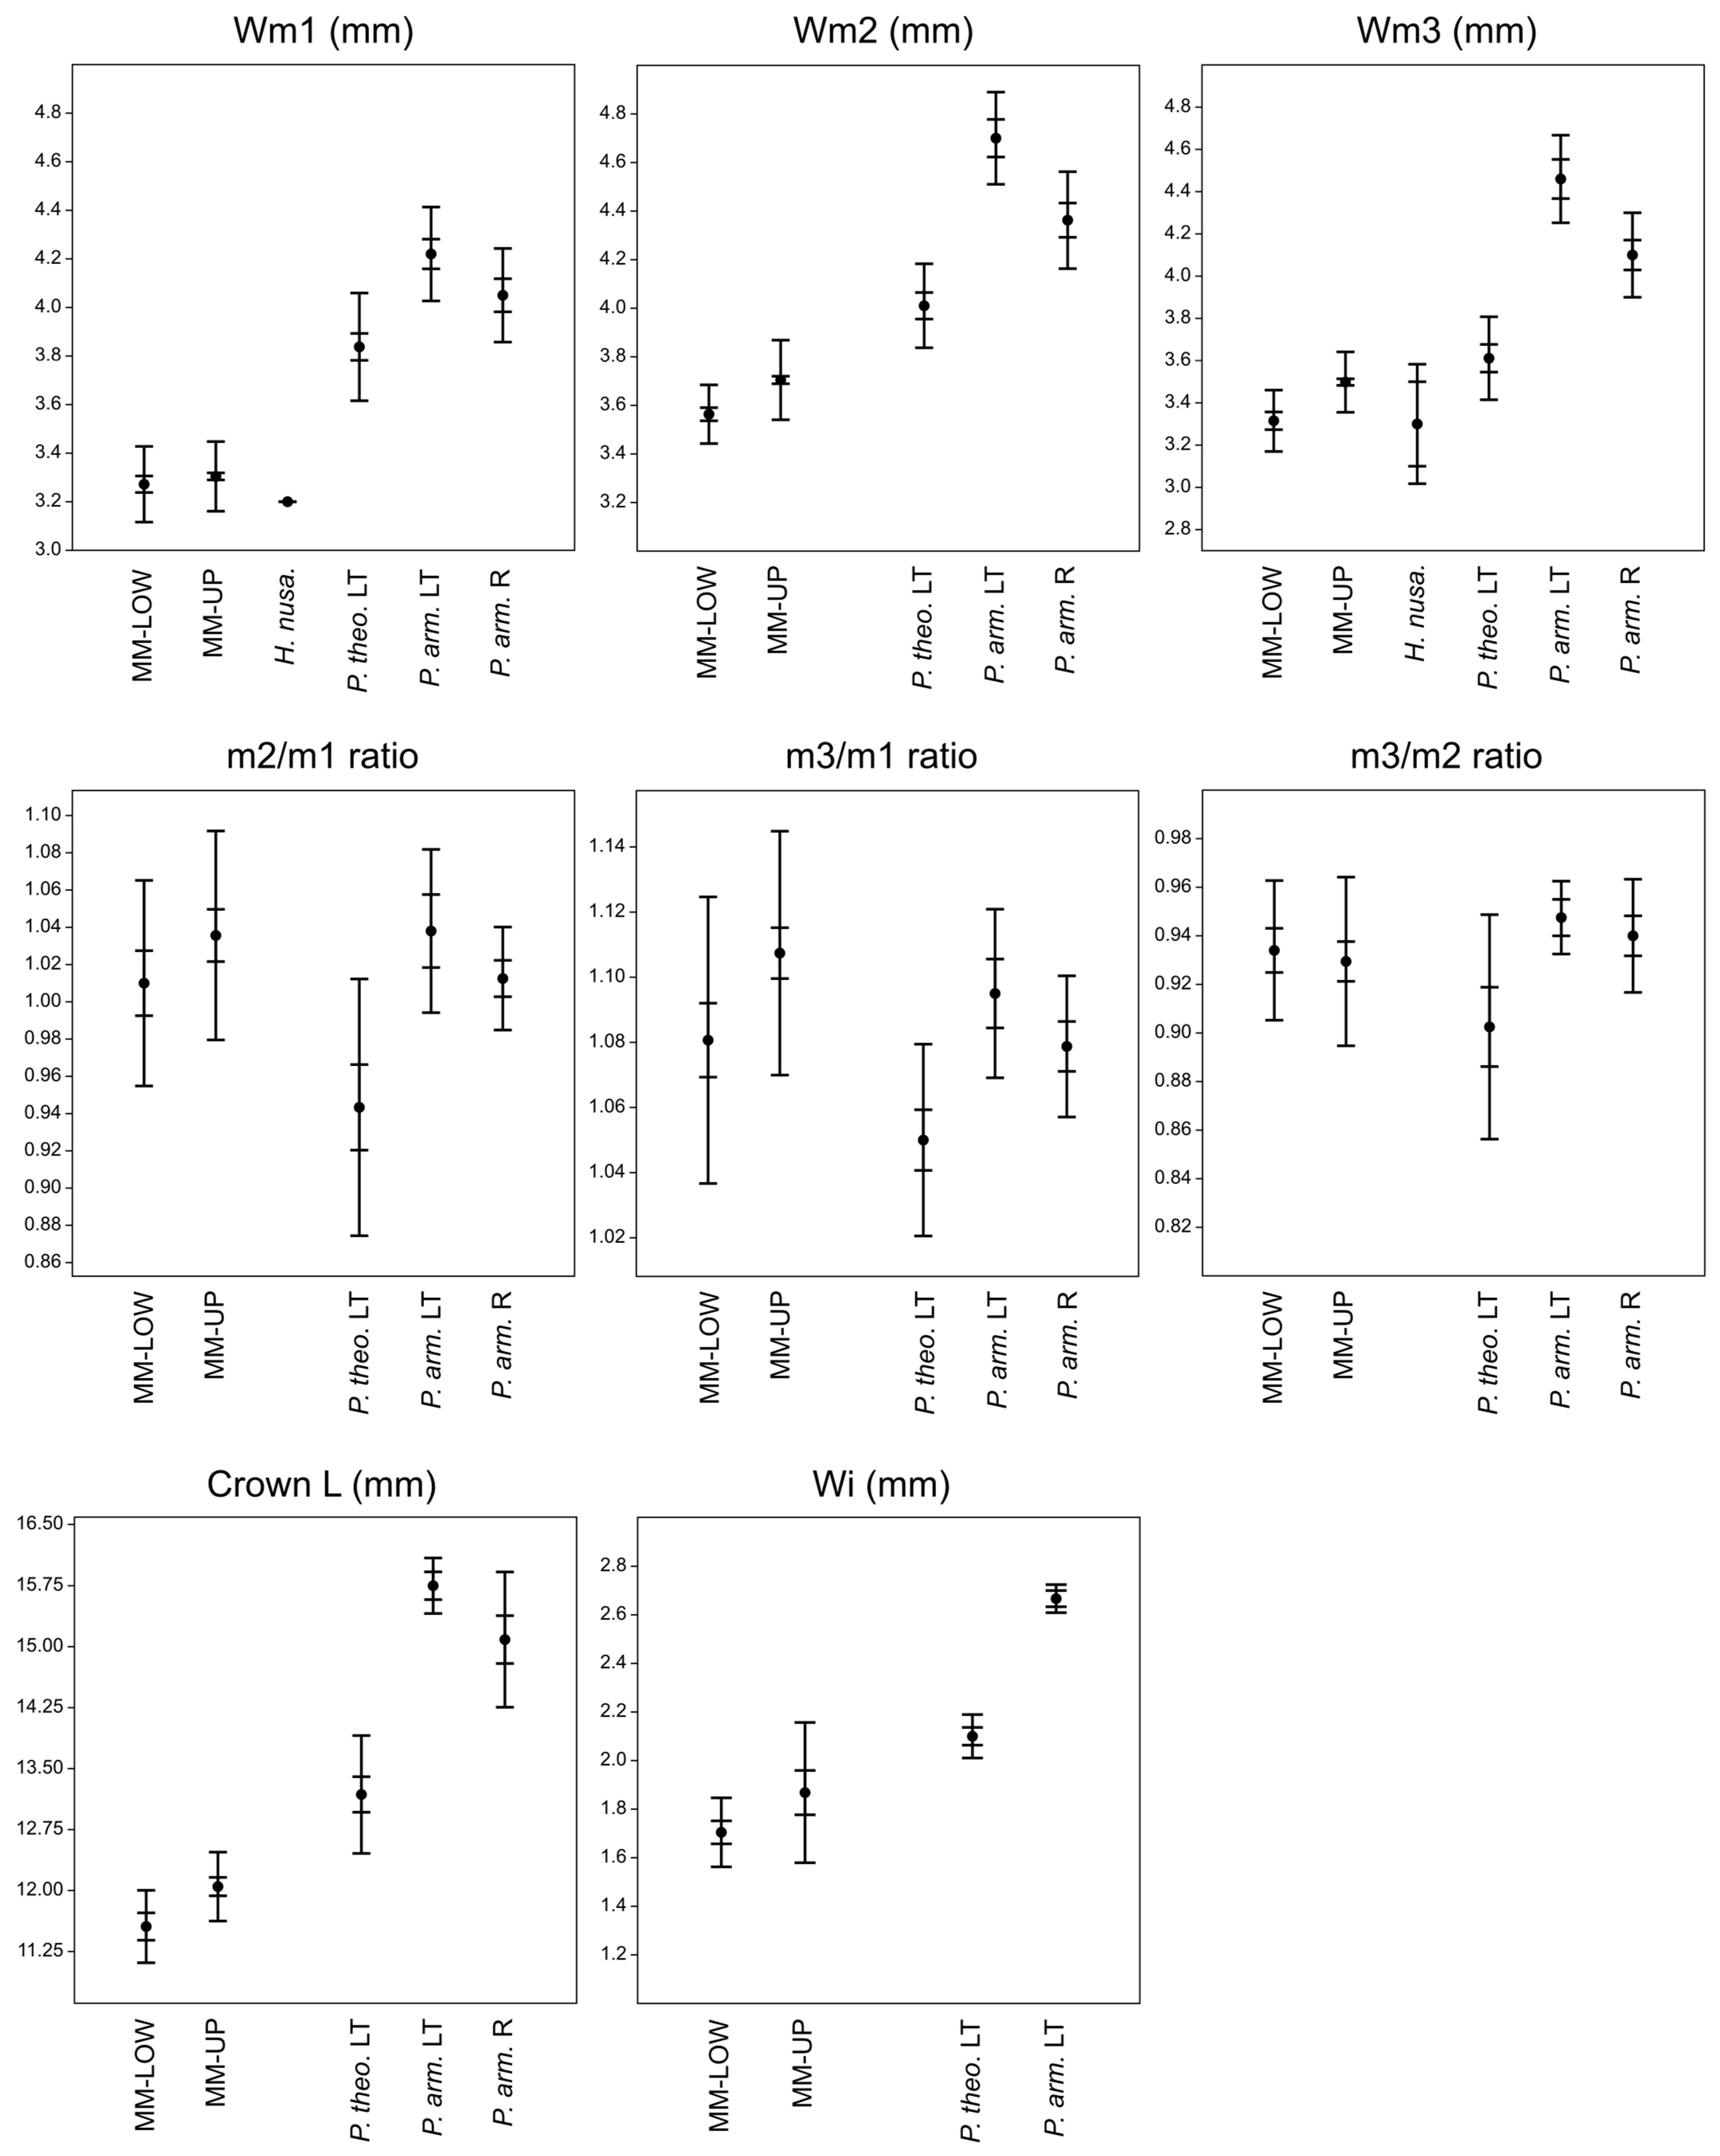
Calculations of the variability (V’) for the Papagomys group murines, both individually and in combination with the Mata Menge fossils, are in Table 9, and the variability of the Mata Menge fossils is in Table 3. Mean and whisker plots illustrating the statistical analyses (Mann–Whitney U) of the comparative metric data are in Figure 17 (maxillary) and Figure 18 (mandibular). The plots differ from the statistical analyses, however, in that the reassigned maxillary row holotype of P. verhoeveni is plotted separately, as are the Liang Toge and Recent P. armandvillei. The relevant statistical data supporting the Mann–Whitney U results is in Table 4 (Mata Menge) and Table 7 and Table 8 (Papagomys group).

6.1.1. Papagomys armandvillei

The variability (V’) of Papagomys armandvillei indicates that while the recent specimens are conspecific, when combined with the Liang Toge P. armandvillei, the M1 widths suggest more than one species. The Liang Toge maxillary material consists of only two specimens: a partial row (M1–M2) that Hooijer [16] identified as P. armandvillei besar, which has the widest M1, and the holotype of Hooijer’s P. verhoeveni that Musser subsequently reassigned as a small P. armandvillei, and which has one of the narrowest M1. The reassigned P. verhoeveni also has a maxillary crown length of 14.1 mm, which is >2 SD smaller than the Recent mean (15.4 mm).
There is more Papagomys armandvillei mandibular than maxillary material from Liang Toge. The V’ of the m2 width is slightly more than 1 SD of conspecific variability, but none are isolated molars, and the m1 and m2 molar widths are within a single species range. In keeping with Hooijer’s [16] original designation of these specimens as besar (large), the Liang Toge specimens’ m2 is significantly wider (U = 3.5, exact p = 0.004, A = 0.92) than the Recent specimens, as is the m3 (U = 13.5, exact p = 0.02, A = 0.91). There is, however, no significant difference (U) between the P. armandvillei Liang Toge and recent molars in either the crown lengths or the m1 widths (p > 0.05). Neither Hooijer [16] nor Musser [14] measured alveolar lengths, but calculation of the associated P. armandvillei maxillary and mandibular crown lengths indicates the maxilla is, on average, 2% longer, ranging from 3% shorter to 10% longer than the mandibular lengths. The mandibular crown lengths from Liang Toge are 9–14% longer than the reassigned P. verhoeveni maxillary row and are therefore unlikely to be associated with what was originally the holotype of P. verhoeveni. This lack of association puts into question Musser’s reassignment of P. verhoeveni to P. armandvillei, though the mean and whisker plots in Figure 16 clearly show that both groups of P. armandvillei are larger than the Mata Menge molars from both intervals.

6.1.2. Papagomys theodorverhoeveni

The Liang Toge Papagomys theodorverhoeveni mandibles have the variability (V’) of a single species. When combined with either just the P. armandvillei from Liang Toge or the Recent and Liang Toge P. armandvillei, the V’ of the m2 and m3 widths clearly indicate more than one species, and the m1 widths are near the 1 SD boundary of conspecific variability. P. theodorverhoeveni is significantly smaller than P. armandvillei (Recent and Liang Toge) for crown length and the m2 and m3 widths (U < 4, p < 0.0001) with a large effect size (A ≤ 0.01). Although the P. theodorverhoeveni m1 width is also narrower than P. armandvillei, the significance is not as strong (U = 47, p < 0.001), and as can be seen in Figure 18, there is a degree of overlap between the two species. All of the Liang Toge P. theodorverhoeveni mandibular rows are shorter in crown length than the reassigned Liang Toge P. verhoeveni maxillary row by, on average, 7%, with two being in the association range of 5%.
Table 9 shows that Papagomys theodorverhoeveni and the MM-LOW specimens are two different species (V’) for all lower molar widths. When P. theodorverhoeveni is analysed with just the MM-UP specimens, it is only the m1 width that indicates the presence of more than one species. Comparing the P. theodorverhoeveni molars to the MM-UP specimens results in the m3 widths being not significantly different (U = 235, p = 0.06, A = 0.31), though MM-UP is significantly smaller, and with a large effect size (A ≤ 0.1) for crown length (U = 19, exact p < 0.001), m1 width (U = 113.5, p = 0.0001), and m2 width (U = 235, p = 0.0001).

6.1.3. Hooijeromys nusatenggara

The Hooijeromys nusatenggara specimens are too few to directly compare, though Figure 17 shows that H. nusatenggara is similar in maxillary crown length and molar widths to the Mata Menge material, and that both the H. nusatenggara and MM-LOW specimens tend to be smaller than, or cluster with, the lower values of MM-UP. The coefficients of variability (V’) clearly show that H. nusatenggara is a different species from both Papagomys and conspecific with the Mata Menge material, both by interval and in combination, and serve to lower most of the Mata Menge variability. This is most evident with the MM-LOW maxillary widths, with the inclusion of H. nusatenggara reducing the variability by 4% (M1), 6% (M2), and 15% (M3), and taking the results closer to the conspecific murine mean.
The mandibular Hooijeromys nusatenggara material is very limited, and Musser [14] only tentatively associated these specimens with H. nusatenggara. Furthermore, Musser considered the Specimen 4 (m1) width to be an estimate given the third lamina is missing. However, as can be seen in Table 9, the partial H. nusatenggara m1 and two m3 widths slightly lower the conspecific variability of the MM-LOW m1 and m3 molars when included in the analyses of variability. We have found that the maximum width of the Mata Menge m1 is consistently in the region of the second lamina. Therefore, given the fit of this specimen with the MM-LOW molar widths, Musser’s estimate is likely to be relatively accurate.

6.1.4. Within-Row Molar Proportions

It is only possible to statistically compare (U) the Mata Menge within-row maxillary width proportions with the Papagomys armandvillei specimens (Recent and Liang Toge). The results are that the M2/M1 proportion is not significantly different, with both species having an M1 that is wider than, or similar to, the width of the M1 (U = 94.5, p > 0.05). However, the Mata Menge molar rows have a significantly narrower M3 in relation to the M1 and M2, and therefore significantly lower proportional relationships (M3/M1: U = 9.5, exact p < 0.001; M3/M2: U = 7.5, p < 0.0001). Despite these differences, the mean and whisker plots of the proportions (Figure 17) indicate that all of the maxillary rows follow the proportional pattern of M1 ≥ M2 > M3, with the H. nusatenggara maxillary rows being most similar to the Mata Menge specimen ratios. The reassigned P. verhoeveni maxillary row has lower M3/M1 and M3/M2 proportional relationships than the Recent P. armandvillei.
The mandibular molar rows allow statistical comparisons between the within-row proportions of Papagomys armandvillei (Recent and Liang Toge), P. theodorverhoeveni, and the Mata Menge specimens (combined, given there is no significant difference between the intervals). As is illustrated in Figure 18, the within-row proportions are similar for all specimens in that the m2 is the widest molar and that the width of the m3 tends to be variable in relation to the m1 (m2 > m1 ≈ m3). There is no statistically significant difference between P. armandvillei and the Mata Menge molars for all ratios (U: p > 0.05). P. theodorverhoeveni, however, has an m2/m1 width ratio that is significantly lower than P. armandvillei (U = 24, exact p = 0.004) and the Mata Menge molar rows (U = 61, p = 0.001). However, while P. theodorverhoeveni also differs from P. armandvillei in having a narrower m3/m2 proportion (U = 18.5, exact p = 0.02), it does not significantly differ from the Mata Menge molar rows (U: p > 0.05).

6.1.5. Palate Width Ratios

The palate widths (at the M1) of Hooijeromys nusatenggara and the recent Papagomys armandvillei are not discernibly different. For Musser [14], however, the relevance is that H. nusatenggara, having narrower molars within a similarly wide palate, has a lower tooth size to palate-width ratio than P. armandvillei (p. 102). The only Mata Menge specimen with a preserved palate is from MM-UP (depicted in Figure 8e). This specimen has the same M1 palate width (5 mm) as the referred Hooijeromys nusatenggara maxillary molar row (Specimen 2), and both are older adults. The widths of the MM-UP M1 molars are 4.02 mm (dextral) and 4.17 mm (sinistral), with M1/palate width ratios of 0.8, while the referred H. nusatenggara specimen M1 width is 3.7 mm (dextral) and has an M1/palate width ratio of 0.7.

6.1.6. Incisor Widths

The Papagomys theodorverhoeveni transverse incisor widths are significantly narrower than the P. armandvillei recovered from Liang Toge, and, as can be seen in Figure 18, there is no overlap (U = 0, p = 0.01, A = 0). The P. theodorverhoeveni incisors are, in turn, significantly wider than the combined Mata Menge interval incisors (U = 2, exact p = 0.0001, A = 0.02) and remain significantly wider when only the MM-UP incisors are compared (U = 2, exact p = 0.002, A = 0.04).

6.1.7. Molar Cusp Heights

A key difference between Hooijeromys nusatenggara and Papagomys armandvillei is that Musser described the H. nusatenggara upper and tentatively associated lower molars as low cusped and the recent P. armandvillei upper and lower molars as high cusped (pages 82, 99 and 107 in [14]), which, though not stated, presumably also applies to the Liang Toge fossil P. armandvillei. Musser did not, however, explicitly quantify the cusp heights of P. theodorverhoeveni, though he did comment that the isolated lower molars tentatively associated with H. nusatenggara are lower than P. theodorverhoeveni.
Scaled image comparisons (refer to Methods Section 3.11) indicate that the two Mata Menge molar rows (MM2012-T23C-F1647 and MM2014-T32D-F245, depicted in Figure 8a,b) have buccal cusps that are of a similar height to each other and ~⅔ the height of the holotype of P. armandvillei. The Mata Menge large murine molars are therefore taken to be comparatively low cusped.

6.2. Morphological Comparisons of the Papagomys group with the Mata Menge Large Murines

The main morphological characteristics of the Papagomys armandvillei, Hooijeromys nusatenggara, and Mata Menge maxillary molar rows are illustrated in Figure 19 as outline tracings and are derived from the molar rows depicted in Figure 2a,c and Figure 8a of this paper. The main morphological characteristics of the Papagomys armandvillei, P. theodorverhoeveni, and Mata Menge mandibular molar rows, and the tentatively associated Hooijeromys nusatenggara molars, are illustrated in Figure 20 as outline tracings referencing Figure 2a–c and Figure 12c of this paper.

6.2.1. Maxillary Occlusal Characteristics

As can be seen, all of the Papagomys group murines, including the Mata Menge material, have maxillary M1 and M2 molars that slant posteriorly and interlock, with this degree of interlocking greater in P. armandvillei. All maxillary molars also lack a distinct cusp t7 and posterior cingulum.
For both Mata Menge intervals the maxillary molars resemble Musser’s description of Hooijeromys nusatenggara [14] (pp. 104–106). In particular, and although only two well-preserved and complete maxillary rows have been recovered from MM-LOW (Figure 8a,c), these specimens are strikingly similar to the H. nusatenggara holotype and the referred maxillary row from Ola Bula (Figure 2c).
As with Hooijeromys nusatenggara, the Mata Menge M1 has a gourd-shaped t2 that is angled at ~45° from the occlusal surface, and, as speculated by Musser [14] (pp. 104–105), the t1 remains distinct until after appreciable wear, which for the Mata Menge material is well into adulthood (WS3–4). This differs from Papagomys armandvillei, which, according to Musser (p. 91), has an M1 t2 that is angled at ~30° from the occlusal surface, and the Recent specimens indicate the anterior M1 cusps form a discrete lamina as early as young adults. H. nusatenggara and the Mata Menge material also share the presence of a small cusp t3 on the M2, though for the Mata Menge molars this cusp ranges from similarly small to distinct. This also differs from P. armandvillei, which has either an absent or minute t3.
Given that the maxillary molar widths also indicate a single species (V’), particularly so for the combined data set of the MM-LOW and Hooijeromys nusatenggara specimens, it can be assumed that H. nusatenggara maxillary material is conspecific with the Mata Menge material. Where the Mata Menge molars differ from both Papagomys armandvillei and H. nusatenggara is that for many of the M1 and M2, but not all, there is a lingual spur abutting the t8. The absence of a lingual spur on the M1 and M2 of H. nusatenggara could be due to both variation and the fact that the H. nusatenggara material is limited. Musser [14] was only able to examine two molar rows, with the referred molar row being from an old adult. As indicated by the Mata Menge material, a lingual spur does not occur on all specimens, and with advanced wear it is no longer able to be observed.

6.2.2. Mandibular Occlusal Characteristics

It is fairly clear from the mandibular morphological characteristics that the Mata Menge material most closely resembles Papagomys theodorverhoeveni in both the shapes of the cusps and the frequency of accessory cusplets. Although the Mata Menge material lacks a clear antero-central cusp, across both intervals a proportion of the m1 molars have a low platform where an antero-central cusp would be located (as indicated on the depicted molar row). Although this is taken to be a diagnostic characteristic, on one of the P. theodorverhoeveni specimens (Specimen 10), an antero-central cusp is absent. Allowing that both Aplin and Helgen [10] and Musser and Newcomb [31] have argued that the presence of accessory cusplets is variable within a single species and therefore not diagnostic, the Mata Menge and the P. theodorverhoeveni specimens are both more complex and more similar morphologically to each other than either is to P. armandvillei.
Musser [14] (p. 107) described the tentatively associated Hooijeromys nusatenggara lower molar material as lacking the elaboration of Papagomys theodorverhoeveni and being more similar to the “simpler occlusal patterns” of P. armandvillei. Unfortunately, Musser only provided technical illustrations of two of these molars (Specimens 4 and 6, reproduced in Figure 2c), which is problematic, given the drawing of the m1 fragment lacks Musser’s description of a small enamel mound at the base of the antero-lingual cusp.

6.3. Papagomys group Molar Roots

According to Musser [14], the large Papagomys group of murines conforms to a maxillary M1–3 molar root pattern of 5:4:4 (P. armandvillei and Hooijeromys nusatenggara) and a mandibular m1–3 root pattern of 4:3:3, with the latter including P. theodorverhoeveni. Although Musser notes that “a few specimens” of P. armandvillei have M2 anterior roots that are fused into one root (p. 83), the Mata Menge specimens are far more variable.
Allowing that the clear presence of molar roots is limited to 22 maxillary and 27 mandibular isolated molars, the Mata Menge large murines generally conform to the Papagomys group patterning. In particular, and for both intervals, the first molars (6 M1 and 11 m1) appear to have five and four roots, respectively, and are morphologically identical to Musser’s descriptions regarding size and location. However, for both intervals, the remaining isolated molars contain fused, split, and small additional roots (refer to Figure 16), resulting in either a reduction or increase in number.

6.4. Hooijeromys nusatengarra Diet

Musser [14] speculated that the diet of Hooijeromys nusatenggara may have been similar to that of the large, extant Sundaland murine, Bandicota indica, which lives in burrows adjacent to natural and cultivated grass fields and has a diet that includes large snails, crabs, and molluscs, as well as plant material. Musser’s speculation is based on the two species sharing a similarity of cranial features (wide zygomatic plates, long incisive foramina) and that both have a strongly five-rooted M1, a wide M2, and close to transverse cusps on the M1–M2. The illustrations in Musser and Brothers of the maxillary and mandibular toothrows of an extant B. indica from Java (Figures 9 and 10 in [50]) are similar to the Mata Menge large murines, noting that the B. indica maxillary M1–2 also have a lingual spur along the cusp t8 margin and that the mandibular molars have accessory cusplets, though not as complex as those recovered from MM-LOW. B. indica is also, on average, similar in alveolar length to the Mata Menge murines (e.g., mean maxillary alveolar length 11.14 mm, mean M1 width 3.38 mm). However, although Musser [14] observed B. indica having a relatively mixed diet, in an overview of stable isotope and microware studies, Patnaik [51] included data showing that Recent B. indica from the archaeological-palaeontological site of Masol are grazers, while a 2 mya Bandicota excavated from Nadah, also in Northern India, was both a mixed feeder and seasonal grazer, but still with a C4-dominated diet. These results echo Puspaningrum’s [49] findings that the Mata Menge murines were grazers with a C4-dominated diet.

7. Discussion

Since 1994, the Middle Pleistocene site of Mata Menge has recovered a large number of murine dental fossils, with the Freudenthal and Martín Suárez [46] coefficient of variability (V’) indicating these finds are dominated by one species. There are, however, statistically significant differences between the site’s two stratigraphic intervals, which are separated in time by ~70,000 years. While comparatively few specimens have been recovered from the older, lower Mata Menge interval (MM-LOW; 0.77 mya), they are significantly smaller than the younger interval specimens (MM-UP; ~0.70 mya) for most measurements. The widths of the upper and lower first molars remain constant, but the lengths have increased in MM-UP. Both the upper and lower second molars, being, as noted by Misonne [23], wedged between the first and third, have only increased in width, not length (p. 52). There are too few MM-LOW third molars and complete maxillary molar rows to statistically analyse, but the more numerous mandibular crown and alveolar lengths recovered from MM-LOW are significantly shorter than MM-UP, and the incisors are significantly narrower. Removing the MM-LOW specimens from the analyses, therefore, has the effect of further reducing variability (V’) of the species.
Being conspecific, the diagnostic aspects of the within-row molar proportions are the same within and across both Mata Menge intervals and agree with the large Papagomys group ratios. The M1 is wider or of a similar width to the M2, and the M3 is the narrowest molar (M1 ≥ M2 > M3); the m2 is the widest lower molar, with the m1 and m3 ratio being more variable (m2 > m1 ≈ m3). Further evidence that the majority of the Mata Menge molars represent a single species is that the maxillary and mandibular molar rows fall within the murine association range (4–6%) of Aplin and Helgen [10] within each interval.
That the MM-UP murines are significantly, and fairly consistently, larger than MM-LOW may be due to a number of factors, such as the relative abundance of resources during the different time periods. The dietary choices, however, are similar, with Puspaningrum’s stable isotope analyses on incisors from both intervals indicating they were both predominantly consuming grasses [49]. Related to this, the morphological characteristics are similar within and across both intervals, though the mandibular molars recovered from MM-LOW tend to have a higher frequency of antero-buccal accessory cusplets on the m1 (92% of the observable molars) than those recovered from MM-UP (32% of the observable molars). The MM-LOW m1 also has evidence of bilateral posterior cusplets, and the cingula tend to be larger, resulting in a slightly more complex mandibular morphological profile.
The Mata Menge murine molars range in estimated wear stage from very young rats (WS1) to advanced wear (WS5), with most molars forming rows of laminae by mid-late adulthood. Wear stage was not found to impact the width of the molars but does foreshorten the length of the upper M1 and M2, due to the maxillary molars having the characteristic of interlocking. The frequencies of the estimated wear stages show a predominance of young adult and adult molars (i.e., WS2–3) in both MM-LOW and MM-UP.
The most frequent molar for both intervals is the sinistral m1, and on this basis MM-UP consists of a minimum of 56 individuals, enabling a mortality profile [47]. The “L” shape of the wear stage histogram (refer to Figure 7) indicates the MM-UP assemblage is characteristic of a catastrophic event, such as a volcanic eruption or predation. Clear enamel dissolution patterns characteristic of raptor stomach acid do not appear to be evident on the Mata Menge molars. Although not recorded systematically, some degree of localised dissolution pitting of enamel, usually developed as pits with well-defined pit margins and a smooth bottom, does appear to occur on approximately one-third of the molars examined for their morphological characteristics, such as in the maxillary M1 shown in Figure 9c. However, this pattern resembles etching by alkaline volcanic sediments rather than by stomach acids of birds of prey [52]. Moreover, a similar type of corrosion pitting can be observed on some Homo floresiensis teeth (see Figure 2 in [2]) and Stegodon enamel from the same volcaniclastic sediment layers. This pattern of corrosion may therefore be more consistent with mass death due to a volcanic eruption, particularly given the MM-UP stratigraphic profile comprises a series of ashy mudflows that occurred over a very short period of time, possibly days [6].
The Mata Menge maxillary molars closely resemble the metric and morphological characteristics of both the holotype and referred maxillary material of Hooijeromys nusatenggara recovered from the Early–Middle Pleistocene site of Ola Bula, which is located close to Mata Menge in space as well as geological time. This correspondence, which includes being low cusped, is particularly strong with the smaller MM-LOW molars. The addition of the H. nusatenggara maxillary molar widths serves to lower the conspecific variability (V’) of the Mata Menge material, and particularly the variability of the MM-LOW finds. While very similar, where the Mata Menge maxillary molars differ from all of the Papagomys group murines, including the H. nusatenggara young adult holotype, is the presence of a lingual spur on 67% of the less worn M1, which co-occurs on 19% of the M2. Misonne [23] considered this characteristic to constitute the trace of cusp t7 in Bandicota indica (p. 116), but this was disputed by Musser and Brothers [50] when describing the M1 and M2 of recent B. indica from Cirebon in West Java. Instead, Musser and Brothers described this characteristic as a “lingual ridge” (p. 42), which is synonymous with, but less accurate than, Aplin and Helgen’s [10] “lingual spur” (p. 51). The Mata Menge sample indicates the presence of a lingual spur is both variable and obscured with increasing wear. A lingual spur could, therefore, have been a characteristic of the old adult maxillary row referred to as H. nusatenggara.
The Mata Menge sample is closely aligned to Hooijeromys nusatenggara for the maxillary morphological characteristics, but this is not the case for the mandibular molar morphology. The Mata Menge m1 and m3 agree with the three isolated molars Musser [14] tentatively associated with H. nusatenggara in being low cusped and of a comparable width. However, Musser considered these isolated H. nusatenggara mandibular molars to be more similar to Papagomys armandvillei in having a simple cuspidation. This conclusion is likely due to the limitations of the H. nusatenggara material, consisting of only a partial m1, and no m2 being recovered. The Mata Menge murines, in contrast, have clear evidence of a complex m1 and m2 cuspidation that is far more like the mid-Holocene Papagomys theodorverhoeveni excavated from Liang Toge. Hooijer [16], Misonne [23], and Musser [14] are in agreement that Papagomys theodorverhoeveni is a separate species from P. armandvillei in being smaller and having a high frequency of accessory cusplets on the m1 and m2, and that most specimens have either an antero-central cusplet on the m1 or, less frequently, a small platform. None of the Mata Menge m1 molars have evidence of a clear antero-central cusplet, but a small antero-central platform is present in 23% where this could be observed and occurs with a similar frequency in both intervals. Unfortunately, while Musser’s description of the partial m1 includes a small enamel mound at the base of the antero-lingual cusp, this characteristic is not discernible in Musser’s technical drawing, which is the only image of this molar (reproduced in Figure 2c). The potential for technical illustrations to be unreliable is evident when a murine is found to be extant. For example, a drawing of Musser’s holotype of the Sulawesi murine, Sommeromys macrorhinos [53] (p. 4), has been found to misrepresent both the morphological characteristics and colouration of this species [54].
Following Musser’s [14] revision of Hooijer’s P. verhoeveni from the mid-Holocene site of Liang Toge [16], the P. theodorverhoeveni specimens only consist of mandibular dental material. Our analyses suggest this reassignment, which involved Hooijer’s holotype of P. verhoeveni, a complete maxillary row, would benefit from revision. When combined, the Recent and Liang Toge (mid-Holocene) P. armandvillei fall outside the single species variability (V’) for the M1, and the maxillary tooth row that Musser reassigned to P. armandvillei falls within the articulation range of the P. theodorverhoeveni mandibles but is far too small to articulate with any of the P. armandvillei mandibles.
Another area of difference between the Mata Menge sample and the Papagomys group is in the molar root frequencies. Musser [14] found that a few of the Recent Papagomys armandvillei have M2 anterior roots that are fused, but that the defining root frequencies for the Papagomys group are 5:4:4 for the maxillary molars and 4:3:3 for the mandibular molars. Root frequencies could only be observed in 22 maxillary and 27 mandibular Mata Menge molars and generally conform to the Papagomys group pattern. However, with the exception of the first upper and lower molars (M1, m1), the actual frequencies are more varied, with many having fused, split, and accessory roots.
In a study reassigning an extant arboreal rat from Bogor in West Java to a new genus (Kadarsanomys), Musser [55] commented on the variation of M1 root frequencies in 78 specimens of the extant Sundaland murine, Lenothrix canus. For this murine, the root numbers range from three to five, including evidence of splitting, fusion, and additional rootlets. Misonne [23] placed Papagomys within the Lenothrix genus and associated P. armandvillei with Lenomys and Eropeplus, two endemic extant genera from the Wallacean island of Sulawesi (p. 72). This connection has been corroborated more recently based on DNA sequencing of a large number of Muridae from Wallacea, Sunda, and Sahul [56], with the result that extant P. armandvillei cluster with the paper’s “Bunomys group”, which includes Lenomys and Eropeplus. This association with Lenothrix could account for the root variability in the large Mata Menge species, which is clearly a member of the Papagomys group. However, mammalian molar roots, including those of murines, have received comparatively little attention, being reliant on extraction or medical imaging to confidently observe [57]. Where this has been studied more extensively is with extant humans, and a high degree of maxillary and mandibular third molar root variability has been found to be characteristic across large samples taken from widely disparate population groups [58]. The number of roots in a murine molar, therefore, seems to be relatively unreliable as a diagnostic characteristic, particularly when such a study involves a small sample.

8. Conclusions

Given our results indicate that the Mata Menge large murines are conspecific with Hooijeromys nusatenggara for molar widths, have comparable crown lengths, and are strikingly similar in morphology to both the holotype and referred maxillary row of this species, a simple conclusion would be that H. nusatenggara dominates the Mata Menge assemblage. However, the morphological similarity between the mandibular rows of the mid-Holocene Papagomys theodorverhoeveni and the m1 and m2 of the Mata Menge murines indicates a degree of caution is justifiable at this time. As has been shown, the Mata Menge murine molars and incisors are significantly larger in the younger, upper interval (MM-UP). Therefore, the Mata Menge mandibular molars being smaller than the mid-Holocene P. theodorverhoeveni could be a logical extension of this trend and would accord with the “island rule”, where insular murines tend to become larger during the Pleistocene [8]. Studies related to the large endemic murines from Flores would, therefore, benefit greatly from a re-examination of both the Liang Toge material and the large Liang Bua murine dental assemblage, particularly if the latter involved comparable molar measurement protocols, included the alveolar lengths of the molar rows, accounted for the impact of molar wear, and provided more morphological detail with regards to the characteristics of relatively unworn maxillary rows that may, or may not, be attributable to P. theodorverhoeveni. Until these maxillary rows are revisited, the Mata Menge large murines can only be confidently assigned to being a member of the Papagomys group.

Supplementary Materials

The following supporting information can be downloaded at: https://www.mdpi.com/article/10.3390/quat8030044/s1, Table S1. Mata Menge large maxillae, Table S2. Mata Menge large mandibles, Table S3. Papagomys raw data.

Author Contributions

Conceptualization, S.H. and G.D.v.d.B.; methodology, S.H., G.D.v.d.B. and S.T.T.; formal analysis, S.H. and G.D.v.d.B.; investigation, S.H., G.D.v.d.B., I.S. and H.I.; resources, U.P.W., I.K. and R.S.; data curation, U.P.W., I.S. and H.I.; writing—original draft preparation, S.H. and G.D.v.d.B.; writing—review and editing, S.T.T., I.K., R.S., U.P.W., H.I., I.S., S.H. and G.D.v.d.B.; visualization, S.H. and G.D.v.d.B.; supervision, G.D.v.d.B., I.K. and R.S.; project administration, G.D.v.d.B., R.S. and I.K.; funding acquisition, G.D.v.d.B., R.S. and I.K. All authors have read and agreed to the published version of the manuscript.

Funding

This research was financially supported by the Australian Research Council (grant numbers DP1093342, FT100100384, DP1096558, and DP190100164), and the Centre for Geological Survey and Geology Museum of the Geological Agency of Indonesia.

Data Availability Statement

All of the fossil material is provenanced to the Centre for Geological Survey and Geology Museum of the Geological Agency of Indonesia.

Acknowledgments

Permission to undertake this research was granted by the Kementerian Riset dan Teknologi Indonesia (RISTEK), permits 0107/SIP/FRP/SM/VI/2010, 300/SIP/FRP/SM/VIII/2013, 276/E5/E5.4/SIP/2019, and Badan Riset dan Inovasi Nasional Indonesia (BRIN), permits 344/SIP/IV/FR/12/2022, 642/SIP/IV/FR/10/2023, and 98/SIP.EXT/IV/FR/6/2024. Local research permissions were issued by the provincial government of East Nusa Tenggara in Kupang and the Ngada District administrations, and we thank the Provincial and Ngada Tourism, Culture and Education Departments for their ongoing support. We acknowledge and thank the support provided by the Heads of the Geological Agency, the Centre for Geological Survey, and Geology Museum, Bandung, Indonesia, and the scientific and technical personnel involved at some stage during the successive fieldwork campaigns. The team was supported each year by up to 120 local people from the villages of Mengeruda, Piga-I, and Piga-II.

Conflicts of Interest

The authors declare no conflicts of interest. The funders had no role in the design of the study; in the collection, analyses, or interpretation of data; in the writing of the manuscript; or in the decision to publish the results.

References

  1. Brumm, A.; van den Bergh, G.D.; Storey, M.; Kurniawan, I.; Alloway, B.V.; Setiawan, R.; Setiyabudi, E.; Grün, R.; Moore, M.W.; Yurnaldi, D.; et al. Age and context of the oldest known hominin fossils from Flores. Nature 2016, 534, 249. [Google Scholar] [CrossRef] [PubMed]
  2. van den Bergh, G.D.; Kaifu, Y.; Kurniawan, I.; Kono, R.T.; Brumm, A.; Setiyabudi, E.; Aziz, F.; Morwood, M.J. Homo floresiensis-like fossils from the early Middle Pleistocene of Flores. Nature 2016, 534, 245. [Google Scholar] [CrossRef]
  3. Kaifu, Y.; Kurniawan, I.; Mizushima, S.; Sawada, J.; Lague, M.; Setiawan, R.; Sutisna, I.; Wibowo, U.P.; Suwa, G.; Kono, R.T. Early evolution of small body size in Homo floresiensis. Nat. Commun. 2024, 15, 6381. [Google Scholar] [CrossRef]
  4. Morwood, M.J.; Soejono, R.P.; Roberts, R.G.; Sutikna, T.; Turney, C.S.M.; Westaway, K.E.; Rink, W.J.; Zhao, J.X.; van den Bergh, G.D.; Due, R.A.; et al. Archaeology and age of a new hominin from Flores in eastern Indonesia. Nature 2004, 431, 1087–1091. [Google Scholar] [CrossRef]
  5. Sutikna, T.; Tocheri, M.W.; Morwood, M.J.; Saptomo, E.W.; Jatmiko; Awe, R.D.; Wasisto, S.; Westaway, K.E.; Aubert, M.; Li, B.; et al. Revised stratigraphy and chronology for Homo floresiensis at Liang Bua in Indonesia. Nature 2016, 532, 366. [Google Scholar] [CrossRef]
  6. van den Bergh, G.D.; Alloway, B.V.; Storey, M.; Setiawan, R.; Yurnaldi, D.; Kurniawan, I.; Moore, M.W.; Brumm, A.; Flude, S.; Sutikna, T. An integrative geochronological framework for the pleistocene So’a basin (Flores, Indonesia), and its implications for faunal turnover and hominin arrival. Quat. Sci. Rev. 2022, 294, 107721. [Google Scholar] [CrossRef]
  7. Meijer, H.J.; Kurniawan, I.; Setiabudi, E.; Brumm, A.; Sutikna, T.; Setiawan, R.; van den Bergh, G.D. Avian remains from the Early/Middle Pleistocene of the So’a Basin, central Flores, Indonesia, and their palaeoenvironmental significance. Palaeogeogr. Palaeoclimatol. Palaeoecol. 2015, 440, 161–171. [Google Scholar] [CrossRef]
  8. van der Geer, A.; Lyras, G.; de Vos, J. Evolution of Island Mammals: Adaptation and Extinction of Placental Mammals on Islands; John Wiley & Sons: Hoboken, NJ, USA, 2021. [Google Scholar]
  9. Turvey, S.T.; Crees, J.J.; Hansford, J.; Jeffree, T.E.; Crumpton, N.; Kurniawan, I.; Setiyabudi, E.; Guillerme, T.; Paranggarimu, U.; Dosseto, A.; et al. Quaternary vertebrate faunas from Sumba, Indonesia: Implications for Wallacean biogeography and evolution. Proc. R. Soc. B Biol. Sci. 2017, 284, 20171278. [Google Scholar] [CrossRef]
  10. Aplin, K.P.; Helgen, K.M. Quaternary murid rodents of Timor Part I: New material of Coryphomys buehleri Schaub, 1937, and description of a second species of the genus. Bull. Am. Mus. Nat. Hist. 2010, 2010, 1–80. [Google Scholar] [CrossRef]
  11. Louys, J.; O’Connor, S.; Higgins, P.; Hawkins, S.; Maloney, T. New genus and species of giant rat from Alor Island, Indonesia. J. Asia-Pac. Biodivers. 2018, 11, 503–510. [Google Scholar] [CrossRef]
  12. Veatch, E.G.; Fabre, P.H.; Tocheri, M.W.; Sutikna, T.; Saptomo, E.W.; Musser, G.G.; Helgen, K.M. A New Giant Shrew Rat (Rodentia: Muridae: Murinae) from Flores, Indonesia and a Comparative Investigation of its Ecomorphology. Rec. Aust. Mus. 2023, 75, 741. [Google Scholar] [CrossRef]
  13. Gerrie, R.; Kennerley, R. Papagomys armandvillei. The IUCN Red List of Threatened Species 2017: e.T15975A22399875. 2017. Available online: https://doi.org/10.2305/IUCN.UK.2017-2.RLTS.T15975A22399875.en (accessed on 10 April 2025).
  14. Musser, G.G. The giant rat of Flores and its relatives east of Borneo and Bali. Bull. Am. Mus. Nat. Hist. 1981, 169, 69–175. [Google Scholar]
  15. Hooijer, D. Indo-Australian insular elephants. Genetica 1967, 38, 143–162. [Google Scholar] [CrossRef] [PubMed]
  16. Hooijer, D.A. Three new giant prehistoric rats from Flores, Lesser Sunda Islands. Zool. Meded. 1957, 35, 299–314. [Google Scholar]
  17. Knepper, G.M. Floresmens. Het Leven van Theo Verhoeven, Missionaris en Archeoloog; Uitgeverij Boekscout Soest: Utrecht, The Netherlands, 2019. [Google Scholar]
  18. van der Plas, M. A new model for the evolution of Homo sapiens from the Wallacean islands. PalArch’s J. Vertebr. Palaeontol. 2007, 4, 1–121. Available online: https://archives.palarch.nl/index.php/jvp/article/view/657 (accessed on 10 December 2023).
  19. Hogg, A.G.; Heaton, T.J.; Hua, Q.; Palmer, J.G.; Turney, C.S.; Southon, J.; Bayliss, A.; Blackwell, P.G.; Boswijk, G.; Ramsey, C.B. SHCal20 Southern Hemisphere calibration, 0–55,000 years cal BP. Radiocarbon 2020, 62, 759–778. [Google Scholar] [CrossRef]
  20. Jentink, F.A. On a new species of Rat from the island of Flores. In Zoologische Ergebnisse Einer Reise in Niederländisch Ost-Indien; Weber, M., Brill, E.J., Eds.; Bremen University Press: Bremen, Germany, 1890–1907; Leiden, The Netherlands, 1893; Volume 3, pp. 78–83, Plate V. [Google Scholar]
  21. Sody, H.J.V. On a collection of rats from the Indo-Malayan and Indo-Australian regions. Treubia 1941, 18, 255–325. [Google Scholar]
  22. Bellucci, G. Jesuits Yearbook of the Society of Jesus 2010; General Curia of the Society of Jesus: Roma, Italy, 2009; p. 143. Available online: https://www.jesuits.global/sj_files/2020/05/annuario2010_en.pdf (accessed on 25 January 2025).
  23. Misonne, X. African and Indo-Australian Muridae. Evolutionary trends. Ann. Mus. Roy. Afr. Centr. Tervuren Zool. 1969, 172, 1–219. [Google Scholar]
  24. Maringer, J.; Verhoeven, T. Die steinartefakte aus der Stegodon-fossilschicht von Mengeruda auf Flores, Indonesien. Anthropos 1970, 229–247. [Google Scholar]
  25. O’Sullivan, P.B.; Morwood, M.; Hobbs, D.; Suminto, F.A.; Situmorang, M.; Raza, A.; Maas, R. Archaeological implications of the geology and chronology of the Soa basin, Flores, Indonesia. Geology 2001, 29, 607–610. [Google Scholar] [CrossRef]
  26. Sutikna, T.; Tocheri, M.W.; Faith, J.T.; Awe, R.D.; Meijer, H.J.; Saptomo, E.W.; Roberts, R.G. The spatio-temporal distribution of archaeological and faunal finds at Liang Bua (Flores, Indonesia) in light of the revised chronology for Homo floresiensis. J. Hum. Evol. 2018, 124, 52–74. [Google Scholar] [CrossRef]
  27. Locatelli, E. Insular Small Mammals from Quaternary Deposits of Sicily and Flores. Ph.D. Thesis, Università degli Studi di Ferrara, Ferrara, Italy, 2010. [Google Scholar]
  28. Locatelli, E.; Due, R.A.; van den Bergh, G.D.; van den Hoek Ostende, L.W. Pleistocene survivors and Holocene extinctions: The giant rats from Liang Bua (Flores, Indonesia). Quat. Int. 2012, 281, 47–57. [Google Scholar] [CrossRef]
  29. Zijlstra, J.S.; van den Hoek Ostende, L.W.; Due, R.A. Verhoeven’s giant rat of Flores (Papagomys theodorverhoeveni, Muridae) extinct after all? Contrib. Zool. 2008, 77, 25–31. [Google Scholar] [CrossRef]
  30. Veatch, E.G.; Tocheri, M.W.; Sutikna, T.; McGrath, K.; Saptomo, E.W.; Helgen, K.M. Temporal shifts in the distribution of murine rodent body size classes at Liang Bua (Flores, Indonesia) reveal new insights into the paleoecology of Homo floresiensis and associated fauna. J. Hum. Evol. 2019, 130, 45–60. [Google Scholar] [CrossRef]
  31. Musser, G.G.; Newcomb, C. Malaysian murids and the giant rat of Sumatra. Bull. Am. Mus. Nat. Hist. 1983, 174, 4. [Google Scholar]
  32. Musser, G.G. A systematic review of Sulawesi Bunomys (Muridae, Murinae) with the description of two new species. Bull. Am. Mus. Nat. Hist. 2014, 2014, 1–313. [Google Scholar] [CrossRef]
  33. Reyes, M.C.; Ingicco, T.; Piper, P.J.; Amano, N.; Pawlik, A.F. First fossil evidence of the extinct Philippine cloud rat Crateromys paulus (Muridae: Murinae: Phloeomyini) from Ilin Island, Mindoro, and insights into its Holocene abundance. Proc. Biol. Soc. Wash. 2017, 130, 84–97. [Google Scholar] [CrossRef] [PubMed]
  34. Lazzari, V.; Tafforeau, P.; Aguilar, J.-P.; Michaux, J. Topographic maps applied to comparative molar morphology: The case of murine and cricetine dental plans (Rodentia, Muroidea). Paleobiology 2008, 34, 46–64. [Google Scholar] [CrossRef]
  35. Lyman, R.L. Quantitative units and terminology in zooarchaeology. Am. Antiq. 1994, 59, 36–71. [Google Scholar] [CrossRef]
  36. Westin, C.-F.; Kikinis, R.; Knutsson, H. Adaptive image filtering. In Handbook of Medical Imaging: Processing and Analysis Management; Bankman, I., Ed.; Elsevier Science & Technology: Chantilly, VA, USA, 2000; pp. 19–31. [Google Scholar]
  37. Lazzari, V.; Charles, C.; Tafforeau, P.; Vianey-Liaud, M.; Aguilar, J.-P.; Jaeger, J.-J.; Michaux, J.; Viriot, L. Mosaic convergence of rodent dentitions. PLoS ONE 2008, 3, e3607. [Google Scholar] [CrossRef]
  38. Hikida, T. Age determination of the Japanese wood mouse, Apodemus speciosus. Jap. J. Ecol. 1980, 30, 109–116. [Google Scholar] [CrossRef]
  39. Adamczewska-Andrzejewska, K. Growth, variations and age criteria in Apodemus agrarius (Pallas, 1771). Acta Theriol. 1973, 18, 353–394. [Google Scholar] [CrossRef]
  40. Valenzuela-Lamas, S.; Baylac, M.; Cucchi, T.; Vigne, J.-D. House mouse dispersal in Iron Age Spain: A geometric morphometrics appraisal. Biol. J. Linn. Soc. 2011, 102, 483–497. [Google Scholar] [CrossRef]
  41. Freudenthal, M.; Martin-Suárez, E.; Bendala, N. Estimating age through tooth wear. A pilot study on tooth abrasion in Apodemus (Rodentia, Mammalia). Mammalia 2002, 66, 275–284. [Google Scholar] [CrossRef]
  42. Musser, G.G. Characterisation of the endemic Sulawesi Lenomys meyeri (Muridae, Murinae) and the description of a new species of Lenomys. In Taxonomic Tapestries: The Threads of Evolutionary, Behavioural and Conservation Research; Behie, A.M., Oxenham, M.F., Eds.; ANUPress: Canberra, Australia, 2015; pp. 13–50. [Google Scholar]
  43. Hammer, Ø.; Harper, D.; Ryan, P. PAST-Palaeontological Statistics. 2001. Available online: www.uv.es/~pardomv/pe/2001_1/past/pastprog/past.pdf (accessed on 30 July 2025).
  44. Khamis, H. Measures of association: How to choose? J. Diagn. Med. Sonogr. 2008, 24, 155–162. [Google Scholar] [CrossRef]
  45. Freudenthal, M.; Cuenca Bescós, G. Size variation of fossil rodent populations. Scr. Geol. 1984, 76, 1–28. [Google Scholar]
  46. Freudenthal, M.; Martín Suárez, E. Size variation in samples of fossil and recent murid teeth. Scr. Geol. 1990, 93, 1–34. [Google Scholar]
  47. Lyman, R.L. On the analysis of vertebrate mortality profiles: Sample size, mortality type, and hunting pressure. Am. Antiq. 1987, 52, 125–142. [Google Scholar] [CrossRef]
  48. Gomes Rodrigues, H.; Merceron, G.; Viriot, L. Dental microwear patterns of extant and extinct Muridae (Rodentia, Mammalia): Ecological implications. Naturwissenschaften 2009, 96, 537–542. [Google Scholar] [CrossRef]
  49. Puspaningrum, M.R. Proboscidea as Palaeoenvironmental Indicators in Southeast Asia. Ph.D. Thesis, University of Wollongong, Wollongong, Australia, 2016. [Google Scholar]
  50. Musser, G.G.; Brothers, E.M. Identification of bandicoot rats from Thailand (Bandicota, Muridae, Rodentia). Am. Mus. Novit. 1994, 3110, 1–56. [Google Scholar]
  51. Patnaik, R. Diet and habitat changes among Siwalik herbivorous mammals in response to Neogene and Quaternary climate changes: An appraisal in the light of new data. Quat. Int. 2015, 371, 232–243. [Google Scholar] [CrossRef]
  52. Fernández-Jalvo, Y.; Andrews, P. Atlas of Taphonomic Identifications: 1001+ Images of Fossil and Recent Mammal Bone Modification; Springer: Dordrecht, The Netherlands, 2016. [Google Scholar]
  53. Musser, G.G.; Durden, L.A. Sulawesi rodents: Description of a new genus and species of Murinae (Muridae, Rodentia) and its parasitic new species of sucking louse (Insecta, Anoplura). Am. Mus. Novit. 2002, 3368, 1–50. [Google Scholar] [CrossRef]
  54. Achmadi, A.S.; Rowe, K.C.; Esselstyn, J.A. New records of two rarely encountered, endemic rats (Rodentia: Muridae: Murinae) from Gunung Gandangdewata, West Sulawesi province. Treubia 2014, 41, 51–60. [Google Scholar] [CrossRef]
  55. Musser, G.G. A new genus of arboreal rat from West Java, Indonesia. Zool. Verh. 1981, 189, 3–35. [Google Scholar]
  56. Rowe, K.C.; Achmadi, A.S.; Fabre, P.H.; Schenk, J.J.; Steppan, S.J.; Esselstyn, J.A. Oceanic islands of Wallacea as a source for dispersal and diversification of murine rodents. J. Biogeogr. 2019, 46, 2752–2768. [Google Scholar] [CrossRef]
  57. Seo, H.; Kim, J.; Hwang, J.J.; Jeong, H.-G.; Han, S.-S.; Park, W.; Ryu, K.; Seomun, H.; Kim, J.-Y.; Cho, E.-S. Regulation of root patterns in mammalian teeth. Sci. Rep. 2017, 7, 12714. [Google Scholar] [CrossRef]
  58. Al-Qudah, A.A.; Bani Younis, H.A.B.; Awawdeh, L.A.; Daud, A. Root and canal morphology of third molar teeth. Sci. Rep. 2023, 13, 6901. [Google Scholar] [CrossRef] [PubMed]
Figure 1. Map of Flores showing the excavation sites relevant to the Mata Menge murine finds: Ola Bula, Boa Leza, Liang Toge, and Liang Bua. The So’a Basin is indicated by a dashed black line. Inset shows the location of the Wallacean islands mentioned in the text.
Quaternary 08 00044 g001
Figure 2. The large endemic Papagomys group murines: (a) Papagomys armandvillei Holotype dextral maxillary and mandibular rows (RMNH 18301, young adult, Recent); (b) P. theodorverhoeveni Neotype mandibular row (Specimen 12, dextral, young adult, Liang Toge); and (c) Hooijeromys nusatenggara Holotype maxillary row (Specimen 1, dextral, young adult, Ola Bula), referred maxillary row (Specimen 2, dextral, old adult), isolated m1 fragment (Specimen 4, sinistral (reversed), adult, Boa Leza), and isolated m3 (Specimen 6, dextral, adult, Boa Leza). RMNH = Rijksmuseum van Natuurlijke Historie, Leiden (now Naturalis). Images reproduced with the kind permission of the American Museum of Natural History.
Quaternary 08 00044 g002
Figure 3. Stratigraphy and provenance of the Mata Menge murine molars by interval: MM-LOW (ac) and MM-UP (d,e). (a) Stratigraphic profiles of the west baulks of Trenches 23 and 27, superposed on top of each other at the same elevation. Profile above the thick red line represents the west baulk of Trench 27, and below the red line is the lower part of the west baulk of Trench 23 (red lines in (c)). Blue crosses represent the provenanced dental elements projected onto the composite stratigraphic profile. Most of the fossils originate from the combined Layers 8a and 8b, while some originate from older or younger layers. Grey arrows point to a dextral mandible (MM2012-T23B-F2127) and dextral maxilla (MM2012-T23C-F1647) that likely belonged to a single individual. (b) Detail of the soft-sediment deformation structures at the boundary between Layers 8a and 8b in the west baulk of Trench 23, suggesting that both layers were deposited in close succession. (c) Horizontal distribution of the fossils (blue crosses) for which UTM 3D coordinates were recorded with a Total Station. Arrows point to the same specimens as in (a). (d) West baulk of Trench 32A. Most murine fossils were recovered from Layer II, a water-laid sandstone deposited in a small streambed. (e) East-west cross-section of the MM-UP stratigraphy. Black line indicates the boundary between Layer I and Layer II measured with a total station. Green crosses represent the dental elements projected on the cross-section. Note that sandstone Layer II wedges out towards the west, which explains why the fossils are concentrated in a thinner interval on the left side of the figure. A small number of fossils was retrieved from Layer I, a massive fine-grained mudflow with diatoms.
Quaternary 08 00044 g003
Figure 4. Nomenclature applied to the Papagomys group and Mata Menge murines. Illustrations are simplified outlines of two MM-UP dextral molar rows: maxillary (MM2014-T32D-F145) and mandibular (MM2016-T32A-F3395). For the maxillary cusps the “t” refers to tubercle (another term for cusp), and the abbreviations for the mandibular cusps are protoconid (pd), metaconid (md), hypoconid (hd), and entoconid (ed). For both the maxillary and mandibular molars, a merged transverse row of cusps (e.g., t4–6, pd-md) is referred to as a lamina.
Quaternary 08 00044 g004
Figure 5. Histograms (optimal bin widths) of the Mata Menge murine molar width (mm) distribution frequencies, including the mean and standard deviation (SD) for each molar. Clusters of small- and medium-sized molars are indicated by arrows: red = small, blue = medium; the large, isolated M1 of Spelaeomys florensis is indicated by a black arrow.
Quaternary 08 00044 g005
Figure 6. Mata Menge large murine molar wear stage (WS1–5) frequencies. For clarity, the intervals are slightly offset within each wear stage. Refer to Supplementary Tables S1 and S2 for the individual values.
Quaternary 08 00044 g006
Figure 7. Estimated wear stage profile of MNI from MM-UP (N = 56).
Quaternary 08 00044 g007
Figure 8. Maxillary molar row morphology (ad) and palate fragment (e): (a) MM2012-T23C-F1647 (dextral, WS2, MM-LOW); (b) MM2014-32D-F245 (dextral, WS2, MM-UP); (c) MM2011-T23A-F216 (dextral, WS4, MM-LOW, image has been lightened); (d) MM2017-T32A-F11690 (dextral, WS4, MM-UP); (e) MM2017-32A-F10548 (WS4, MM-UP).
Quaternary 08 00044 g008
Figure 9. M1 morphology across the wear stages 1–5: (a) MM2014-T32-F37 (dextral, WS1, MM-UP); (b) MM2012-T27-WF13 (dextral, WS2, MM-LOW); (c) MM2015-T32C-FS105 (sinistral, reversed, WS3, MM-UP); (d) MM2015-T32D-FS56 (sinistral, reversed, WS3, MM-UP); (e) MM2015-T32C-F1175 (dextral, WS4, MM-UP); (f) MM2015-T32F-F809 (dextral, WS5, MM-UP, NB: no measurements recorded).
Quaternary 08 00044 g009
Figure 10. M2 morphology across the wear stages 1–5: (a) MM2016-T32A-F6191 (sinistral, WS1, MM-UP); (b) MM2015-T32F-F810 (dextral, reversed, WS2, MM-UP); (c) MM2012-T23A-F1331 (sinistral, WS3, MM-LOW, posterior lamina wall is chipped); (d) MM2019-T32F-F15545 (dextral, reversed, WS4, MM-UP); (e) MM2016-T32A-F4064 (sinistral, WS4, MM-UP, posterior lamina wall is chipped); (f) MM2023-T32H-F16166 (sinistral, WS5, MM-UP).
Quaternary 08 00044 g010
Figure 11. M3 morphology across the wear stages 1–5: (a) MM2019-T32G-F14015 (dextral, WS1, MM-UP); (b) MM2019-T32F-F14331 (sinistral, reversed, WS2, MM-UP); (c) MM2012-T27B-F4913 (dextral, WS3, MM-LOW); (d) MM2016-T32B-F6472 (sinistral, reversed, WS3, MM-UP); (e) MM2014-T32C-F84 (dextral, WS4, MM-UP); (f) MM2016-T32B-F4118 (dextral, WS4, MM-UP); (g) MM2023-T32B-F16048b (sinistral, reversed, WS5, MM-UP).
Quaternary 08 00044 g011
Figure 12. Mandibular dentary and molar row morphology. (ac) MM2011-T24-F77 (dextral, WS2, MM-LOW); (df) MM2013-T32-F1031 (sinistral, WS2, MM-UP).
Quaternary 08 00044 g012
Figure 13. m1 morphology across the wear stages 1–5. (a) MM2011-T27B-F4988a (sinistral, WS1, MM-LOW); (b) MM2014-T32D-F749 (sinistral, WS2, MM-UP); (c) MM2016-T32A-F8023 (sinistral, WS2, MM-UP); (d) MM2016-T32A-F7659 (dextral, reversed, WS3, MM-UP); (e) MM2012-T27B-F4178 (dextral, reversed, WS3, MM-LOW); (f) MM2017-T32A-F10574 (sinistral, WS4, MM-UP); (g) MM2012-T27B-F3417 (sinistral, WS5, MM-LOW); (h) MM2016-T32A-F5898 (sinistral, WS2, MM-UP).
Quaternary 08 00044 g013
Figure 14. m2 morphology across the wear stages 1–5. (a) MM2012-T27B-F2699a (sinistral, WS1, MM-LOW); (b) MM2012-T27B-F1294 (dextral, reversed, WS2, MM-LOW); (c) MM2014-T32E-F337 (dextral, reversed, WS2, MM-UP); (d) MM2017-T32B-FS102 (dextral, reversed, WS3, MM-UP); (e) MM2015-T32B-F2527 (sinistral, WS3, MM-UP); (f) MM2012-T27B-F2494 (MM-LOW, sinistral, WS4; row WS3, MM-UP); (g) MM2016-T32A-F3703 (sinistral, WS5, MM-UP).
Quaternary 08 00044 g014
Figure 15. m3 morphology across the wear stages 1–5. (a) MM2015-T32C-FS33 (dextral, WS1, MM-UP); (b) MM2016-T32B-F3610a (sinistral, reversed, WS2, MM-UP); (c) MM2014-T32D-F720 (dextral, WS2, MM-UP); (d) MM2015-T32C-FS42 (dextral, WS3, MM-UP); (e) MM2014-T32D-FS50 (sinistral, reversed, WS4, row WS5, MM-UP); (f) MM2014-T32C-F1083 (dextral, WS5, MM-UP); (g) MM2023-T32G-F3703 (indet., WS5, MM-UP, not measured).
Quaternary 08 00044 g015
Figure 16. Molar roots (lingual, occlusal, buccal, and basal views). All depicted molars are from MM-UP. The maxillary molars are sinistral; the mandibular molars are dextral. The basal views are labelled with the observed root frequencies. M1: MM2014-T32C-FS91 (WS3); M2: MM2014-T32C-F527 (WS5); M3: MM2019-T32F-F14697 (WS2–3). m1: occlusal and lateral MM2013-T32-F1058 (WS2), basal MM2023-T32G-F15980 (WS2); m2: MM2017-T32-FS97 (WS3); m3: MM2016-T32A-F14569-(WS3). Some of the image orientations are non-standard to better display the root formation.
Quaternary 08 00044 g016
Figure 17. Mean and whisker plots (mean, standard error, and whisker length of 1SD) showing the comparative maxillary molar width and crown lengths. MM-LOW, MM-UP, Hooijeromys nusatenggara (H. nusa.), Papagomys verhoeveni maxillary molar row reassigned to P. armandvillei (P. verh. LT), P. armandvillei Liang Toge (P. arm. LT), P. armandvillei Recent (P. arm. R).
Quaternary 08 00044 g017
Figure 18. Mean and whisker plots (mean, standard error, and whisker length of 1 SD) showing the comparative mandibular molar widths, crown lengths, and incisor widths of MM-LOW, MM-UP, Hooijeromys nusatenggara (H. nusa.), Papagomys theodorverhoeveni Liang Toge (P. theo. LT), P. armandvillei Liang Toge (P. arm. LT), and P. armandvillei Recent (P. arm. R).
Quaternary 08 00044 g018
Figure 19. Comparative maxillary morphological characteristics. The images from which these outline traces were derived are in Figure 2a,c and Figure 8a.
Quaternary 08 00044 g019
Figure 20. Comparative mandibular morphological characteristics. The images from which these outline traces were derived are in Figure 2a–c and Figure 12c.
Quaternary 08 00044 g020
Table 1. Large Papagomys group finds from Liang Bua stratigraphic units 1B, 2, and 8C.
Species1B (120–60 kya)2 (60–50 kya)8C (≤3 kya)
Papagomys armandvillei11 4
Papagomys theodorverhoeveni792
Hooijeromys cf. nusatenggara4 2
Papagomys sp. 21
Table 2. Occlusal wear stage (WS) estimates (maxillary and mandibular molars).
Estimated Wear StageOcclusal Characteristics
WS1 (Juvenile)Nearly unworn, little or no merging of the cusps
WS2 (Young Adult)Lightly worn, cusps discrete and/or discernible
WS3 (Adult)Nearly all, or all, cusp rows form discrete laminae
WS4 (Old Adult)Laminae are beginning to merge
WS5 (Senescent)Occlusal surface mostly a single dentin pool
Table 3. Mata Menge species variability (V’). Numbers in brackets are the sample sizes; the mean of a likely single species is in bold. Results falling outside of 1 SD (standard deviation) of the species mean are underlined. Outliers refers to the Mata Menge small and medium molar widths and the isolated M1 of Spelaeomys florensis.
WM1WM2WM3Wm1Wm2Wm3
Freudenthal and Martín Suárez
(Table 2 in [46])
V’/√logN Mean(183)
13.02
(144)
14.15
(84)
19.26
(192)
15.89
(163)
14.30
(99)
16.57
SD3.955.267.135.244.335.46
Range9.07–16.978.89–19.4112.13–26.3910.65–21.139.97–18.6311.11–22.03
Mata MengeAll molars, including outliers(110)
43.11
(107)
44.13
-(123)
42.03
(135)
43.50
(103)
44.77
All molars, excluding outliers(103)
14.82
(105)
19.15
(92)
18.07
(118)
16.79
(132)
16.98
(96)
16.81
MM-LOW, excluding outliers(7)
13.90
(6)
20.10
(4)
15.08
(21)
17.66
(20)
12.66
(12)
12.89
MM-UP, excluding outliers(96)
12.65
(99)
14.30
(88)
13.72
(97)
13.25
(112)
16.21
(84)
13.92
Table 4. Summary statistics of the Large Mata Menge maxillary and mandibular finds. Measurements (widths and lengths) in mm. Refer to Tables S1 and S2 for raw data.
(a)
MaxillaryStatisticAlveolar LCrown LWM1WM2WM3M2/M1M3/M1M3/M2LM1LM2LM3W/L M1W/L M2W/L M3W Palate at M1WM1/W Palate
MM-LOWN21764112531531
Min.11.4810.943.573.322.680.960.740.775.393.923.390.650.890.86
Max.12.414.094.003.020.816.284.220.681.01
Mean 3.963.762.88 5.884.05 0.660.93
Std. error 0.070.100.07 0.140.09 0.010.04
Var. 0.030.070.02 0.100.02 0.000.00
St. dev. 0.190.260.14 0.320.15 0.010.07
MM-UPN6596998820111429273429273411
Min.12.0811.663.703.602.870.880.730.765.503.283.210.570.820.805.000.80
Max.13.6412.534.434.423.471.000.780.887.044.753.980.751.281.02
Mean12.6812.104.094.033.140.970.760.796.384.193.530.640.950.89
Std. error0.220.140.010.020.020.010.010.010.080.070.040.010.020.01
Var.0.290.100.020.030.020.000.000.000.180.150.040.000.010.00
St. dev.0.540.320.130.170.140.030.020.030.420.390.210.050.110.06
(b)
MandibularStatisticAlveolar LCrown LWm1Wm2Wm3m2/m1m3/m1m3/m2Lm1Lm2Lm3W/Lm1W/Lm2W/Lm3WiDiastema L
MM-LOWN9721201215101034134193
Min.10.9111.102.853.243.051.010.920.894.583.343.230.620.920.991.487.74
Max.12.2612.383.523.743.501.181.090.984.803.91 0.741.03 1.929.98
Mean11.4711.563.273.563.321.081.010.934.663.57 0.680.98 1.708.79
Std. error0.170.170.030.030.040.010.020.010.070.12 0.030.03 0.050.65
Var.0.260.200.020.010.020.000.000.000.020.06 0.000.00 0.021.27
St. dev.0.510.450.160.120.150.040.060.030.120.24 0.060.06 0.141.13
MM-UPN1614971128423161828292328292384
Min.11.4011.343.033.293.201.060.950.894.603.382.960.560.860.891.747.28
Max.12.5212.683.654.153.871.191.191.005.514.323.920.741.101.142.018.50
Mean12.0012.053.303.703.501.111.040.935.053.813.380.660.961.031.907.85
Std. error0.080.110.010.020.020.010.010.010.050.050.050.010.010.010.030.31
Var.0.110.180.020.030.020.000.000.000.080.080.060.000.000.000.010.39
St. dev.0.330.420.140.160.140.040.060.030.280.280.250.040.050.060.100.63
Table 5. Association of the maxillary and mandibular rows.
Alveolar LengthW 1st MolarW 2nd MolarW 3rd Molar
MM-LOW articulating rowsMaxillary12.414.093.913.02
Mandibular11.893.433.663.33
Maxillary/Mandibular1.041.191.070.91
MM-UP MeansN6232416
Maxillary Mean12.684.164.023.23
N16252620
Mandibular Mean12.003.403.783.54
Mean Maxillary/Mean Mandibular1.061.221.060.91
Table 6. Mata Menge morphological frequencies: lingual spurs and accessory cusplets. Observable refers to molars where the characteristic is not obscured by wear or indeterminate due to sediment or poor preservation.
Morphological Characteristic NObservablePresentAbsentWorn/MergedIndet.
M1lingual spurTotal images6221147347
% presence 67%33%
MM-UP5519136306
MM-LOW721141
M2lingual spurTotal images67214172620
% presence 19%81%
MM-UP61193162319
MM-LOW621131
m1antero-central platformTotal images754711361612
% presence 23%77%
MM-UP55327251211
MM-LOW201541141
antero-buccal cuspletTotal images75412120925
% presence 51%49%
MM-UP5528919522
MM-LOW201312143
postero-buccal cuspletTotal images756969 42
% presence 100%
MM-UP555050 32
MM-LOW201919 1
m2antero-buccal cuspletTotal images895050 336
% presence 100%
MM-UP673838 245
MM-LOW221212 91
postero-buccal cuspletTotal images897473169
% presence 99%1%
MM-UP675655138
MM-LOW221818 31
m3antero-buccal cuspletTotal images655050 123
% presence 100%
MM-UP524141 83
MM-LOW1399 4
postero-buccal cuspletTotal images65343221912
% presence 94%6%
MM-UP52292721211
MM-LOW1355 71
Table 7. Summary statistics and raw maxillary data of Papagomys armandvillei and Hooijeromys nusatenggara from Musser (1981) and Hooijer (1957). Excavation site (Site), Geological Period (Age): Early–Mid Pleistocene (E-MP), Mid Holocene (MH), Holocene (H); Orientation (Or.): sinistral (sin), dextral (dex); Wear Stage (WS): young adult (YA), adult (A), old adult (OA), Crown Length (Cr. L). Statistical summary means are in bold.
SpeciesSiteAgeStatisticOr.WSCr. LWM1WM2WM3M2/M1M3/M1M3/M2LM2LM3W/L M2W/L M3W Palate at M1WM1/
W Palate
Papagomys armandvilleiLiang TogeMH10sinYA 5.25.0 0.96 5.3 0.94
P. verhoevenidexA14.14.64.43.60.960.780.824.63.90.960.924.81.0
RecentHN 8888888333366
Minimum 14.64.34.33.60.90.80.84.83.90.90.93.10.8
Maximum 16.05.04.94.21.00.90.95.24.10.91.05.11.6
Mean 15.394.714.543.900.970.830.864.973.970.910.974.131.20
Std. error 0.170.080.060.070.010.020.010.120.070.010.030.360.12
Variance 0.220.060.030.040.000.000.000.040.010.000.000.790.09
Stand. dev. 0.470.240.180.190.030.050.030.210.120.020.050.890.30
Hooijeromys nusatenggaraOla BulaE-MP1 (Holotype)dexYA12.44.13.82.90.930.710.763.73.21.030.913.81.1
Ola Bula2dexOA11.53.73.62.80.970.760.78 5.00.7
Boa Leza3dexA 3.0
Table 8. Summary statistics and raw mandibular data of Papagomys theodorverhoeveni, P. armandvillei, and Hooijeromys nusatenggara mandibular data from Musser (1981) and Hooijer (1957). Excavation site (Site), Geological Period (Age): Early–Mid Pleistocene (E-MP), Mid Holocene (MH), Holocene (H); Orientation (Or.): sinistral (sin), dextral (dex); Wear Stage (WS): young adult (YA), adult (A), old adult (OA), Crown Length (Cr. L). Statistical summary means are in bold. * Approximate due to being a partial isolated molar.
SpeciesSiteAgeStatisticOr.WSCr. LWm1Wm2Wm3m2/m1m3/m1m3/m2L m1L m2L m3Wi
Papagomys armandvilleiLiang TogeMHN 41065654 3
Minimum 15.33.94.54.21.050.980.93 2.6
Maximum 16.14.54.94.71.121.10.96 2.7
Mean 15.754.224.704.461.101.040.956.24.74.82.67
Std. error 0.170.060.080.090.010.020.01 0.03
Variance 0.120.040.040.040.000.000.00 0.00
Stand. dev. 0.340.190.190.210.030.040.020.20.30.10.06
RecentHN 8888888
Minimum 13.83.74.13.91.050.980.91
Maximum 164.44.84.51.111.050.98
Mean 15.094.054.364.101.081.010.94 5.7
Std. error 0.290.070.070.070.010.010.01
Variance 0.690.040.040.040.000.000.00
Stand. dev. 0.830.190.200.200.020.030.02 0.3
Papagomys theodorverhoeveniLiang TogeMHN 11161091098 6
Minimum 12.03.53.63.31.00.830.83 2.0
Maximum 14.04.24.24.01.11.080.98 2.2
Mean 13.183.844.013.611.050.940.90 2.10
Std. error 0.220.060.050.070.010.020.02 0.04
Variance 0.530.050.030.040.000.000.00 0.01
Stand. dev. 0.730.220.170.200.030.070.05 0.09
Hooijeromys nusatenggaraBoa LezaE-MP4sinA 3.2 *
5sinYA 3.5
Table 9. Comparative species variability (V’): Numbers in brackets are the sample sizes; the mean of a likely single species is in bold. Results falling outside of 1 SD (standard deviation) of the species mean are underlined.
WM1WM2WM3Wm1Wm2Wm3
Freudenthal and Martín Suárez
(Table 2 [46])
V’/√logN Mean(183)
13.02
(144)
14.15
(84)
19.26
(192)
15.89
(163)
14.30
(99)
16.57
1 SD3.955.267.135.244.335.46
Range9.07–16.978.89–19.4112.13–26.3910.65–21.139.97–18.6311.11–22.03
P. armandvillei Recent(8)
15.51
(8)
14.03
(8)
16.40
(8)
18.19
(8)
17.13
(8)
15.59
P. armandvillei Liang Toge---(10)
14.29
(6)
9.65
(5)
13.29
P. armandvillei Liang Toge and Recent(10)
18.95
(10)
15.56
(9)
16.16
(18)
17.42
(14)
16.79
(13)
18.05
P. armandvillei Liang Toge and Recent, MM-LOW and MM-UP(113)
22.75
(115)
28.75
(101)
34.19
(136)
33.82
(146)
30.45
(109)
33.22
P. theodorverhoeveni Liang Toge---(16)
16.79
(10)
14.63
(9)
19.91
P. theodorverhoeveni and P. armandvillei Liang Toge---(26)
21.02
(16)
28.90
(14)
35.34
P. theodorverhoeveni and P. armandvillei Liang Toge and Recent---(34)
20.20
(24)
25.73
(22)
30.21
P. theodorverhoeveni and MM-LOW---(37)
31.52
(30)
21.76
(21)
24.16
P. theodorverhoeveni and MM-UP---(113)
24.45
(122)
16.91
(93)
16.38
P. theodorverhoeveni, MM-LOW and MM-UP---(134)
27.76
(142)
17.69
(105)
19.26
H. nusatenggara, P. armandvillei Liang Toge and Recent(12)
31.05
(12)
29.95
(12)
35.46
(19)
28.04
-(15)
35.13
H. nusatenggara and P. theodorverhoeveni---(17)
23.72
-(11)
24.50
H. nusatenggara and MM-LOW (9)
13.33
(8)
18.93
(7)
12.75
(22)
17.58
-(14)
12.51
H. nusatenggara and MM-UP(98)
12.62
(101)
14.27
(91)
15.34
(98)
13.25
-(86)
15.95
H. nusatenggara, MM-LOW and MM-UP (105)
14.79
(107)
19.11
(95)
18.06
(119)
16.78
-(98)
16.77
Disclaimer/Publisher’s Note: The statements, opinions and data contained in all publications are solely those of the individual author(s) and contributor(s) and not of MDPI and/or the editor(s). MDPI and/or the editor(s) disclaim responsibility for any injury to people or property resulting from any ideas, methods, instructions or products referred to in the content.