1. Introduction
Evaluating a cultural asset not only involves comprehending its given historical–artistic value but also the need to characterize the material from which it is made, to plan its recovery and conservation, to adopt new methods and tools for conservation, and to foresee future exhibition dangers. This analysis provides information that can be used for diagnoses and decisions concerning the state of an item, the best method for its conservation, and a clearer portrait of the context of its ancient origins. Each technique used for the study of materials can be applied satisfactorily in the field of archaeometry as long as it is non-destructive, non-invasive, adaptable to the various shapes and materials of items under investigation, and provides quantitative accuracy and speed of execution. The techniques analyzed in this review, from the most traditional to the most modern still under study, have in common these fundamental characteristics in the field of diagnostics.
Recent steps forward in the cultural heritage sector are moving toward the muons, which are particles with a mass 207 times greater than that of the electron. They are produced by the interaction between cosmic rays and the atoms of gases present in the highest point of the earth’s atmosphere. Muons can be used in imaging techniques, by positioning a detector that allows the direction of the muon to be recorded after passing through the structure. It is therefore possible to have an idea of the structure’s composition based on the attenuation of the muon flux. This, in turn, depends on the length and density of the material through which the muons are passed [
1]. The technique can be used for the tomographic study of objects of various dimensions, from coins up to the macroscopicity of the pyramids.
Electron beam processing is another avant-garde diagnostic technique. It is a process that involves using high-energy electrons to process an object for different aims. Some application uses for electron irradiation include the crosslinking of polymer-based products to improve the mechanical, thermal, and chemical properties of materials; the degradation of materials often used in recycling; and the sterilization of medical and pharmaceutical items. In the context of cultural heritage, electron beam technology has the potential to provide a new approach to reduce the effects of organic contaminant degradation of precious artifacts by providing a totally non-invasive recovery and conservation technique [
2].
New characterization techniques are based on transmission electron microscopy (TEM), where orientation imaging is combined with 3D precession electron diffraction tomography and applied to cultural heritage. Such techniques can be considered as an alternative to synchrotron-based techniques and allow the accurate distinguishing of unit cell parameters, crystal symmetry, atomic structure, and orientation/phase mapping of various crystals on the nanometer scale [
3].
These represent nascent techniques whose potential in cultural heritage diagnostics is highly promising.
In this review, however, a detailed picture is provided only of the widely used techniques that are micro-destructive and non-invasive, which can be used both in the laboratory and in situ, as well as Raman spectroscopy, X-ray fluorescence, laser ablation, IR spectroscopy, LIBS, and Thz spectroscopy. Through the collection and comparative analysis of the most recent literature (2020–2022), we aim to analyze the new trends in archaeometric analysis and laboratory techniques, focusing on determining the provenance, the physical–chemical characteristics, and the state of decay of archaeological finds. It is highlighted that these techniques were chosen by the authors for the constantly growing potential they offer in the field of cultural heritage.
Considerable progress has been made in the application of these techniques both in the three-year period analyzed by the authors and in the following years. For example, Romano et al. [
4] published some relevant studies on macro- and micro-XRF imaging; recent developments have been proposed and published by Chiriu et al. [
5], including SORS and micro-SORS imaging methods.
We are aware that the selected techniques do not represent the entire spectrum of instrumental applications, but for this reason, we have made the choice to start from the most historically rooted techniques and to consider the most recent ones. This review has value based on the techniques considered and not in absolute terms.
The article is structured in five parts, with an introduction, which specifies the objectives of this review and the molecular analysis techniques taken into consideration for the evaluation of research trends in the three-year period of 2020–2022; the second chapter is the methods, which explains on which platforms the bibliographic research was carried out and with what criteria, in addition to the use of the Google Trends app to verify what the intensity of the research of these online techniques was, beyond the pure research interest; the third chapter is on the state of the art, in which the papers for each technique taken into consideration are analyzed, explaining the matrix/materials and specific applications in tables; the fourth chapter presents the search data in which the Google trends are analyzed with graphs of the quantitative results and the geographical distribution of the countries in which the search was carried out; finally, the last chapter contains the final considerations.
2. Methodology
This review aims to analyze new trends in archaeometric analysis (not all of the heritage science) and laboratory techniques for determining the provenance, the physical–chemical characteristics, and the state of decay of archaeological finds of different types (ancient manuscripts, paintings, frescoes, and ceramics). This will provide guidelines in order to plan for the right conservation and restoration strategies. It was developed through the analysis of the scientific bibliography published in international journals, and the search was carried out on three popular platforms (Scopus, Web of Science Core Collection, and Google Scholar), taking into account for each platform their search criteria, Boolean operators, and also limitations.
The bibliographic search was restricted to a three-year period (2020–2022) and focused on six non-invasive and non-destructive molecular analysis techniques (Raman spectroscopy, X-ray fluorescence, laser ablation, IR spectroscopy, LIBS, and Thz spectroscopy), in order to define the trends of scientific interest and new applications in archaeometry, following a criterion for selecting papers that considered those with a higher impact on the scientific community for relevance ranking, the number of citations, and the number of downloads.
The search on online platforms was carried out by combining the keywords of the specific six techniques considered with the words “archaeometry” or “cultural heritage”.
The comparative analysis of the bibliography allowed us to extrapolate from each paper the main elements of comparison linked to the technique, the artifacts (matrix), and the specific application sectors for which each study was aimed, reported in specific summary tables and
supplementary documents. In these tables, only the data relating to the matrices and applications of the main papers taken into consideration are reported. Furthermore, these 6 tables are the short form of other detailed tables (
Supplementary Materials), in which the main aims, materials and research problems, methods and instruments, results and/or criticism, application fields, and new perspectives of each paper have been summarized.
In order to associate the bibliographic analysis with that of free online searches with the Google search engine, we used the Google Trends app, which allowed us to quantify the number of searches for that specific item in a given period of time, while also defining the geographical areas affected by a greater or lesser density of research.
Since the objective of the review is to understand the new research trends in this field of study, even the searches, carried out by external users via Google, take on a specific and quantitative meaning, which demonstrates the will of scholars, researchers or private professionals, and companies to verify the consistency and presence of scientific publications relating to the different techniques analyzed. For this reason, the research was carried out directly using the keywords of the techniques and filtering and interpreting the results obtained. For example, in the paragraph dedicated to laser ablation, it was specified that, since this is a technique used in many aspects of daily life, such as for the removal of tattoos, the number of searches was higher than for the other techniques, and therefore, in reading the quantitative data, this aspect also had to be considered.
This is an interesting piece of data because in general, it could allow us to connect research trends to trends in daily life habits or to the industrial strategies of emerging countries (for example, Pakistan) or more industrialized countries (for example, USA, China).
However, this app still has limitations that need to be taken into account.
Using the Google Trends app, techniques were searched, such as, “Raman spectroscopy”, “LIBS”, etc. In fact, by entering a more specific search, e.g., “Raman spectroscopy cultural heritage/archaeometric analyses” the search engine gave no results. This is a limitation of the Google app, so the results must be analyzed/evaluated carefully as in the case of laser ablation. For this technique, in fact, the higher number of searches compared to the others is justified by the fact that it is a technique used in many aspects of daily life, such as for the removal of tattoos.
3. State of the Art and Results
This chapter considers the main papers published between 2020 and 2022 for each technique taken into consideration for this review. The summary of the reading and analysis of the articles was then reported in summary tables, in which the matrices and practical applications in the different sectors are placed in parallel.
3.1. Raman Spectroscopy
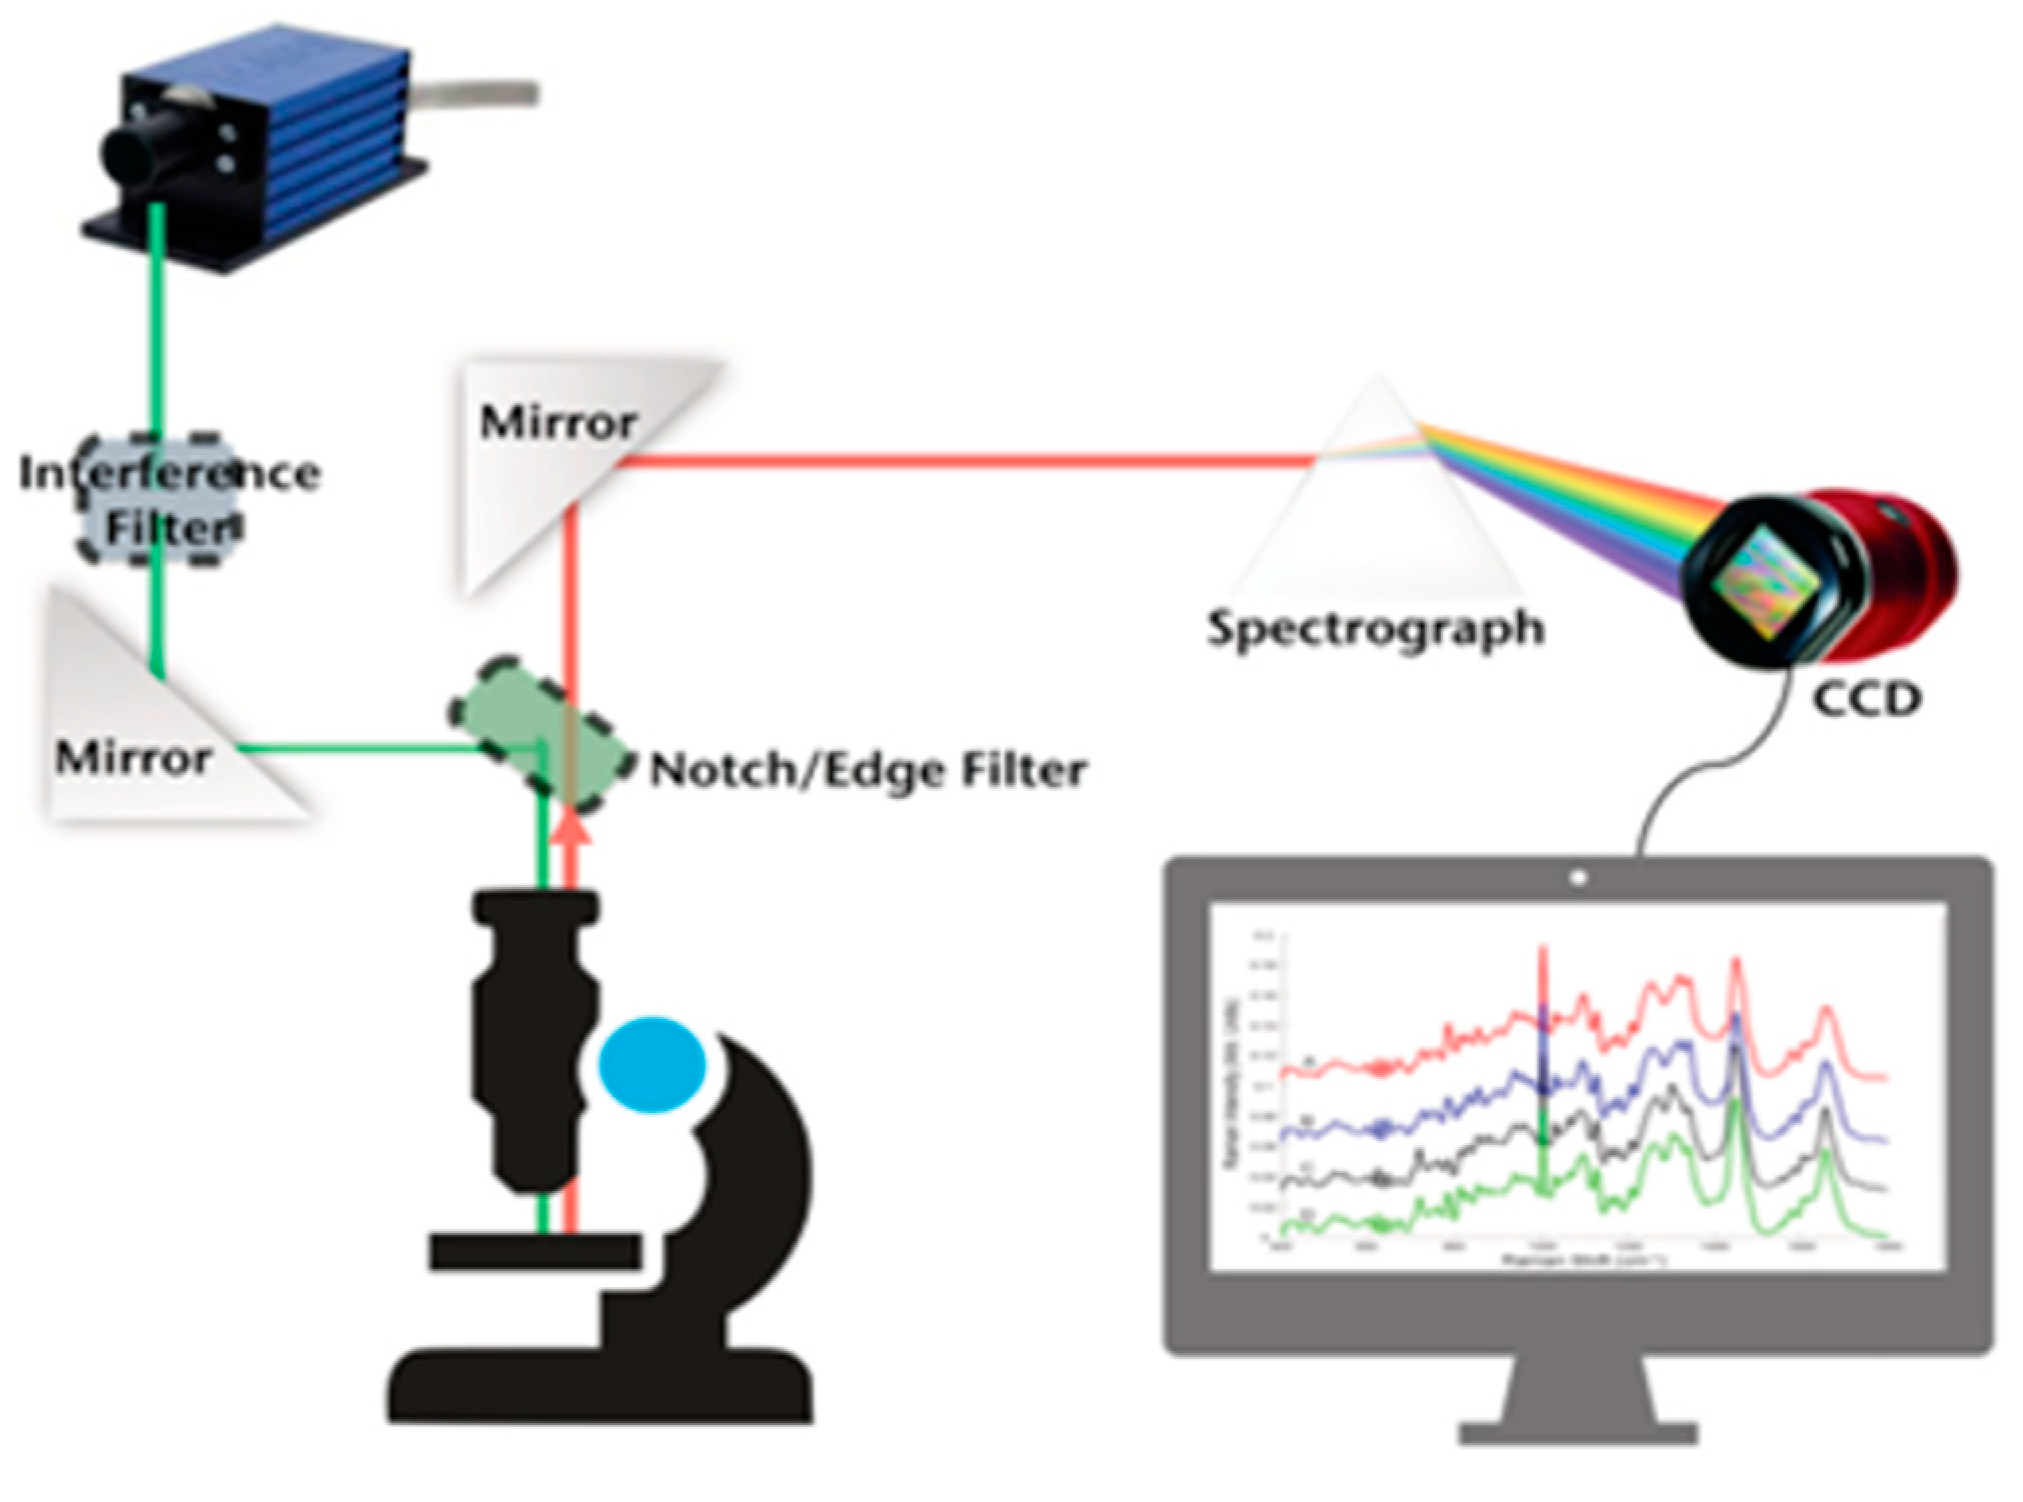
This is a vibrational-type technique based on the Raman scattering process, which occurs when a laser beam hits a molecule or set of molecules. Part of the light energy is diffused throughout the space without a change in the initial wavelength and therefore elastically diffuses in all directions without loss of energy (elastic diffusion or Rayleigh). Another small part is diffused inelastically by yielding (diffusion Raman Stockes) or acquiring (Raman antiStockes diffusion) energy in the interaction with the molecule (
Figure 1). The laser light source, by its nature, is potentially destructive, but in modern sensitive instruments, it is possible to use very low intensity, so as not to damage the material examined [
6].
Raman spectroscopy is a technique that, due to its high-performance potential, allows for quantitative and qualitative molecular analyses that have a wide range of applications in many different sectors. This is due to the non-destructiveness of the analysis and the possibility of carrying out measurements directly on site. It can be used to obtain chemical and structural information in the biological sciences (bioprocesses, virology, regenerative medicine, [
7]). It has also been used in the successful analysis of a wide range of materials: semiconductors [
8], photovoltaic technologies [
9], lithium-ion batteries [
10], and pharmaceutical products [
11], from drug discovery to formulation. It provides information on chemicals and catalysis processes [
12] and has been successfully used to investigate all aspects of a geological sample [
13]. Therefore, it is possible to note the high versatility and high performance that this technique provides in many fields of analysis [
14].
Raman spectroscopy is most commonly used in investigation methods for the conservation, authentication, and protection of artifacts, as it is able to identify the molecular composition of a large number of matrices in a non-invasive way, thus allowing for precise analyses, related to the authenticity and integrity of the archaeometric materials. The literature of the past 3 years (2020–2022), relating to diagnostics by Raman spectroscopy, allows us to define a broad range of materials that can be analyzed by composition and/or degradation (
Table 1).
The technique is very useful in actions aimed at identifying the organisms that produce alterations or the biodeterioration of cultural heritage. Perini et al. [
15] have focused their research on the study of the degradation of ancient documents through the detection of traces of microorganisms and microbial pigments; by integrating metagenomics with recent chemical (Raman spectroscopy) and physical (light transmission analysis) methods, they were able to detect the bacteria and pigments responsible for the degradation associated with purple spots present on the parchment under examination.
The Raman spectroscopy analyses conducted on ceramic tiles following cleaning with TiO
2 film allowed researchers to identify coatings on glazed tiles and to determine whether they were there or needed to be added [
16] to protect against biological deterioration, as well as the best treatment for durability with the maximum reversibility. The effectiveness of this technique is also evident in the identification of the biodeterioration of tempera paintings, as shown by Kavkler et al. [
17], who concentrated their study on the analysis of the constituents of a seventeenth-century tempera painting in order to predict the materials and positions that favor the growth of fungi and the determination of biodeterioration agents.
Raman spectroscopy is also very useful in characterizing the nature and degradation of both organic and inorganic matrices.
Zoleo et al. [
18] used SERS (Surface Enhanced Raman Scattering) to study the degradation of dyes and inks on two different types of paper, in which the chromaticity of the samples was significantly altered by artificial aging, thus allowing identification of an appropriate intervention strategy. Another non-invasive technique for the purposes of restoration on paper was carried out on ancient Romanian documents [
19] using X-ray fluorescence and IR spectroscopy. This technique allowed the identification of the inks-used in printing, the paper composition, and the nature of the stains. It is often useful to derive aging indices based on variations in Raman signals and the spectral characteristics of fluorescence [
20] to evaluate the performance and effectiveness of paper restoration treatments.
Paintings are commonly analyzed by Raman spectroscopy. For example, Retko et al. [
21] used this technique on beehive panels. Furthermore, in a study of the protein paint layers after exposure to fire, the extent of the damage, as well a restoration technique can be determined [
22]. Raman and XRF analyses are also useful for the characterization of materials and diagnostic analysis aimed at digitizing information relating to architectural monuments to create a sort of information database that can be used online to re-evaluate the cultural site under study [
23].
Raman spectroscopy is also very useful in the investigation of inorganic matrices. It has been successfully applied on glass samples [
24], by the combined investigation of the material, chemical composition, phase, flux agent, dye, cross-sectional structure, craftsmanship, and resolution of the manufacturing process.
Inorganic analyses can also be performed on minerals, such as gypsum blocks, on which it was possible to evaluate the depth of penetration of polymeric cleaning products [
25].
Another singular characterization using Raman spectroscopy was carried out on ceramic vases that were used as carriers of medicinal and/or cosmetic substances in the various areas of the Mediterranean; the study was conducted by investigating the content absorbed into the ceramic matrix of these vessels [
26].
Still in the ceramic field, through this technique, it was possible to study fragments of a vase sampled from black and white pictorial areas; the resulting data set produced new information on Apulian vascular production, enriching the knowledge of a less widespread ceramic typology and opening new perspectives on commercial and cultural exchanges [
27].
The Raman microscopy technique can be useful for detecting the type of pigments or dyes used to decorate marble matrices, as demonstrated by the study conducted by Wahba et al. [
28].
3.2. X-ray Fluorescence
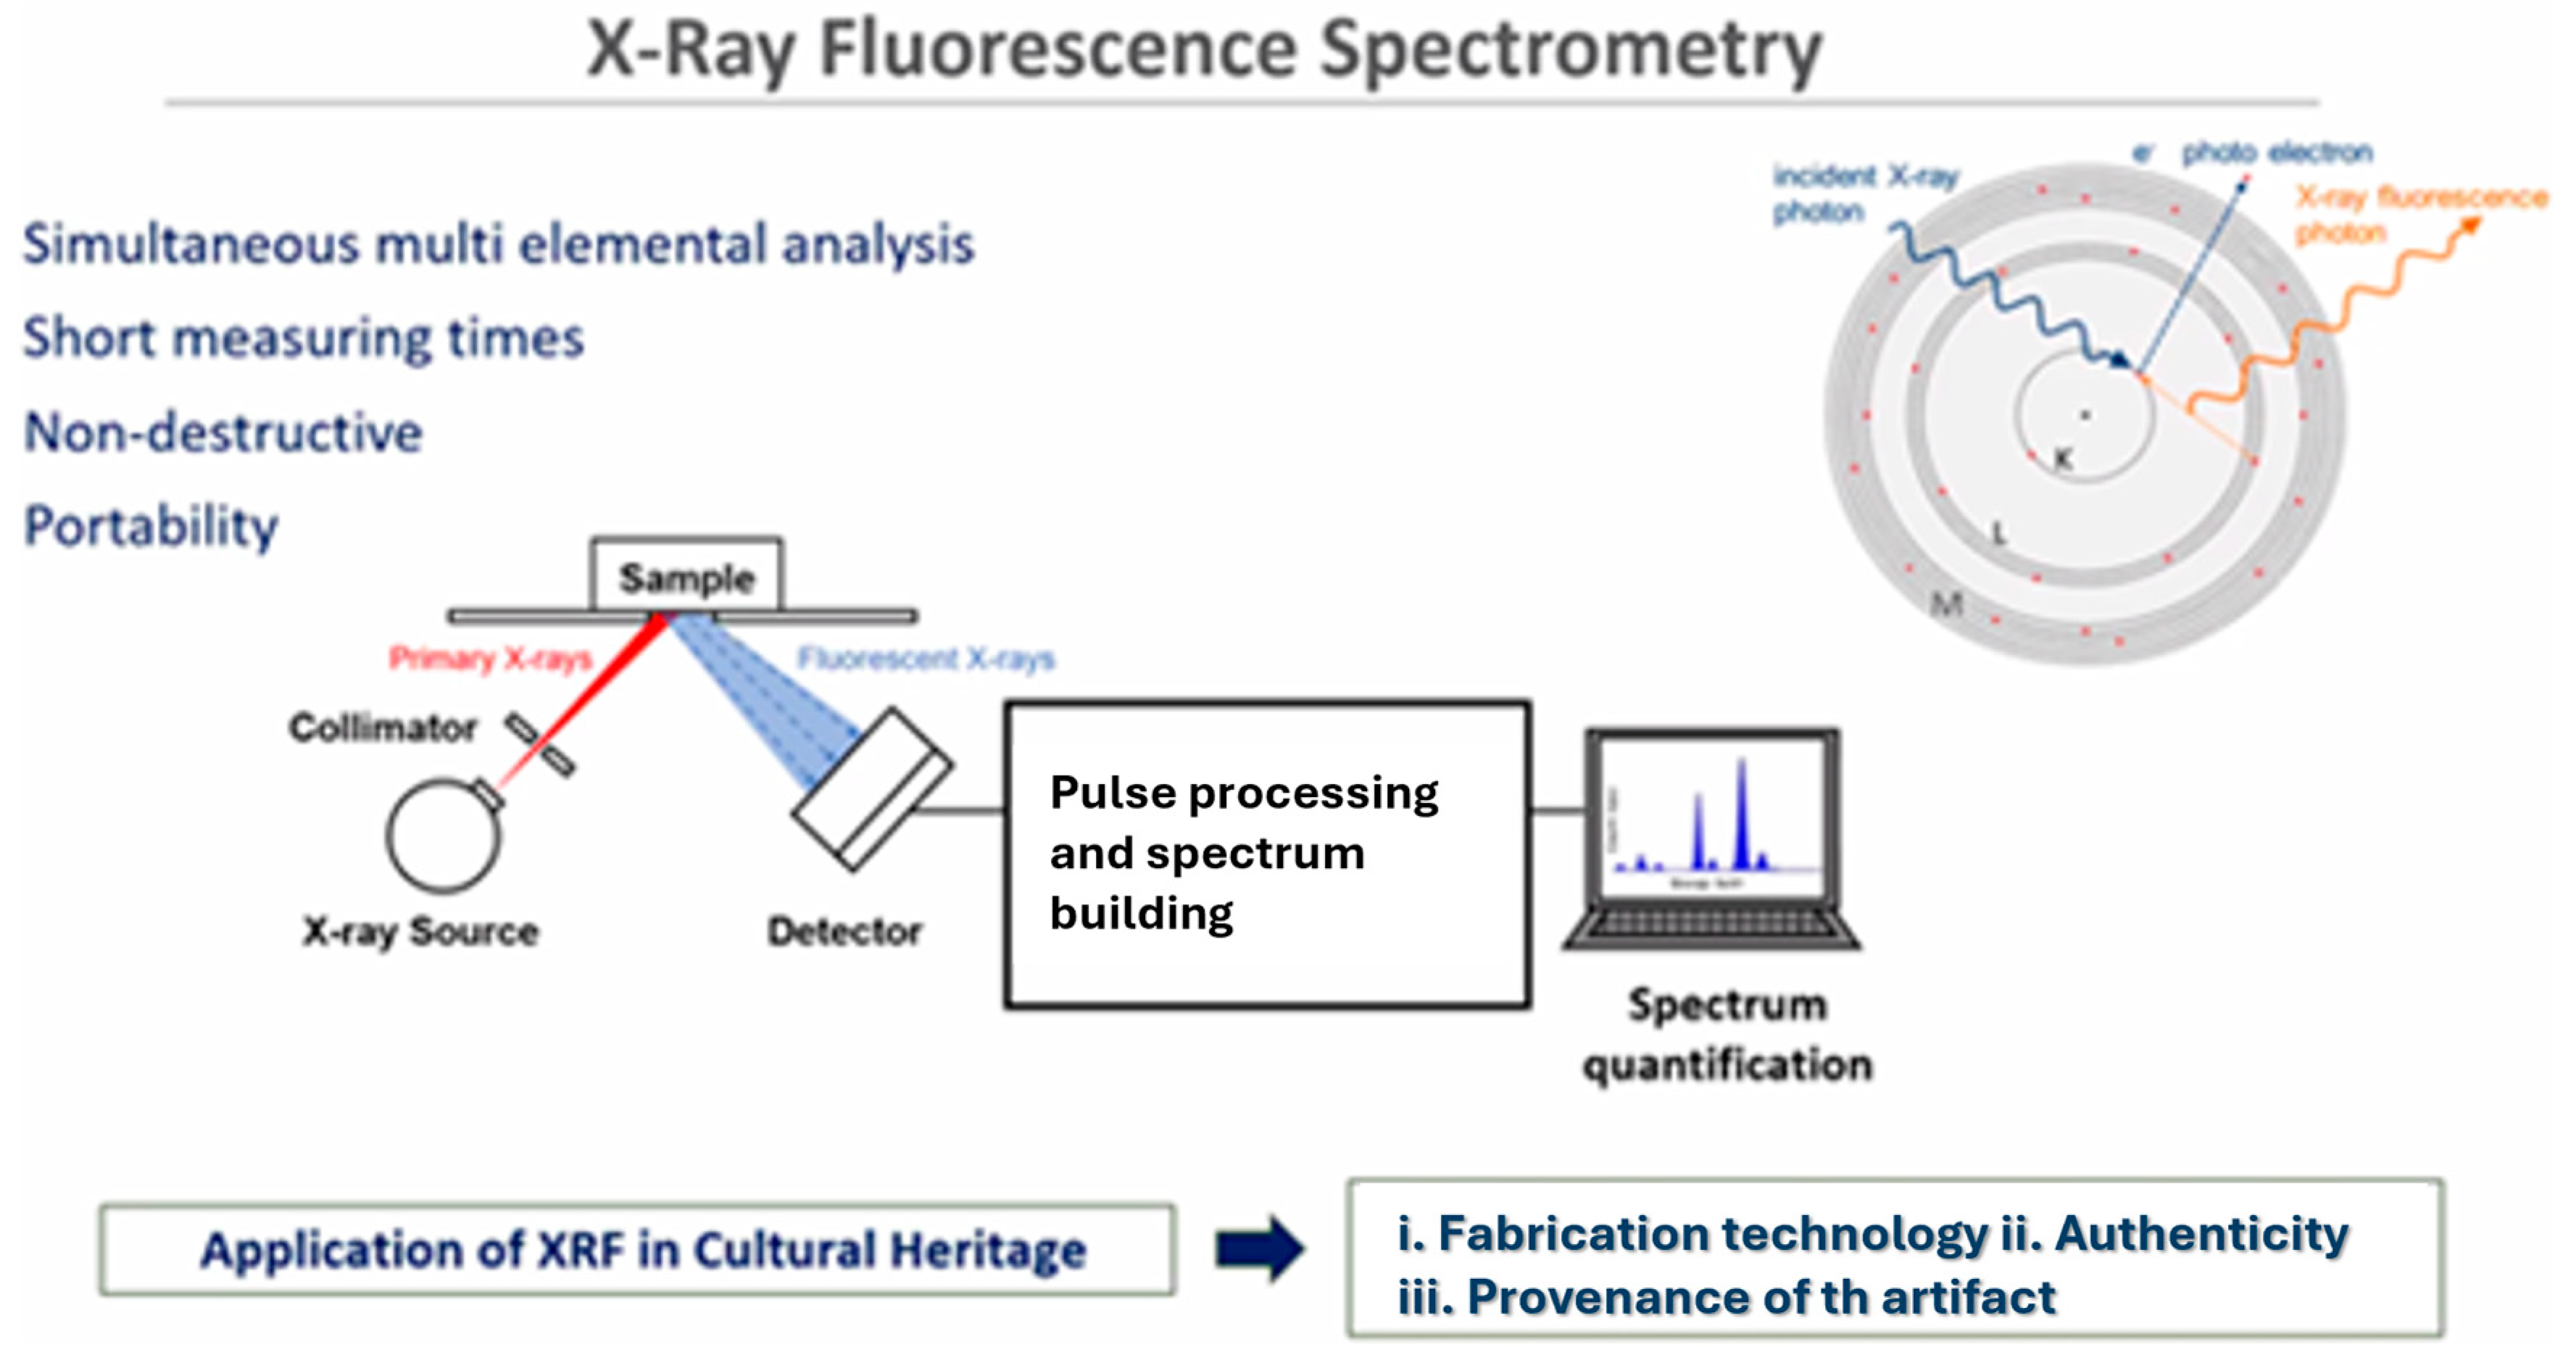
This spectroscopic technique uses a process of irradiation of a sample by primary X-rays in order to subsequently analyze secondary X-rays emitted by the sample itself. The formation of X-rays is always consequent to the appearance of a hole in the innermost orbitals of the atoms. The formation of this hole is followed by a process of electronic rearrangement of the atoms, which occurs through the emission of X-radiation. Each emitted frequency value can correspond to a particular element (although certain elements show multiple fluorescence lines); therefore, the emitted radiations are defined characteristics. The information obtained comes from the outermost layers of the analyzed surface, that is, from those that the secondary radiation emitted is able to pass through [
29]. However, the depth of penetration of the primary X-rays depends on the average Z of the area of analysis, so in organic samples (with low X-ray cross-section), the penetration of X-rays is significantly greater than high-Z matrices.
The protocol is widely used for research on metals [
30], glass [
31], ceramics [
32], and building materials [
33] and in the research fields of geochemistry, forensic science and archeology.
X-ray fluorescence (XRF) (
Figure 2) is perhaps the technique most used in these sectors, because its efficacy has been proven over time. In the 1970s, there was great acceptance of using non-destructive investigation, such as diagnostic imaging for works of art [
34]. By introducing X-ray fluorescence, the challenge was to determine if there were any additional advantages to its use. Spectroscopic investigation allows the ability to analyze the components of a material or its properties that are of importance and to search for the transformation processes, including degradation, in progress. The results are imaging techniques; however, the spectroscopic technique, which allows the identification of an organometallic compound (or of a modification within it), can often be done with a greater degree of certainty and detail [
35].
By investigating the development and applications of XRF in the literature from 1 January 2020 to 31 December 2022, it is possible to see how the technique has developed exponentially to provide a great variety of information on a wide range of materials (
Table 2).
Agua et al. [
36] analyzed the X-ray fluorescence spectra of XVI and XVII century ceramic products from Spain. The objectives were to determine the main chemical composition of the ceramic mixture and its consistency to establish the firing temperatures as well as to identify the chromophores for the coloring of the decorations. From their results, it was possible to identify a calcareous type of composition, a firing temperature between 950 °C and 1050 °C, a composition based on lead/alkaline earth metals for the glazes, and a variable quantity of spherical bubbles.
El Sebar et al. [
37] were the first to investigate the composition of the alloys of the building tools of the dome of Santa Maria del Fiore using XRF to find the best conservation strategies and to gain new knowledge of the typical production techniques of the Renaissance, discerning the different bronze and iron alloys used.
XRF is also used on sites such as palaces and monumental complexes in order to evaluate the cleaning interventions aimed at limiting the damage of biological deterioration [
38]. In the case of lichen contamination, X-ray fluorescence showed a good biocidal effect from a commercial blend of essential oils.
This technique is also useful for indicating the presence of pigments in acrylic formulations frequently used in paintings and can now be used to study a much broader set of pigments and mixtures [
39].
In the context of organic type matrices, Andrìc et al. [
40] have developed an efficient procedure for attributing the origin of the artwork in wood and cardboard, based exclusively on XRF spectral data: peak areas and spectral intensities.
3.3. LIBS
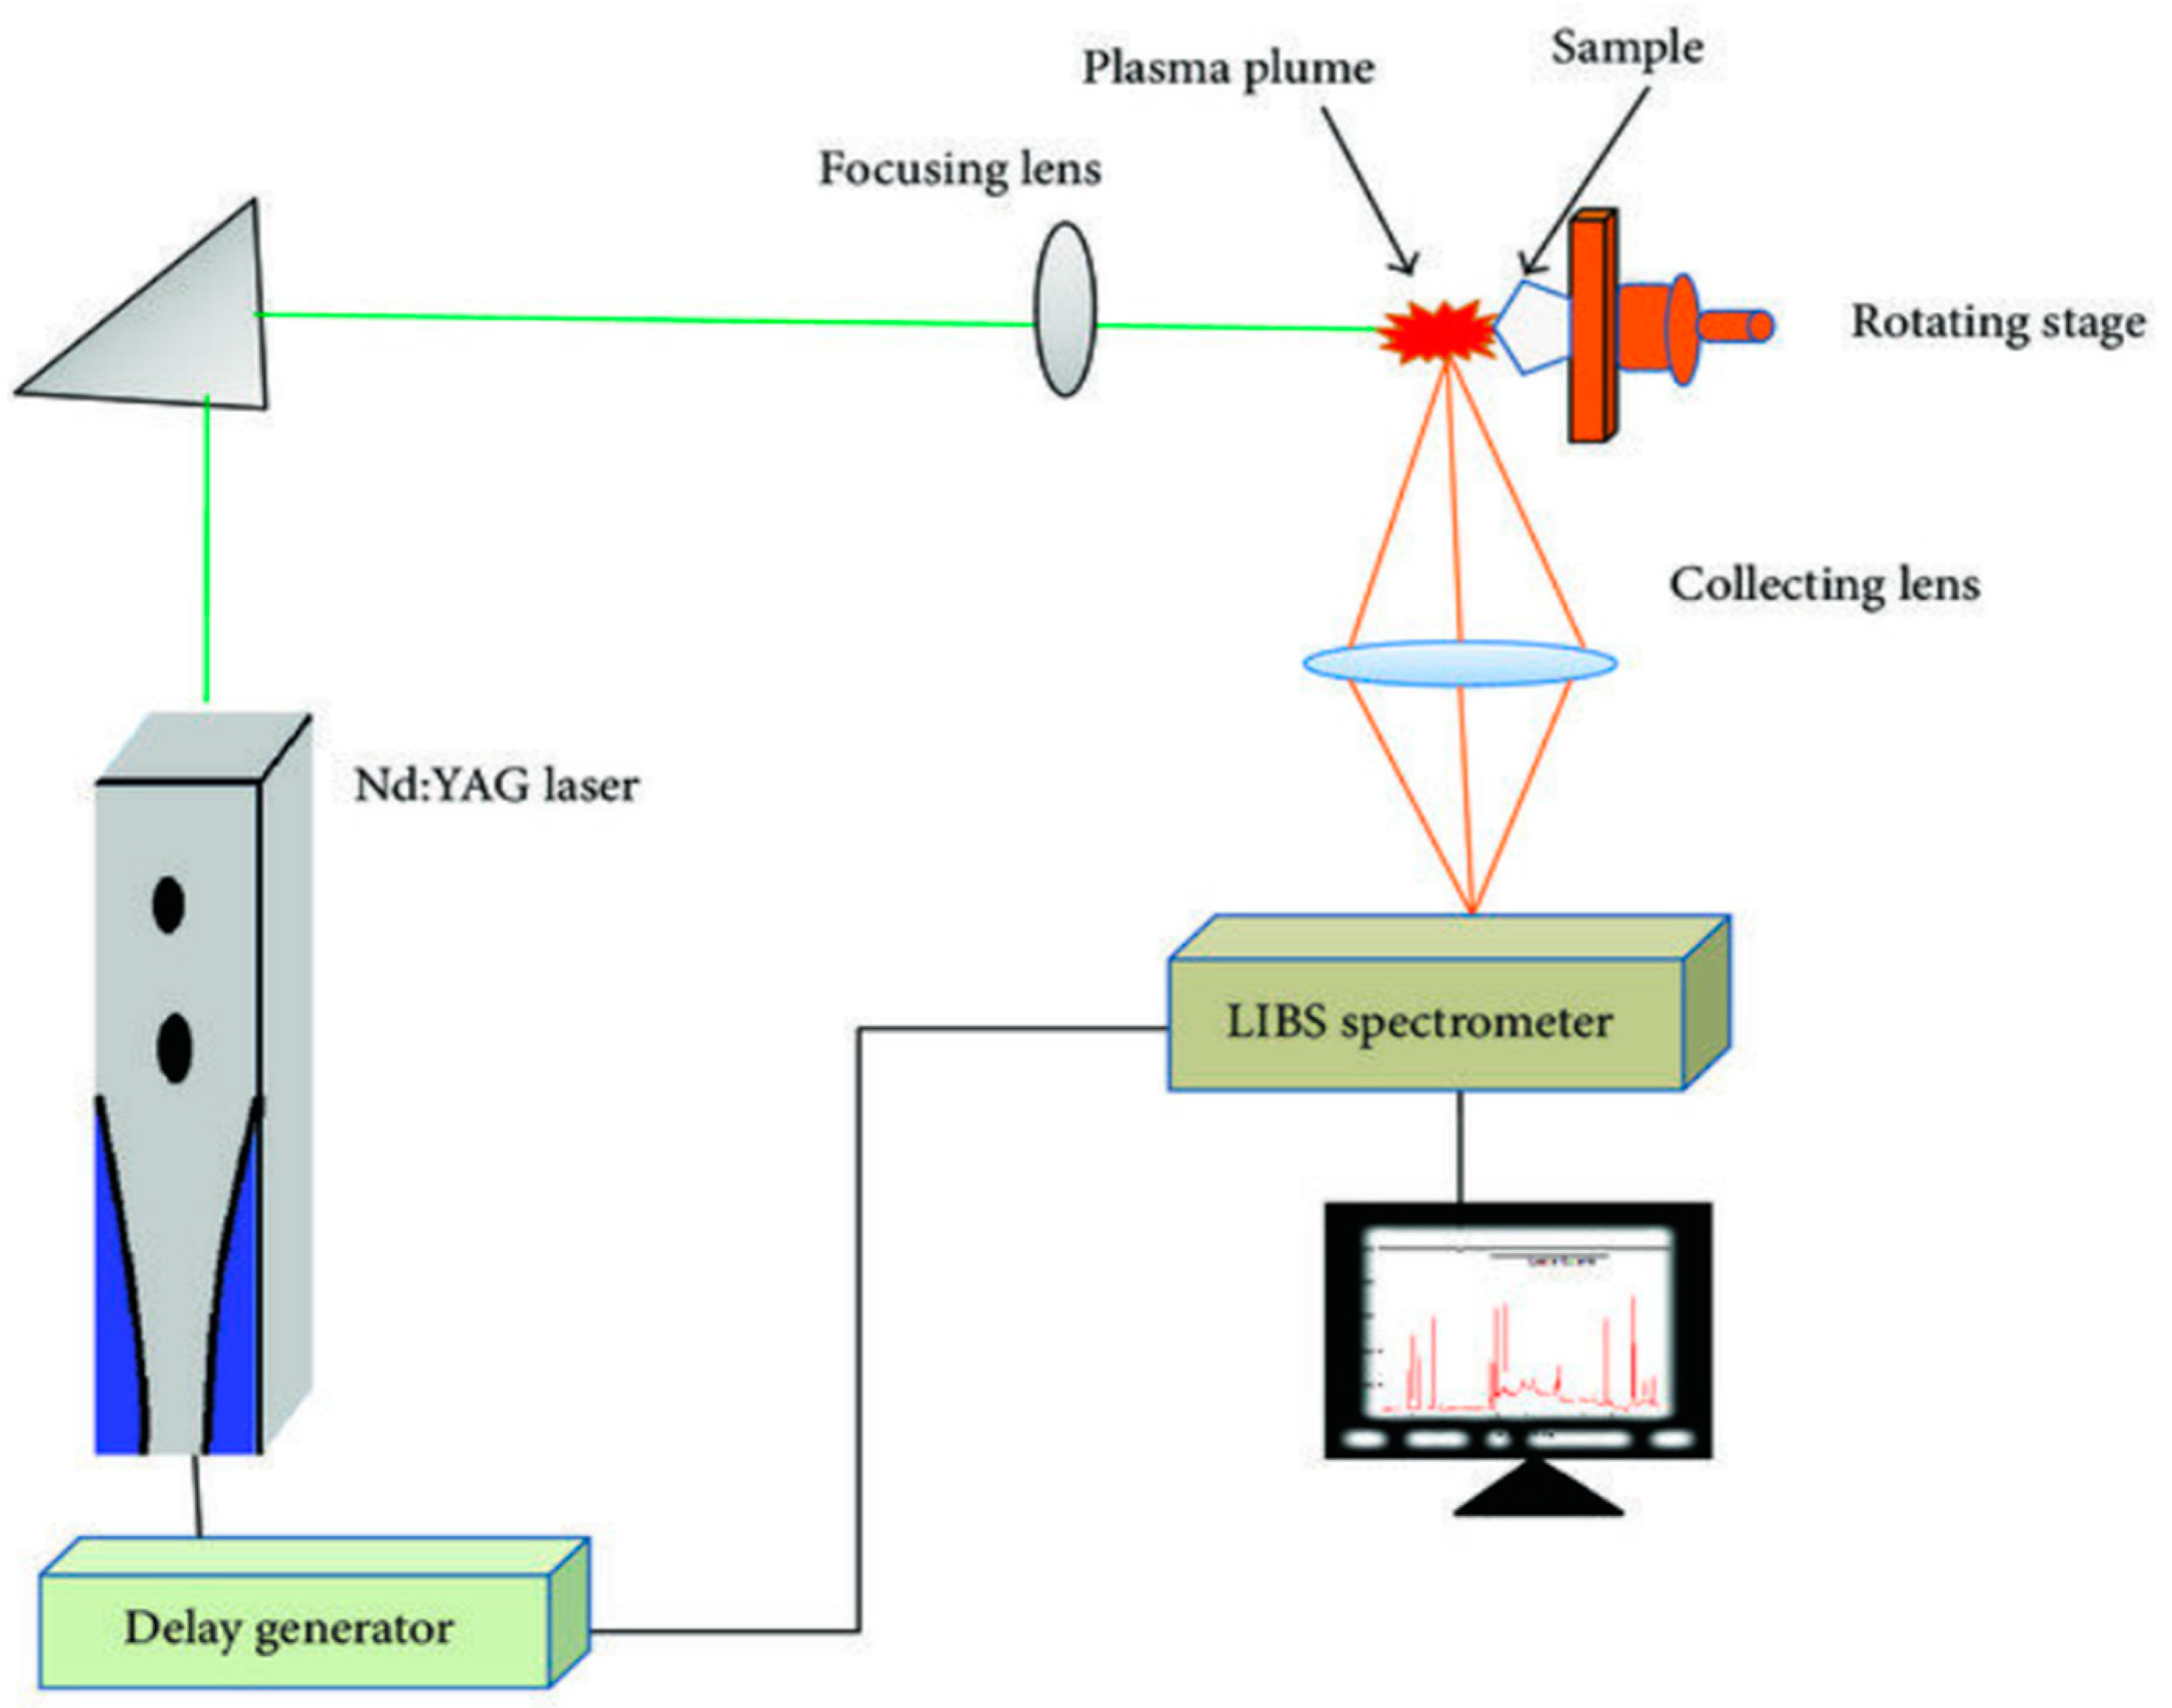
Another diagnostic methodology considers the use of laser equipment and is especially known for the characteristic of non-destructiveness. Specifically, the LIBS technique (Laser Induced Breakdown Spectroscopy) allows both qualitative and quantitative analyses to be carried out by studying the optical spectrum emitted by the plasma generated during the interaction of high-powered laser radiation and a sample that can be solid, liquid, or gaseous (
Figure 3).
Since every chemical element emits radiation of a characteristic frequency when excited at sufficiently high temperatures, LIBS is theoretically capable of detecting any element. A further advantage is the micro-destructiveness of the sample, as the only damage that occurs is the ablation of the material created by a hole at the spot of the focused laser. The laser–matter interaction vaporizes the surface of the material: this leads to the formation of an expanding plasma at high temperature (6000–20,000 K). During the expansion of the plasma, the inelastic collisions of electrons with heavy particles drive the main transition processes of the binding electrons between the various energy levels, while the concentration of charged particles within the plasma is controlled by ionization processes for electron impact and three-body recombination [
41].
This technique was developed in 1960, when the laser was invented, although it was little explored until the 1980s [
42]. Today, it is applied in various sectors, such as the environment, agri-food, biomedicine, defense, and national security or even space exploration (in fact, its use for the analysis and exploration of Mars or its use as a micro-propeller for the exact positioning of satellites is recent) [
43].
The advantages of using LIBS spectroscopy (speed, no need for sample preparation, and ease of carrying out in situ analyses) in the cultural heritage sector, in general, are now widely recognized and demonstrated. These advantages have been expanded by the development of portable systems and miniaturization (enabling in situ characterization), which allow greater flexibility, thus increasing the fields of LIBS applications (works of art located in museums, caves, historical buildings, or monuments), above all combining different spectroscopic techniques. Detelle et al. [
44] examined the development of LIBS on works of art and cultural heritage sectors in the period 2015–2020, prior to the period analyzed in this review. In recent years, LIBS has been popular for traditional applications, such as analyses of paintings, metals, ceramics, stones, textiles, and ancient bones containing collagen (
Table 3).
In the field of pigment analysis, several research groups have carried out analyses.
Huang Z et al. [
45] combined LIBS with 3D laser scanners. They provided complete information on the color, surface relief, and chemical composition of mural fragments of the Naxi ethnic civilization, in the province of Yunnan, in the southwest of China.
Pagnin L. et al. [
46] focused on identifying modern paints composed of inorganic pigments and organic binders, characterizing contemporary art materials by comparing the LIBS spectra of the acrylic, alkyd and styrene-acrylic binder in the range od 450–660 margin no. The PCA (Principal Component Analysis) of the pure materials was obtained, allowing the composition of the materials to be determined.
Malloy A. et al. [
47] investigated the usefulness of LIBS and digital imaging for the analysis of oil paint pigments in order to date, authenticate, and identify them indirectly. They used digital image processing and algorithms to analyze pure and mixed pigments in single and multilayer samples.
Oujja M. et al. [
48] investigated the chemical and physical characteristics of pictorial layers in grisaille, a style of painting that is carried out on the inner side of glass to add some pictorial effects otherwise impossible due to the chromatic uniformity of the glass, on historical windows of different Spanish provenance and chronology.
The LIBS technique is also useful to obtain information on stone-type materials. In fact, Senese et al. [
49] used LIBS to analyze a limestone fragment of the Castello Svevo in Bari (Italy). The piece showed a superficial decay with a black crust. C, Mg, and Ca were identified as the main constituents of the unaltered limestone, while the degraded surface was characterized by the presence of Al, Si, and Fe attributable to particles of atmospheric pollutants deposited on the surface, plus smaller quantities of Na and K due to the marine aerosol that pervades the urban sector where the monument is positioned.
Richero S. et al. [
50] characterized the elemental composition of three lime mortar samples from three different geographical locations: Angers (France), Dardilly (France), and Pompeii (Italy). The ability of micro-LIBS to discriminate newly formed carbonates of lime from geological carbonates allows for the improvement of dating methods for structures.
Ruan et al. [
51] performed LIBS experiments on 35 archaeologists’ samples of Chinese pottery to investigate the origins of the objects. These were found to consist of a variety of chemical elements, and their spectral lines were identified based on the NIST database.
The LIBS technique is also particularly useful for the recognition and classification of metal objects, as demonstrated by Fortes et al. [
52], allowing the constituents of the sample to be determined.
3.4. Laser Ablation
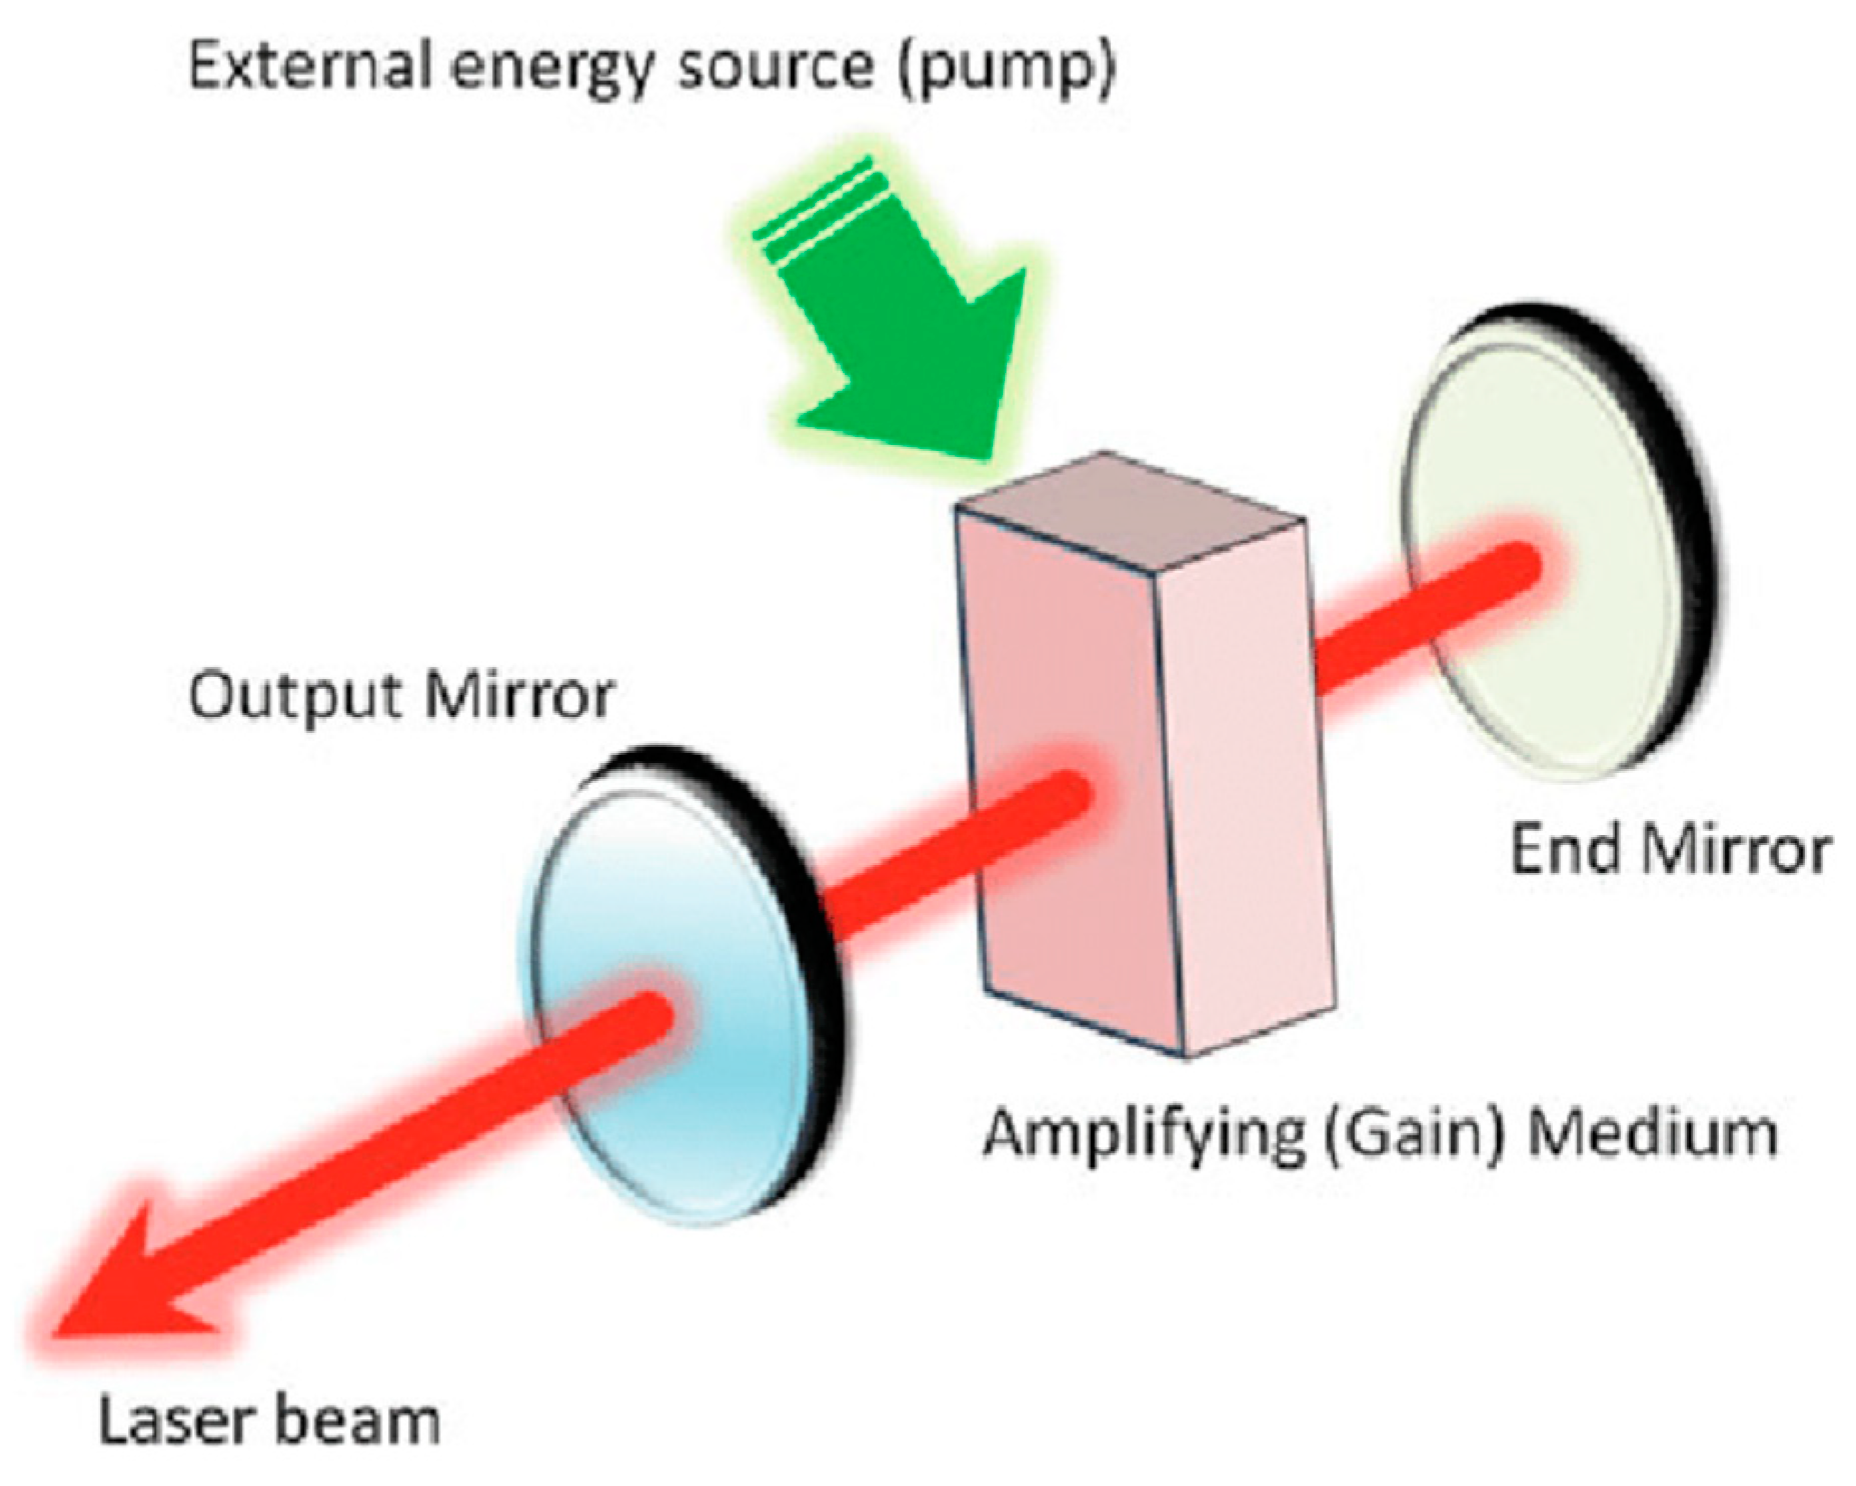
This is one of the most important radiating effects that can be performed on optically absorbing materials. The process is based on the removal of material from a solid surface using a laser beam. Laser cleaning is a special case in which a specific substrate is brought back to light by removing unwanted layers (
Figure 4). The use of lasers for the restoration of works began in the 1970s, but the technique began to grow in the late 1990s when scientific studies [
53] validated the effectiveness of its use for the cleaning of masterpieces. The laser emission parameters have also been optimized to ensure safe and efficient cleaning of different substrates. It was initially applied only in the removal of black crusts from white marbles, but now, it is also used on other materials, such as metals, gilded bronzes, wood, ceramics, and mural paintings, offering many advantages over traditional methods in terms of graduality, self-termination, selectivity, environmental impact, and safeguarding the so-called “patina of time” [
54].
In addition, the laser systems in the laboratory are very easily transportable, thus allowing easy movement of the sources in situ and avoiding the taking of samples from works of art [
55]. The literature from 1 January 2020 to 12 December 2022 shows the enormous variety of materials that can be re-evaluated by laser cleaning (
Table 4).
Several research groups used laser ablation as a cleaning technique for granite rock.
Rivas et al. [
56] focused their research on samples of different colored specimens of Granite variscano from the northwest of Spain, with the aim of determining whether the response to laser irradiation physical damage, the melting of minerals, color changes, etc., was different depending on whether the laser irradiated an area rich in textures or not.
Barreiro P. et al. [
57] considered the influence of the laser wavelength on granite matrices for the removal of biocolonization of monuments, to avoid greater damage due to the penetration and resulting mineralogical transformations of the sample. An Nd:YAG laser was used that was capable of delivering a fundamental beam of 1064 nm (IR radiation), the second harmonic (532 nm—green Vis radiation), and the third harmonic (355 nm—UV radiation), leading to the following results:
- -
at 532 nm, the radiation induced the highest color changes and also induced a slight dissolution and fracture of the exfoliation planes of the muscovite;
- -
at 355 nm, it caused no visible changes to the surface;
- -
at 1064 nm, there were no color changes in the granite.
Brand J. et al. [
58] used lasers to remove contaminants and pollutants from an Australian granite of high historical value, both to increase its stability and longevity and to improve its aesthetic value, demonstrating that it is desirable to use a maximum fluence of 1.0 J⋅cm
−2 to clean granite surfaces to avoid laser-induced damage.
Di Francia et al. [
59] sought a new procedure for laser ablation cleaning processes on artificially corroded Cu-based alloys with a chemical; the main results revealed that the laser treatment apparently does not change the elemental or microstructural composition of the corrosion layers.
The same research group evaluated the possible surface effects induced by laser cleaning on various archaeological bronzes, carrying out chemical–physical characterizations on clean and artificially corroded samples.
The use of lasers is applied commonly to stone materials. Papanikolaou A. et al. [
60] developed a photoacoustic hybrid and an optical monitoring system for the study of laser ablation processes after the removal of encrustations from masonry. They were able to determine the precise critical number of laser pulses necessary for the elimination of the encrustation layer.
Ricci C. et al. [
61] evaluated a cleaning treatment based on laser ablation followed by the application of chemical products for the removal of alkyd paints from graffiti from two different types of stone, one gneiss and one travertine. This process, which was more delicate, resulted in a reduction in graffiti (mainly in travertine) without the superficial roughness association with the use of laser alone.
Lopez AJ et al. [
62] investigated the influence of lithology and texture to increase the hydrophobicity of ornamental stone as a solution against the colonization of organisms on surfaces. A study of samples of slate, quartzite, granite, and marble showed a statistically significant correlation between the variation of the contact angle θ, which characterizes the wettability of the stone, and the surface roughness generated. With marble, the laser texturing was able to increase the contact angle, giving an evident hydrophobic behavior to the stone’s surface.
Ciofini D. et al. [
63] found that the method of laser ablation treatment used on the dirty feathers of a feathered coat showed excellent treatment results.
3.5. IR Spectroscopy
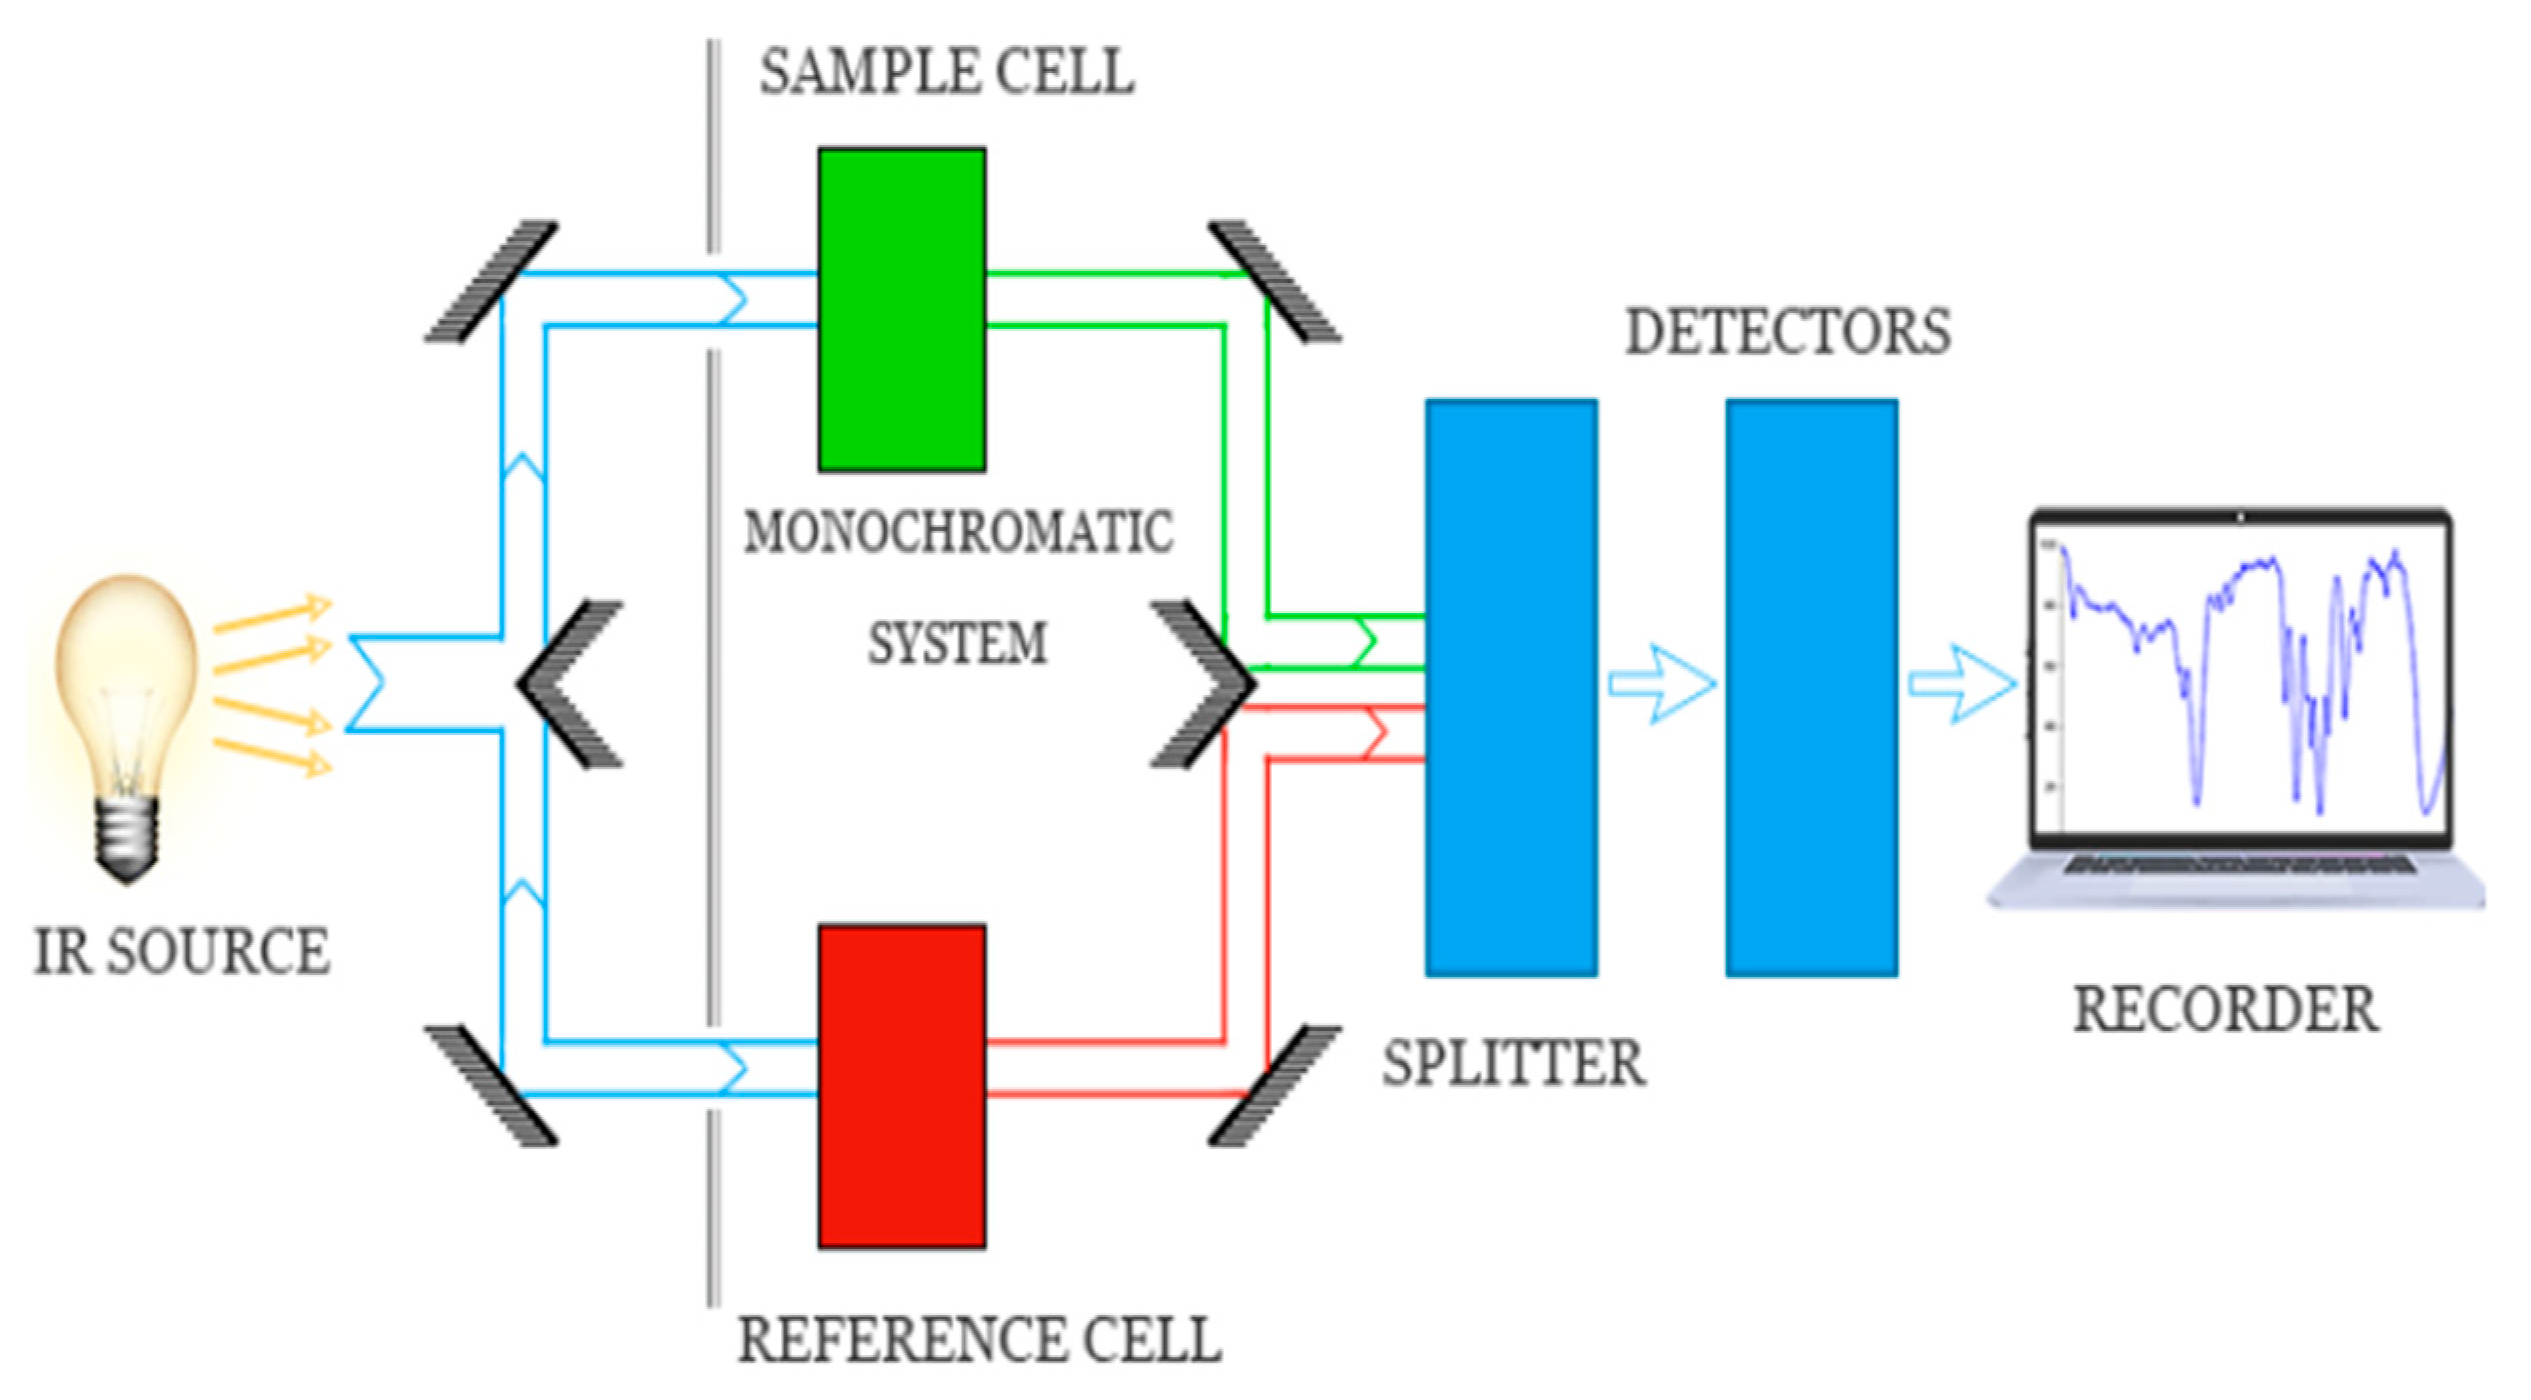
Spectroscopic absorption is a technique normally used in physical chemistry for the study of chemical bonds. When an infrared photon is absorbed by a molecule, it passes from its fundamental vibrational state to an excited vibrational state. It is also called vibrational–rotational spectroscopy. When a molecule absorbs IR radiation below 100 cm
−1, a transition occurs between the rotational energy levels, the rotational spectrum of which consists of discrete lines. If a molecule absorbs radiation in the range 100–10,000 cm
−1, it causes transitions between vibrational energy levels, whose vibrational spectra appear as bands rather than discrete lines. Each vibrational energy level is associated with a large number of closely spaced rotational energy levels, so that the vibrational spectra appear as vibrational–rotational bands instead of discrete lines (
Figure 5).
In a typical infrared spectrum, the x-axis expresses the energy of transition, while the y-axis expresses the intensity of the IR radiation absorbed, transmitted, or reflected.
The acquisition modes of IR spectroscopy are transmission mode, attenuated reflectance mode, specular-reflection mode, and diffuse-reflection mode. If a material is transparent to infrared radiation, its spectrum will appear as a line parallel to the x-axis. However, if a material is not completely transparent, there will be absorptions and therefore transitions between vibrational energy levels and the recorded spectrum will appear with a series of peaks of variable height for each transition. A classic IR spectrophotometer essentially consists of a source whose light beam is directed toward the sample and the reference, the latter usually consisting of the liquid in which the sample is dissolved. This is followed by the monochromator whose function is to select a specific wavelength and a chopper, which alternately directs the radiation coming from the sample and the reference to the detector. The detector is the final component that generates a signal as a function of the analyte concentration present [
64].
Infrared spectroscopy is a simple and reliable technique that is widely used in chemistry, both in research and in industry. It is useful in a wide range of applications. In catalysis research, it is a tool for characterizing the catalyst, as well as detecting intermediates and products during the catalytic reaction [
65]. It is used in quality control, dynamic measurement, and monitoring applications [
61]; in forensic analysis in both criminal and civil cases [
66]; in measuring the degree of polymerization in polymer production [
67]; and in semiconductor microelectronics research [
68].
Historically, the application of infrared spectroscopy required the taking of small quantities of samples, but recent advances have made it possible to create a non-destructive instrumentation, rendering this type of analysis very important in the context of the investigation of artifacts [
69]. The reflection of infrared radiation from the surface of an object is exploited and the “return” signal is analyzed, providing information on the structure of the molecules with which it has interacted.
In the literature, it is possible to ascertain the enormous variety of interventions and analyses that can be conducted on organic and inorganic, crystalline, and amorphous materials by means of IR spectroscopy (
Table 5). In fact, this technique is used successfully with regard to the characterization and evaluation of the conservation status of the paintings.
Beltran et al. [
70] undertook the identification of organic particles of a fragment from Van Gogh’s L’Arlèsienne painting, with the aim of understanding its composition, physical properties, and historical background, as well as deciphering possible degradation reactions.
Macchia A. et al. [
71] developed a multi-analytical approach for the study of paintings to characterize both the original stratigraphy and the presumed non-original paint on the surface. The process made it possible to fine-tune the appropriate cleaning treatment. This technique is also very useful in the study of lithic materials.
Comite V. et al. [
72] investigated the black crusts on the façade of an historic cathedral located in a polluted urban center in Northern Italy to identify the sources of pollution responsible for the degradation of the stone. FT-IR spectroscopy showed that all the crusts were mainly composed of gypsum, with traces of oxalate, quartz, and weddellite found in samples of older crusts.
Rovella et al. [
73] found that the crusts on stone material in Cairo were gypsum, oxalate (probably due to restoration work or biological activity), calcite, and silicates (from the natural substrate or soil dust deposits).
Vahur et al. [
74] conducted quantitative mineralogical research on 222 samples from natural clay springs and various archaeological sites, using artifacts as calibration and validation standards. The method used showed a higher content of minerals, such as silica (e.g., quartz), feldspar, clay minerals (illite, illite-smectite, micas), and iron oxyhydroxides.
In the field of plastic materials, De Sa et al. [
75] carried out surface FTIR analyses of objects in the Museu de Leiria from the 1930s to today, used for various purposes (daily life, cooking, toys, etc.). The analysis allowed the study and characterization of plastic materials, providing an understanding of the development and use of these objects over time.
Angelin E. et al. [
76] characterized the composition of plastic artifacts to outline suitable conservation strategies for naturally aged historical objects from a Portuguese private collection. In this case, the molecular characterization of the samples was carried out without compromising the physical integrity of the objects and without limitations related to micro-sampling.
The technique has also proved useful in the identification of historical cellulose nitrate and cellulose acetate films of historical photographs [
77], in order to determine the state of deterioration of photographic sheets and films.
Vouvoudi E. et al. [
78] evaluated by IR the suitability of a commercial polycanoacrylate adhesive (Loctite Super Attack Glass) for the restoration of glass objects. This technique appears to be a promising alternative to traditional adhesives used for preserving glass objects.
Vigorelli et al. [
79] defined a non-invasive analysis and imaging measurement protocol to study artistic techniques on wooden objects and figurines. The results of the FT-IR analysis show the possibility of distinguishing modern interventions, probably datable to the second half of the twentieth century, from older interventions.
3.6. Terahertz Spectroscopy
This technique detects and controls the properties of matter with electromagnetic fields in the frequency range between a few hundred gigahertz and several terahertz (abbreviated to THz). In many-body systems, many of the relevant states have an energy difference that corresponds to the energy of a THz photon. Therefore, THz spectroscopy provides a particularly powerful method for solving and controlling individual transitions between different many-body states. This can be used in the development of new technologies optimized to reach the elementary quantum level. Terahertz waves are non-ionizing, non-invasive, and penetrable in many materials to a depth of less than that of microwave radiation (
Figure 6). Terahertz radiation is particularly useful for providing information about molecules that are unanalyzable with other analytical and imaging techniques. It is, in fact, very sensitive to various types of resonances, such as vibrational, translational, rotational, torsional, and conformational states. However, unlike Raman and IR spectroscopy, the development of techniques to generate, manipulate, and detect terahertz radiation is still in the early stages, and adequate equipment is still lacking. High terahertz frequencies cannot be estimated with electronic meters similar to those used in optical wave detection, because at such high frequencies, electronic devices used in the generation and manipulation of radio and microwave waves become less efficient. The distinctive capabilities of terahertz waves have been used in spectroscopy, photovoltaics, medicine, security screening, pharmaceutics, quality assurance, dentistry, communication, and astronomy.
Over the past 10 years, terahertz spectroscopy and terahertz imaging have also been used as non-destructive and non-invasive techniques for cultural heritage artifacts. Its use in the field of cultural heritage allows for the investigation of multi-layer works by characterizing their materials, even making it possible to detect paintings hidden by other layers, defects, and structural detachments. THz radiation penetrates optically non-polar (non-metallic) opaque materials much more effectively than other techniques [
80].
The analysis of the literature related to this technique is summarized in
Table 6.
Mikerov M. et al. [
81] used THz techniques to study ancient Roman and Punic pottery samples found in Sardinia, Italy. The method used combines highly accurate photogrammetry and tomographic THz imaging to estimate the refractive index of the sample taken, providing information on the texture and density of the ceramic tissue.
Niijima et al. [
82] used THZ spectroscopy to provide an estimate of the firing temperatures of ancient ceramics, using the refractive index in the THz region. The firing temperature of the Arita porcelain shard was estimated at 1241 °C ± 3 °C, while that of the ancient Banko pottery was estimated at 1141 °C ± 1 °C.
Wang T. et al. [
83] sought a virtual unrolling technique capable of extracting information from folded paintings, documents, scrolls, and other curled objects, exploiting their three-dimensionality and the imaging capability provided by terahertz computed tomography (CT THz). The image section is handled as a “topographic map”, from which most of the information in the folded or rolled structure is extracted. It is then possible to perform a virtual unwinding and to then stitch together the profiles (ridge lines) to form the final image.
Ullmann et al. [
84] studied non-contact inspection of handwritten documents with terahertz imaging: single-sided handwritten letters, covered in an envelope, provided clear images, while for double-sided letters, the recognition of single characters or words was clearly more difficult. The effectiveness of the technique also depends on the type of ink and its concentration. This technique is particularly refined and important for this type of artifact because it also allows the identification of any damage and defects in the paper matrices or damage caused by time.
Lei Q. et al. [
85] conducted a comparative study on a 19th century hand-bound book using non-invasive infrared, terahertz, and air-coupled ultrasound inspection for works of art. They were able to retrieve information relating to the composition of the materials, the cover of the book, and its thickness.
Time domain Thz spectroscopy is also used in the detection of deterioration in stone materials and cavities [
86], as it reflects the thickness of the degraded surface.
Sirro et al. [
87] showed that it is also useful in detecting and inspecting paint layers beneath the surface of a canvas, regardless of any superficial characteristics. The THz-TDS system also has the capability of detecting any features on the reverse side of a painting by using a frontal scan.
4. Analysis of Online Research Trends of the Analyzed Archaeometric Techniques
It was possible to develop a model to visualize the online searches for these archaeometric techniques over the last 3 years (2020–2022) using the Google Trends app, a tool that provides reports on the popularity of searches on Google.
A graph shows the popularity of the search terminology in real time. The numbers on the graph do not represent absolute search volume numbers, because the data are normalized and presented on a scale from 0–100, where each point on the graph is divided by the highest point, or 100.
The numbers next to the search terms at the top of the graph are summaries, or totals. A line trending downward means that a search term’s relative popularity is decreasing—not necessarily that the total number of searches for that term is decreasing but that its popularity compared to other searches is shrinking.
In the lower position of the graph relating to the trends, the search interest by state or region is analyzed in detail, as seen in a map characterized by a greater or lesser intensity of color proportional to the volumes of local searches [
88].
On the basis of the data obtained, it was possible to identify the countries with the greatest number of searches relating to the scientific techniques detailed in this article.
All countries where searches were made in sufficient volume to be considered by the Google search engine were selected for analysis.
4.1. Raman Spectroscopy
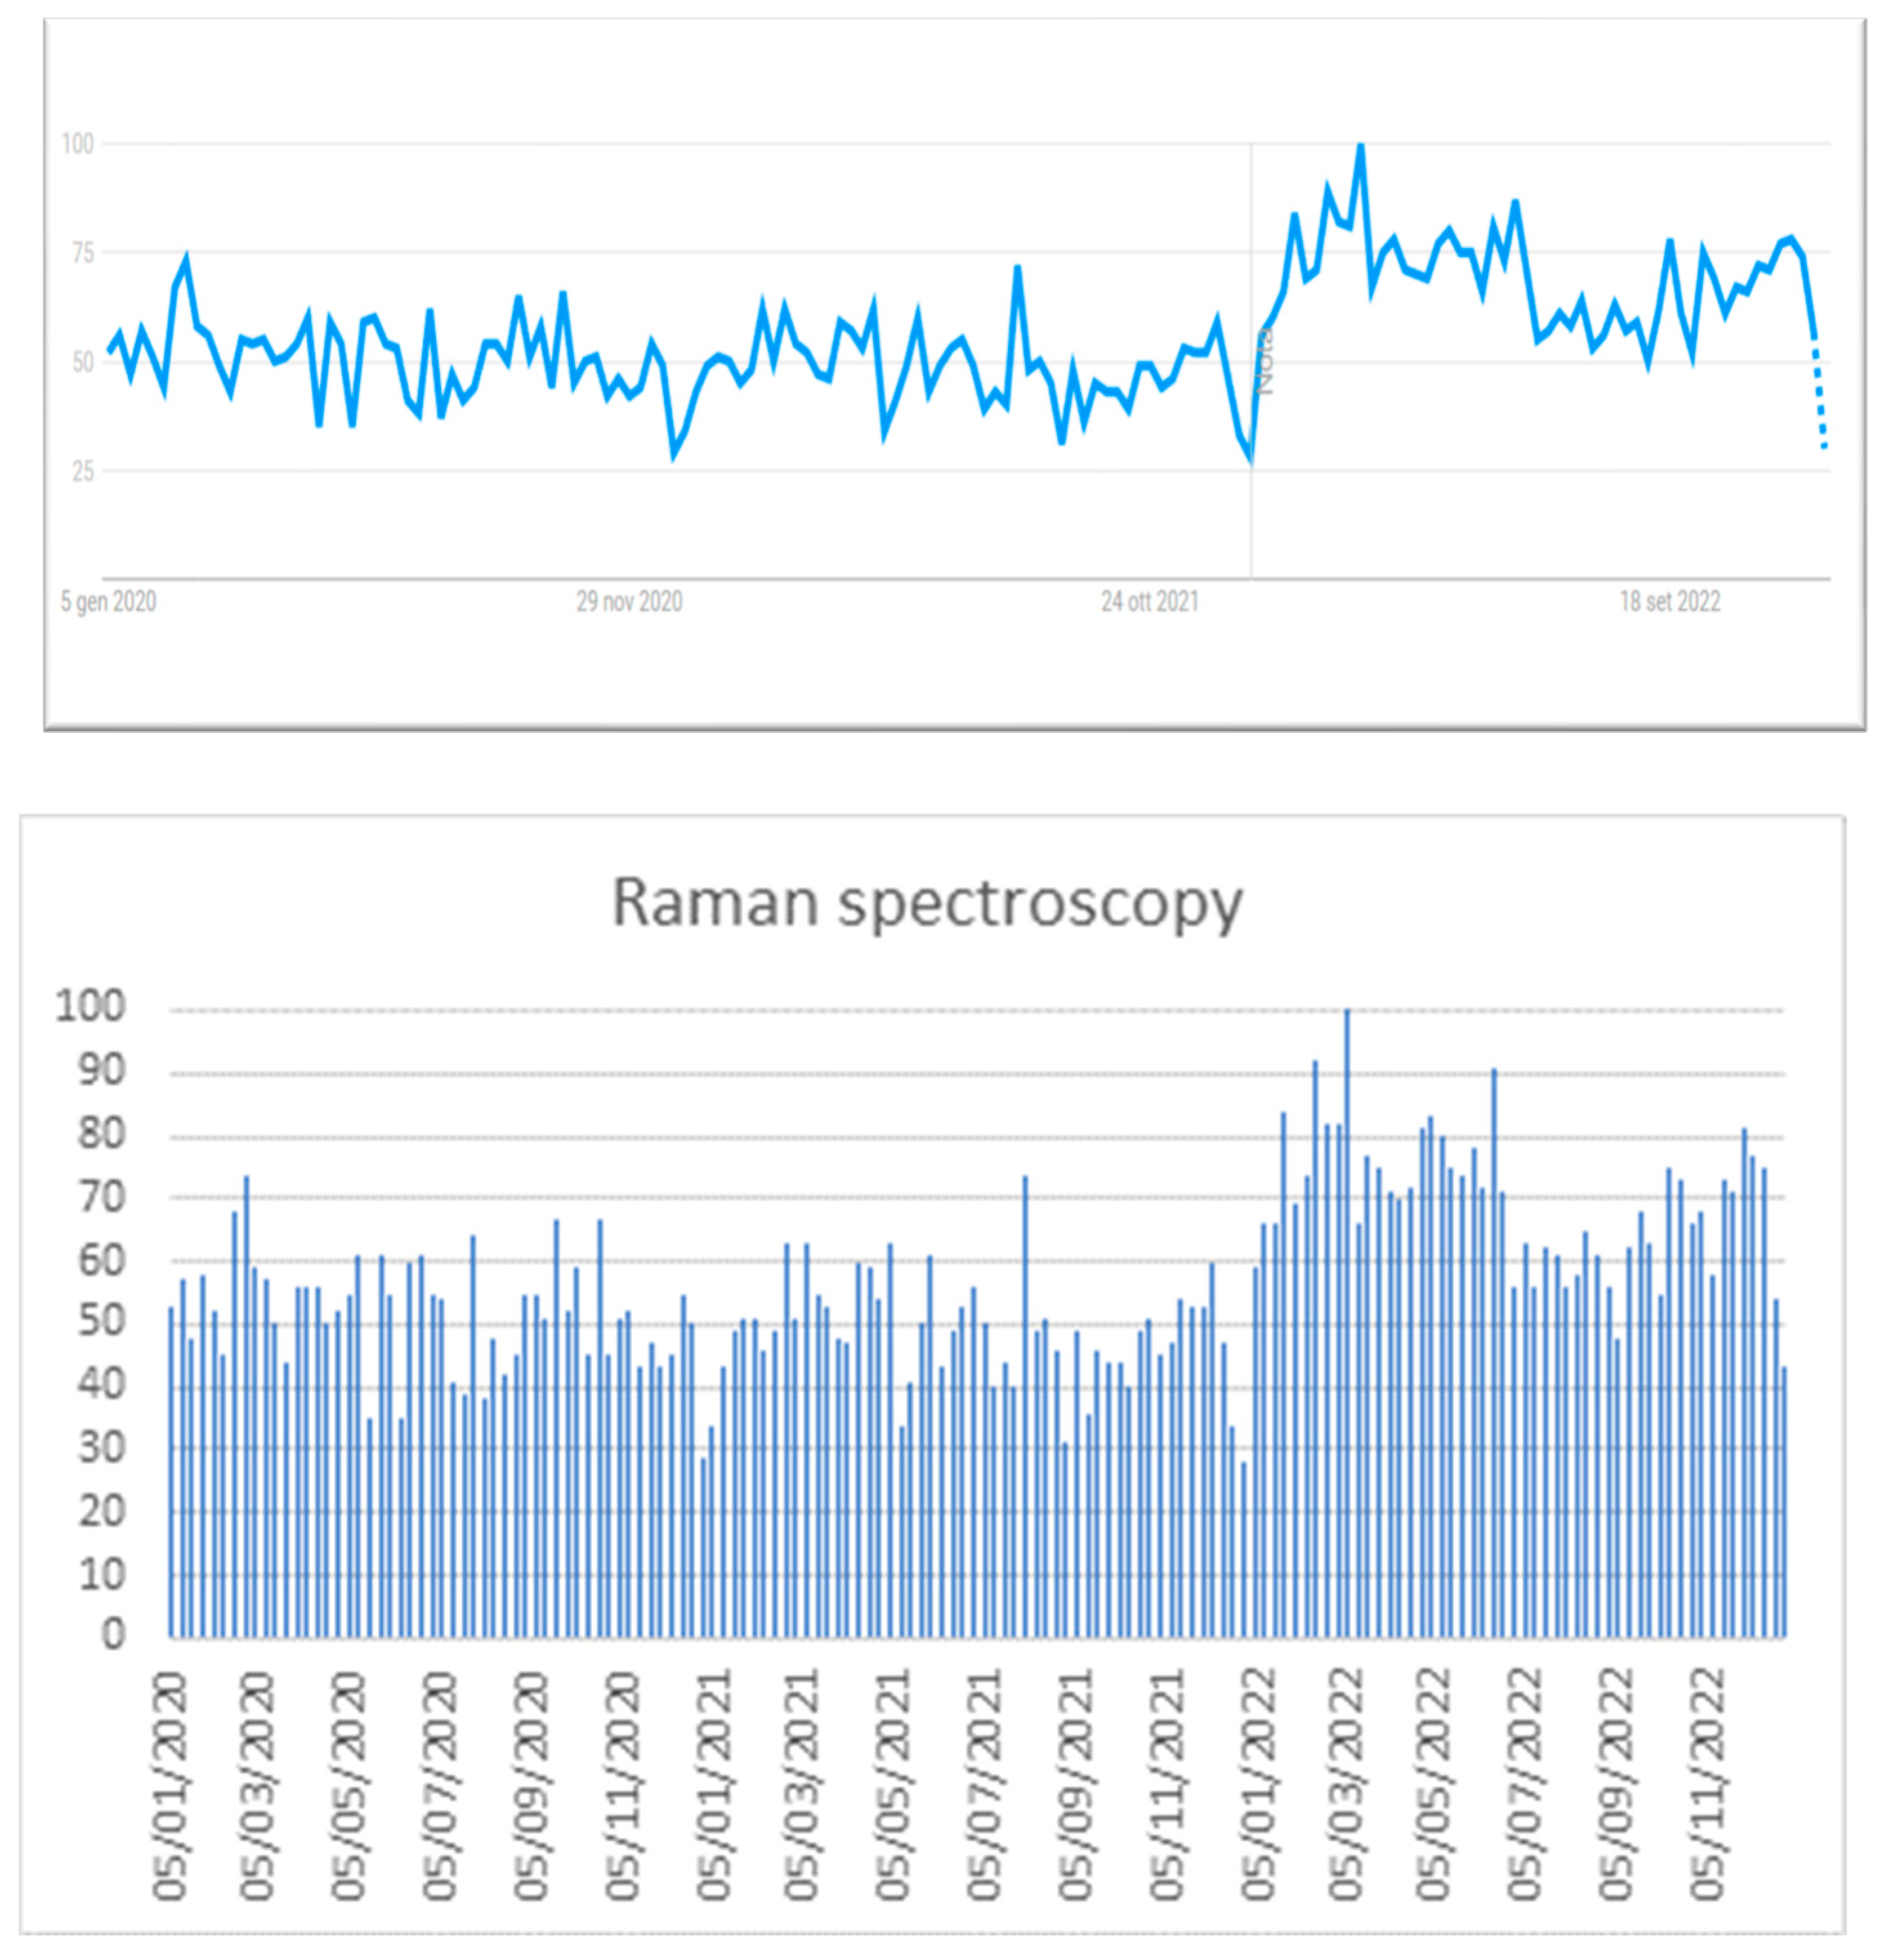
The keyword “Raman spectroscopy” was entered, and the search for our data in a geographical worldwide context was set for a period of 3 years, from 1 January 2020 to 31 December 2022.
Figure 7 shows that the descending lines do not indicate decreases in the total number of searches of the term but decreases in its popularity relative to other searches. Moreover, the search volume analysis revealed a progressive increase over time for the keyword “Raman spectroscopy”, reaching relatively high values between January and June 2022.
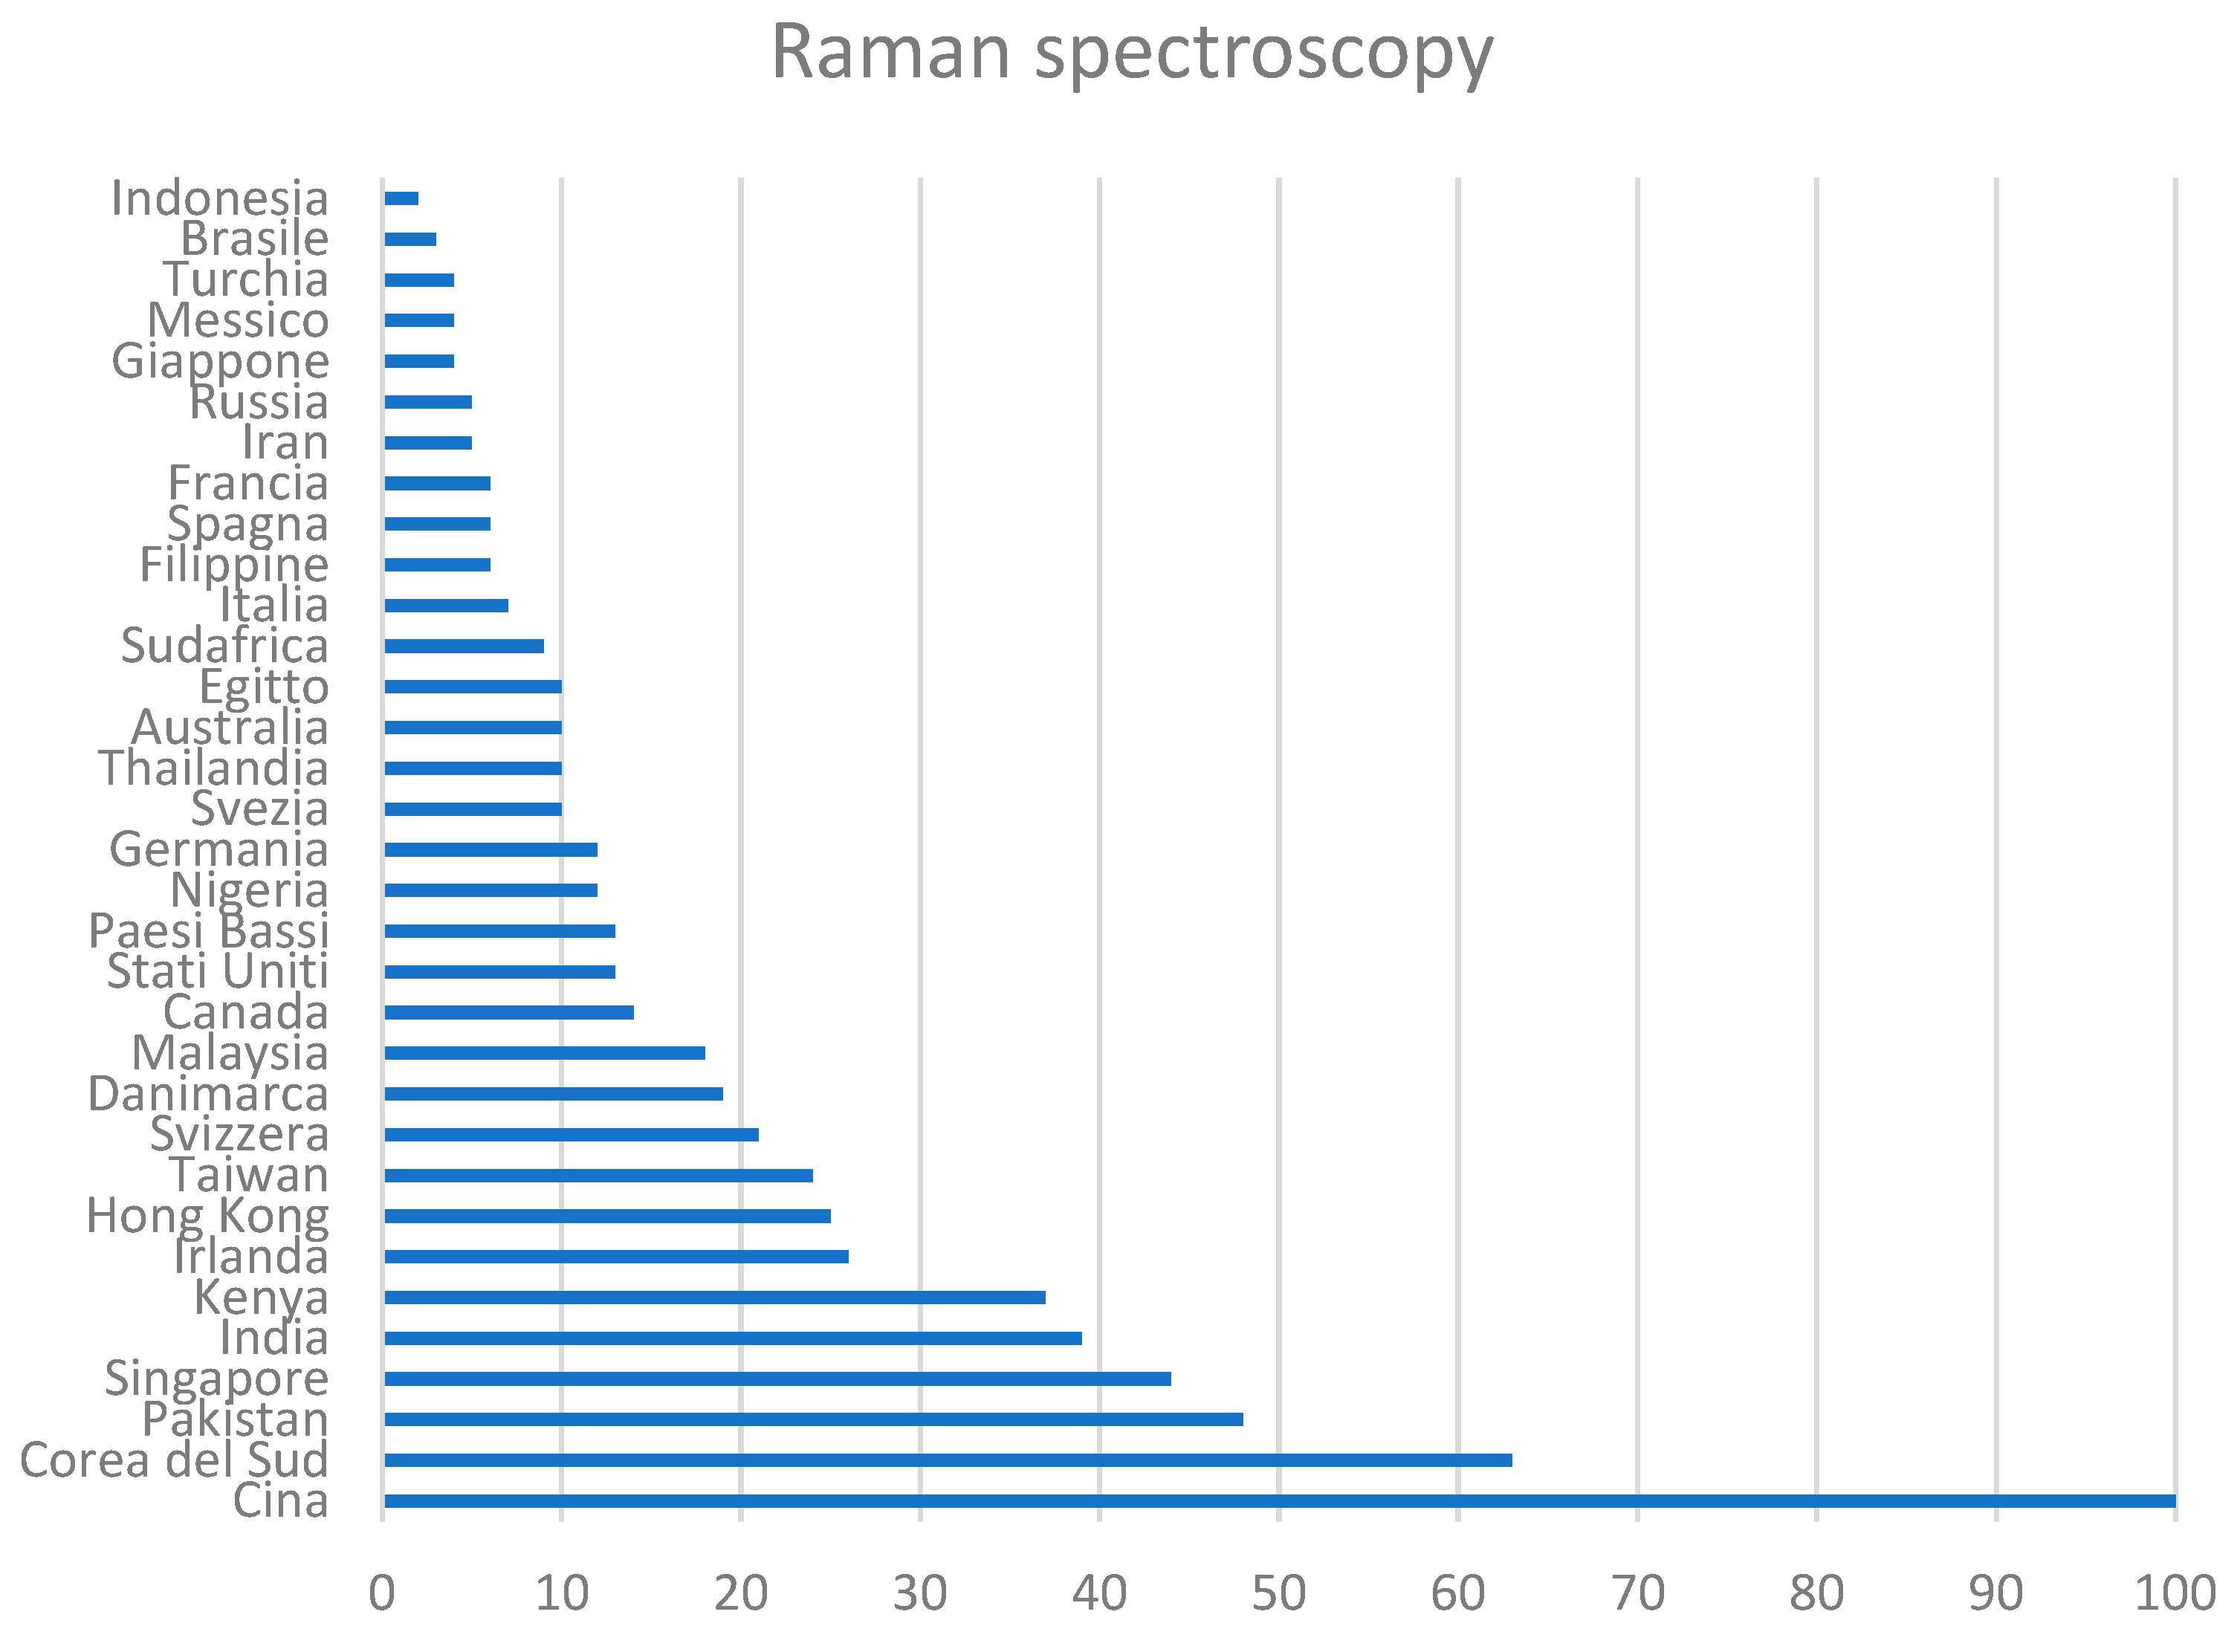
The data relating to interest by geographical area are shown in the corresponding bar graph (
Figure 8).
Although this study has some limitations, such as the differing popularity of the Google search engine worldwide, the results show a decreasing search trend, as seen in the results of China vs. Indonesia.
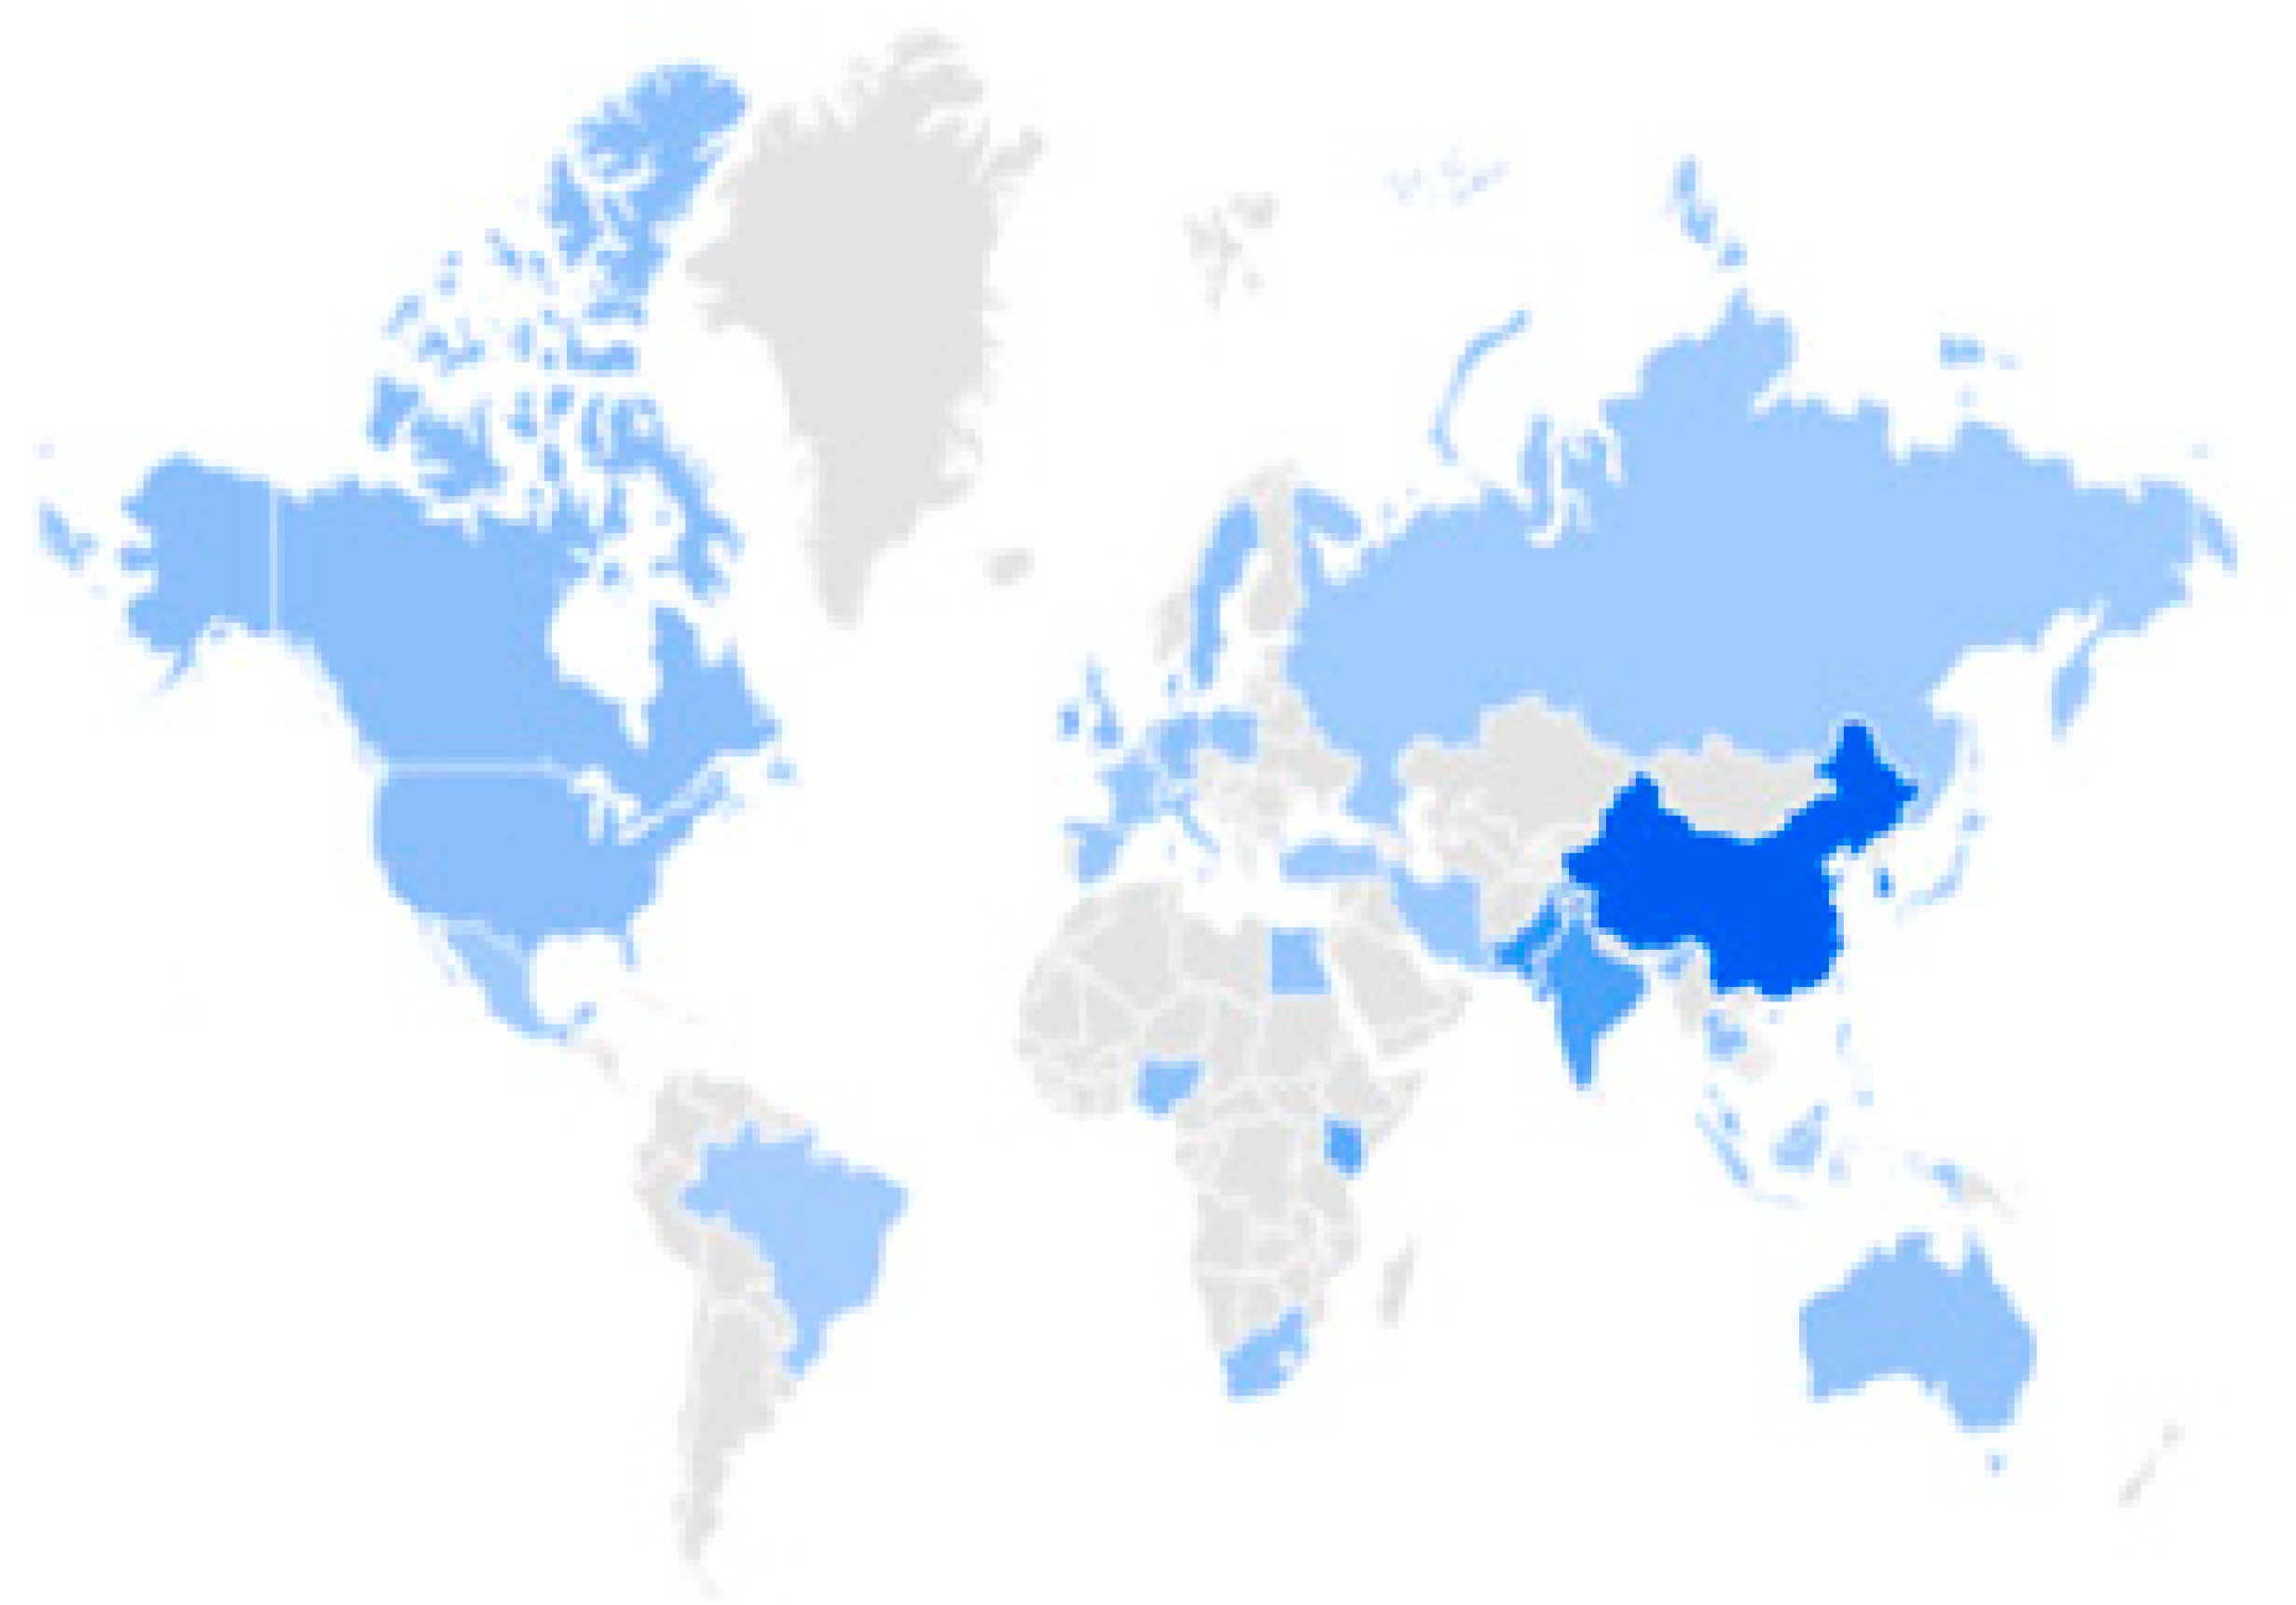
From the data analyzed, it emerges that Italy has the highest number of published articles, although it does not rank among the top countries in online searches (
Figure 9 and
Table 7).
4.2. X ray Fluorescence
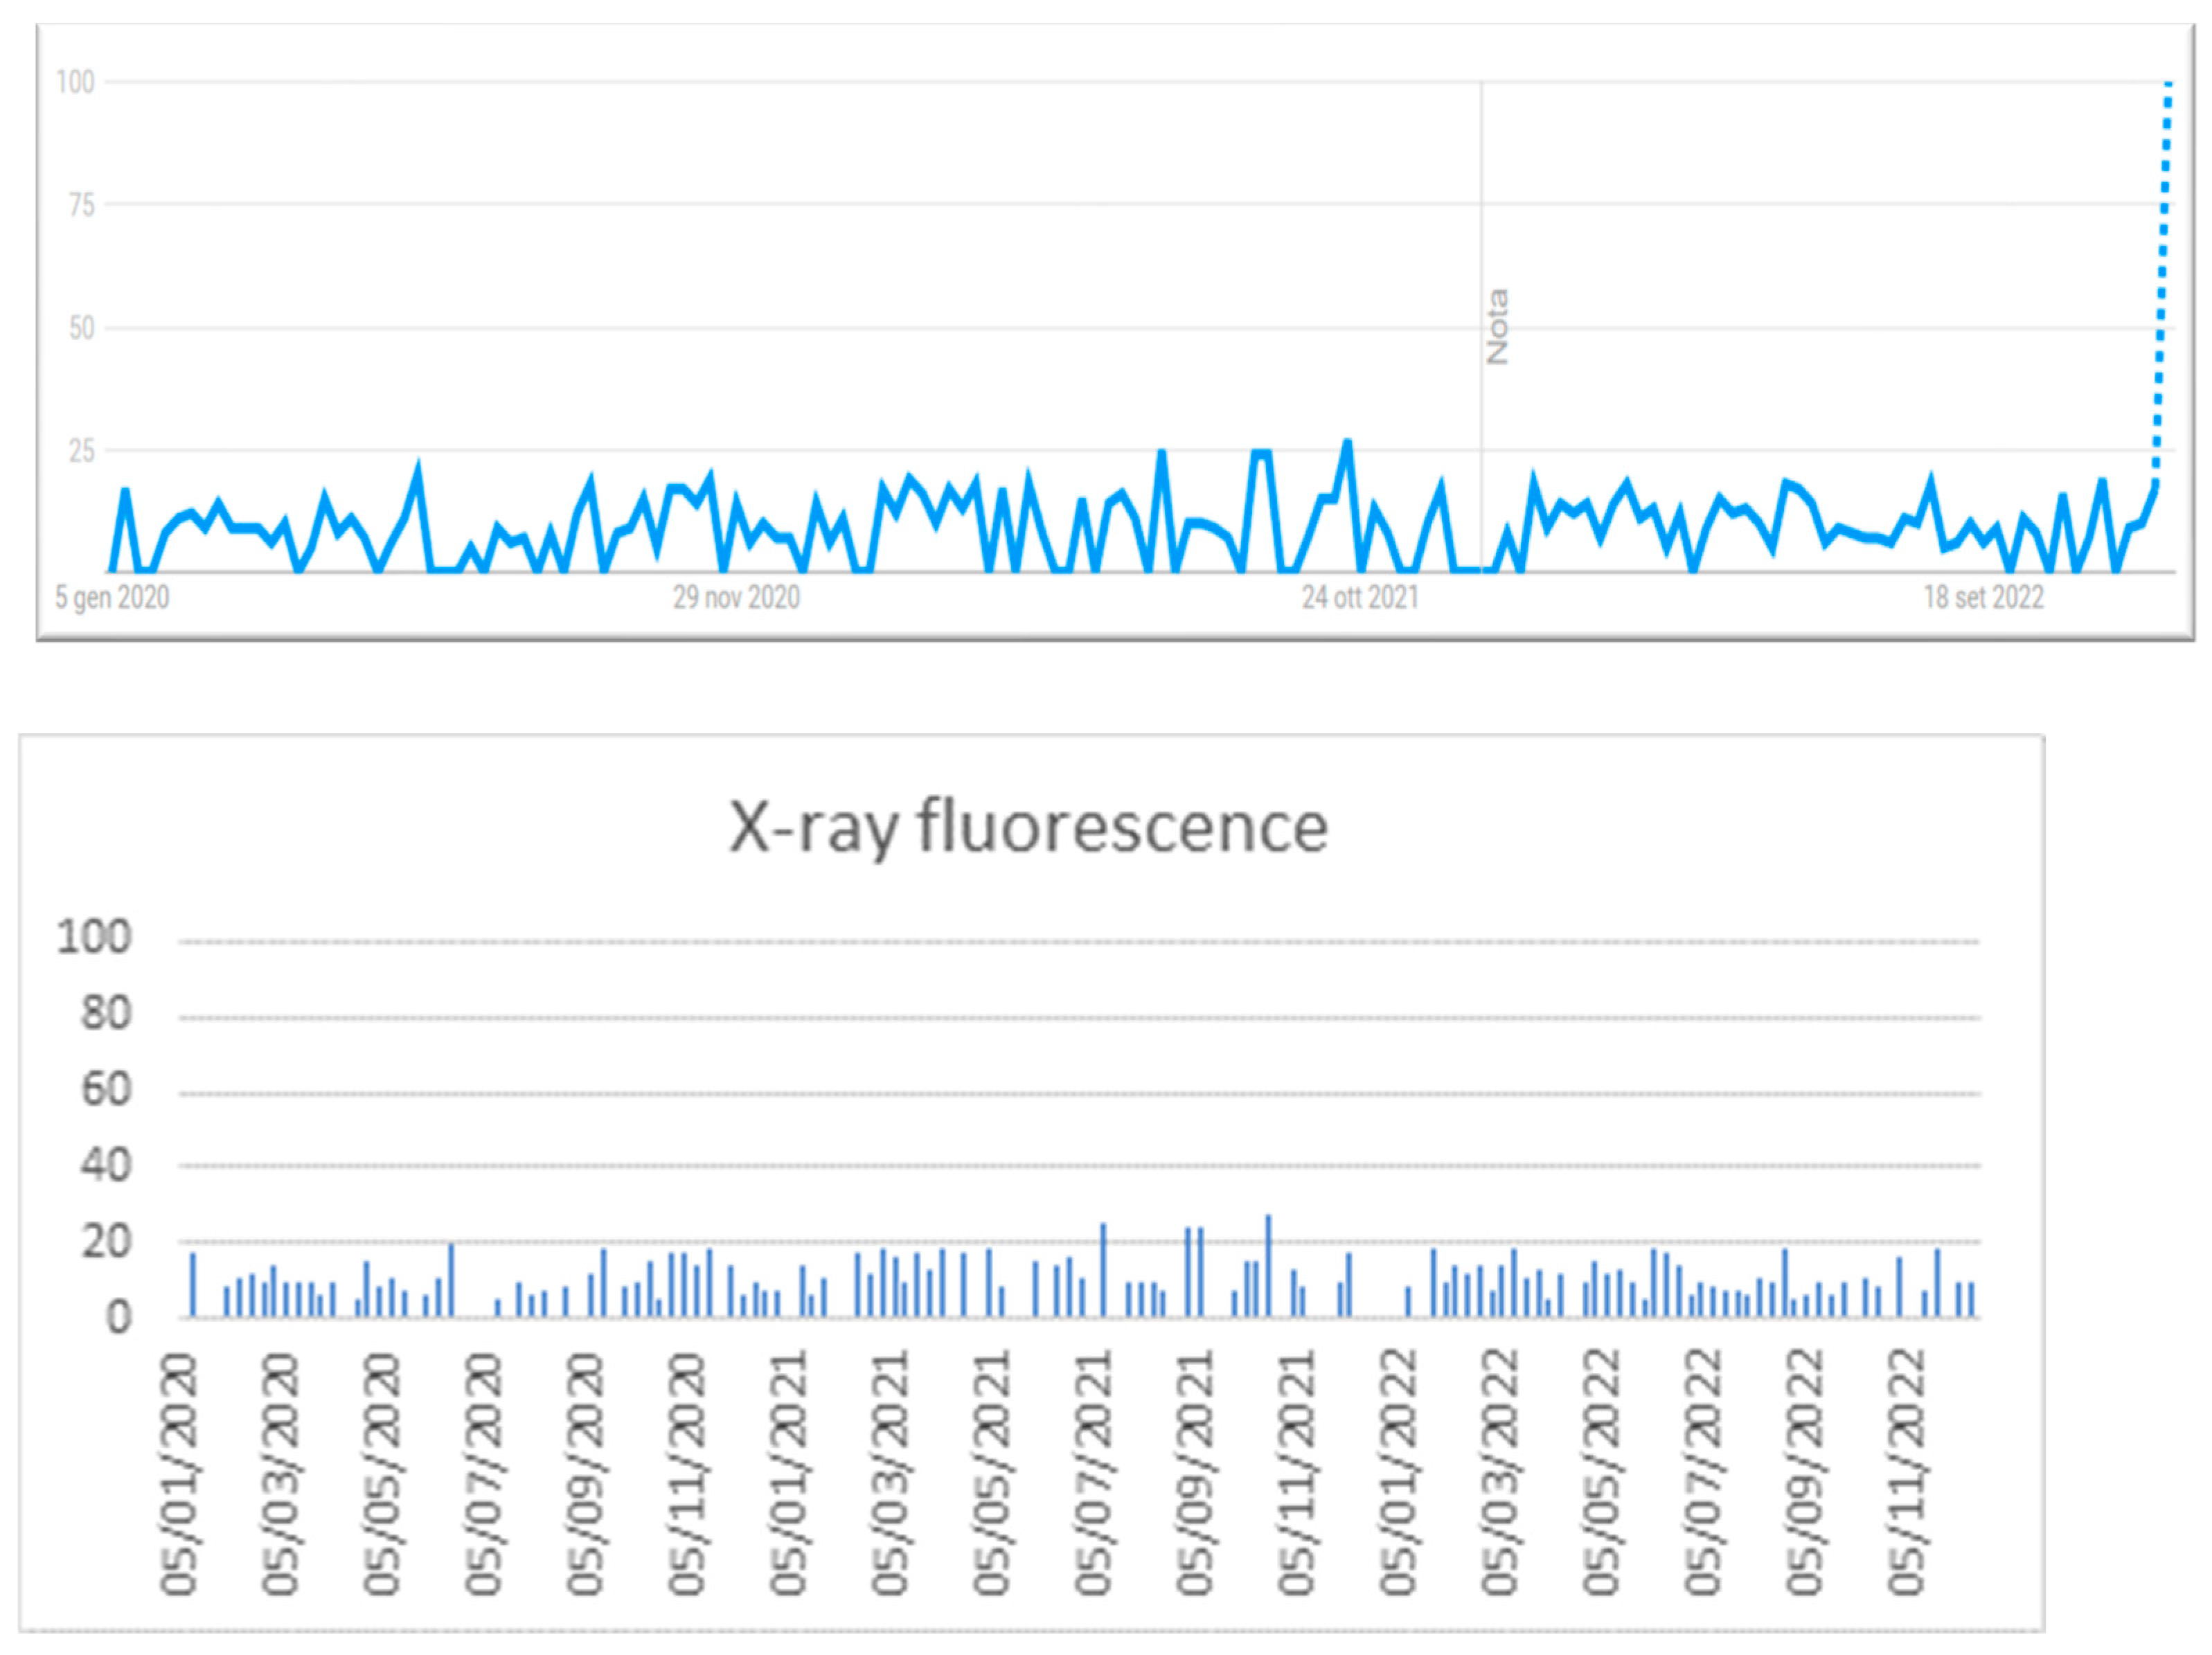
The keyword “X-ray fluorescence” was searched from 1 January 2020 to 12 December 2022 (
Figure 10).
Search volumes for this technique are very low; in fact, the highest values are around 30 on our query scale, indicating that the popularity of this technique is very low.
Note how the geographical distribution relating to the global research volume is limited to India, the United Kingdom, and the United States, while the analysis of the places producing scientific publications are Poland, Serbia, Mexico, and Italy (
Figure 11 and
Table 8).
4.3. LIBS
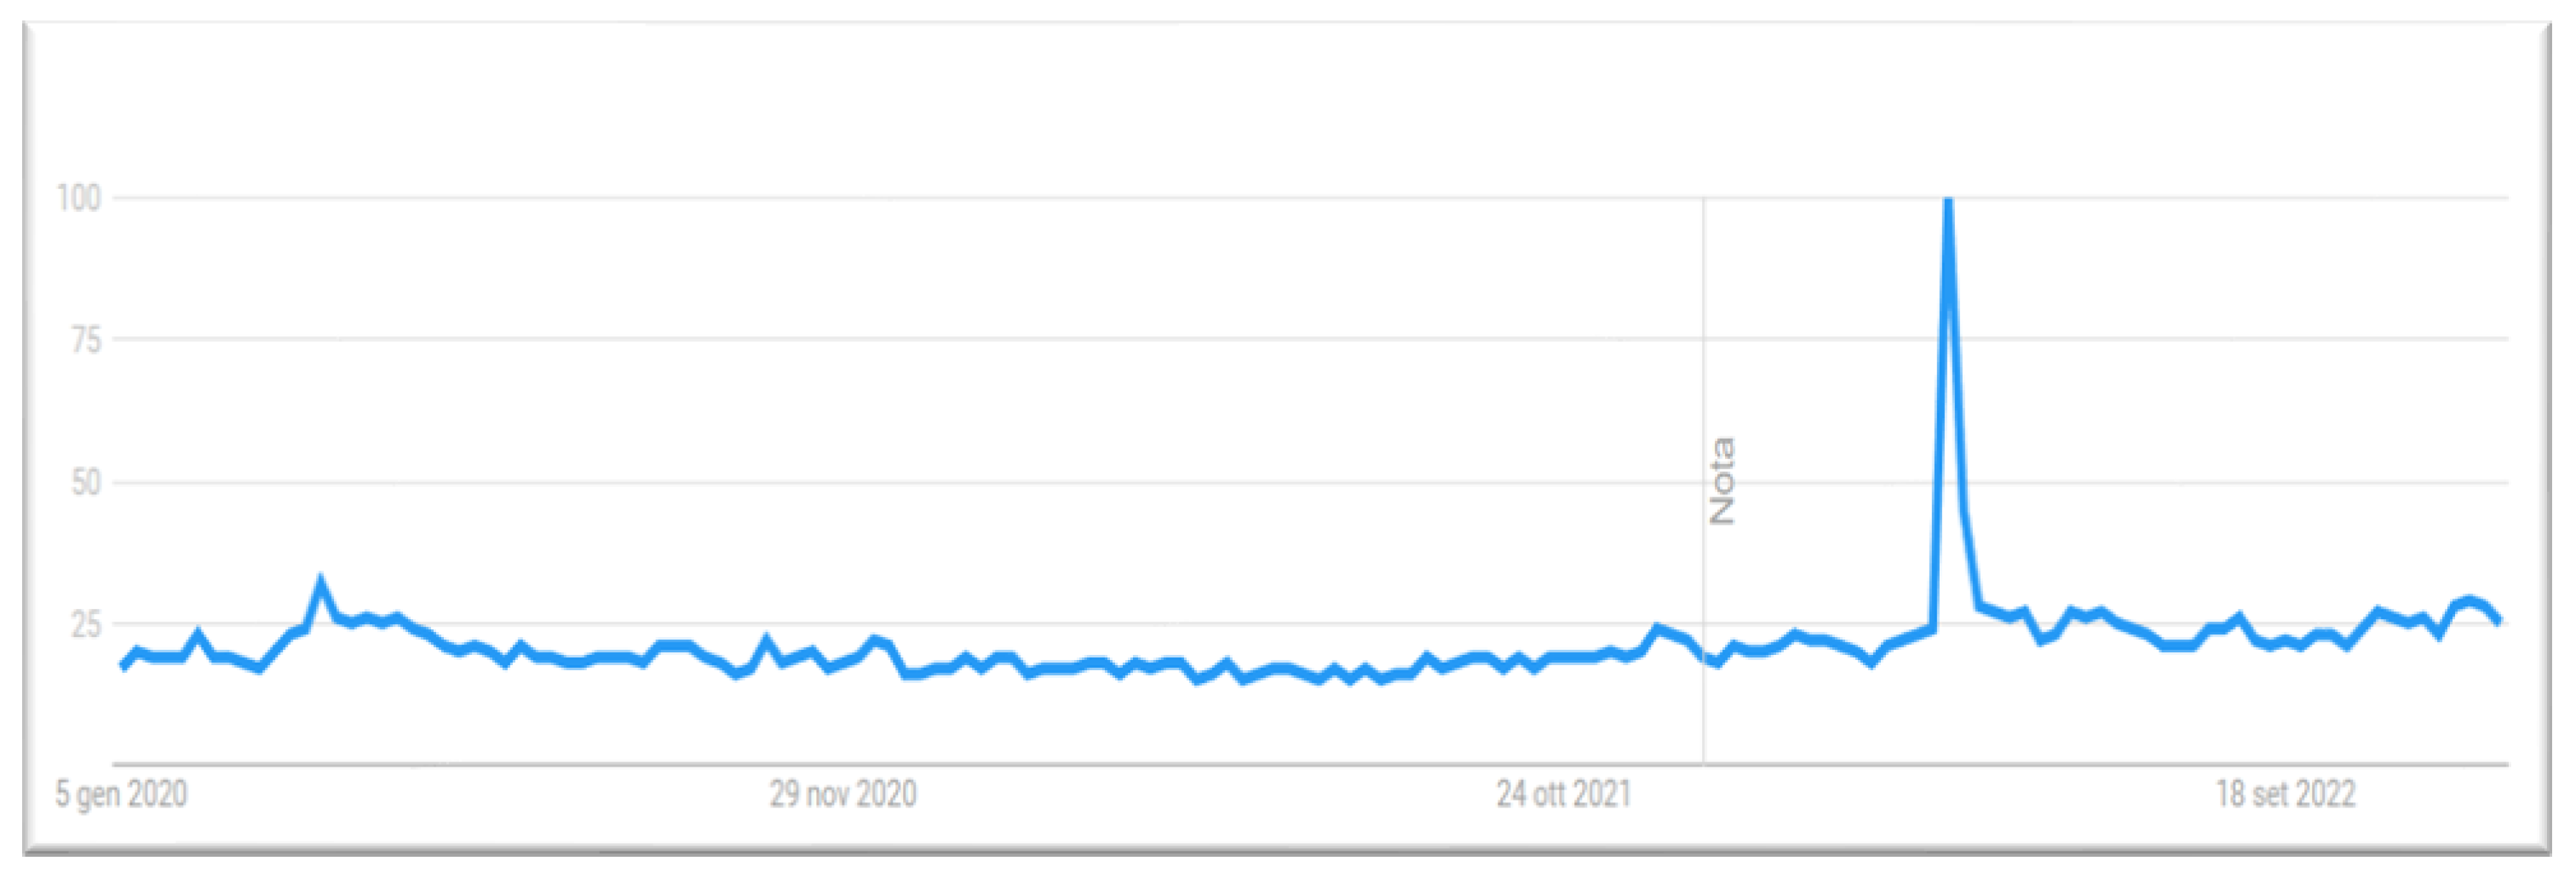
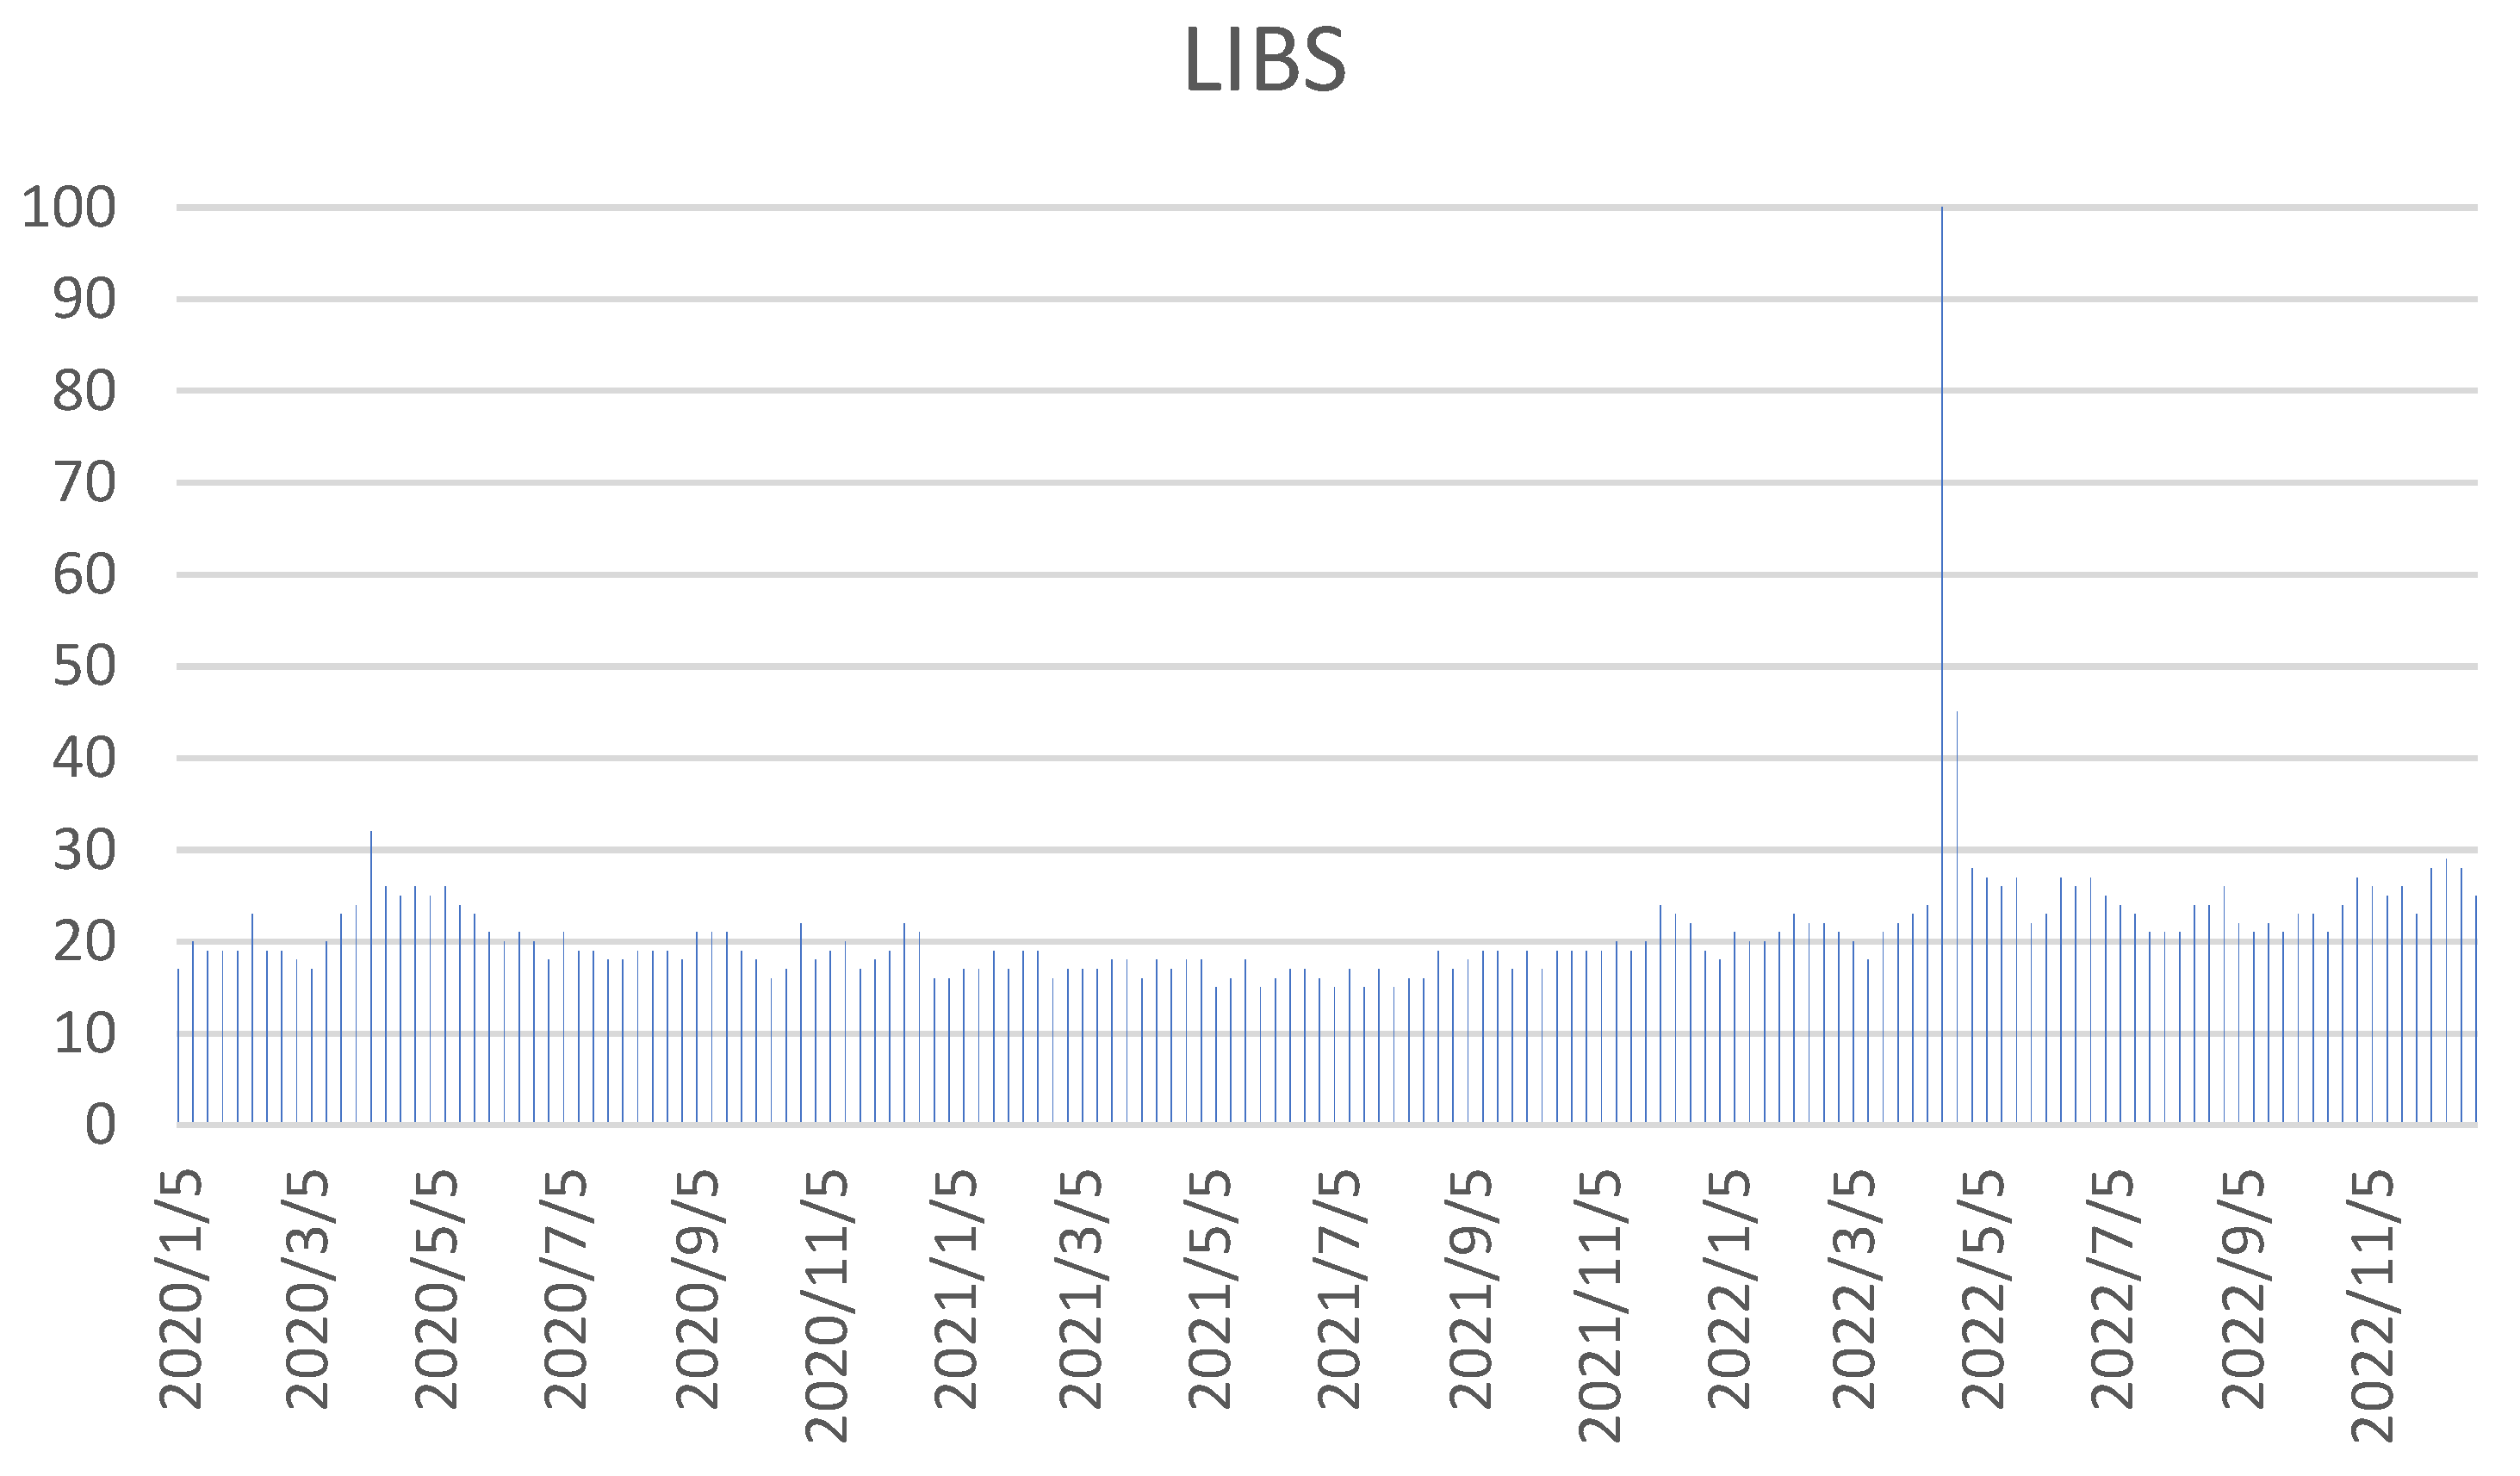
The keyword “LIBS” was searched from 1 January 2020 to 12 December 2022 (
Figure 12).
The range is between 20 and 30 on the axis of queries, while a maximum peak between 17 April 2022 and 23 April 2022 can be attributed to the bibliographic research carried out by the authors of this review during their data collection activity.
In this instance, the areas in which papers have been published correspond with the search results (
Table 9). However, it must be noted that the acronym LIBS has different meanings globally.
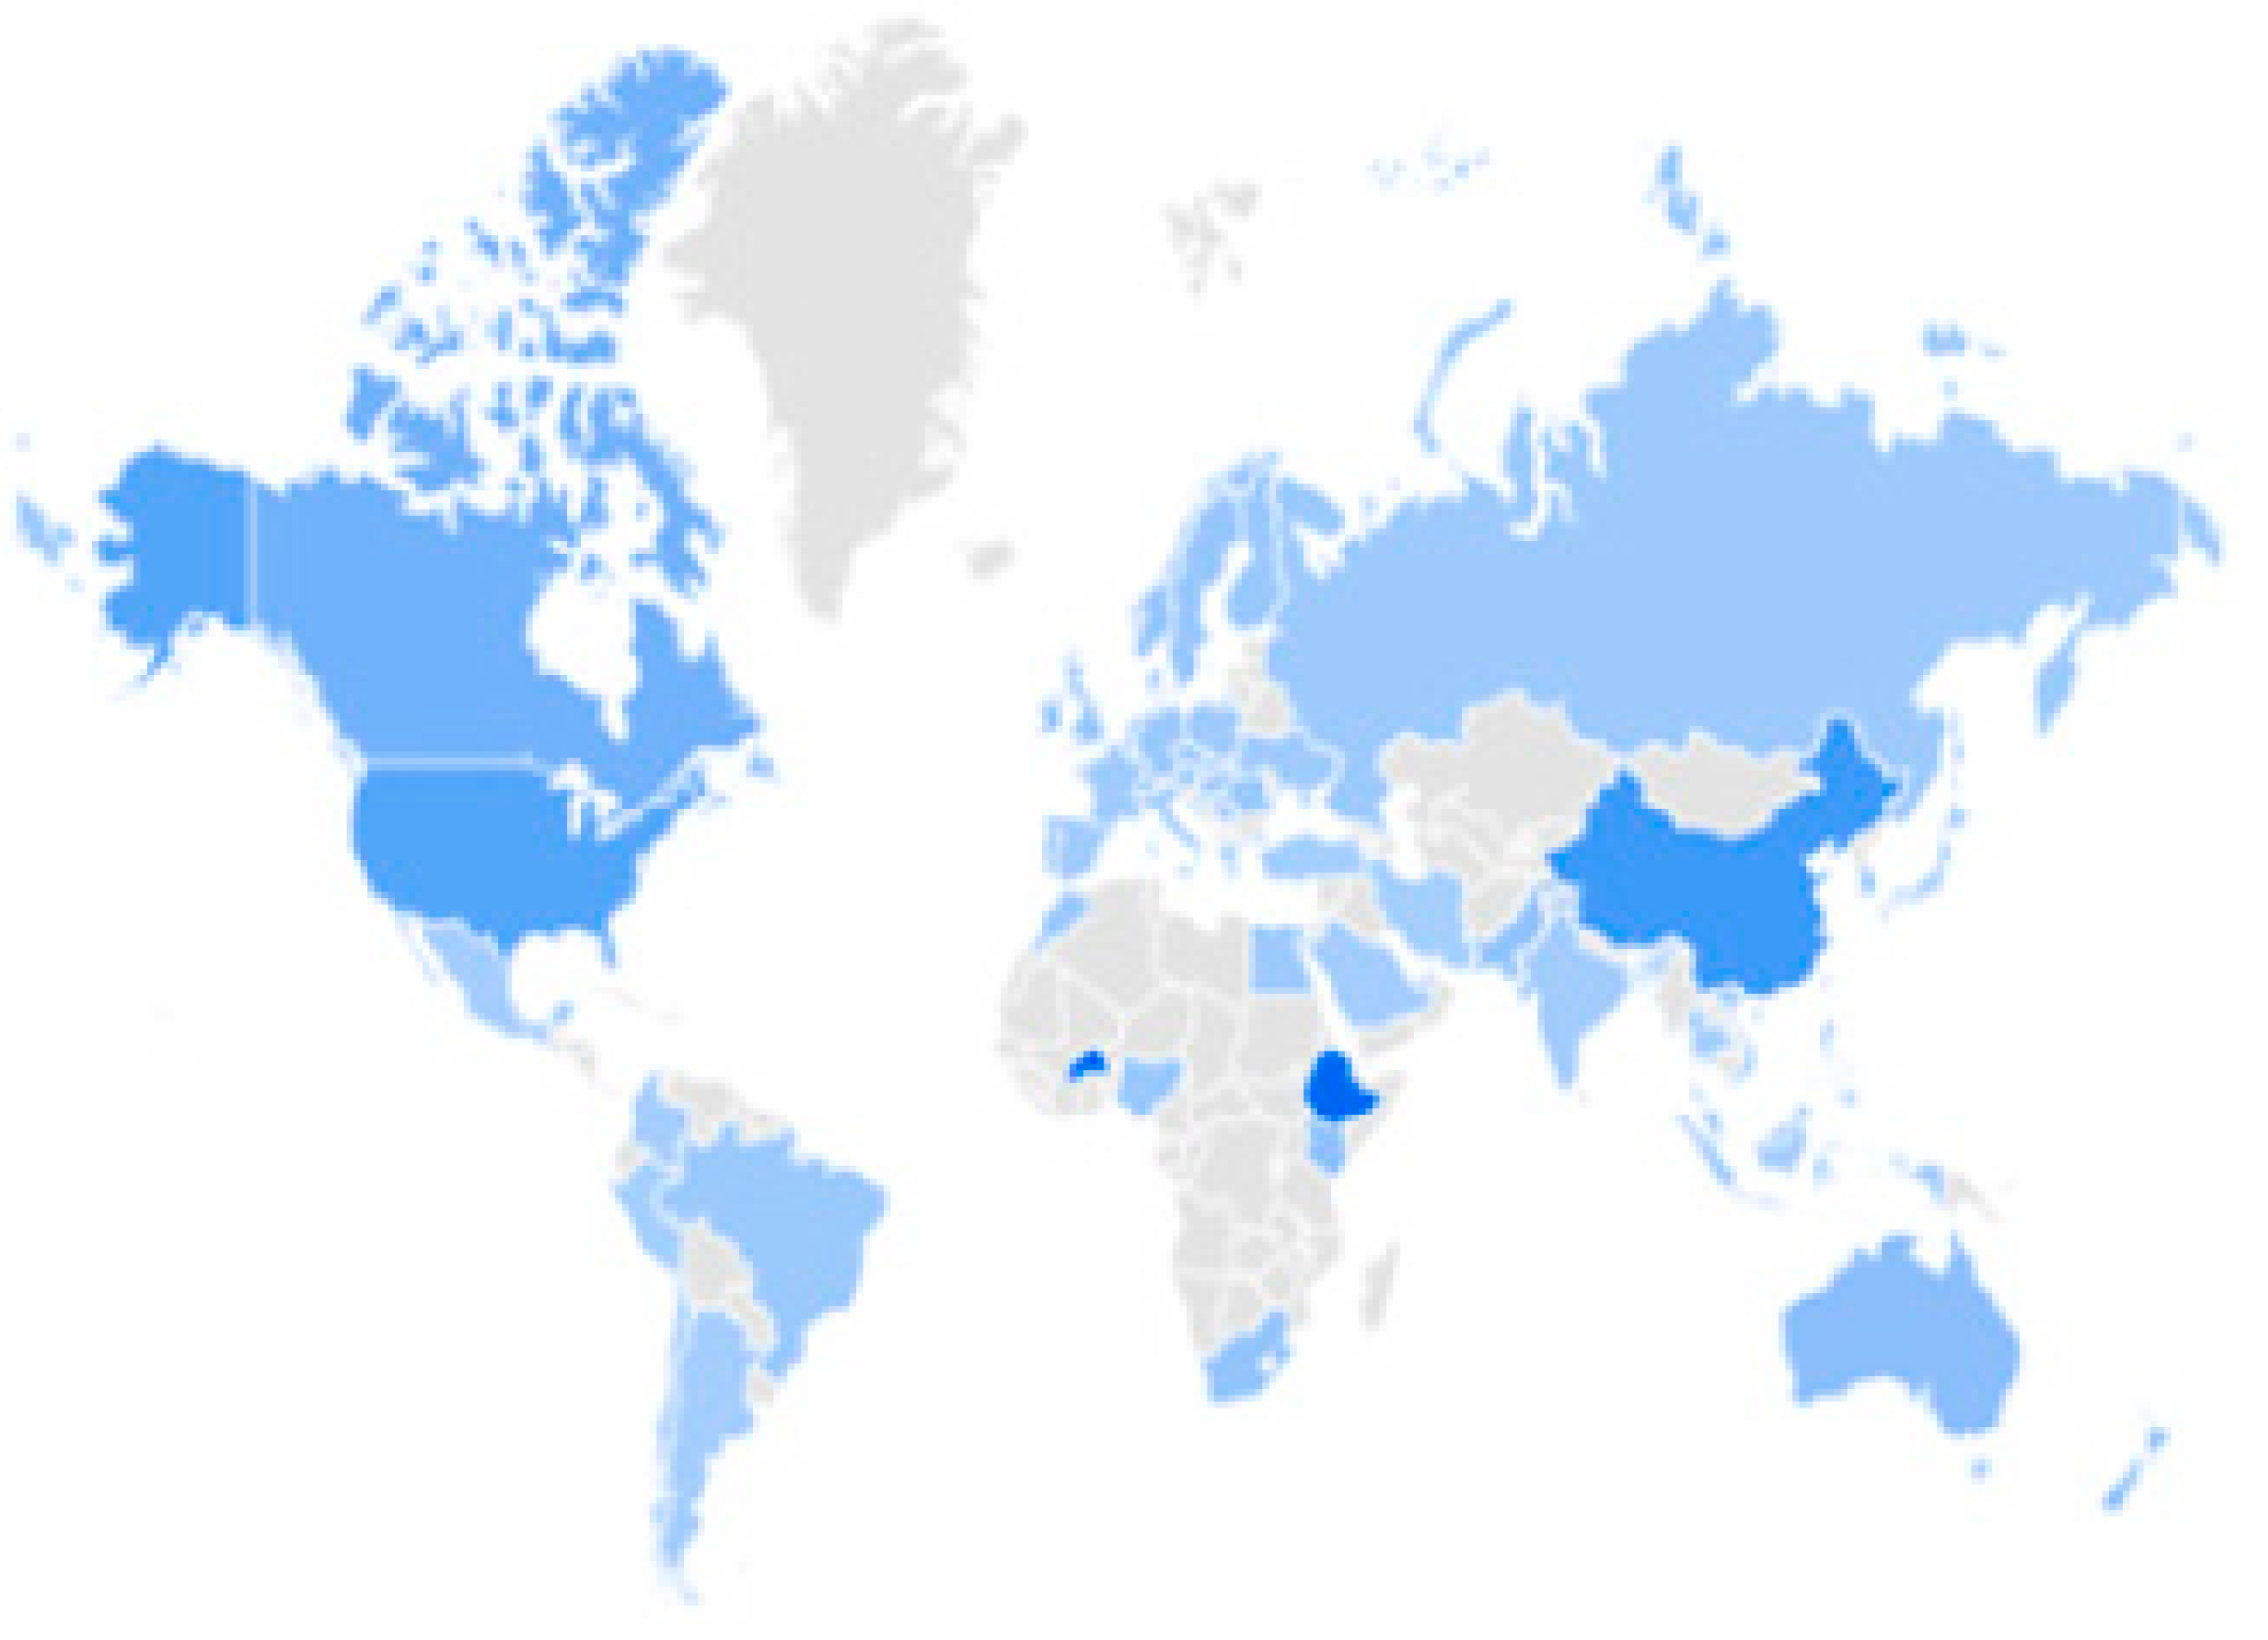
In particular, LIBS online is also linked to LIBS Brasserie Sarl, a company specializing in the brewing and marketing of drinks, which is widespread in Burkina Faso and Ethiopia. The first beer from LIBS Brasserie was brewed in February 2019. It is a high-end beer made with the best malt in the world. This aspect justifies why there is a high number of online searches recorded for these countries (
Figure 13 and
Figure 14).
4.4. Laser Ablation
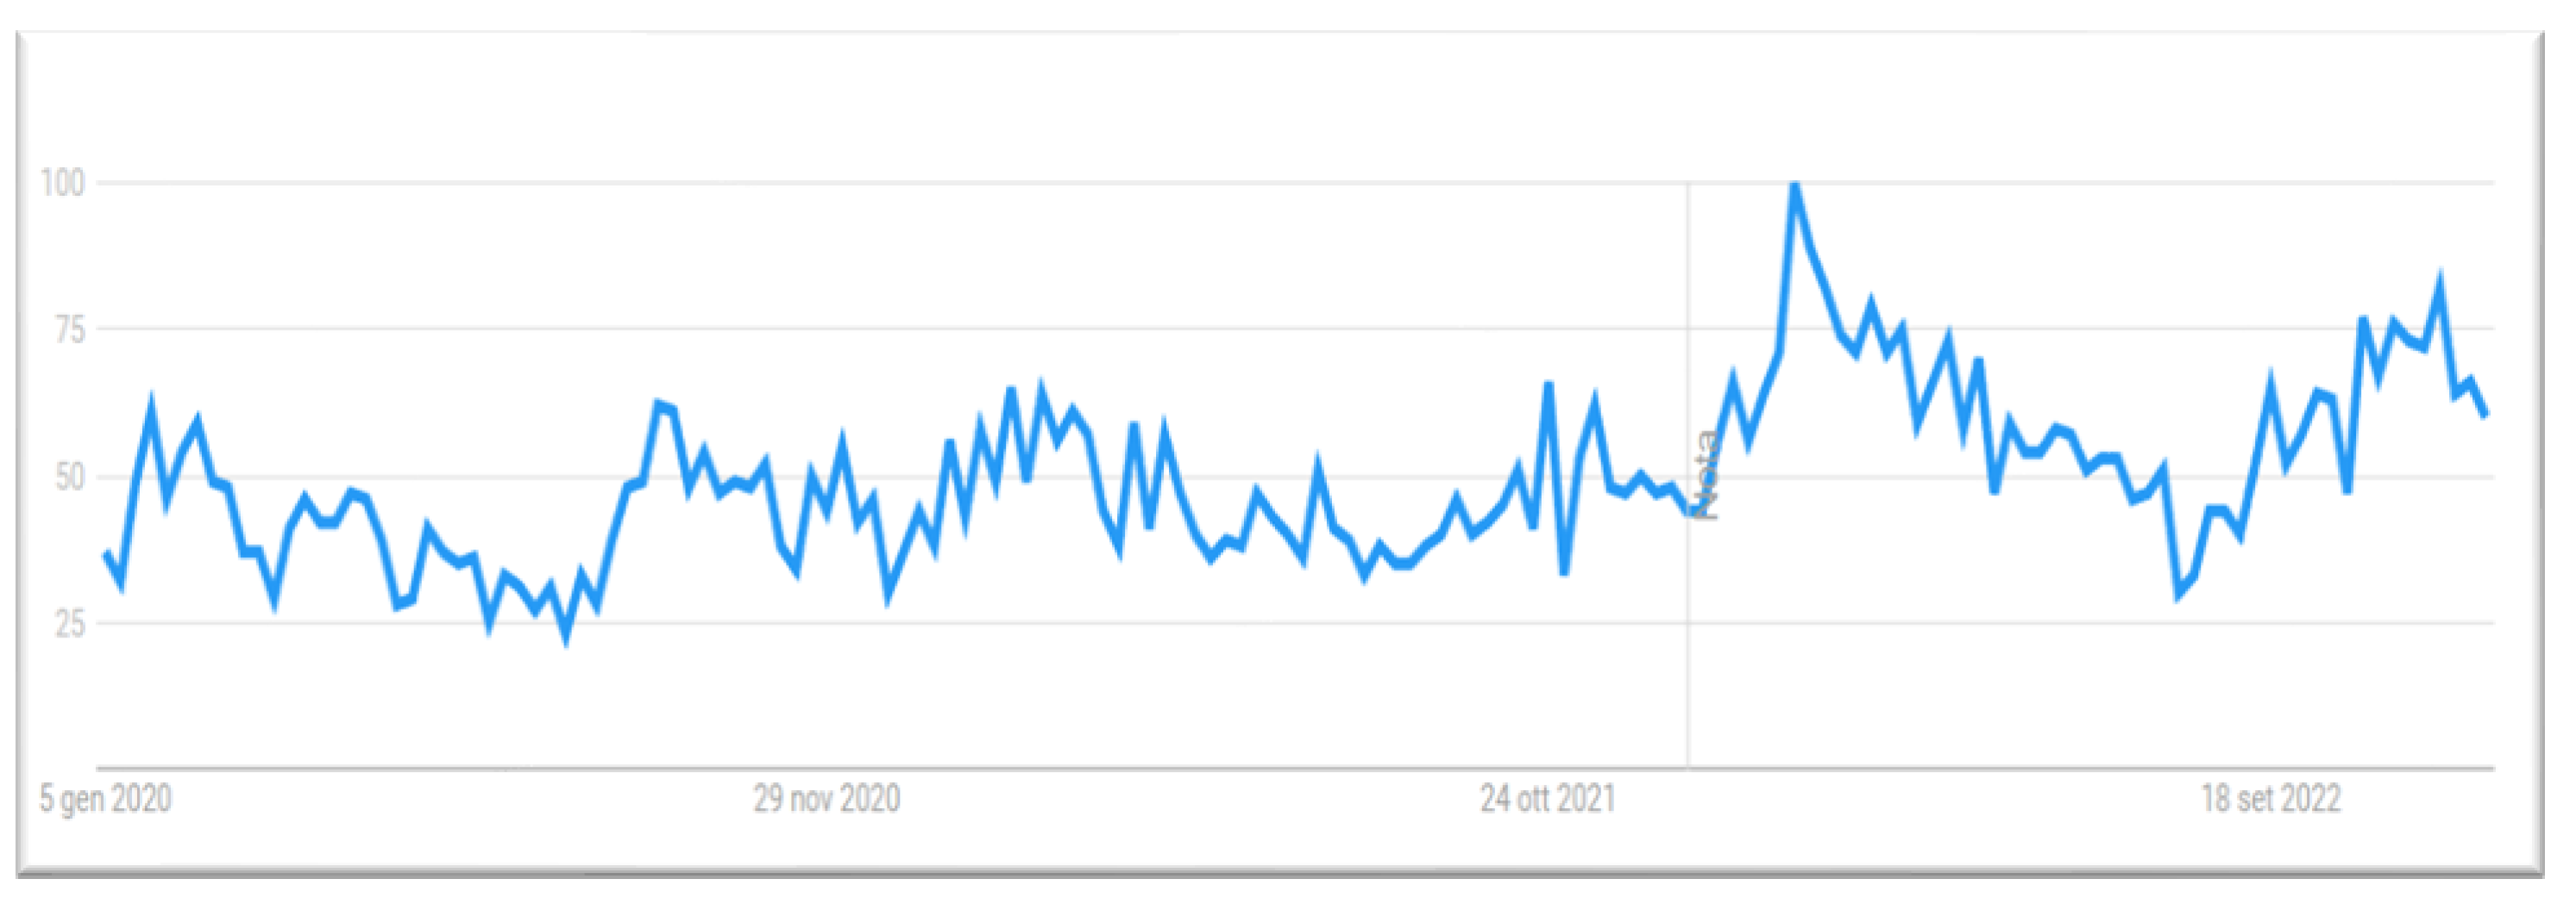
The keyword “laser ablation” was searched from 1 January 2020 to 12 December 2022 (
Figure 15).
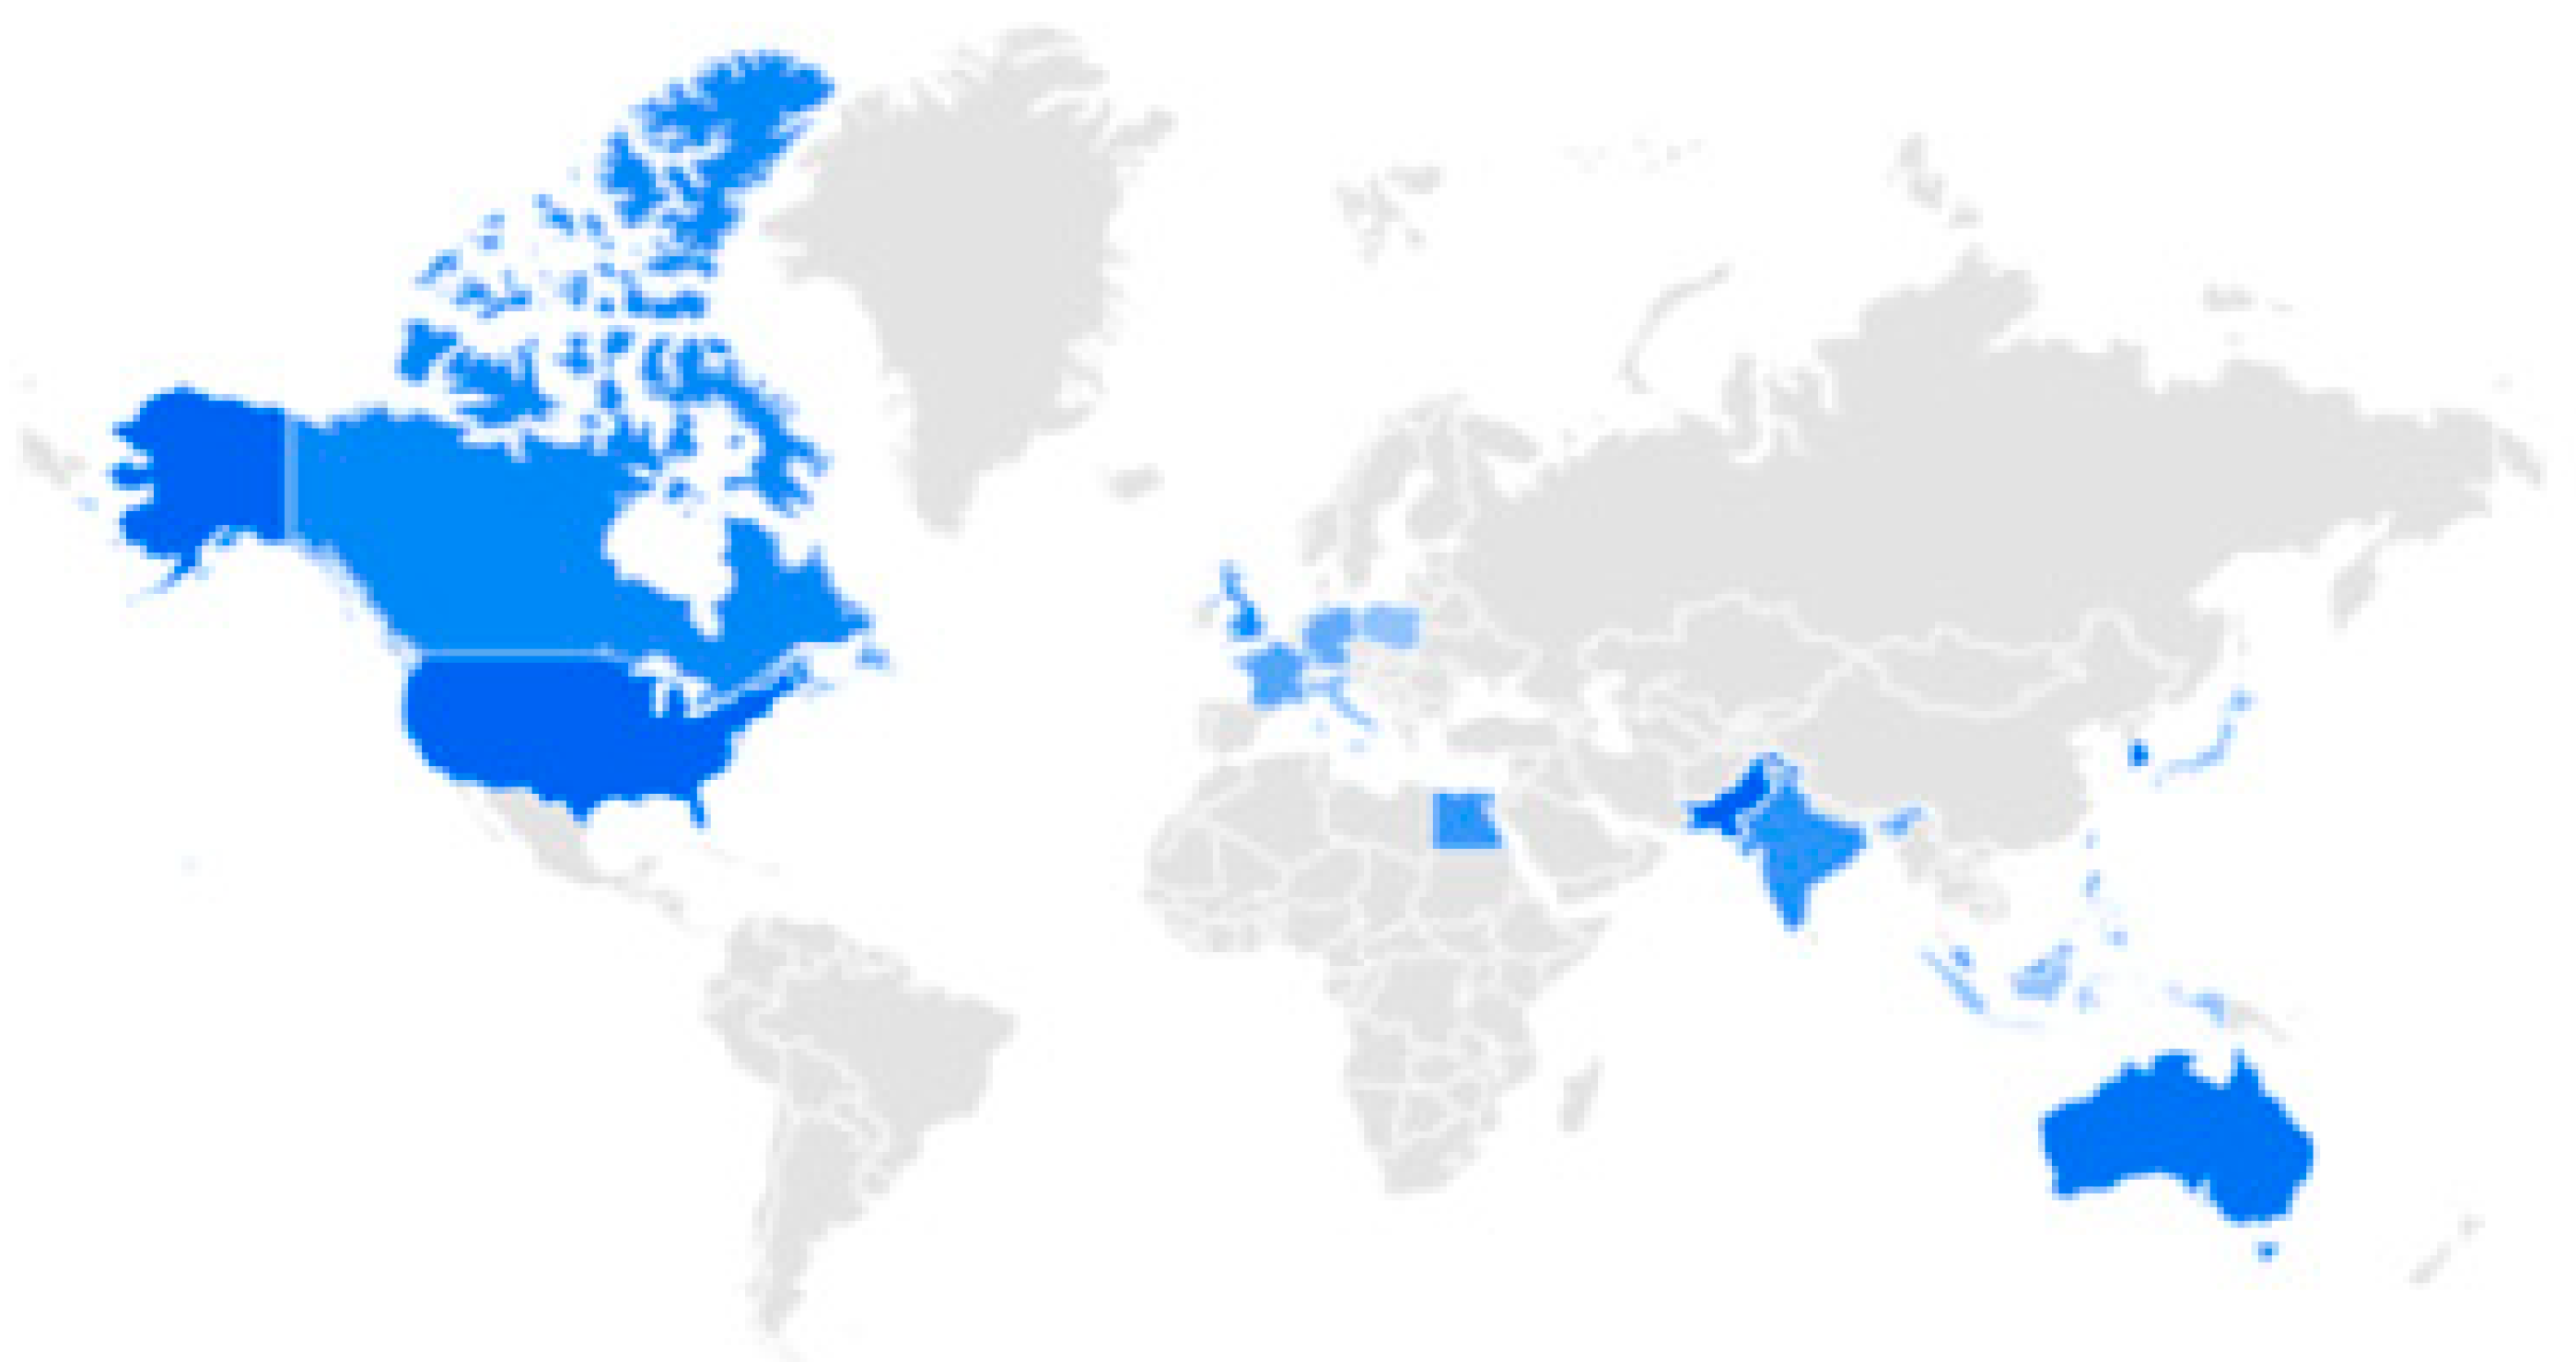
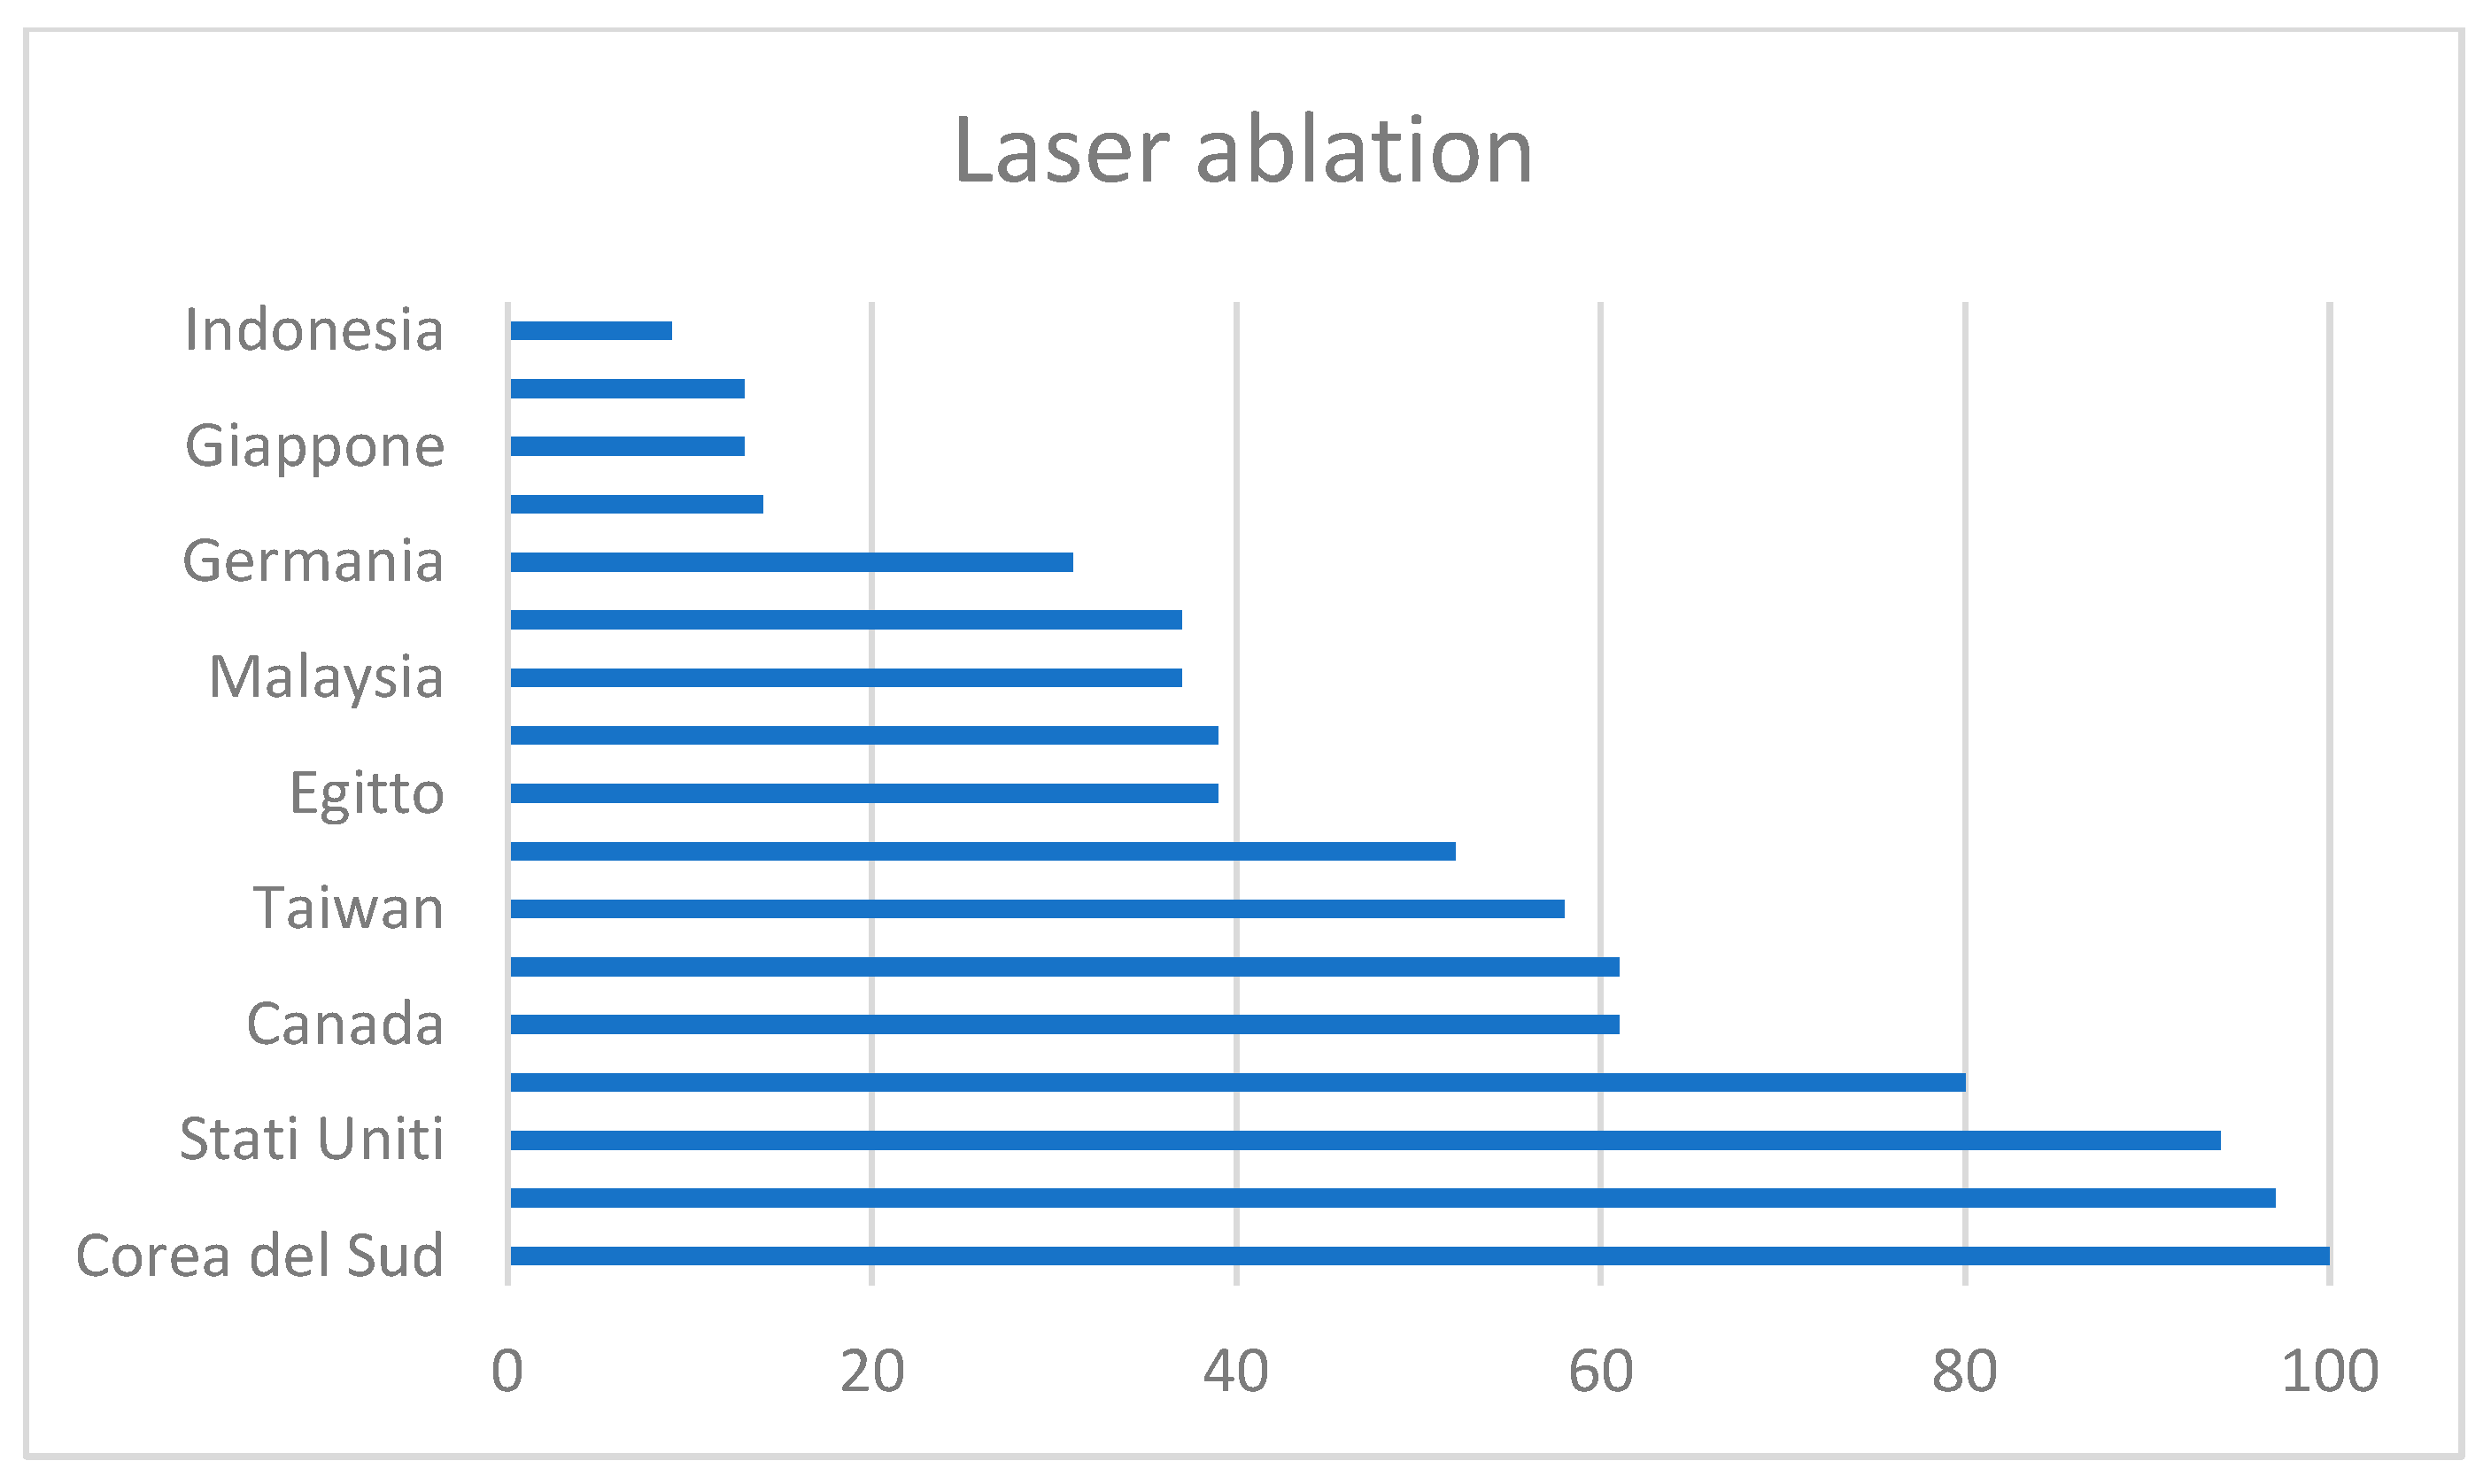
The majority of research is concentrated in South Korea, the United States, and Canada (
Figure 16 and
Figure 17), which are extremely developed and industrialized countries, where the possibility that this technique is used in a versatile way in many fields of application is highly plausible. In the sector relating to objects of artistic and cultural interest, on the other hand, the popularity of this technique in Spain is greater because a large part of the scientific production is linked to laser ablation.
It is possible to ascertain how the volumes are high and have a constant trend over time, which can be attributed to the idea that this high volume of searches is linked to the fact that this is a very versatile technique that finds applications in daily life, such as sound reproduction, telecommunications, chemistry, biology, medicine, tattoo removal, etc. (
Table 10).
4.5. IR Spectroscopy
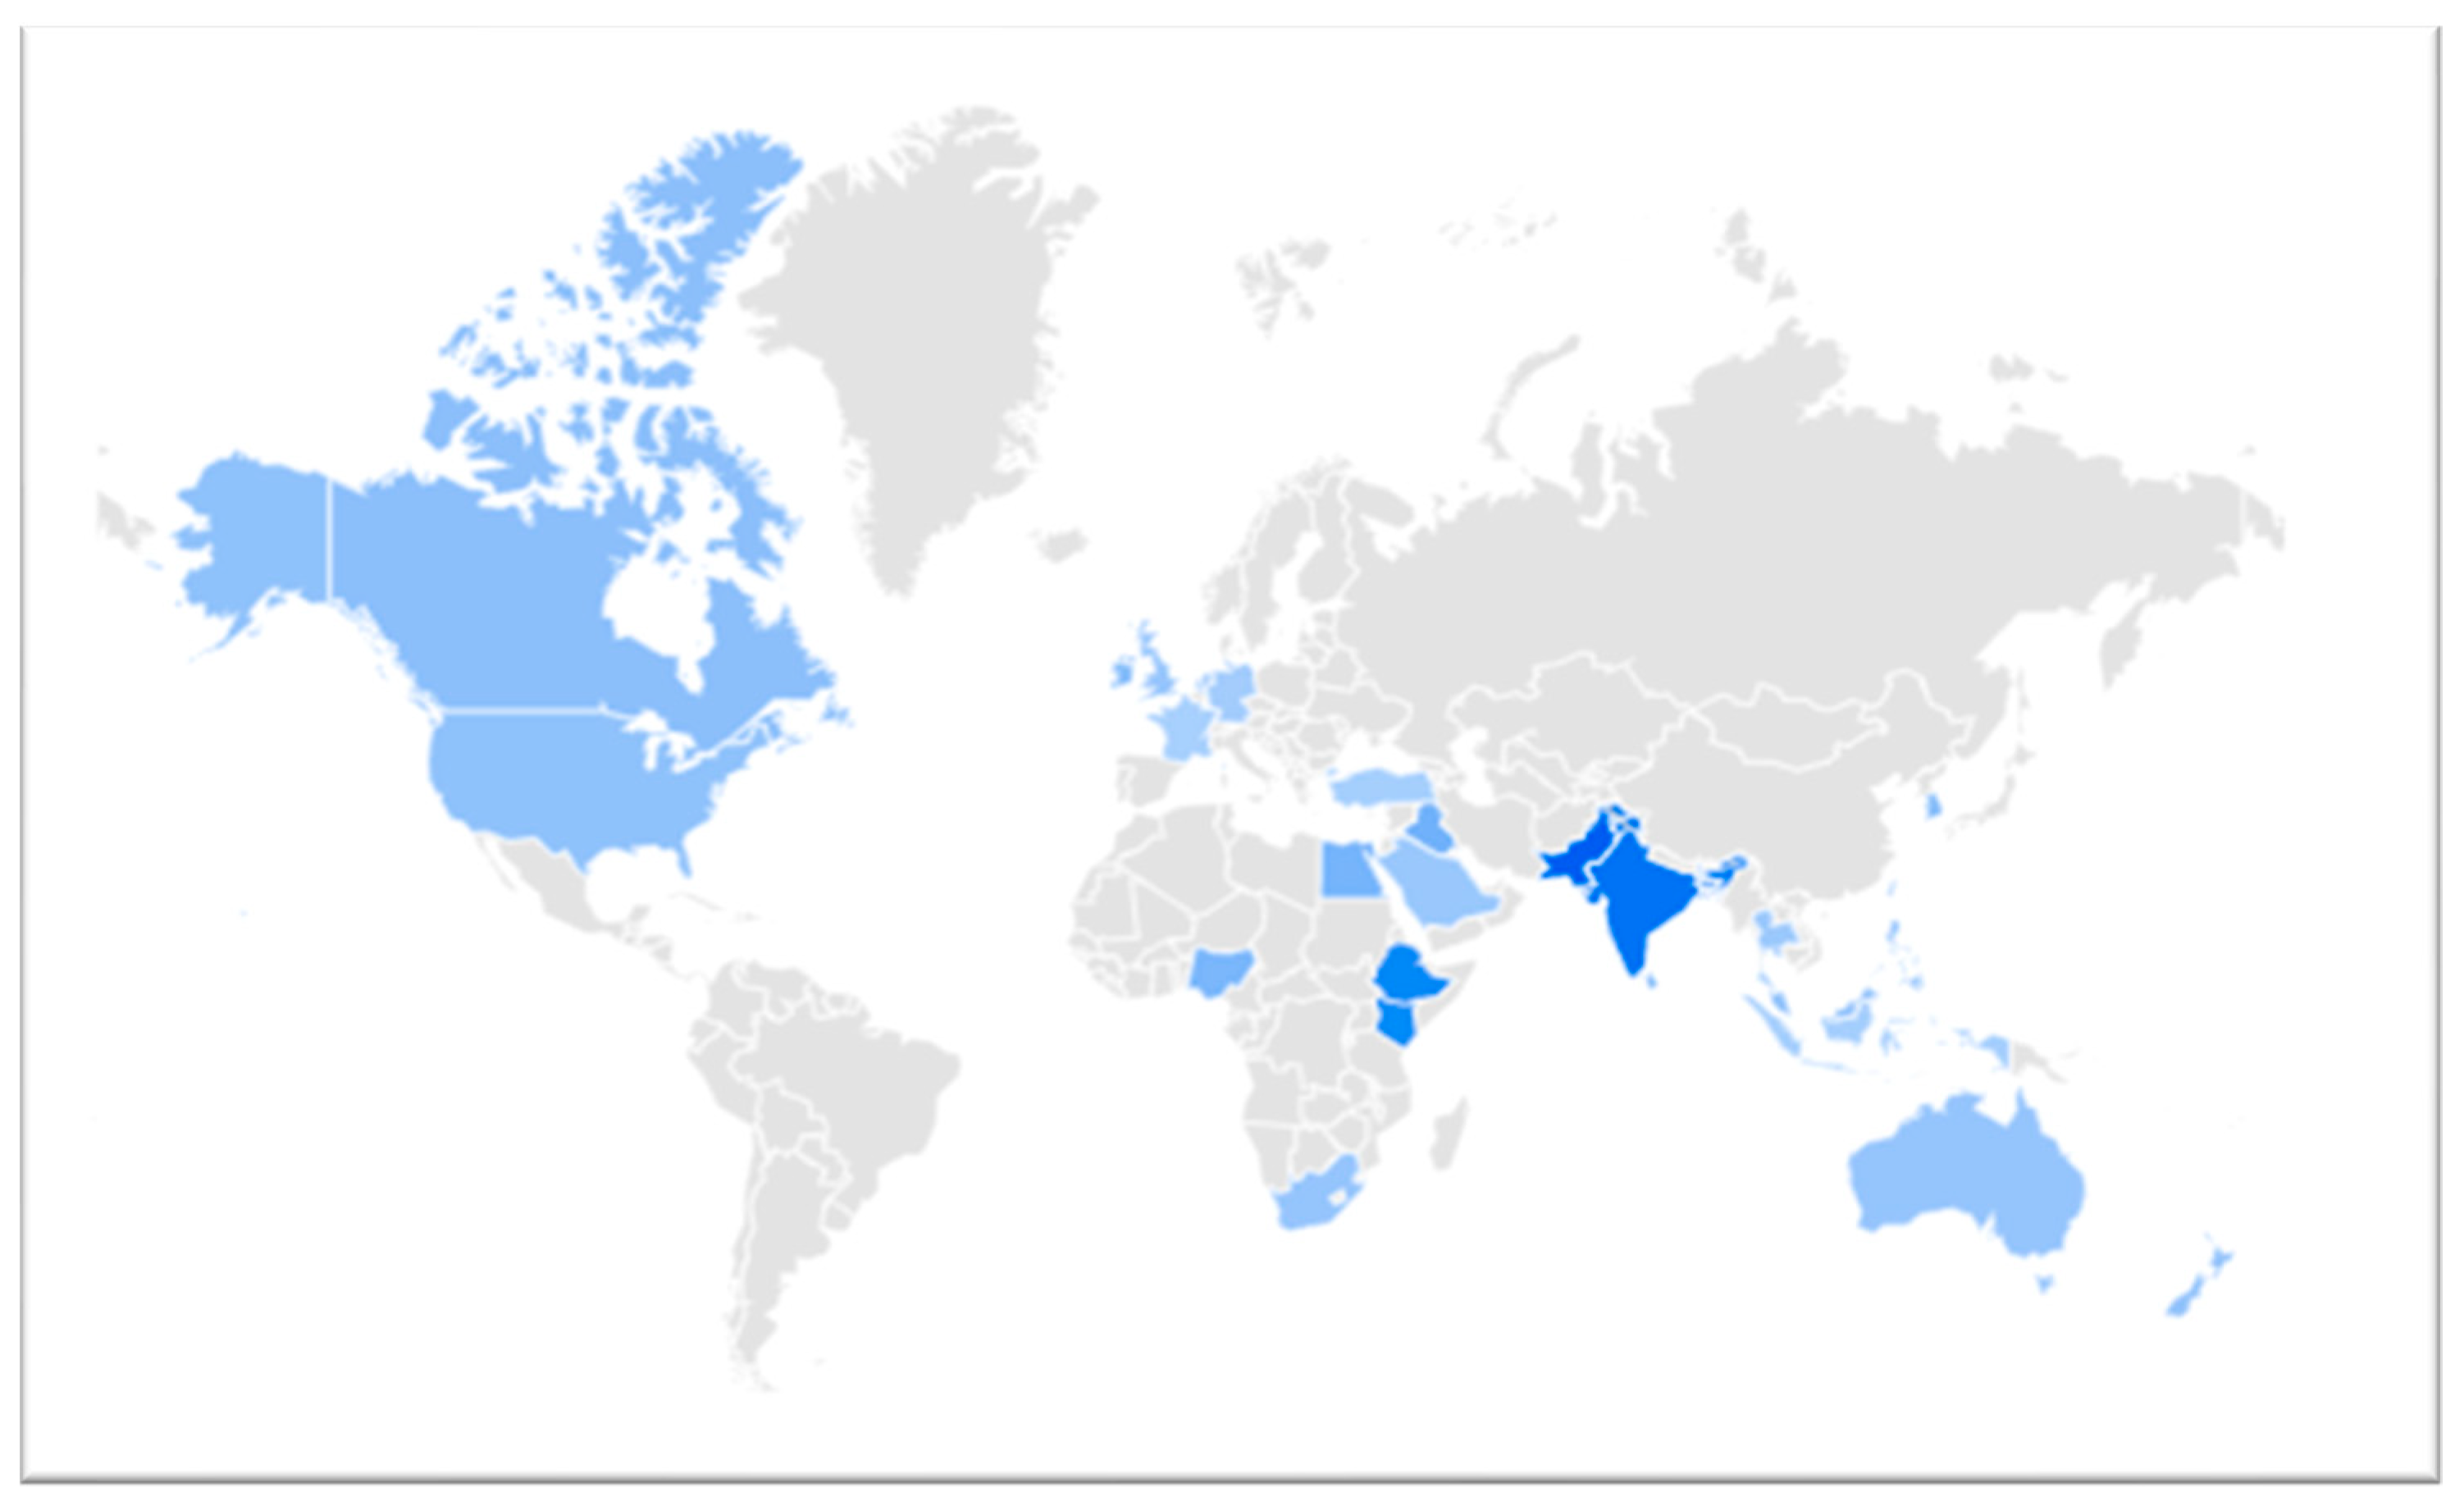
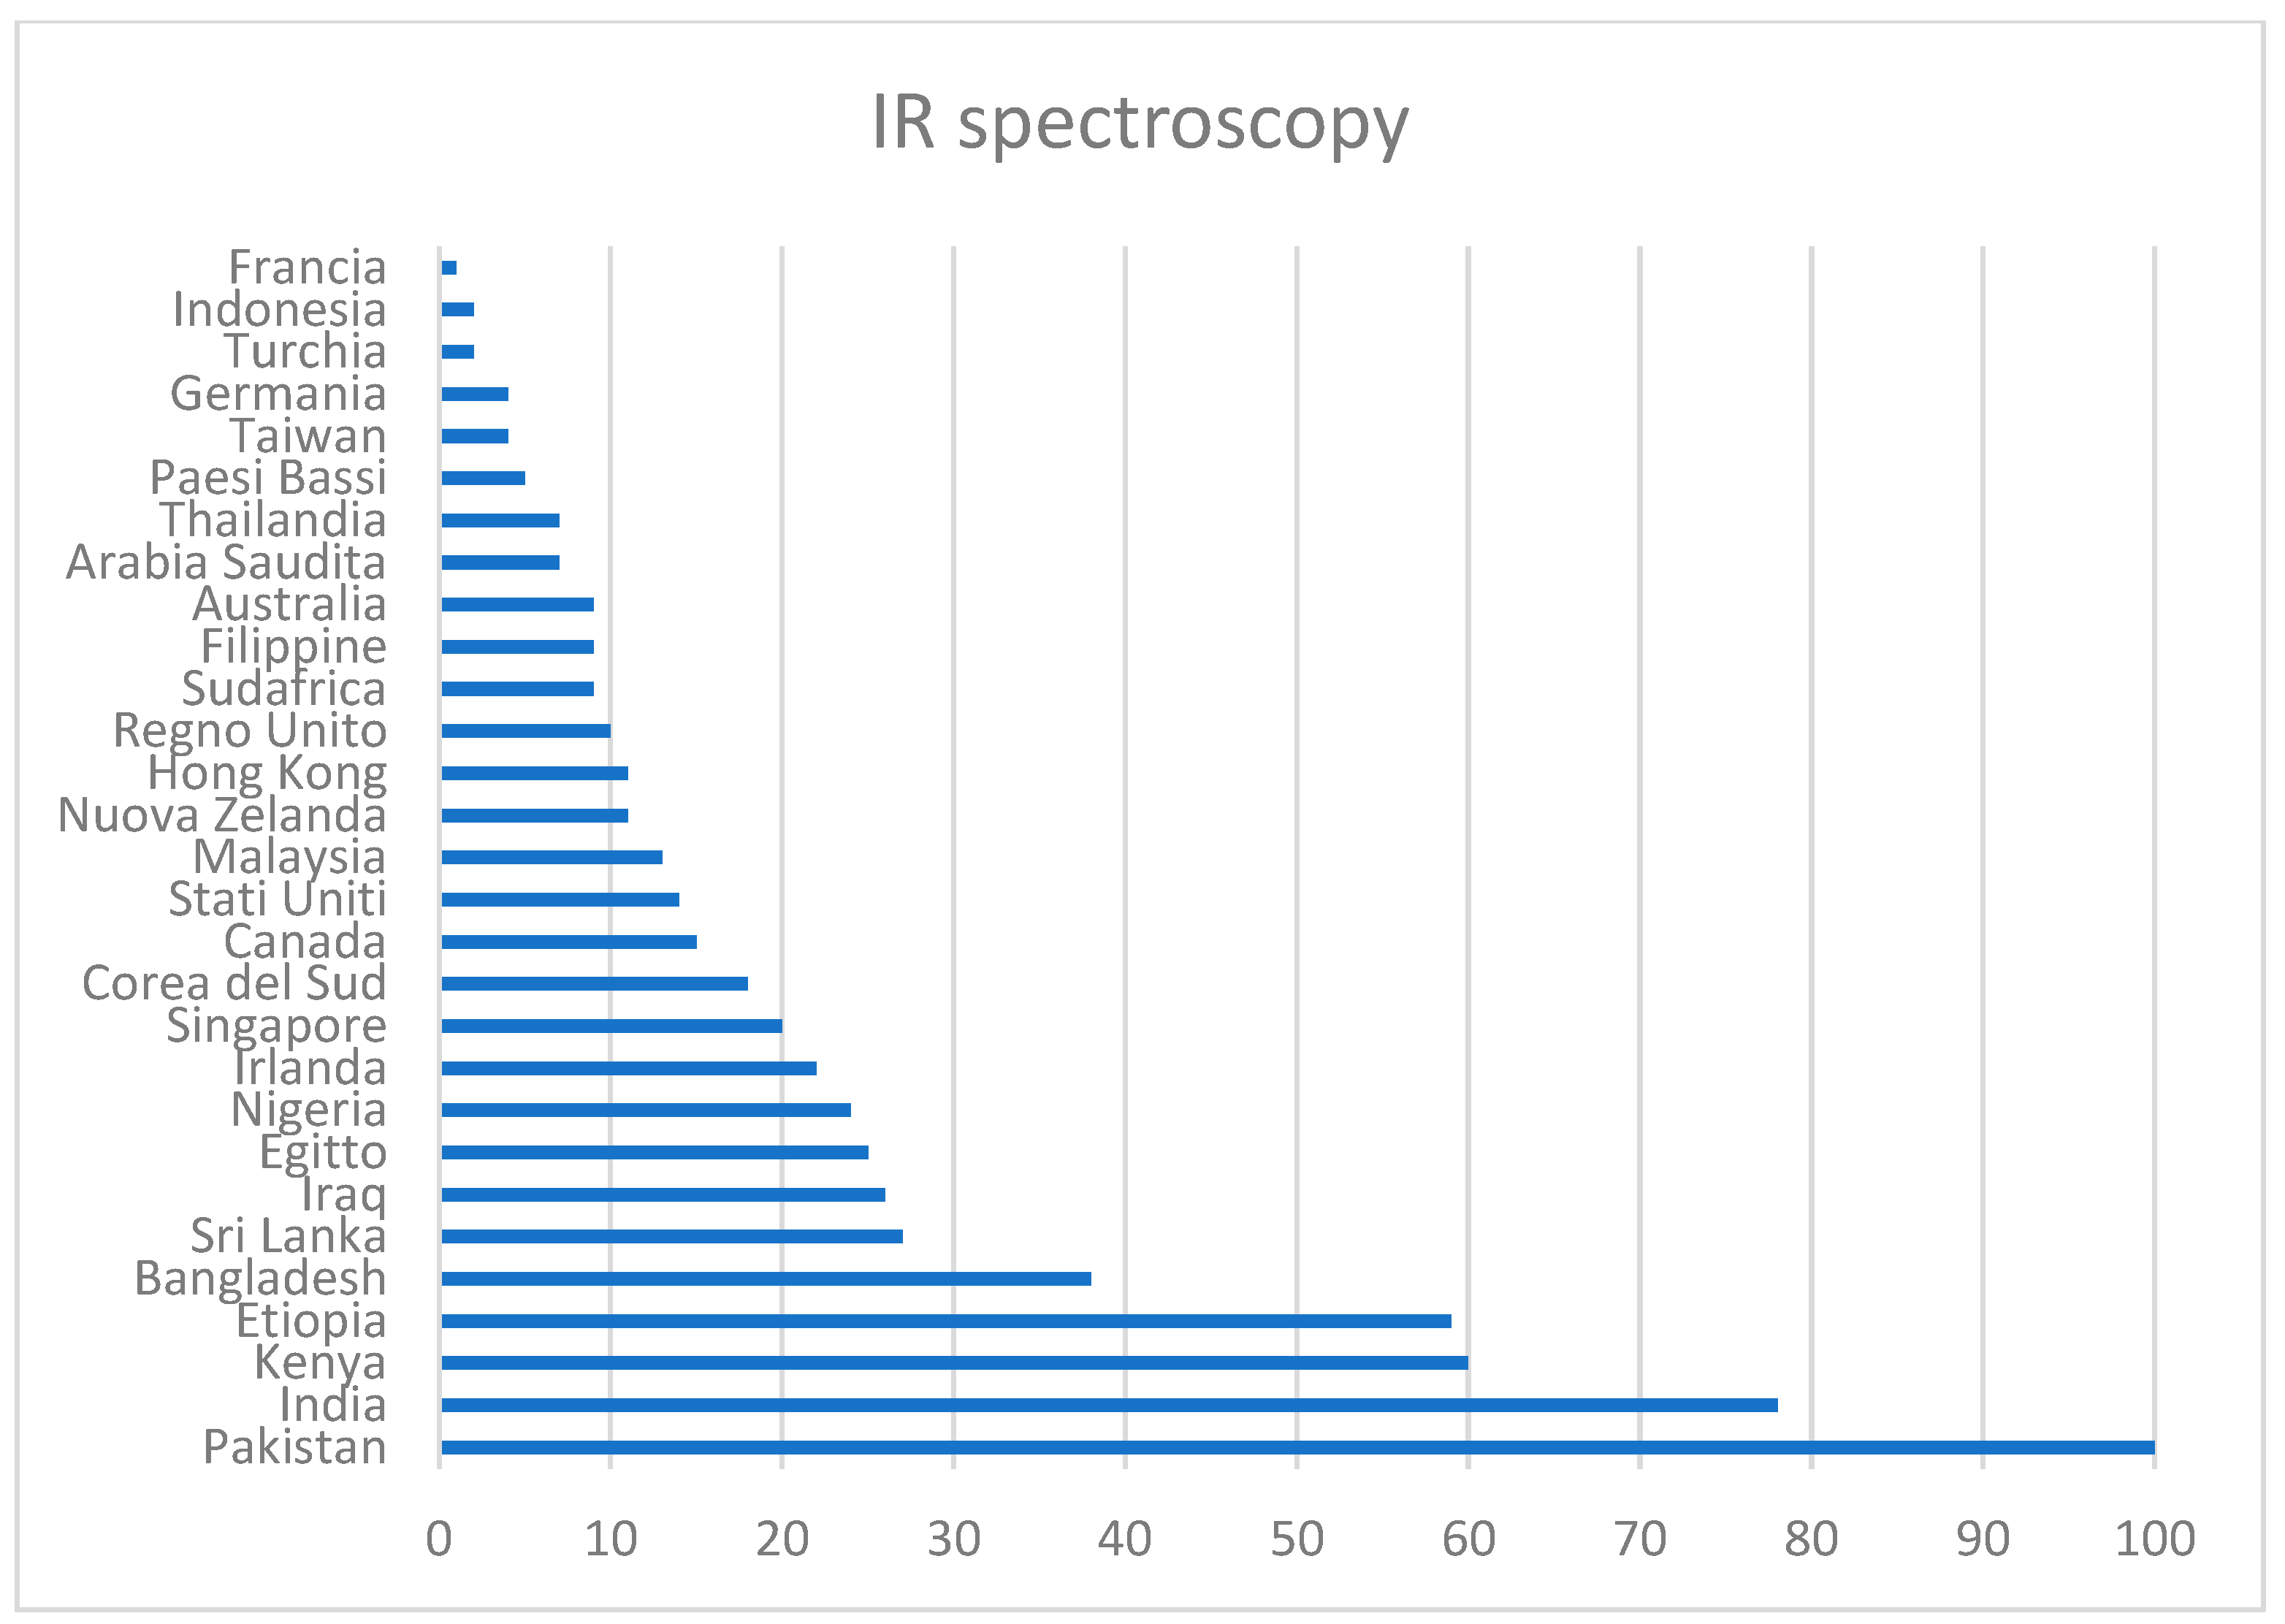
The keyword “IR spectroscopy” was searched from 1 January 2020 to 12 December 2022 (
Figure 18). A fairly linear trend can also be seen for this technique, with a search peak between 20 February 2022 and 26 February 2022.
There is a low correspondence between the online search and Australia and the USA, the main geographical areas of publication of the papers analyzed (
Figure 19 and
Figure 20;
Table 11).
4.6. Terahertz Spectroscopy
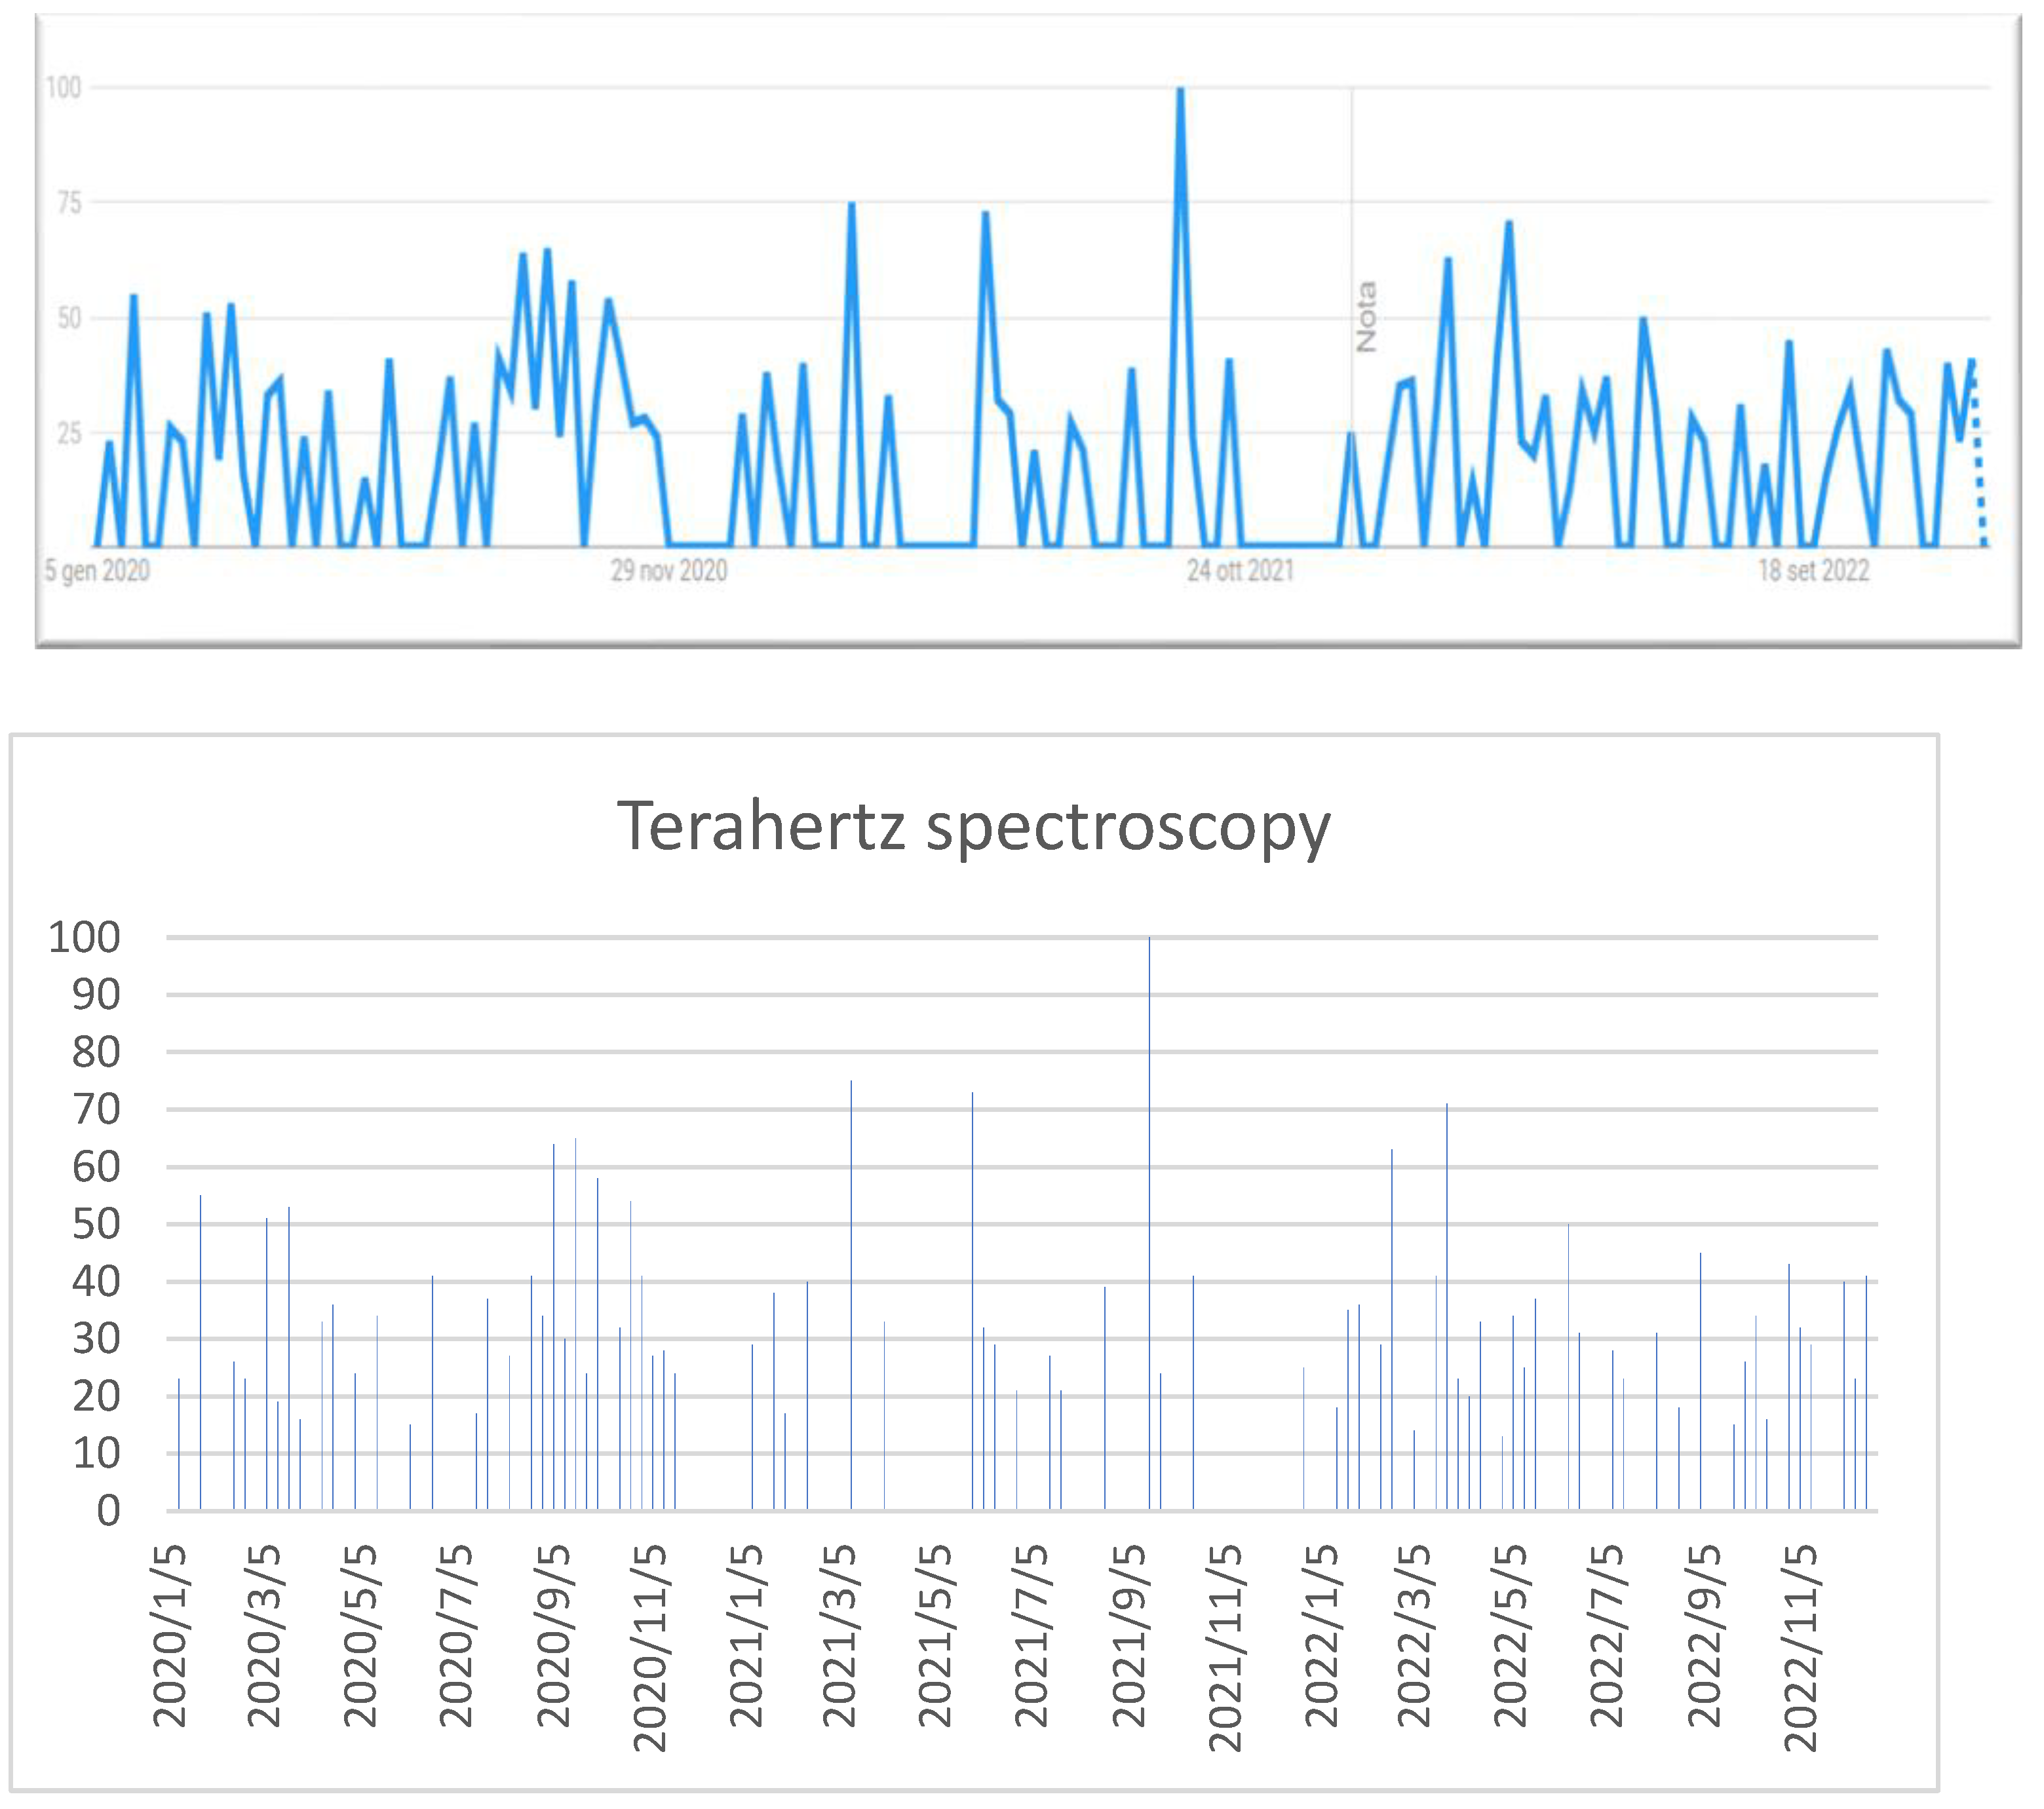
The keyword “Terahertz spectroscopy” was searched from 1 January 2020 to 12 December 2022 (
Figure 21).
The research volume for Terahertz spectroscopy is much more variable compared to the other techniques analyzed, probably because it represents a less versatile technique that finds fewer fields of application.
The research volume found is only located in the United States, while the scientific bibliography is geographically varied (
Figure 22;
Table 12).
5. Conclusions
The purpose of this review of the recent literature aims to define and summarize the trends in archaeometric analysis and laboratory techniques and the application and efficacy of each on archeologically and culturally significant artifacts.
Raman spectroscopy, X-ray fluorescence, laser ablation, IR spectroscopy, LIBS, and Thz spectroscopy techniques were analyzed, defining a general picture of the strengths and weaknesses of each technique applied to organic and inorganic matrices.
This article provides short guidelines for the right conservation and restoration strategies. The analytical tables of the literature reviewed are also reported as
Supplementary Material.
The protection, conservation, and enhancement of historical and cultural artifacts are aided greatly by the development and proper use of the techniques in this paper. Most importantly, non-invasive or in situ instrumentation helps us to reveal the history locked within an article. This, in turn, leads to preservation and a deeper understanding of the ancient past.
