Article

Hydrological Regime of Rivers in the Periglacial Zone of the East European Plain in the Late MIS 2

1
Geographical Faculty, Lomonosov Moscow State University, Leninskiye Gory, 119899 Moscow, Russia
2
Institute of Geography Russian Academy of Sciences, Staromonetny 29, 119017 Moscow, Russia
*
Author to whom correspondence should be addressed.
Quaternary 2024, 7(3), 32; https://doi.org/10.3390/quat7030032
Submission received: 11 March 2024 / Revised: 20 June 2024 / Accepted: 17 July 2024 / Published: 19 July 2024

Abstract

:
At the end of the Pleniglacial and the first half of the Late Glacial period, approximately between 18 and 14 ka BP, rivers of the central and southern parts of the East European Plain had channels up to 10 times as large as the present day channels of the same rivers. These ancient channels, called large meandering palaeochannels, are widespread in river floodplains and low terraces. The hydrological regime of these large rivers is of great interest in terms of the palaeoclimatology of the late Marine Isotope Stage 2 (MIS 2). In this study, we aimed at quantitative estimation of maximum flood discharges of rivers in the Dnepr, Don and Volga basins in the late MIS 2. To approach this, we used massive measurements of the morphometric characteristics of large palaeochannels on topographic maps and remote sensing data—palaeochannel width, meander wavelength and their relationships with river flow parameters. The runoff depth of the maximum flood, which corresponds to the maximum depth of daily snow thaw during the snowmelt period, was obtained for unit basins with an area of <1000 km2. The mean value for the southern megaslope of the East European Plain was 44.2 mm/day (6 times the modern value), with 46 mm/day for the Volga River (5.5 times), 45 mm/day (6.3 times) for the Don River and 39 mm/day (8 times the modern value) for the Dnepr River basins. In general, the Dnepr basin was drier than the Don and Volga basins, which corresponds well to the modern distribution of humidity. At the same time, the westernmost part of the Dnepr River basin was relatively wet in the past, and the decrease in humidity from the past to the modern situation was greater there than in the eastern and central regions. The obtained results contradict the prevailing ideas, based mainly on climatic modeling and palynological data, that the climate of Europe was cold and dry during MIS 2. The reason is that palaeoclimatic reconstructions were made predominantly for the LGM epoch (23–20 ka BP). On the East European Plain, the interval 18–14 ka BP is rather poorly studied. Our results of paleoclimatological and palaeohydrological reconstructions showed that the Late Pleniglacial and the first half of the Late Glacial period was characterized by a dramatic increase in precipitation and river discharge relative to the present day.

1. Introduction

At the end of Marine Isotope Stage 2 (MIS 2), including the final Pleniglacial and Late Glacial periods, meandering rivers with channel sizes (width and meander wavelength) up to 10–15 times larger than modern ones in the same river basins were formed on the plains of the Northern Hemisphere. This phenomenon was noted by Dokuchaev [1] and Davis [2], and in the middle of the last century in the works of Dury [3,4], Schumm [5,6], Volkov [7] and Makkaveev [8] it received a methodological apparatus for research and fairly reliable explanation. A significant number of publications on the morphology, age and origin of such large ancient rivers (see [9] with the bibliography) allows us not to dwell on their detailed characteristics.
In terms of the number of well-preserved fragments of the channels of such large ancient rivers, the territory of the East European Plain has no analogues on the Globe. The morphological and geological features of this ancient river system (its “memory”) contain information that allows reconstruction of the former hydrological regime of the rivers on this large territory. This article examines the methodological and paleoclimatic problems that arise due to existence of large meandering rivers at the end of MIS 2 (approximately 18–14 ka BP). The maximum flood discharges of the ancient rivers that drained the southern megaslope of the East European Plain (the basins of the Volga, Don and Dnepr Rivers) were calculated. The improved methodology of the reconstruction [10] was used, as well as a large number of new paleochannel fragments, obtained with remote sensing.

2. Study Area

2.1. General Information

The East European Plain occupies the eastern part of Europe. This territory was described in [11] and most of the general information is published in the National Atlas of Russia [12]. The southern megaslope of the Plain between eastern slopes of the Carpathian Mountains and the western edge of the Ural Mountains belongs to the basins of the Black and Caspian Seas. The headwaters of all main rivers are situated on the main water divide of the Plain including (from the west to the east) the Belorussian Ridge, the Smolensk Ridge, the Valdai Upland and the Northern Ridge with maximum elevations about 350 m a.s.l. (Figure 1). The largest European rivers drain this territory: the Dnepr River with a basin area of 504,000 km2, the Don River with an area of 422,000 km2 and the Volga River with an area of 1,360,000 km2. The Srednerusskaya (Middle Russian) Upland divides the basins of the Dnepr and Upper Volga, Don Rivers, and Privolzhskaya (Sub-Volga) Upland, the basins of the Don and Volga Rivers. On the southern megaslope of the East European Plain, the mean July air temperature increases from the north to the south from 16 °C to 24 °C, and that of January increases from the east to the west from −16 °C to −4 °C [12]. The annual precipitation decreases from 500–600 mm in the western part of the territory to less than 250 mm in its southeastern part. The northern part of the territory is covered by boreal (taiga), coniferous-broad-leaved and broad-leaved forests and further to south by forest–steppe and steppe (Figure 1). The lower part of the Volga River basin near the Caspian Sea belongs to semidesert and desert zones. Natural vegetation in the central and southern parts of the Plain has been largely replaced by agricultural crops, especially in the forest steppe and steppe zones [13].

2.2. Large Ancient Meandering Rivers

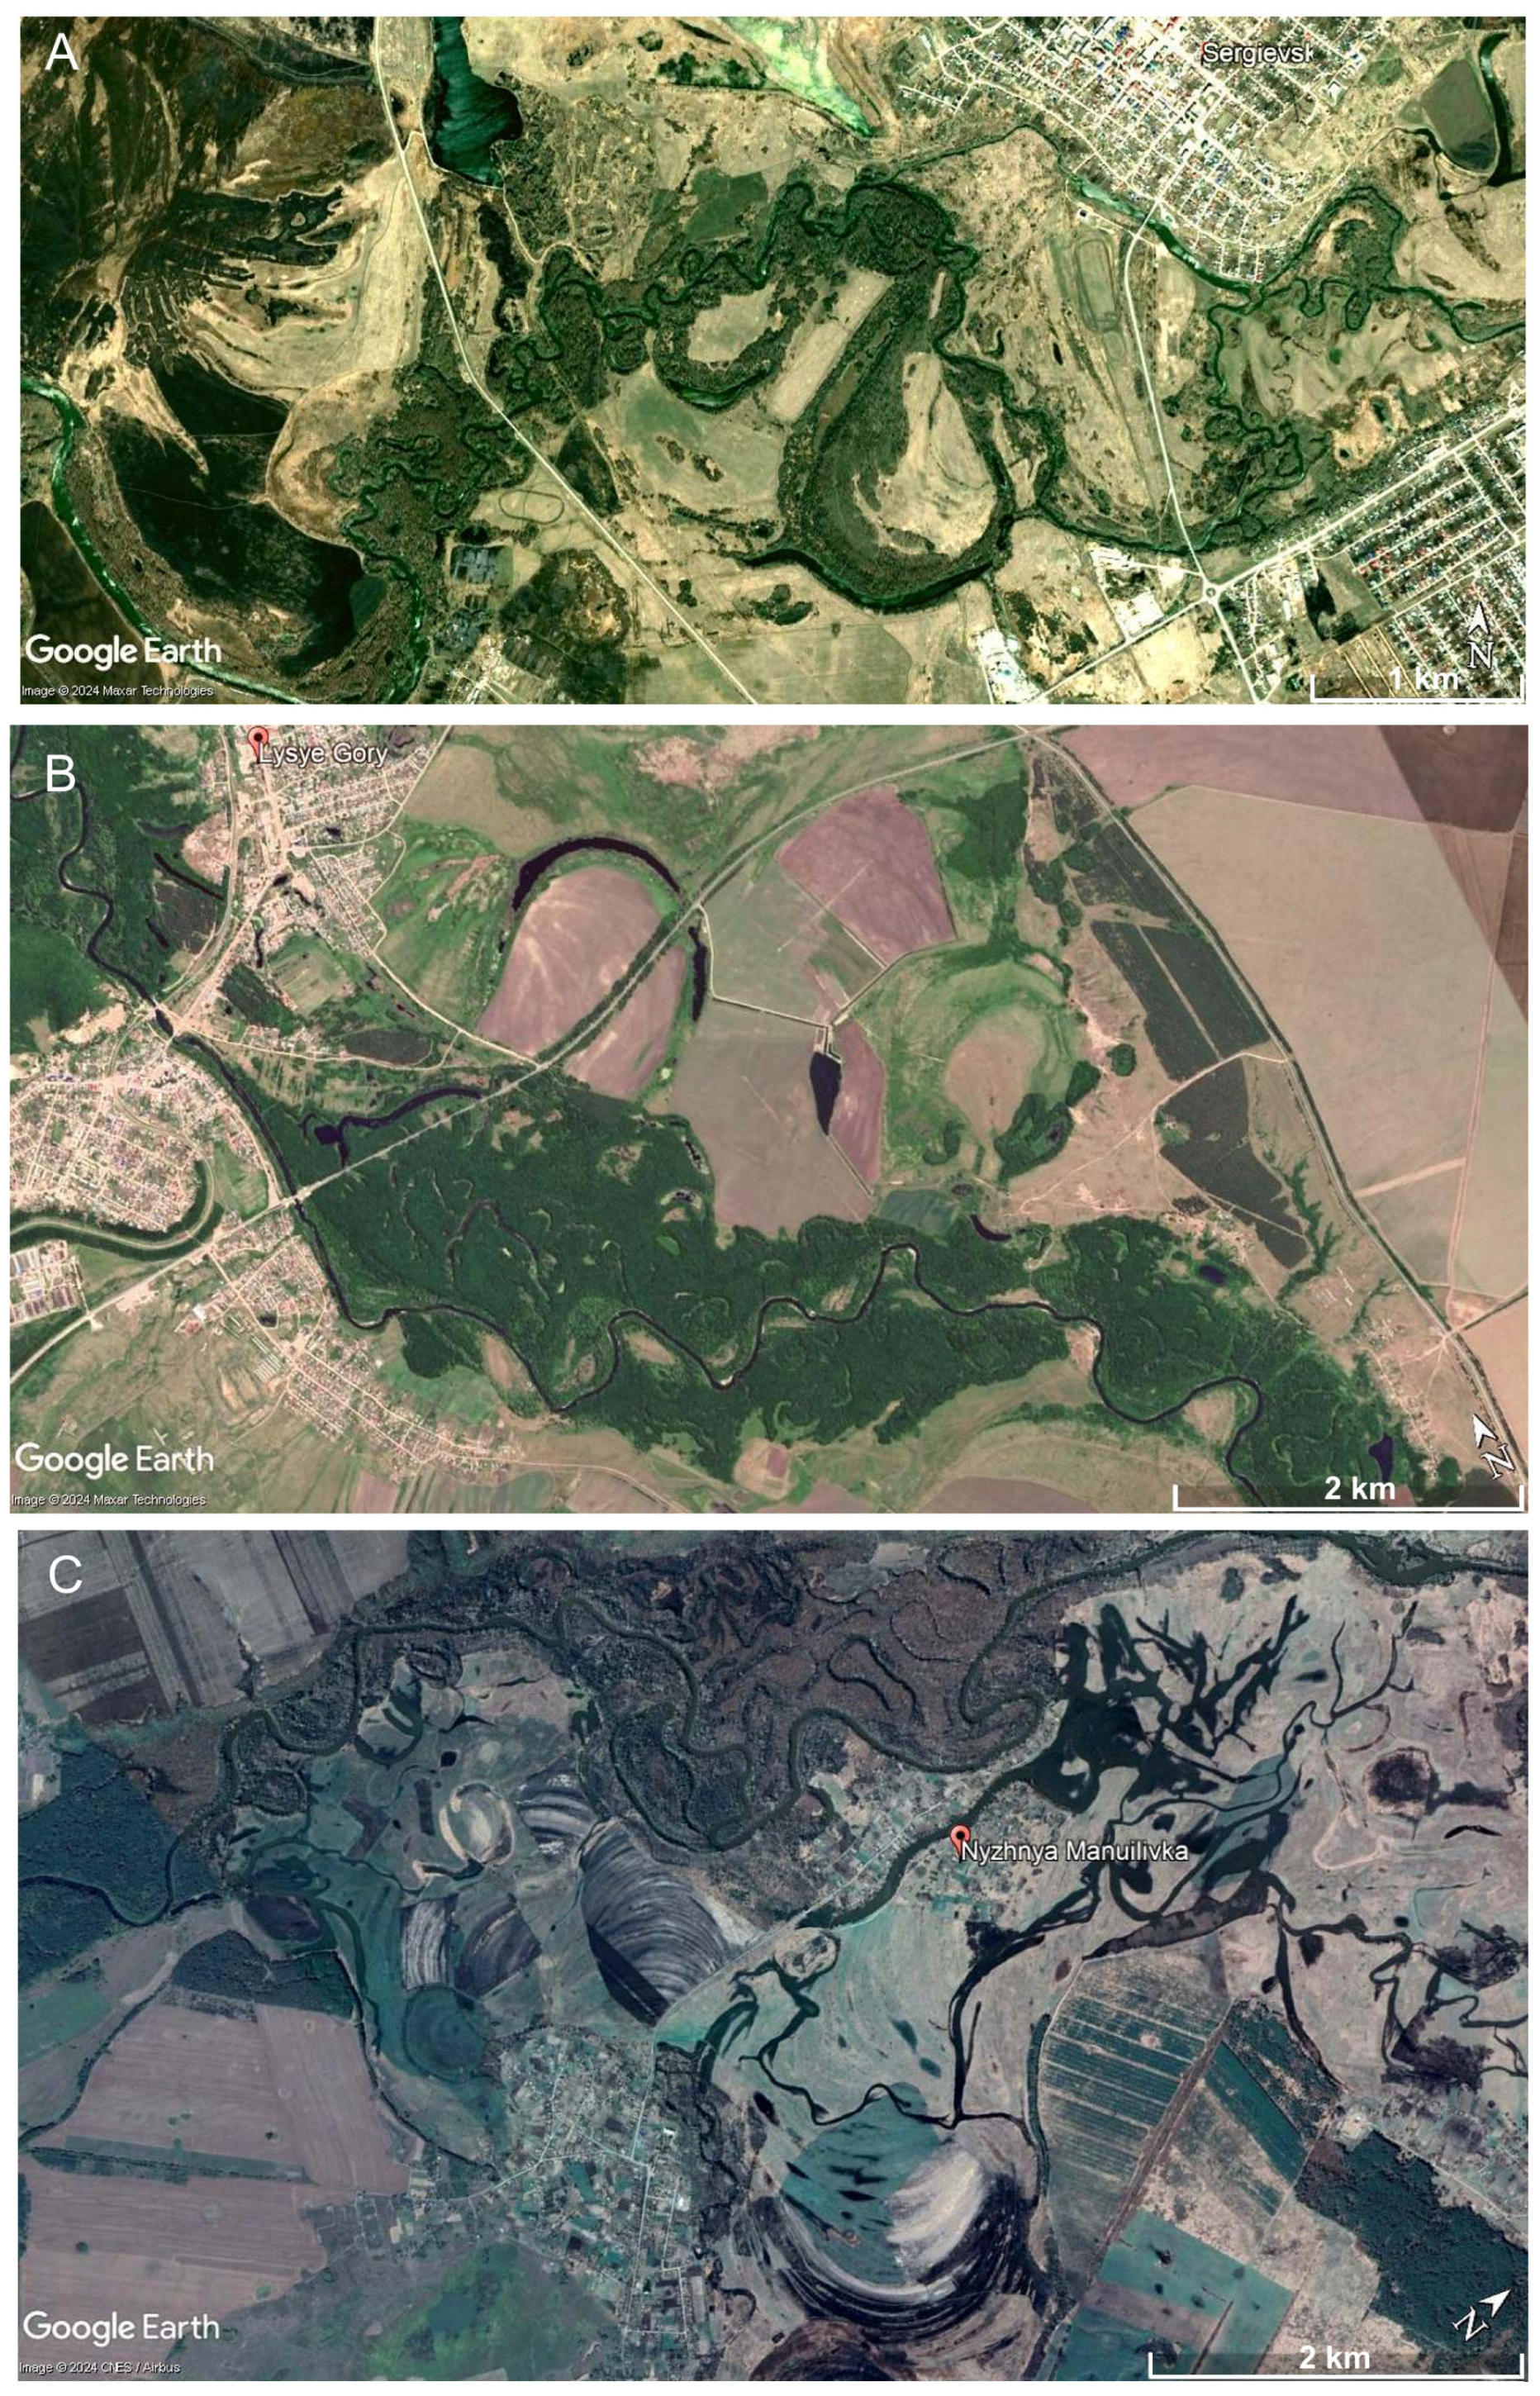
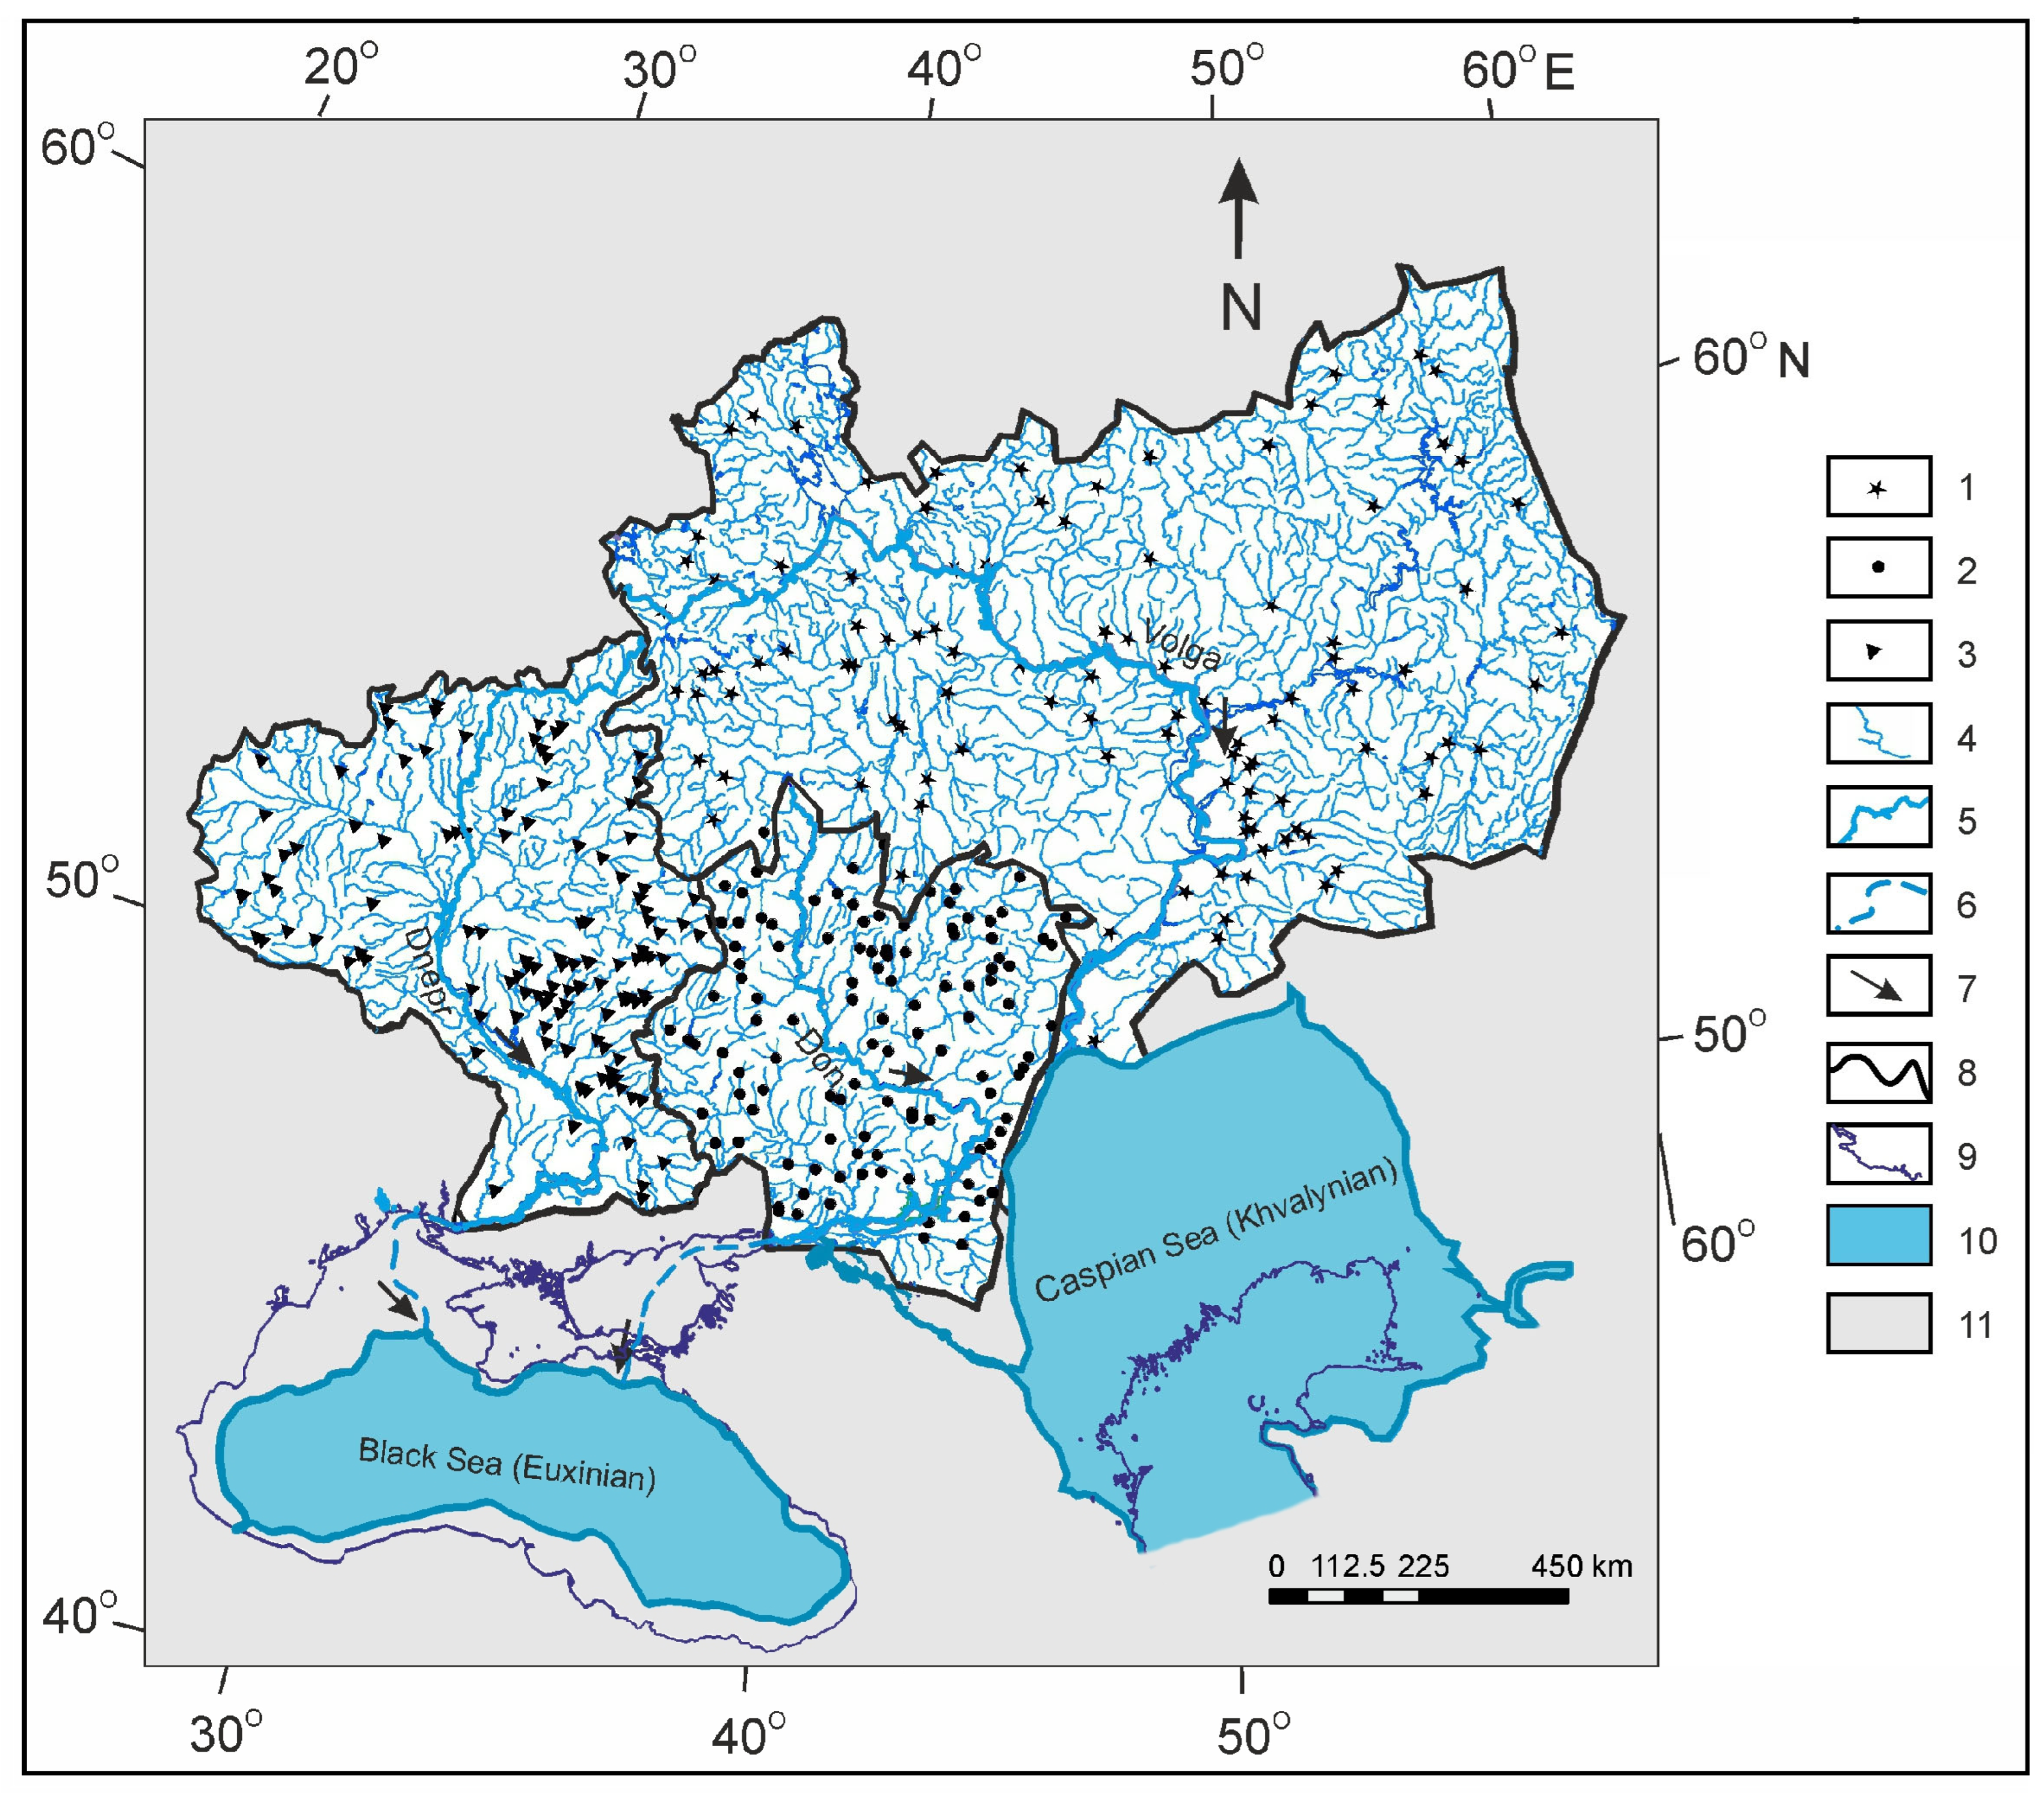
There are more than 400 well-preserved fragments of large meandering paleochannels within the southern megaslope of the East European Plain. Mostly, they are abandoned large ox-bows on the floodplains and first terraces (see examples in Figure 2). Much more numerous are less distinct remnants, such as large natural levees, the cirques of floodplain edges, bends of the valley bottom inherited from the large meanders, that were not (if possible) used in this study. Dokuchaev [1] based his ideas on the evolution of the fluvial systems on the examples of small underfit rivers with broad floodplains in the Dnepr River basin; Makkaveev and colleagues [8] described several large paleochannels (as well as the channels smaller than the modern ones) in the Don and Dnepr River basins. In our paleohydrological analysis, 364 fragments of large paleochannels (Figure 3) are used (104 sites in the Volga River, 122 in the Don River and 138 sites in the Dnepr River basins). The main sources of the information are collections of space images in Google Earth [14] and Yandex Maps [15].
The structure of the MIS 4 and MIS 2 rivers before the onset of deglaciation is still poorly studied due to the rarity of definite morphological traces of their channels. We can only assume that these rivers were shallow and braided. Large paleorivers were active on the entire southern megaslope of the East European Plain in the Late Pleniglacial and Late Glacial time [9]. Their development occurred under conditions of periglacial landscapes and continuous permafrost [16]. The most favorable conditions for the formation of large rivers were transitional conditions from a cold and dry climate to a milder and wetter climate. Such conditions occurred about 19–16 ka BP at the transition from the Last Glacial Maximum (LGM) to the so-called Raunis Interstadial and 15–14 ka BP at the transition from the Oldest Dryas to Bølling [9].
In [17], based on an analysis of radiocarbon dates, the time of formation of large palaeochannels in the Dnepr, Don, and Volga basins was attributed to the interval 18–13 ka BP. Later, a large array of radiocarbon dates was obtained for the large palaeochannels of rivers in the Volga basin, which allowed estimation of the time of their formation more precisely—from 17.3 to 13.8 ka BP [18]. No differences in the time of formation of large palaeochannels in different parts of the Volga basin were found.
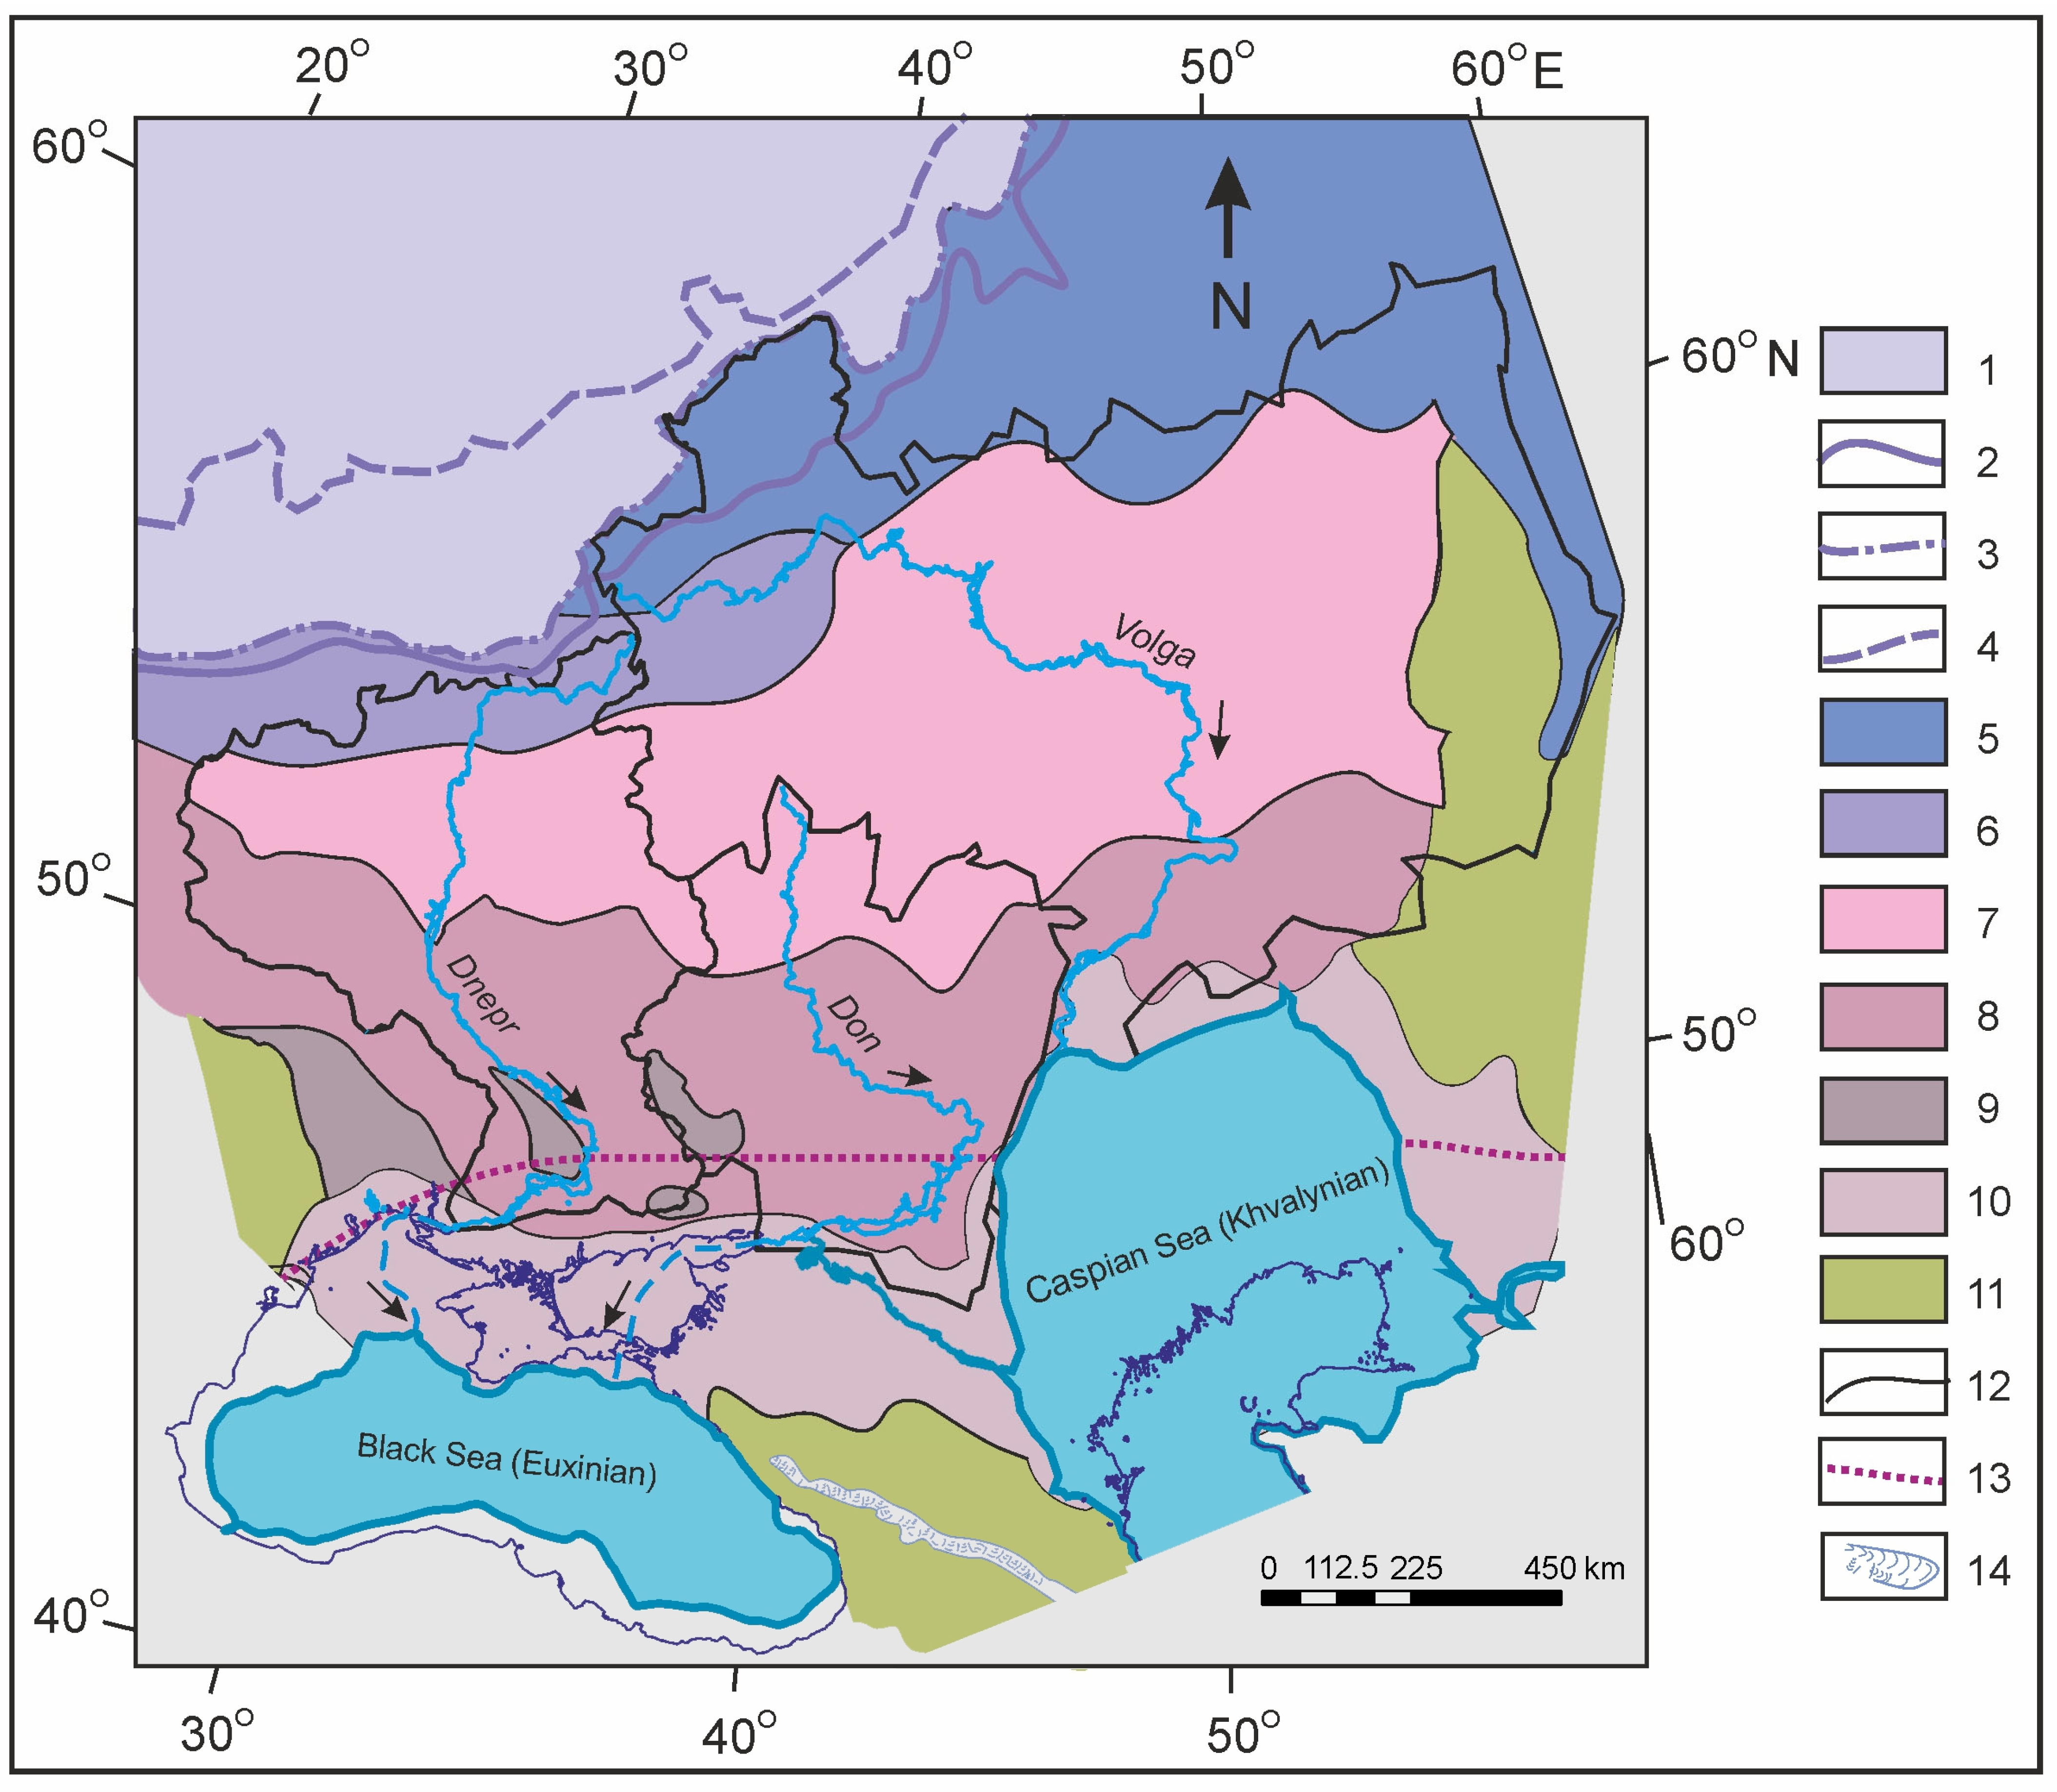
During the LGM, the Scandinavian ice sheet reached the headwaters of the Dnepr and upper Volga Rivers. At the beginning of deglaciation, melt water flowed down these rivers into the Black [19] and Caspian [20] seas. About 19 ka BP, the Scandinavian ice sheet of the Pomeranian stage had already retreated to the north of the main water divide of the East European Plain and the ice melt waters did not flow at its southern megaslope. The northern narrow belt of the territory was covered by tundra-steppe vegetation; the central part had steppe vegetation with sparse forest, and the southern part had steppe vegetation [16]. Only the southern part of the territory at the lower reaches of the Don and Dnepr Rivers was then free of permafrost (Figure 4).
Compared to the modern vegetation zones on the East European Plain (Figure 1), periglacial vegetation was much more homogeneous throughout this vast territory, which allowed Velichko [16] to introduce the concept of periglacial hyperzone, which included a complex of tundra, steppe, and to a lesser extent open forest communities in conditions of widespread permafrost. Such vegetation in modern (interglacial) conditions has no direct and complete analogues on the East European Plain. The closest contemporary analogues of such complex vegetation are found in the intermountain depressions of the Altai and Sayan Mountains under continental climatic conditions [16].

2.3. Hydrological Data

The hydrological regime of the rivers of the East European Plain has been statistically stable since the beginning of measurements at the end of the 19th century until the 1970s, when recent global climate changes began to affect the water balance and hydrological regime of this territory. Therefore, we further used hydrological data about maximum discharges, formed mostly by water from thawing snow, collected up to and including the 1970s, analyzed and published by the State Hydrometeorological Service of the former USSR (as, for example, in [21]).

3. Methods

The methodological basis for the study of ancient rivers is morphometric analysis. Morphometric analysis in hydrology is based on the principle of bounded natural complexes, formulated by Velikanov [22], since “the mutual control of the flow and the channel leads, as a result of all transformations, to certain, most probable combinations between the morphometric characteristics of the channel and the hydraulic characteristics of the flow” ([22], p. 58). In practice, this principle justifies the construction of relationships between the morphometric characteristics of the channel and the hydraulic characteristics of the flow (regime equations), as well as between different morphometric characteristics of the channel.
To reconstruct the hydrological regime of the paleorivers with the morphometric analysis, we have at our disposal the following: (1) the morphology and hydrology of modern meandering rivers and their basin areas; (2) the morphology of the channels of ancient meandering rivers and, in some cases, some hydraulic characteristics (channel slope, alluvium grainsize) and the areas of river basins. In the development of our previous purely empirical method, when we directly calculated mean annual discharge of the past [23,24], now we calculate mean maximum discharges with three main morphometric relationships: (1) the relationship between the meander wavelengths L and the bankfull channel widths W; (2) the relationship of maximum daily discharges Qmax with the bankfull channel widths; and (3) the relationship between maximum daily discharges and drainage areas F.

3.1. Relationship between the Meander Wavelength and the Width of the Channel

This relationship between the meander wavelengths L and the bankfull channel widths W was established by Inglis [25] and was subsequently confirmed in several works [26,27]. The relationship is linear:
L = k W W
For free bends of the modern rivers, the coefficient kW is quite stable and is equal on average to 10.0–11.0. For incised rivers, Equation (1) is characterized by a larger scatter; the coefficient kW usually is larger and equal on average to 12.0–14.0. If kW is greater than 20, it is highly probable that the morphology of channel bends does not correspond to contemporary flow hydraulics.
Comparison of kW values for modern and ancient meanders makes it possible to determine similarities or differences in the processes of their formation. If kW values are similar, it is highly probable that the meanders of the paleorivers were formed by the same processes as the meanders of modern rivers. Therefore, their morphology can be used for the paleohydrological analysis.

3.2. Relationships between Water Flow and Channel Width

In works on channel hydraulics, it is usually stated that the width of the channel W is determined by the discharge Q [26,28].
W = a 0 Q b 0
The width and the discharge are usually taken at the stage when water fills the channel up to the edges of the floodplain (bankfull stage). Discharge at this level is also called bankfull and is often considered to correspond to channel-forming discharge [29]. At the same time, the bankfull discharge is close to the long-term average discharge of the maximum flood. All these considerations make it possible to perform the paleohydrological reconstructions with the inverse of the Equation (2) morphometric relationship (regime or hydraulic geometry equation) between the long-term average discharge of the maximum flood Qmax and the bankfull width of the river channel Wb at different cross-sections along the river:
Q m a x = a W b b
Equation (3) can be constructed for the modern meandering rivers. The main hypothesis of paleohydrology states that Equation (3) for modern rivers can also be used for ancient rivers of different ages [9,10], for which it is possible to measure bankfull widths of the channels. This statement follows from the Uniformitarianism Principle (the principle of actualism in paleogeography) which opens the possibility of transferring the rules of the modern processes to the past ones in a similar environment. In practice, the relationship in Equation (3) is constructed for modern meandering rivers in the river basin for which paleohydrological reconstructions are carried out. It is necessary to exclude from the analysis river basins with a hydrological regime significantly modified by human activity (i.e., reservoirs and ponds and large water intakes). Based on the regional exponent b and the measured bankfull widths of paleochannels Wb_past, the average maximum discharges Qpast_max for ancient rivers in the same river basin are calculated:
Q p a s t _ m a x = a W b _ p a s t b
Coefficient a can be taken as regional, the same for the entire river basin. This coefficient can also be local, calculated with Equation (5) for each measured channel cross-section:
a = Q m a x W b b
Since the catchment areas F for ancient rivers are assumed to be equal to modern ones in the same sections, the values of the average maximum daily runoff depth are calculated with Equation (6):
X p a s t _ m a x = d Q p a s t _ m a x d F

3.3. Relationships between Water Flows and Catchment Areas

Average maximum discharges Qmax, as well as average maximum daily runoff depths Xmax, change nonlinearly with the catchment area F [30]:
Q m a x = a 1 F b 1
X m a x = d Q m a x d F = a 1 b 1 F b 1 1
The coefficient a1 and the exponent b1 in Equations (7) and (8) vary over the territory depending on the climate, landscape, and morphology of the river valley bottom. Equation (8) can be used to estimate the maximum daily runoff depth Xu_max for a unit catchment with the area Fu:
X u _ m a x = a 1 b 1 F u b 1 1 = Q m a x F b 1 b 1 F u b 1 1
Xu_max does not depend on catchment area. It reflects the distribution of the maximum depth of daily snow thaw during the snowmelt period in the small river catchment and therefore can be shown on the map both for the modern rivers and for the ancient rivers. All the maps in this paper were prepared with the procedures in ArcGIS 10.3.

4. Results

4.1. Channel Morphology

The investigated rivers have meandering pattern. The main morphological characteristics of the meandering channels are the meander wavelength L and the channel width W. On the territory under consideration, the widths of the large paleochannels Wpast are two to ten times larger than the widths Wmod of the modern channels in the same river channel section with the mean value about 4 and modal between 2 and 3 (Figure 5).
There is some trend to increase in the ratio Wpast/Wmod with catchment area growth, which does not allow to show this ratio on the map. Nevertheless, there is a distinct overall trend of decrease in the ratio Wpast/Wmod from the southwest (Wpast/Wmod = 6–7) to the northeast (Wpast/Wmod = 2–4) with several locations with the maximum values Wpast/Wmod = 7–9.
The ratio of the meander wavelength to the channel width kW = L/W varies both in space (from basin to basin) and in time. For the Volga River basin, the mean kW = L/W for the ancient meanders is 11.7; for the meanders of the modern rivers, it is 10.5. For the Don River basin, the difference is larger: kW for the ancient meanders is 14.1; for the meanders of the modern rivers, it is 11.9. For the Dnepr River basin, the difference is negligible: kW for the ancient meanders is 11.4 (with great scatter); for the meanders of the modern rivers, it is 11.3.
These variations of kW for modern and ancient rivers can be explained by differences in the evolution of the longitudinal profiles of the rivers. The largest difference is for the Don River basin and that is where the largest changes in the river longitudinal profile were. During the Late Pleniglacial, the level of the Black Sea was low [31] and the rivers of the Don River basin incised, forming relatively (to the wavelength) narrow channels with kW =14.1, typical for incised rivers. During the period of the Black Sea level rise to the modern altitude, there was accumulation in the rivers and the meanders became free. As the result kW value decreased, the channel widening relative to meander wavelength occurred despite the actual channel narrowing.
The main part of the Dnepr River basin is situated upstream of the local base level at the rapids of the Zaporozhye, where the river crosses granites of the Ukraine Shield [32]. Therefore, the changes of the Black Sea level did not affect the river channel processes and the kW values of the ancient and modern channels are the same here.
The main part of the Volga River basin was not affected by the Caspian Sea level changes. There are many incised paleochannels in this basin [33]. The lower Volga River was under backwater effect of the high level of the Caspian Sea during the Late Pleniglacial [31], which caused alluvial accumulation in the mouths of the tributaries. After the drop of the Caspian Sea level, this backwater effect ceased and the paleorivers to be incised. The trend to a decrease in kW values after the Late Pleniglacial is registered in the Volga River basin, but this decrease was not large (about 10%).
As stated before, when kW values are similar, there is a high probability that the meanders of the paleorivers were formed by the same processes as the meanders of the modern rivers. Therefore, their morphology can be used in paleohydrological analysis.

4.2. Paleohydrological Reconstructions

4.2.1. Paleo-Discharge Calculation with the Paleochannel Widths

The values of the coefficients and exponents in Equation (3) were used for modern flow and channel morphology conditions in the Don, Volga, and Dnepr river basins (Table 1). Firstly, it turned out that the exponent b values for these basins are close: their mean values are 1.37 for the Don and Dnepr River basins and 1.38 for the Volga River basin. Secondly, the regional mean values of the coefficient a vary more than the exponents. They are 1.74 for the Don River basin, 1.66 for the Volga, and 1.3 for the Dnepr River basins. The differences between all these values are within the 95% confidence intervals. Nevertheless, the Kolmogorov–Smirnov test shows a statistically significant difference of probability distribution functions of coefficient a values for all pairs of these basins: Dn = 0.28 for the pair Don–Volga (critical value at 5% level Dn_cr = 0.14); Dn = 0.35 for the pair Don–Dnepr (Dn_cr = 0.14); Dn = 0.21 for the pair Dnepr–Volga (Dn_cr = 0.12).
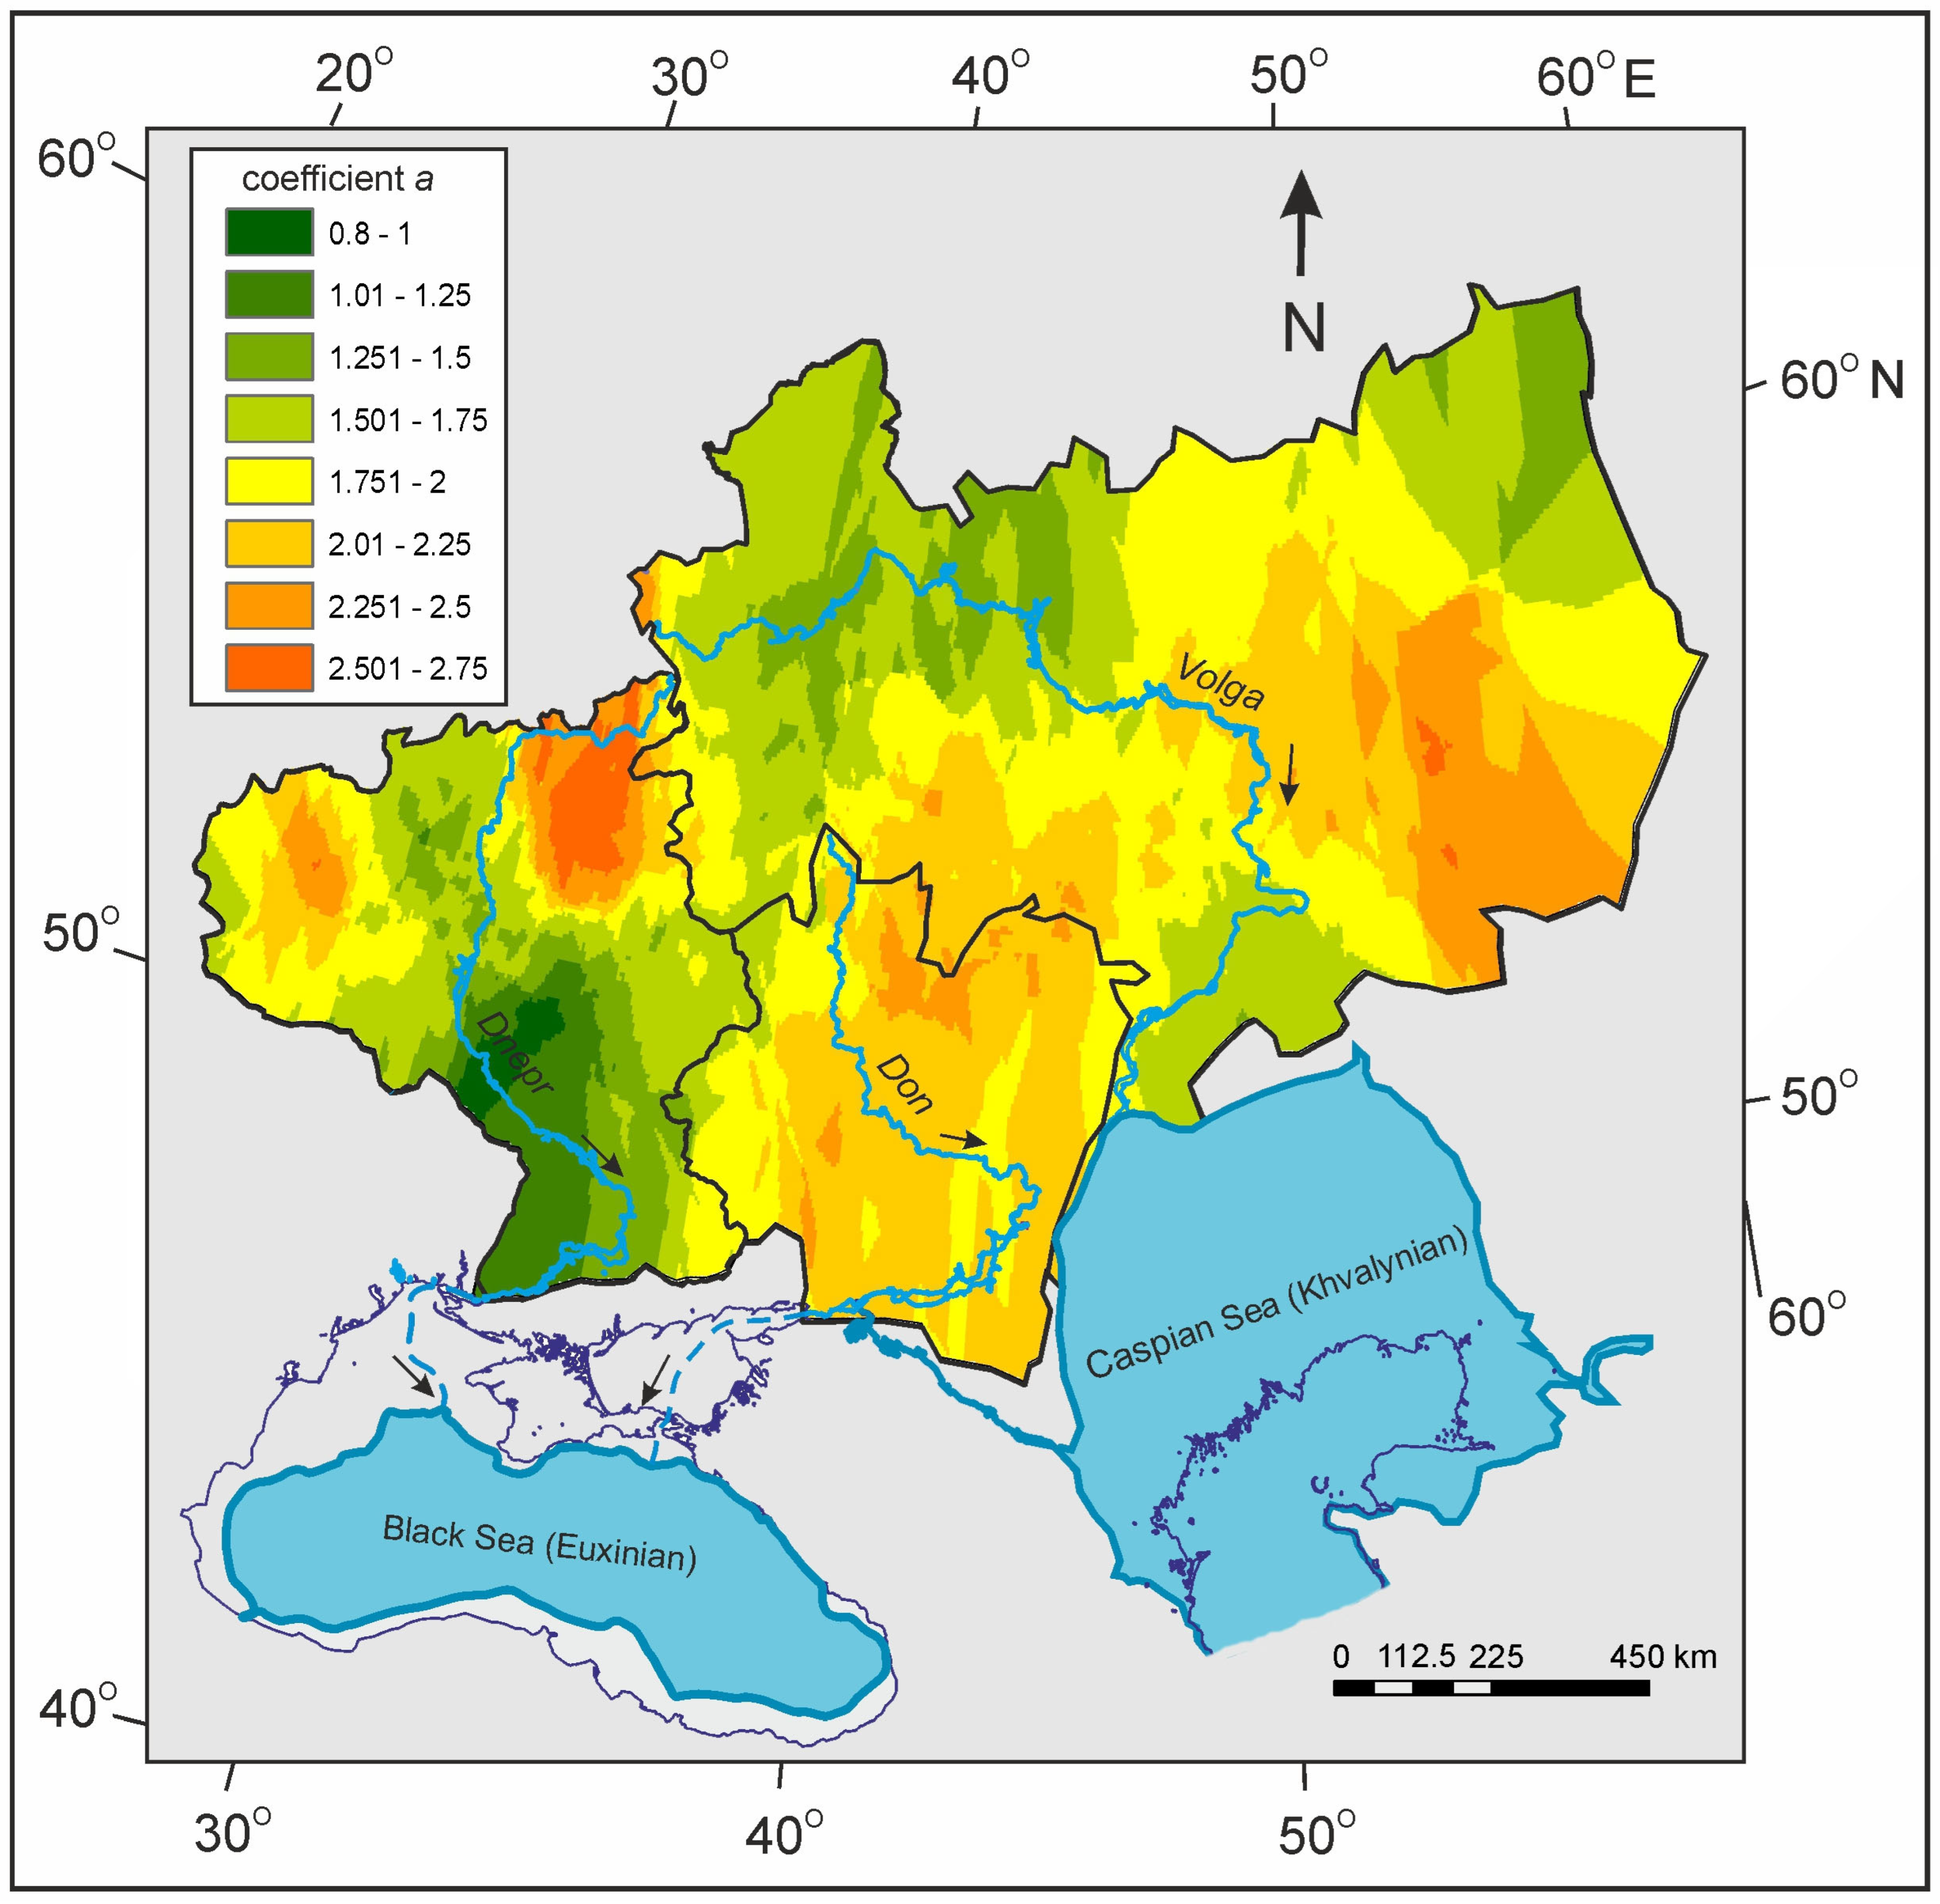
Local values of the coefficient a have a significant scatter in a wide range of 0.8–2.75, but this scatter mainly represents geographically determined variability [34] (Figure 6). The spatial distribution of a shows distinct geographical areas with higher (Don River basin, the middle Volga, and the upper Dnepr basins) and lower (lower Dnepr and upper Volga basins) values. This spatially variable coefficient was used to calculate the distribution of the maximum discharges of the ancient rivers Qpast_max with Equation (4), using the measured widths Wb_past of the paleochannels and the regional values of exponent b from Table 1.

4.2.2. The Maximum Discharge and Runoff Depth

Coefficients and exponents in Equation (7) for calculating maximum discharge and in Equation (8) for calculating maximum daily runoff depth for the modern rivers are different for small and large catchments. For catchments with an area of ≤1000 km2, the exponent b1 is equal to 1; i.e., the daily runoff depth for the maximum flood does not change with the catchment area. For catchments larger than 1000 km2, the exponent b1 is less than 1; i.e., the maximum discharge increases more slowly than for the small catchments, and daily runoff depth for the maximum flood decreases with increasing catchment area.
The values of the coefficients and exponents for the modern rivers depend on the landscape zones. The example for the rivers of the Don River basin is shown in Table 2. The difference in exponents is low and within the 95% confidence interval, while the difference in the coefficient a1 in different landscapes is high. If we take the average values of the exponents for the landscape zone, then the variability of the coefficient a1 values reflects the geographical pattern [34] in the maximum flood runoff depth across the territory.
Equation (9) with local values of coefficients a1 and regional values of exponent b1 was used to calculate the values of the maximum flood runoff depth Xu_mod_max for each unit catchment (F ≤ 1000 km2) using the modern measurements (before 1970th) in the basins of the Volga, Don, and Dnepr Rivers. The values of Xu_mod_max do not change with the catchment area and can be shown on the map. We used the kriging of initial data and their representation in isolines of Xu_mod_max using tools in ArcGis 10.3 (Figure 7).
The map shows a general increase in the maximum flood runoff depth from 2 to 6 mm/day in the southwest to 10–14 mm/day in the northeast of the southern megaslope of the Plain, with more humid environment in the central parts on the Srednerusskaya and Privolzhskaya Uplands due to orographic effects. The mean value for the entire southern megaslope of the East European Plain is 7.4 mm/day, with 8.3 mm/day for the Volga River basin, 7.2 for the Don River basin, and 4.9 mm/day for the Dnepr River basin.
The measured mean maximum discharges of the flood for the lowermost gauging stations of these basins (for the periods before construction of large reservoirs) are as follows: 25,100 m3/s for the Volga River basin (gauging station Verkhneye-Lebyazhye, area 1,360,000 km2, years 1881–1955); 5620 m3/s for the Don River basin (gauging station Razdorskaya, area 378,000 km2, years 1881–1951); 7680 m3/s for the Dnepr River basin (gauging station Lotsmanskaya Kamenka, area 459,000 km2, years 1881–1931).
It is possible to calculate the maximum discharges of large ancient rivers using Equation (4) and then, knowing their basin areas, estimate the regional exponent and coefficient in Equation (9). As it follows from the paleolandscapes at these river basins, these discharges were formed during the spring thawing of the snow. As can be expected, the scatter in these relationships for ancient rivers is greater than for modern ones; a random error is added to the regular changes in the coefficient a1 and exponent b1 within and among the basins. Therefore, the difference in these relationships for basins of different sizes located in different landscapes is not as obvious as for modern rivers. The difference in exponent b1 for different landscape zones in all river basins is small and is within the error of estimation. Therefore, in further calculations the exponents b1 were assumed to be the same within each basin or large parts of basins. The variability in the coefficients a1 calculated with Equation (9) mostly reflects spatial differentiation of discharges and surface runoff depths.
Equation (9) was used to calculate the values of the maximum flood runoff depth Xu_past_max for the unit catchment (F ≤ 1000 km2) for the paleorivers in the Volga, Don, and Dnepr basins. The values of Xu_past_max do not change with catchment area and therefore can be shown on the map in isolines (Figure 8). The map shows that the main trend in the distribution of the maximum flood runoff depth in the past was rather similar to the recent one: a general increase from the southwest to the northeast and from the south to the north. The local increase in the runoff depth due to orographic effects was typical for all the uplands: Pridneprovskaya in the west, Srednerusskaya and Privolzhskaya in the central part of the territory, and at the western foothills of the Ural Mountains in the east.
The mean value of the maximum flood runoff depth Xu_past_max for the entire southern megaslope of the East European Plain in the Late Pleniglacial and Late Glacial was 44.2 mm/day (about six times the modern value). The mean values for the basins (see Table 3) increased from the west to the east and the ratios of the ancient/modern values decreased in this direction.
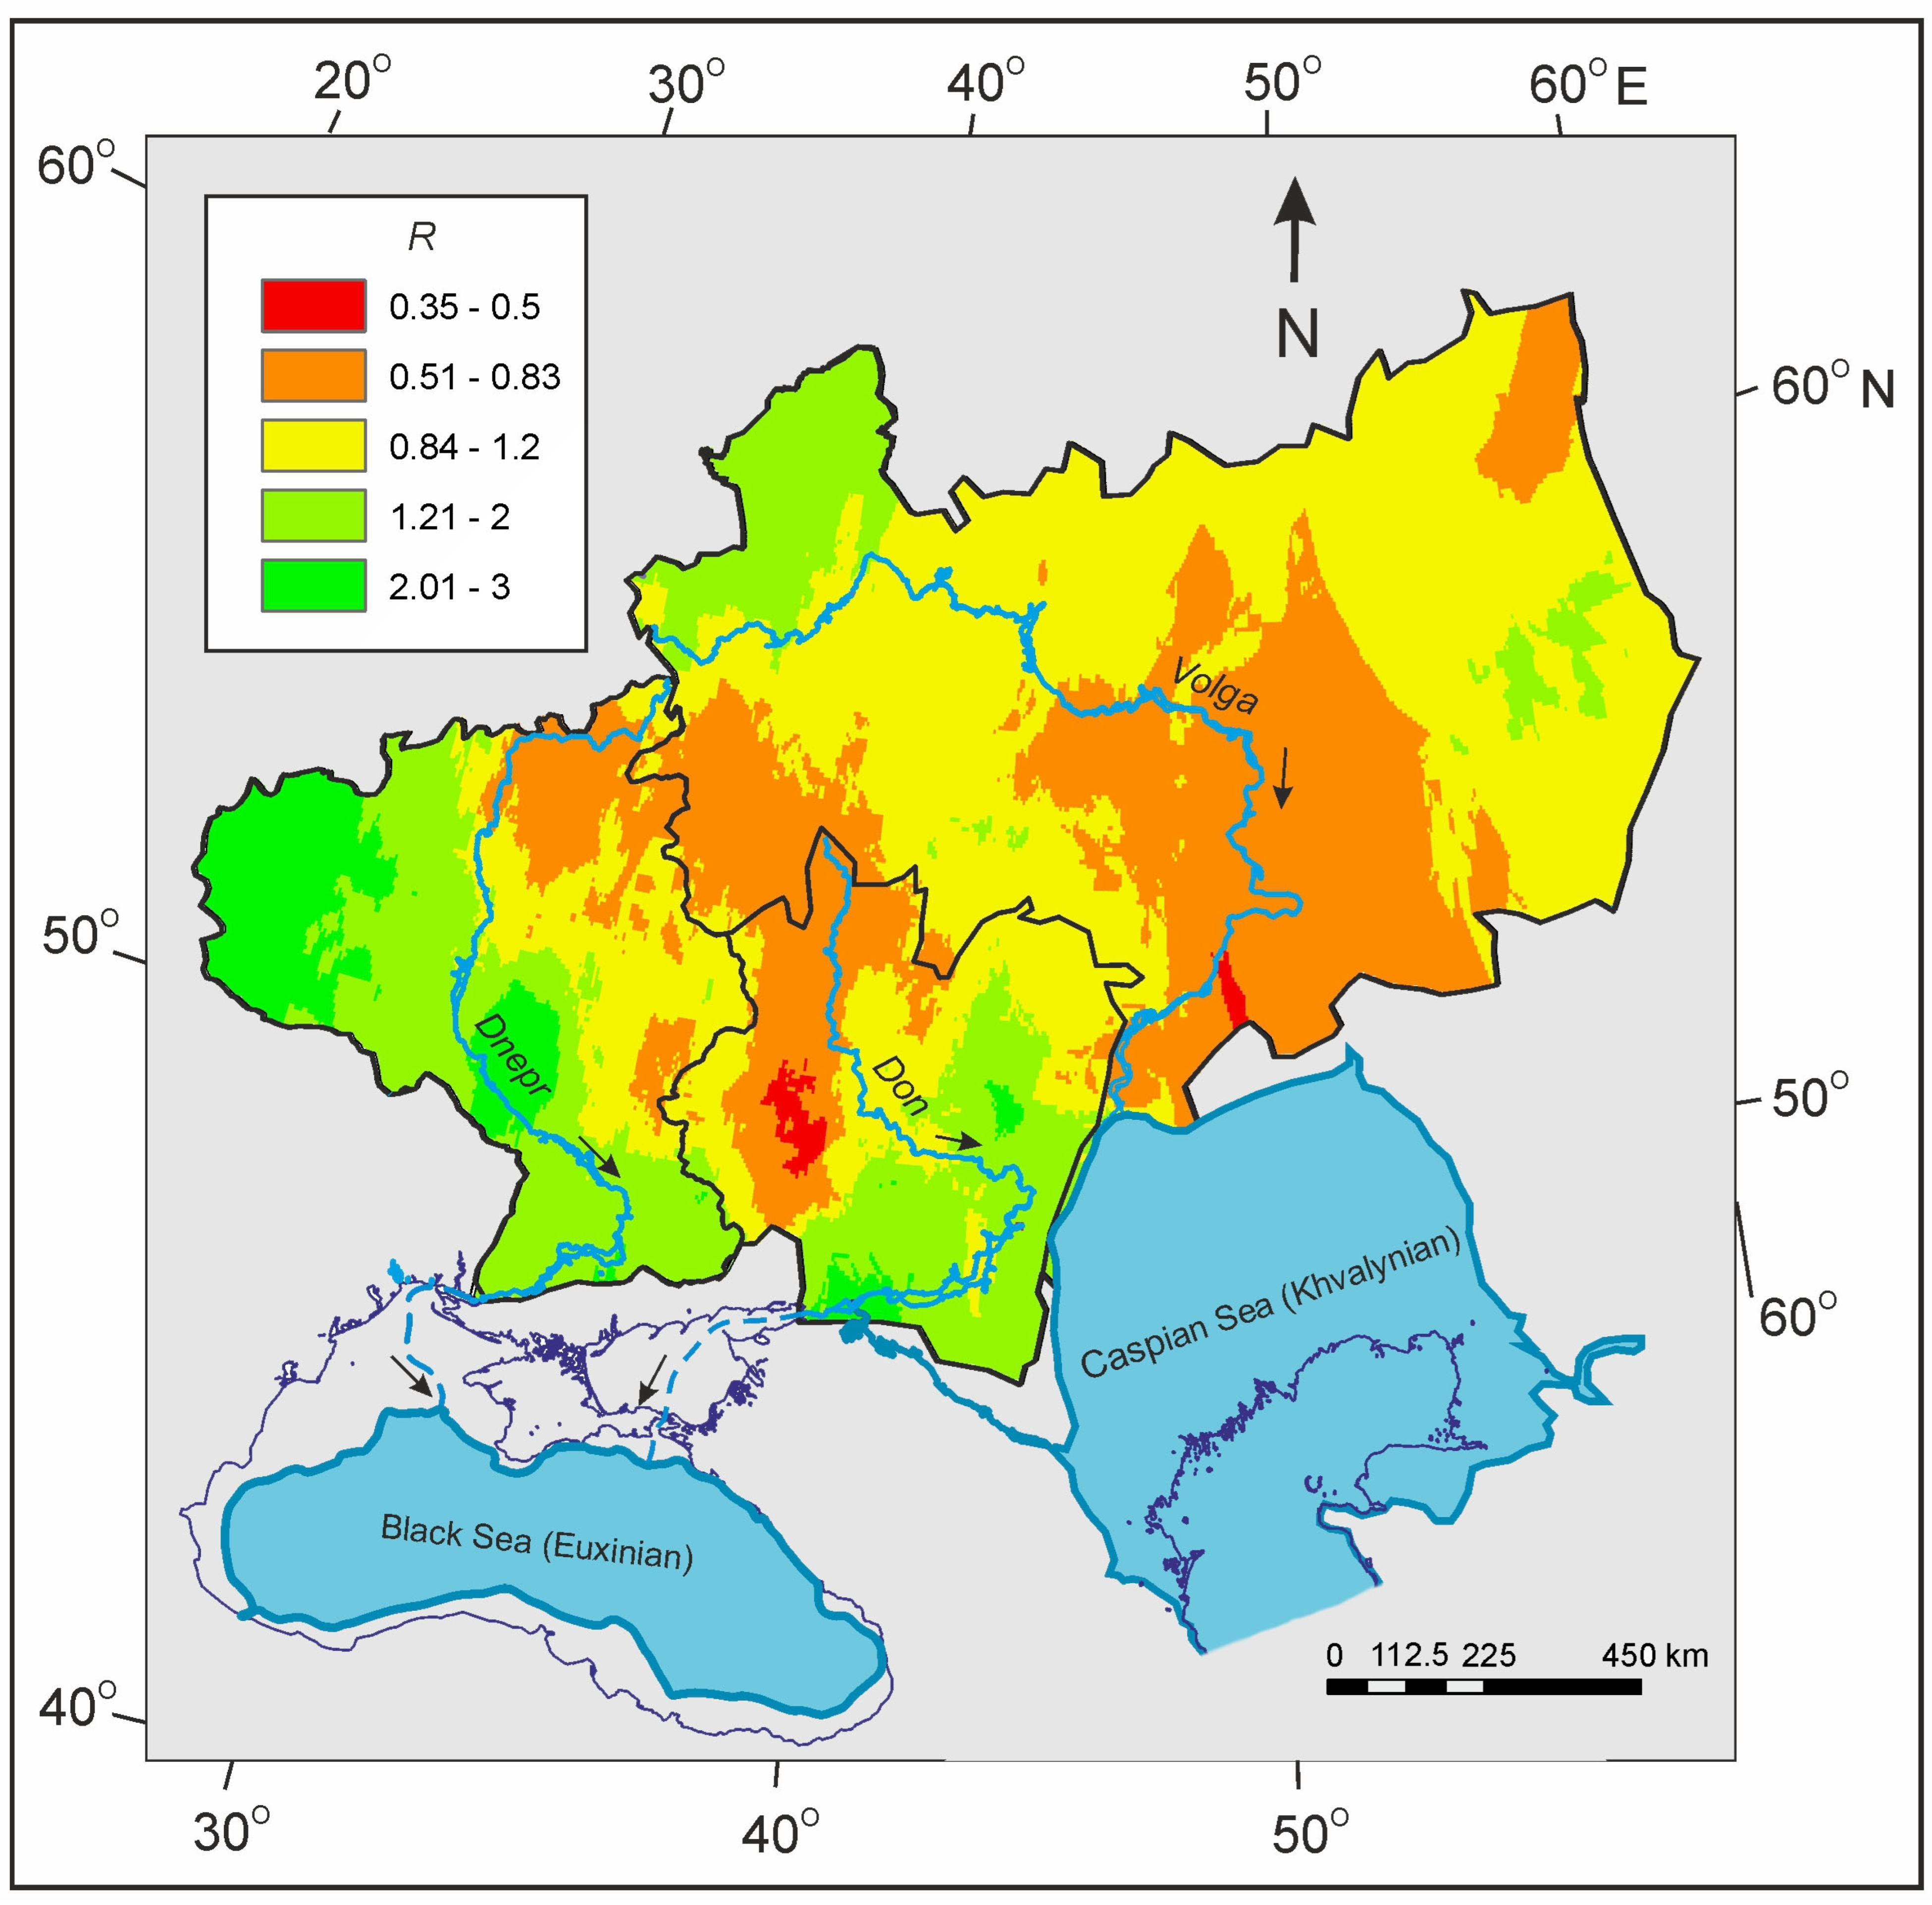
These calculations show that the Dnepr River basin was drier than the Don and Volga basins, which corresponds to the modern distribution of humidity. At the same time, the ratio R of the past and modern anomalies, calculated as Xu_past_max/44.2 divided on Xu_mod_max/7.4, shows that the westernmost part of the Dnepr River basin was relatively wet in the past, and the decrease in humidity from the past to the modern situation there was greater than in the eastern and central regions (Figure 9). The ratio R for a significant part of the territory (more than 40%) is in the range of 0.83–1.2 (i.e., ±20% of the mean value), which confirms the general similarity of the spatial pattern of past and modern maximum flood runoff depths.
Maximum discharges in the lowermost parts of the ancient rivers can be estimated either directly with Equation (4) from the paleochannel width, or indirectly with Equation (7) from the basin area with known coefficient a1 and exponent b1. The latter way was used here (see Table 3), since the remnants of large paleomeanders are not characteristic for the lower reaches of the rivers. The most accurate calculations can be carried out for the paleo-Don River, since paleomeanders are observed in the Don valley from the upper reaches to the cross-section with a catchment area of 220,000 km2. The maximum discharge of the paleo-Don River calculated at gauging station Razdorskaya (area 378,000 km2) using Equation (7) with coefficient a1 = 3.5 and exponent b1 = 0.71 was about 32,000 m3/s. This is more than six times the modern value. Since in the Late Pleniglacial the paleo-Don valley extended across the drained shelf of the Azov Sea and the northeastern part of the Black Sea [31], the Kuban River with a basin area of 57,900 km2 then became its tributary. At the maximum of the Khvalynian transgression of the Caspian Sea and at a low level of the Black Sea, the Caspian waters drained through the Manych Strait and the lower reaches of the Don River [19]; therefore, the total flow into the Black Sea at the mouth of the Don was quite high.
The maximum paleo-discharges of the Volga and Dnepr Rivers were calculated with the widths of the paleochannels for the rivers with basin areas of maximum 20,000 km2 and 90,000 km2, respectively. Therefore, calculations using Equation (7) for lower reaches of these basins were extrapolated (see Table 3) with less certain results. For the Volga basin, Equation (7) with coefficient a1 = 5.0 and exponent b1 = 0.7 gives the maximum discharge of 98,300 m3/s for the basin of 1,360,000 km2. Despite a major extrapolation, this result is extremely similar to the peak discharge of 100,000 m3/s calculated with a hydrological model for the Volga River at 17 ka BP [18]. For the Dnepr basin, the coefficient a1 is 36.6 and the exponent b1 is 0.45. Equation (7) gives a maximum discharge of about 13,000 m3/s for a basin area of 459,000 km2, indicating a major reduction in flood wave heights along this paleoriver.

5. Discussion

The methodology and paleoclimate are two key issues needing further clarification in the discussion. The advantages and disadvantages of the proposed method for calculating the maximum flood runoff depth for the ancient large rivers, as well as its difference from the methods used in our previous papers [23,24], are discussed in [10]. The methodology includes the assumption that the regime equations obtained for modern rivers are also valid for ancient rivers. This proposition was named the main hypothesis of paleohydrology [10]. It was confirmed by the high stability of empirical Equation (3), derived from the data on the modern rivers from a wide range of basins, from those with permafrost to those under equatorial forests, as well as on the paleorivers, for which the bankfull discharges were calculated with the formulas of hydraulics (see Figure 6 in [10]). This stability, mainly of the exponent b, is confirmed by the present work.
Errors in the application of regime equations are, as a rule, quite large. For the paleo-hydrological calculations, the error was estimated as ±20% of the mean [24]. Therefore, calculations of the paleo-discharges can be valid only if the ratio between channel widths of modern and ancient rivers is large. This ratio is sufficiently large (locally up to 10 times) for rivers on the southern megaslope of the East European Plain, so that it exceeds the error in paleo-discharge estimations. As the relationship between channel width and the maximum flood discharge is non-linear and the exponent is larger than 1 (b ≈ 1.37), the ratio of past and modern maximum discharges is even larger, locally up to 23 times. Despite Dury [4] (p. 15) listing most of the possible causes of this high maximum paleo-discharges, these extreme values have raised many questions and suggestions [35,36].
Most quantitative paleohydrological calculations since Dury’s works [3,4] were based on the relationship between the bankfull (or maximum) discharge Q and the meander wavelength L:
Q m a x ~ L 2
Two facts led to the exaggeration of the calculated discharges with Equation (10): the first, the use of the meander wavelength and the second, using the exponent in Equation (10) equal to two. The meander wavelength in natural rivers varies over a wide range, and for incised meanders it is longer than for free ones. This last point has led to fair criticism of Dury’s works [35], as he used many incised rivers in his analysis. To avoid this error, we use the channel bankfull width instead of the meander wavelength, Equation (3) instead of Equation (10). Channel bankfull width is the primary morphometric characteristic, as all river channels have width, but not all have the meanders. Meander wavelength is the secondary morphometric characteristic. According to Equation (1), it is a function of the channel width. At the same time, the variability of the channel width at the crosses is less than the variability of the meander wavelengths on the same river [24]. The channel width of incised rivers is at least no greater than that of free rivers, so this way we avoid the effects associated with the use of meander wavelength for discharge calculations.
Using an exponent of 2 in Equation (10) or in Equation (3) results in even greater exaggerations in discharge calculations, since a ratio of past to present meander wavelengths or channel widths of 10 gives a ratio of past to present maximum discharges of 100. The exponent in Equation (3) is controlled by changes in flow velocity U and depth-to-width D/W ratio as discharge changes along the river.
U D W ~ Q x
Q ~ U D W W 2 ~ Q x W 2 ~ W 2 1 x
For small streams on slopes, flow velocity usually increases downstream with discharge (1 > x > 0), therefore increasing the exponent in Equation (10). Nachtergaele et al. [37] showed that for rills on slopes, the exponent in Equation (10) is greater than 3, and in the gullies it is 2.5. The commonly used exponent value of two is valid for small and medium-sized rivers. This means that in small rivers the influence of increasing velocity is compensated by decreasing depth-to-width ratio downstream (x ≈ 0). Flow velocity along large rivers is nearly constant (see Figure 9 in [10]), so the exponent in Equation (10) is largely determined by the decreasing depth-to-width ratio as discharge increases downstream (x < 0). Therefore, in large rivers, both for the modern and ancient, the exponent is about 1.4. For the ratio of past and modern width equal to 10, this gives a ratio of past and modern maximum discharges equal to 23 (not 100!).
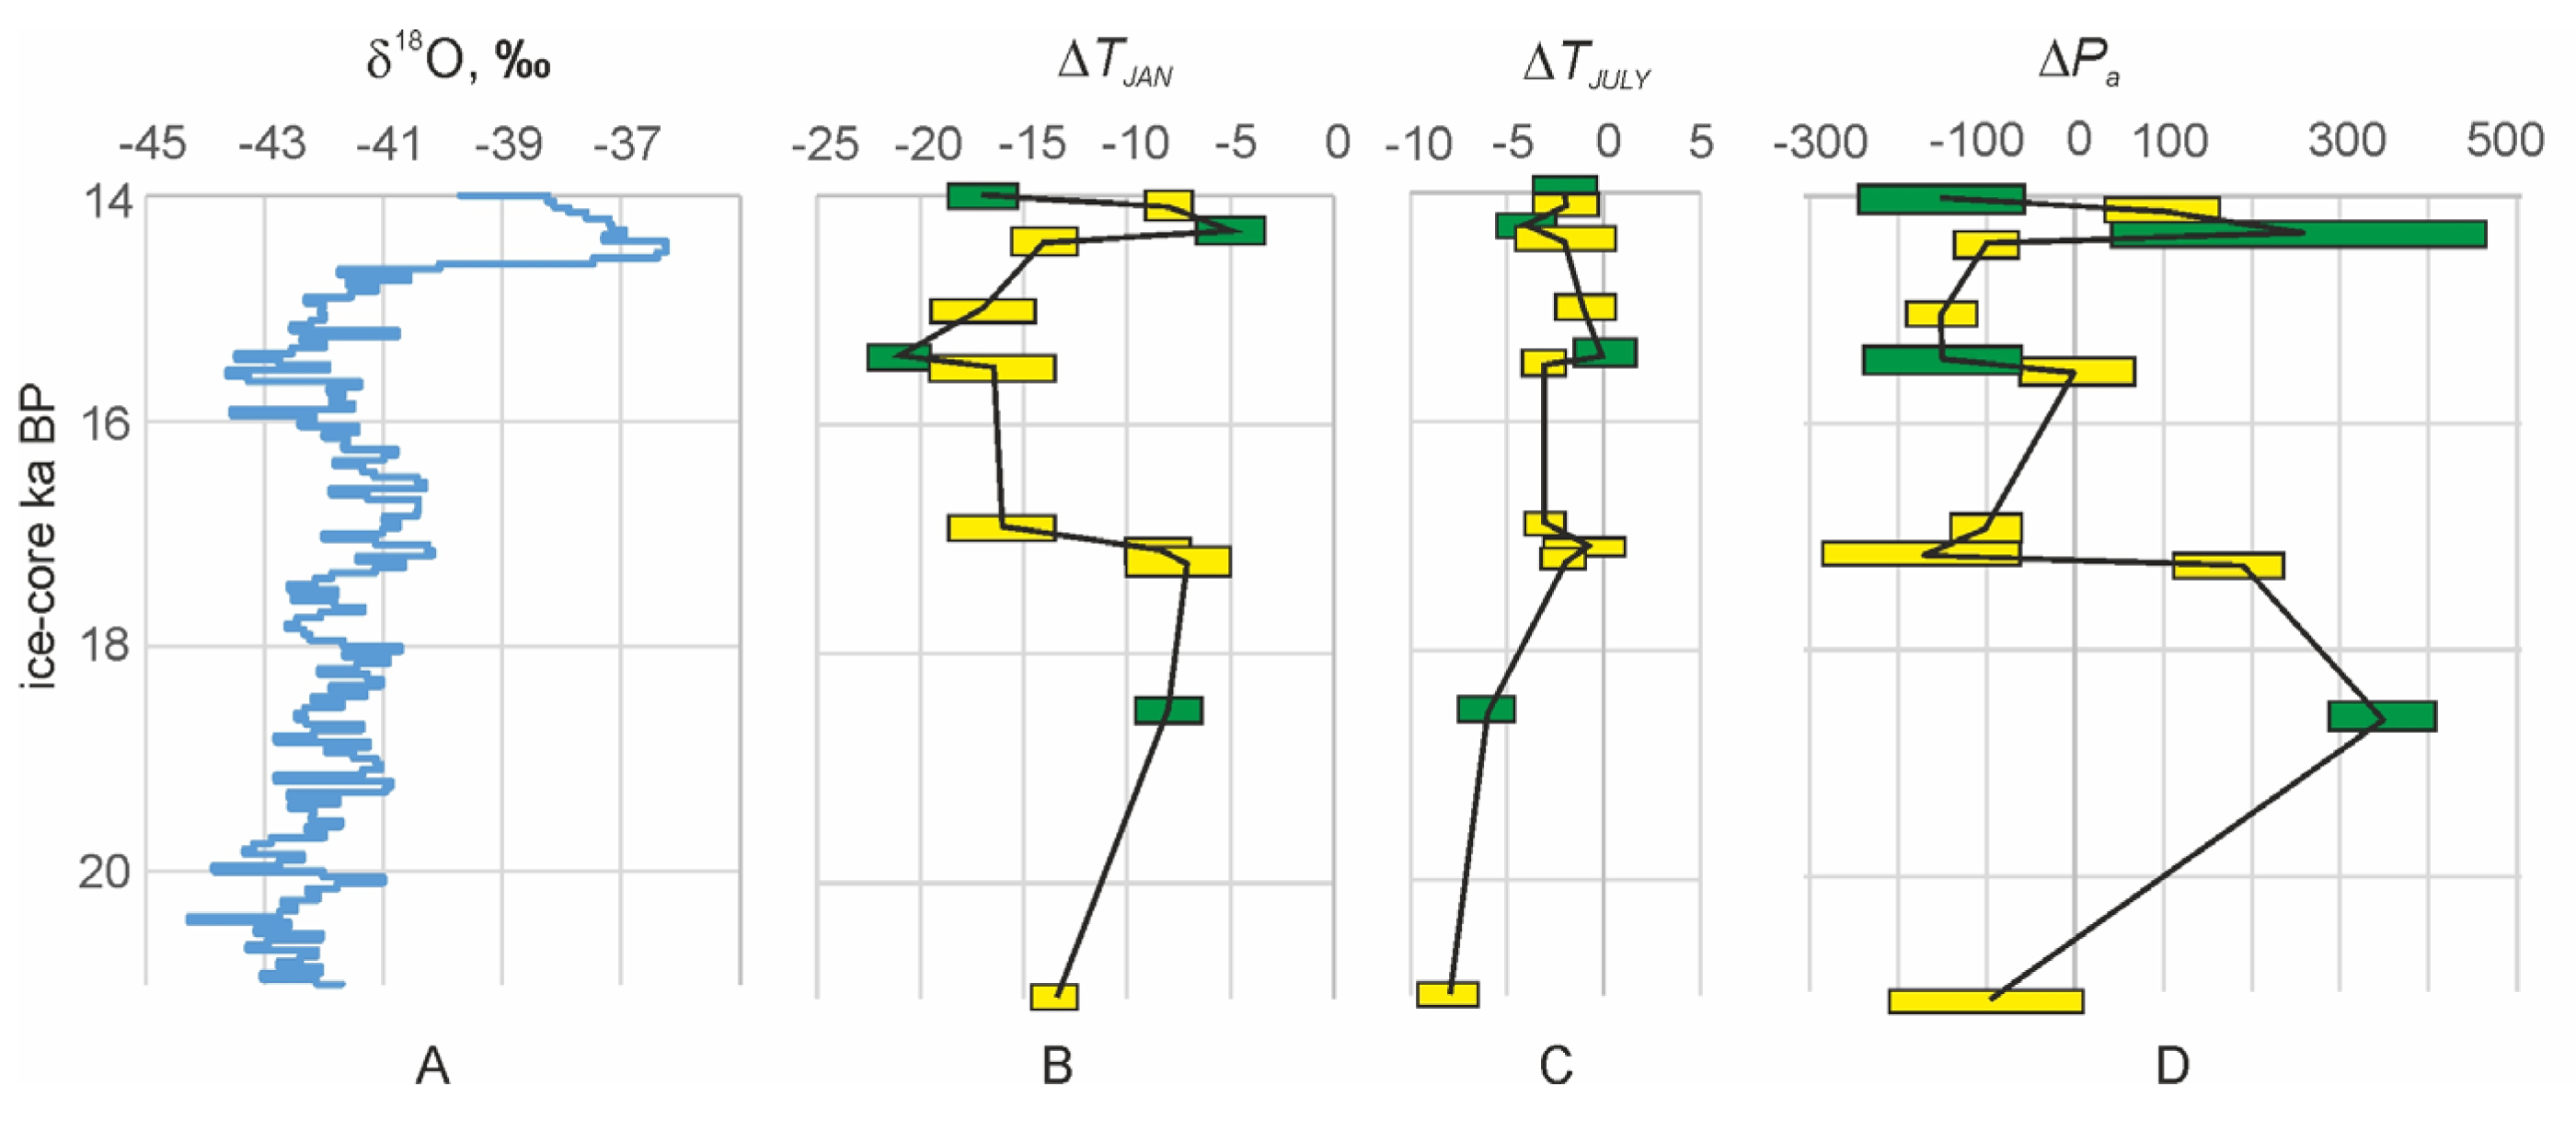
Nevertheless, our paleohydrological reconstructions contradict the prevailing ideas, based mainly on palynological data, that the climate of Europe was cold and dry both in the Late Pleniglacial and the Late Glacial (e.g., in [38,39]), and this discrepancy needs to be analyzed. Biomes and climate reconstructions based on pollen and plant macrofossil data from northern Eurasia [40,41] showed that very cold and dry conditions existed in the East European Plain during LGM. The climate of the period 18–14 cal ka BP, when large rivers were active on the East European Plain, has been studied much less. Oxygen isotope records from Greenland ice cores [42,43,44] provide valuable information on the changes in air temperature during the deglaciation (Late Pleniglacial–Late Glacial) including the first warming after the LGM (the Raunis Interstadial), the Oldest Dryas cold stage and the Bølling warm interstadial. While quite a lot of research is devoted to temperature changes (mainly in the warm season) during this period [45,46], reconstructions of precipitation for this period are still rare, so additional research is required. Therefore, with regard to estimates of atmospheric precipitation, we use our own reconstructions for the study area with the use of the paleofloristic method [47].
Reconstructions of temperatures and precipitation on the East European Plain in the Late Pleniglacial–Late Glacial were obtained by analyzing the modern geographic distribution of plant species—components of paleofloras identified from pollen and other plant remains found in lake sediments and peat deposits of this time interval [47]. The territory in which all species of certain fossil flora currently grow together is considered the closest modern analogue for the place and time of existence of this fossil flora in terms of climatic conditions [47]. Concerning paleotemperature changes reconstructed from such floristic regions, analogues (Figure 10) generally correspond to those inferred from changes in the oxygen isotope composition in the NGRIP ice core [43], although our reconstructions indicate much more pronounced warming right after the LGM (the Raunis Interstadial). According to the reconstruction based on paleofloristic data [47], precipitation during this interval was relatively high. Our assessment shows that such precipitation was sufficient to form the surface runoff calculated from the morphometry of meandering paleochannels.
The maximum discharges and surface runoff depths, calculated for large paleorivers, formed during the flood period on days with the maximum intensity of snow thaw. This is the only direct paleohydrological information that can be obtained from morphometric analysis of paleochannels using Equation (3). Converting these maximum figures into river runoff volumes for a flood period and for a year requires additional information about the temperature regime during the snow thaw period or about the relationship between maximum and annual discharges. Such information, available in principle from paleoclimate models or regions, analogues located from fossil floras coupled with hydrological models, is currently insufficient for such a vast territory and is the subject of future research. The first attempt at such calculations using the ECOMAC hydrological model [48] with the temperature and precipitation simulated by the MPI-ESM-CR global climate model [49] gives quite possible maximum discharge at the Volga River mouth of 100,000 m3/s at 17 ka BP [18].

6. Conclusions

The maximum discharges and surface runoff depths of the large rivers that formed at the end of MIS 2 (approximately 18–14 ka BP) in the periglacial zone of the East European Plain with cold steppe vegetation and widespread permafrost (the Volga, Don, and Dnepr River basins) were calculated with the help of the morphometric analysis of paleochannels. As a development of our previous purely empirical method of calculating mean annual discharge of the past, in this paper we calculated the mean maximum discharges using three basic morphometric relationships: (1) between the meander wavelength L and the bankfull channel width W; (2) between the maximum discharge and the channel width; (3) between maximum discharges and drainage areas. The maximum flood runoff depth Xu_past_max for the unit catchment (F ≤ 1000 km2) for the ancient rivers in the basins of the Volga, Don, and Dnepr Rivers in general increased from the southwest to the northeast and from the south to the north with local increases due to orographic effects. The mean value for the entire southern megaslope of the East European Plain was 44.2 mm/day (about six times the modern value), with 46 mm/day for the Volga River basin (5.5 times the modern value), 45 mm/day (6.3 times the modern value) for the Don River basin, and 39 mm/day (8 times the modern value) for the Dnepr River basin. The spatial distribution of the maximum flood runoff depth was more uniform in the past. The Dnepr basin was drier than the Don and Volga basins, which corresponds to the modern distribution of humidity. The spatial pattern of the past and modern maximum flood runoff depth shows a general similarity at least on 40% of the territory. The extremely high runoff depths of maximum flood correspond to the high maximum depths of daily snow thaw during the snowmelt period. Further research will be aimed at elucidating the reasons for the occurrence of such a spring snowmelt regime.
The general similarity of spatial patterns of past and modern maximum daily flow depths on the East European Plain, along with their very large quantitative differences, poses an important problem for paleoclimate modelling—the problem of reproducing and explaining these features.

Author Contributions

Conceptualization, A.S. and A.P.; methodology, A.S. and O.B.; data resources, A.P. and A.S.; writing—original draft preparation, review and editing, A.S., A.P. and O.B. All authors have read and agreed to the published version of the manuscript.

Funding

This research was funded by the State Task no. 121051100166-4, Geographical Faculty MSU for Aleksey Sidorchuk, and by the State Task no. FMWS-2024-0005, Institute of Geography RAS for Olga Borisova and Andrei Panin.

Data Availability Statement

The raw data supporting the conclusions of this article will be made available by the authors on request.

Acknowledgments

The authors would like to thank Maksim Vlasov and Vadim Ukraintsev for great support in the field works and data collecting for the Don and Volga River basins.

Conflicts of Interest

The authors declare no conflicts of interest.

References

  1. Dokuchaev, V.V. The Ways of the River Valleys Formation at the European Russia; Tipografiya V. Dermakova: St. Petersburg, Russia, 1878; p. 221. (In Russian) [Google Scholar]
  2. Davis, W.M. La Seine, la Meuse et la Moselle. Ann. Géographie 1895, 4, 25–49. [Google Scholar] [CrossRef]
  3. Dury, G.H. Principles of underfit streams. US Geol. Surv. Prof. Pap. 1964, 452, 67. [Google Scholar]
  4. Dury, G.H. Theoretical implication of underfit streams. US Geol. Surv. Prof. Pap. 1965, 442, 43. [Google Scholar]
  5. Schumm, S.A. Quaternary paleohydrology. In The Quaternary of the United States; Wright, H.E., Jr., Frey, D.G., Eds.; Princeton University Press: Princeton, NY, USA, 1965; pp. 783–794. [Google Scholar]
  6. Schumm, S.A. River Adjustment to Altered Hydrologic Regimen—Murrumbidgee River and Paleochannels. US Geol. Surv. Prof. Pap. 1968, 598, 65. [Google Scholar]
  7. Volkov, I.A. On the recent past of the rivers Ishim and Nura (O nedavnem proshlom rek Ishima i Nury). Tr. Lab. Aerometod. AN SSSR 1960, 9, 15–19. (In Russian) [Google Scholar]
  8. Makkaveev, N.I.; Khmeleva, N.V.; Gun, G. Changes in the pattern of meanders detected in some rivers. In Experimental Geomorphology; Moscow University Press: Moscow, Russia, 1969; Volume 2, pp. 52–62. (In Russian) [Google Scholar]
  9. Vandenberghe, J.; Sidorchuk, A. Large palaeomeanders in Europe: Distribution, formation process, age, environments and significance. In Palaeohydrology; Geography of the Physical Environment; Springer: Cham, Switzerland, 2019; pp. 169–186. [Google Scholar]
  10. Sidorchuk, A. The large rivers of the past in West Siberia: Unknown hydrological regimen. Water 2023, 15, 258. [Google Scholar] [CrossRef]
  11. Alayev, E.B.; Badenkov, Y.P.; Karavaeva, N.A. The Russian Plain. In The Earth as Transformed by Human Action; Turner, B.L., Clark, W.C., Kates, R.W., Richards, J.F., Mathews, J.T., Meyer, W.B., Eds.; Cambridge University Press: Cambridge, MA, USA, 1990; pp. 543–560. [Google Scholar]
  12. Borodko, A.V. (Ed.) National Atlas of Russia (Maps) (Natsional’nyi Atlas Rossii (Karty)); Roskartografiya: Moscow, Russia, 2004; Volume 2. (In Russian) [Google Scholar]
  13. Gribova, S.A.; Isachenko, T.I.; Lavrenko, E.M. (Eds.) Vegetation of the European Part of the USSR (Rastitel'nost' Yevropeyskoy Chasti SSSR); Nauka (Publ.): Leningrad, Russia, 1980; p. 429. (In Russian) [Google Scholar]
  14. Available online: https://earth.google.com (accessed on 20 June 2024).
  15. Available online: https://maps.yandex.ru/ (accessed on 20 June 2024).
  16. Velichko, A.A. (Ed.) Dynamics of Landscape Components and Internal Marine Basins of Northern Eurasia over the Past 130,000 Years: Atlas-Monograph. Part 2. Development of Landscapes and Climate of Northern Eurasia. Late Pleistocene—Holocene—Forecast Elements; GEOS: Moscow, Russia, 2002; p. 231. (In Russian) [Google Scholar]
  17. Panin, A.; Matlakhova, E. Fluvial chronology in the East European Plain over the last 20 ka and its palaeohydrological implications. Catena 2015, 130, 46–61. [Google Scholar] [CrossRef]
  18. Gelfan, A.; Panin, A.; Kalugin, A.; Morozova, P.; Semenov, V.; Sidorchuk, A.; Ukraintsev, V.; Ushakov, K. Hydroclimatic processes as the primary drivers of the Early Khvalynian transgression of the Caspian Sea: New developments. Hydrol. Earth Syst. Sci. 2024, 28, 241–259. [Google Scholar] [CrossRef]
  19. Sidorchuk, A.; Panin, A.; Borisova, O. Surface runoff to the Black Sea from the East European Plain during the Last Glaciation Maximum—Late Glacial time. In Geology and Geoarchaeology of the Black Sea Region: Beyond the Flood Hypothesis; Buynevich, I.V., Yanko-Hombach, V., Gilbert, A.S., Martin, R.E., Eds.; Geological Society of America: Boulder, CO, USA, 2011; Volume 473, pp. 1–25. [Google Scholar]
  20. Panin, A.V.; Sidorchuk, A.Y.; Ukraintsev, V.Y. The Contribution of Glacial Melt Water to Annual Runoff of River Volga in the Last Glacial Epoch. Water Resour. 2021, 48, 877–885. [Google Scholar] [CrossRef]
  21. Protasiev, M.S. (Ed.) Surface Water Resources of the USSR. Volume 7: Don Region; Gidrometeoizdat: Leningrad, Russia, 1973; p. 458. (In Russian) [Google Scholar]
  22. Velikanov, M.A. Channel Process: Basics of the Theory; Fizmatgiz: Moscow, Russia, 1958; p. 395. (In Russian) [Google Scholar]
  23. Sidorchuk, A.Y.; Borisova, O.K.; Panin, A.V. Fluvial response to the Late Valdai/Holocene environmental change on the East European Plain. Glob. Planet. Chang. 2001, 28, 303–318. [Google Scholar] [CrossRef]
  24. Sidorchuk, A.Y.; Panin, A.V.; Borisova, O.K. Climate-induced changes in surface runoff on the north-Eurasian plains during the Late Glacial and Holocene. Water Resour. 2008, 35, 386–396. [Google Scholar] [CrossRef]
  25. Inglis, C.C. Meanders and their bearing on river training. Inst. Civ. Eng. Mar. Waterw. Eng. Div. 1947, 7, 3–54. [Google Scholar]
  26. Leopold, L.B.; Wolman, M.G. River Channel Patterns: Braided, Meandering and Straight. US Geol. Surv. Prof. Pap. 1957, 282, 39–85. [Google Scholar]
  27. Frasson, R.P.; Pavelsky, T.M.; Fonstad, M.A.; Durand, M.T.; Allen, G.H.; Schumann, G.; Lion, C.; Beighley, R.E.; Yang, X. Global relationships between river width, slope, catchment area, meander wavelength, sinuosity, and discharge. Geophys. Res. Lett. 2019, 46, 3252–3262. [Google Scholar] [CrossRef]
  28. Leopold, L.B.; Maddock, T. The Hydraulic Geometry of Stream Channels and Some Physiographic Implications. US Geol. Surv. Prof. Pap. 1953, 252, 57. [Google Scholar]
  29. Blom, A.; Arkesteijn, L.; Chavarrias Borras, V.; Viparelli, E. The equilibrium alluvial river under variable flow and its channel-forming discharge. J. Geophys. Res. Earth Surf. 2017, 122, 1924–1948. [Google Scholar] [CrossRef]
  30. Perdios, A.; Langousis, A. Revisiting the statistical scaling of annual discharge maxima at daily resolution with respect to the basin size in the light of rainfall climatology. Water 2020, 12, 610. [Google Scholar] [CrossRef]
  31. Yanina, T.A. Environmental variability of the Ponto-Caspian and Mediterranean basins during the last climatic macrocycle. Geogr. Environ. Sustain. 2020, 13, 6–23. [Google Scholar] [CrossRef]
  32. Matoshko, A.; Gozhik, P.; Ivchenko, A.S. The fluvial archive of the Middle and Lower Dnieper (a review). Neth. J. Geosci. 2002, 81, 339–355. [Google Scholar] [CrossRef]
  33. Ukraintsev, V.Y.; Zakharov, A.L. Dynamics of downcutting and accumulation in river valleys of the Volga basin during the Late Pleniglacial. Gidrosfera. Opasnyye Protsessy I Yavleniya 2023, 5, 147–159. (In Russian) [Google Scholar] [CrossRef]
  34. Brunsdon, C.; Fotheringham, A.S.; Charlton, M.E. Geographically weighted regression: A method for exploring spatial nonstationarity. Geogr. Anal. 1996, 28, 281–298. [Google Scholar] [CrossRef]
  35. Tinkler, K.J. Active valley meanders. Area 1973, 5, 41–43. [Google Scholar]
  36. Cogley, J.G. On runoff at the time of deglaciation. Area 1973, 5, 33–37. [Google Scholar]
  37. Nachtergaele, J.; Poesen, J.; Sidorchuk, A.; Torri, D. Prediction of concentrated flow width in ephemeral gully channels. Hydrol. Process. 2002, 16, 1935–1953. [Google Scholar] [CrossRef]
  38. Watts, W.A. Regional variation in the response of vegetation to Lateglacial climatic events in Europe. In Studies in the Lateglacial of North-West Europe; Lowe, J.J., Gray, J.M., Robinson, J.E., Eds.; Pergamon: Oxford, UK, 1980; pp. 1–22. [Google Scholar]
  39. Velichko, A.A. (Ed.) Paleoclimates and Paleoenvironments of Extra-Tropical Regions of the Northern Hemisphere. Late Pleistocene—Holocene. Atlas-Monograph; GEOS: Moscow, Russia, 2008; p. 120. (In Russian) [Google Scholar]
  40. Tarasov, P.E.; Peyron, O.; Guiot, J.; Brewer, S.; Volkova, V.S.; Bezusko, L.G.; Dorofeyuk, N.I.; Kvavadze, E.V.; Osipova, I.M.; Panova, N.K. Last Glacial Maximum climate of the former Soviet Union and Mongolia reconstructed from pollen and plant macrofossil data. Clim. Dyn. 1999, 15, 227–240. [Google Scholar] [CrossRef]
  41. Tarasov, P.E.; Volkova, V.S.; Webb, T.; Guiot, J.; Andreev, A.A.; Bezusko, L.G.; Bezusko, T.V.; Bykova, G.V.; Dorofeyuk, N.I.; Kvavadze, E.V.; et al. Last glacial maximum biomes reconstructed from pollen and plant macrofossil data from northern Eurasia. J. Biogeogr. 2000, 27, 609–620. [Google Scholar] [CrossRef]
  42. Johnsen, S.J.; Dahl-Jensen, D.; Gundestrup, N.S.; Steffensen, J.P.; Clausen, H.B.; Miller, H.; Masson-Delmotte, V.; Sveinbjörnsdóttir, A.E.; White, J. Oxygen isotope and palaeotemperature records from six Greenland ice-core stations: Camp Century, Dye-3, GRIP, GISP2, Renland and NorthGRIP. J. Quat. Sci. 2001, 16, 299–307. [Google Scholar] [CrossRef]
  43. NorthGRIP Members. High-resolution record of Northern Hemisphere climate extending into the Last Interglacial period. Nature 2004, 431, 147–151. [Google Scholar] [CrossRef] [PubMed]
  44. Rasmussen, S.O.; Andersen, K.K.; Svensson, A.M.; Steffensen, J.P.; Vinther, B.M.; Clausen, H.B.; Siggaard-Andersen, M.L.; Johnsen, S.J.; Larsen, L.B.; Dahl-Jensen, D.; et al. A new Greenland ice core chronology for the last glacial termination. J. Geophys. Res. Atmos. 2006, 111, D06102. [Google Scholar] [CrossRef]
  45. Luoto, T.P.; Kotrys, B.; Płóciennik, M. East European chironomid-based calibration model for past summer temperature reconstructions. Clim. Res. 2019, 77, 63–76. [Google Scholar] [CrossRef]
  46. Płóciennik, M.; Mroczkowska, A.; Pawłowski, D.; Kruk, A.; Wieckowska-Lüth, M.; Kurzawska, A.; Rzodkiewicz, M.; Okupny, D.; Szma´nda, J.; Mazurkevich, A.; et al. Summer temperature drives the lake ecosystem during the late weichselian and Holocene in eastern Europe: A case study from western Russia. Catena 2022, 214, 106–206. [Google Scholar] [CrossRef]
  47. Borisova, O.K. Landscape and climatic conditions in the central East European Plain in the last 22 thousand years: Reconstruction based on paleobotanical data. Water Resour. 2021, 48, 886–896. [Google Scholar] [CrossRef]
  48. Motovilov, Y. Hydrological simulation of river basins at different spatial scales: 1. Generalization and averaging algorithms. Water Resour. 2016, 43, 429–437. [Google Scholar] [CrossRef]
  49. Kapsch, M.-L.; Mikolajewicz, U.; Ziemen, F.; Schannwell, C. Ocean response in transient simulations of the last deglaciation dominated by underlying ice-sheet reconstruction and method of meltwater distribution. Geophys. Res. Lett. 2022, 49, e2021GL096767. [Google Scholar] [CrossRef]
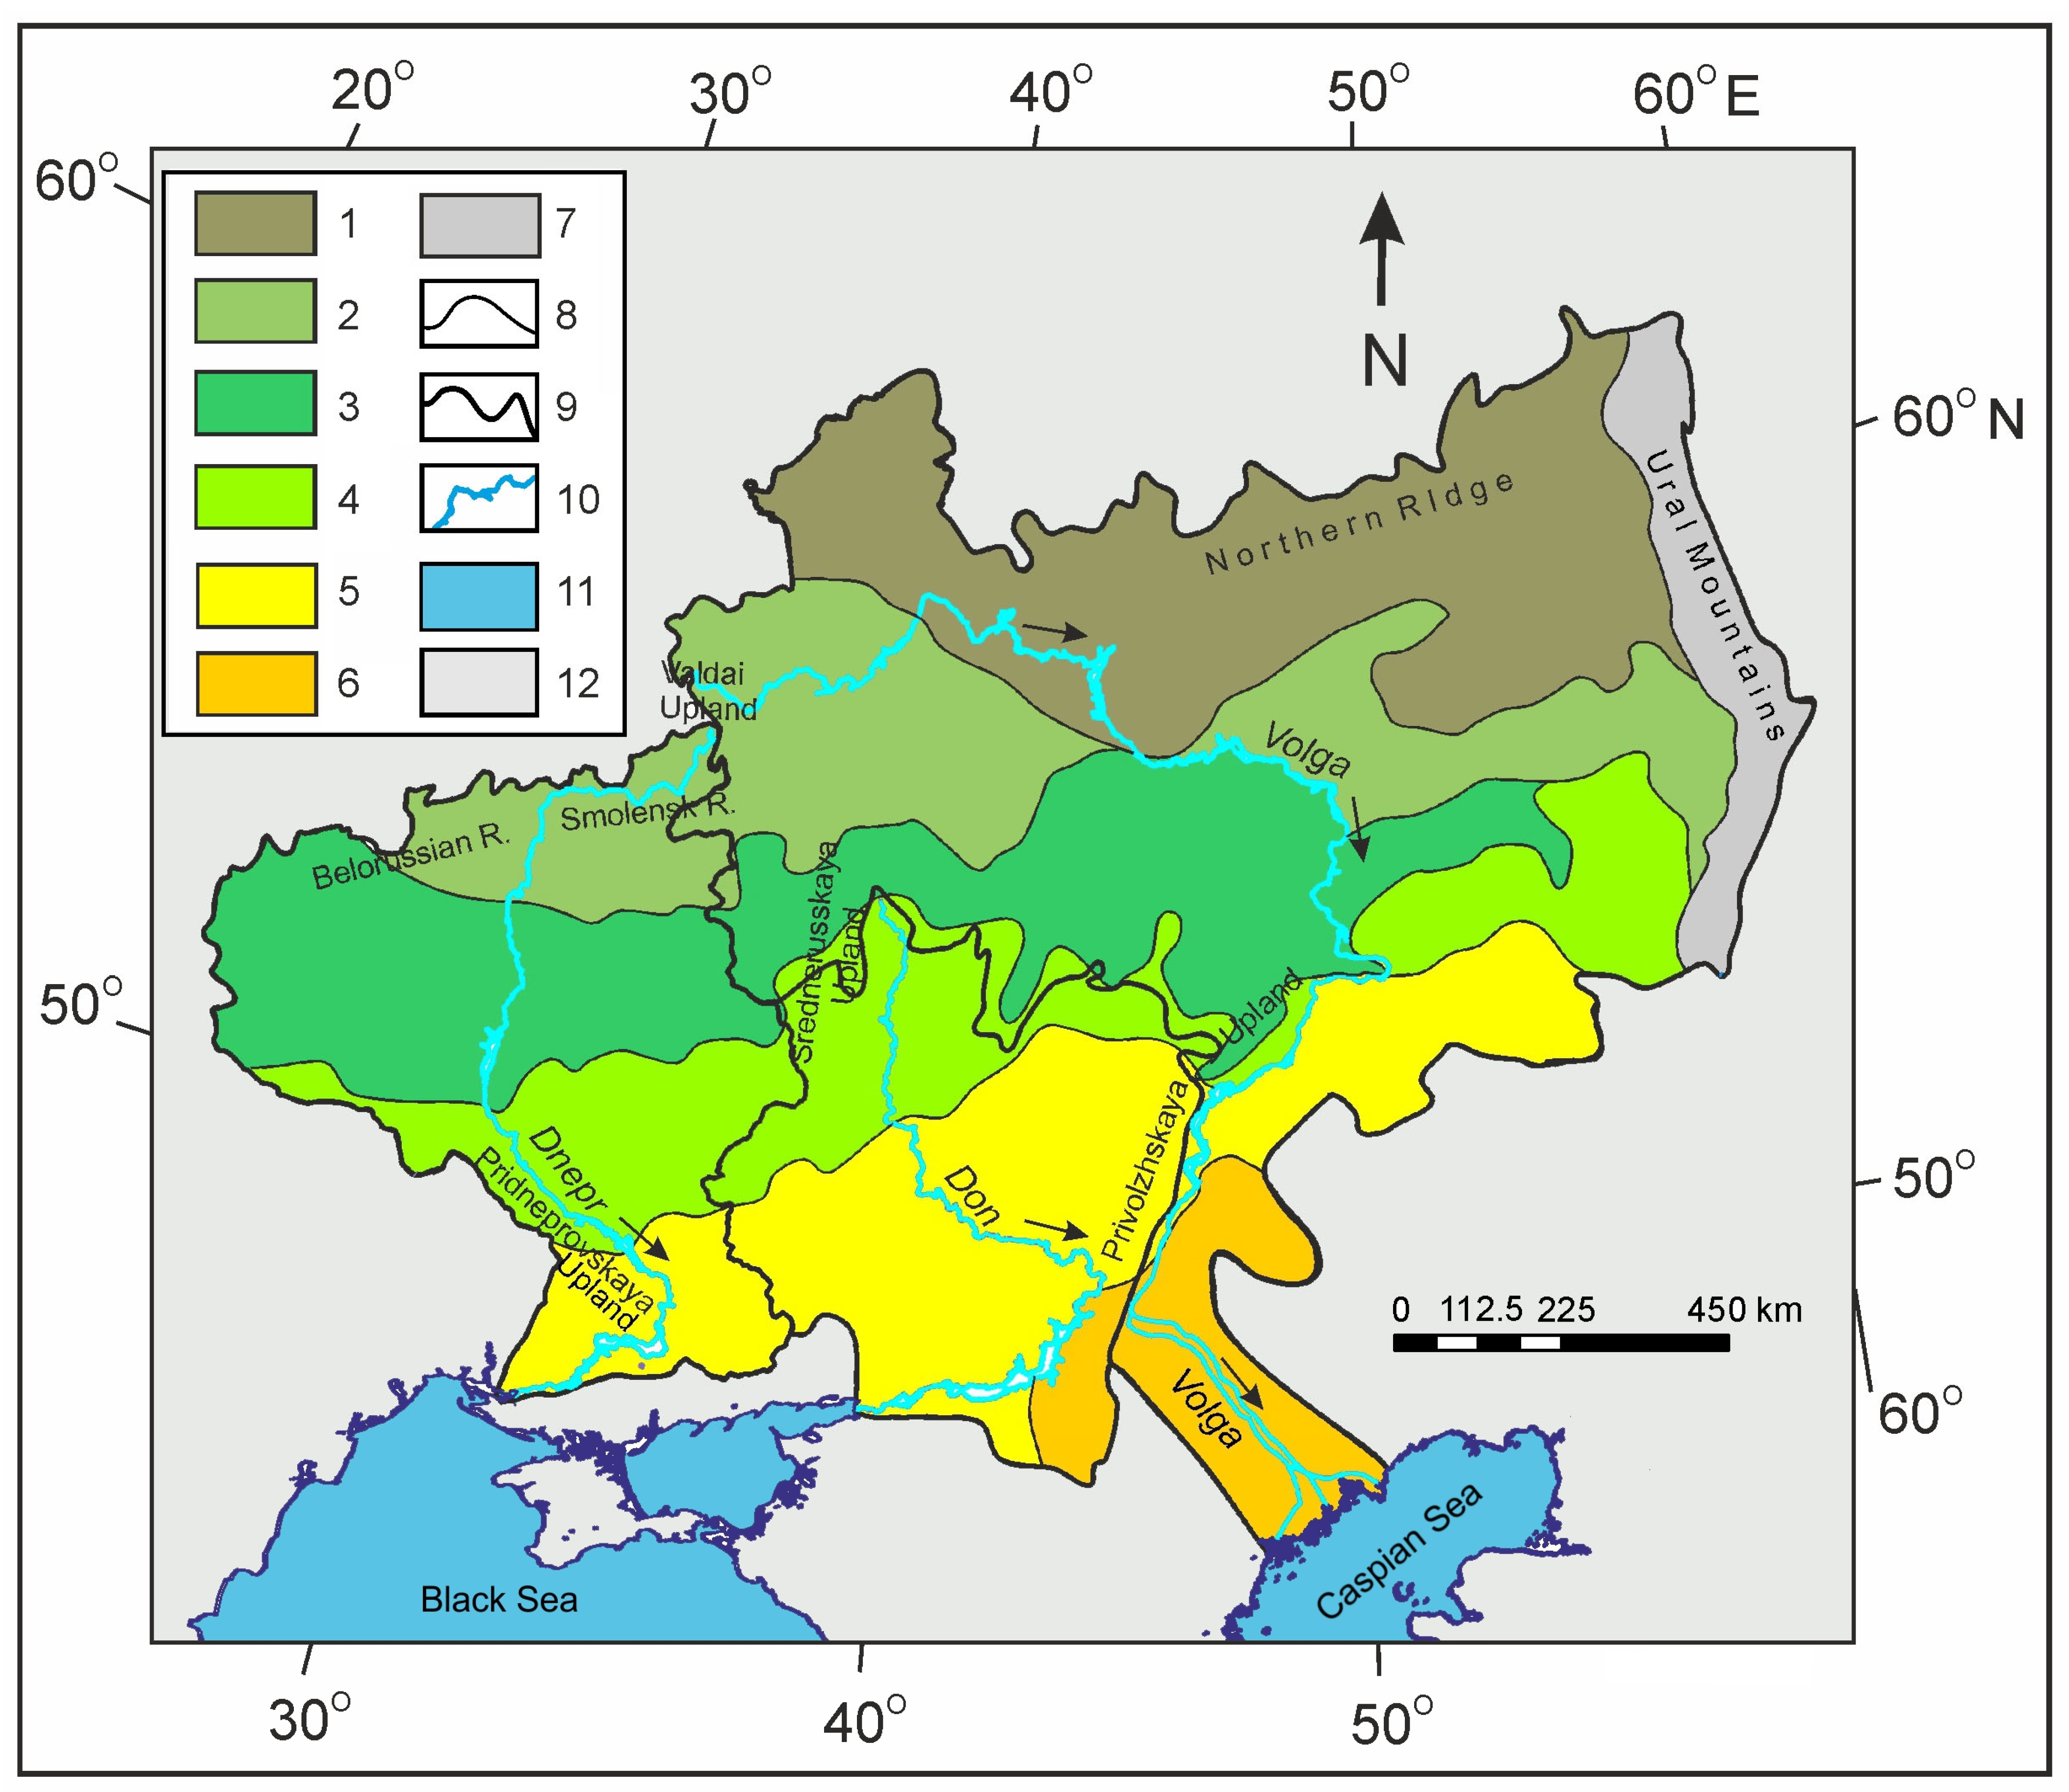
Figure 1. Contemporary vegetation in the East European Plain (adapted from [13], simplified): 1—taiga, 2—coniferous-broadleaved forests, 3—broadleaved forests, 4—forest–steppe, 5—steppe, 6—semidesert and desert, 7—mountain taiga, sub-Alpine and Alpine vegetation, 8—boundaries of the zones, 9—boundaries of the river basins, 10—the main rivers (arrows show flow direction), 11—marine basins, 12—continental part outside the main river basins.
Quaternary 07 00032 g001
Figure 2. Examples of the large meandering paleochannels: (A) the Volga River basin, the Sok River near Sergievsk (53°56′56.67″ N, 51°10′3.65″ E) with ancient meander wavelength Lpast = 1600 m and channel width Wpast = 170 m, modern meander wavelength Lmod = 240 m and width Wmod = 20 m; (B) the Don River Basin, the Medveditsa River near Lysye Gory (51°32′43.44″ N, 44°50′2.86″ E), Lpast = 2200 m, Wpast = 210 m, Lmod = 520 m, Wmod = 40 m; and (C) the Dnepr River basin, the Psel River at Nizhnya Manuilivka (49°22′17.30″ N, 33°43′16.66″ E), Lpast = 2600 m, Wpast = 135 m, Lmod = 600 m, Wmod = 25–35 m.
Quaternary 07 00032 g002
Figure 3. The distribution of well-preserved fragments of large meandering paleochannels on the southern megaslope of the East European Plain: 1—in the Volga River basin, 2—in the Don River basin, 3—in the Dnepr River basin, 4—the river net, 5—the main rivers, 6—the ancient extensions of the rivers on the Black Sea shelf, 7—river flow direction, 8—the main water divides, 9—modern sea coastlines, 10—sea basins during the Late Pleniglacial, 11—continental part outside the main river basins.
Quaternary 07 00032 g003
Figure 4. The main landscapes on the southern megaslope of the East European Plain in the Late Pleniglacial. 1—Scandinavian ice sheet at the Pomeranian stage (~20 ka BP); 2—the ice-sheet boundary at the LGM; 3—the Pomeranian stage boundary; 4—the Luga stage boundary; 5—tundra and cold-tolerant xerophyte communities, locally with birch and larch open woodlands; 6—tundra and steppe communities in combination with pine and birch open woodlands; 7—meadow steppe with birch and pine forests, tundra, and halophilic communities; 8—herb and grass steppe; 9—meadow steppe with birch and pine forests; 10—southern herb and grass steppe without permafrost; 11—coniferous forests; 12—zonal boundaries; 13—southern boundary of continuous permafrost; 14—mountain glaciers. Adapted from [16], simplified, with additions. For other elements of the legend, see Figure 3.
Quaternary 07 00032 g004
Figure 5. The histogram of the ratios of channel bankfull widths of the ancient (Wpast) and modern (Wmod) rivers in the Volga, Don, and Dnepr River basins. The nearest approximation is log-normal function. The Wmod of the rivers with broad floodplains were not used.
Quaternary 07 00032 g005
Figure 6. Distribution of the values of coefficient a in Equation (3) on the southern megaslope of the East European Plain, which shows the geographical patterns of the data scatter when using this Equation. For other elements of the legend, see Figure 3.
Quaternary 07 00032 g006
Figure 7. The distribution of the maximum flood runoff depth Xu_mod_max (in mm/day) for the unit catchment (F ≤ 1000 km2) calculated from the modern hydrological measurements (before 1970s) in the basins of the Volga, Don, and Dnepr Rivers. For other elements of the legend, see Figure 3.
Quaternary 07 00032 g007
Figure 8. The distribution of the maximum flood runoff depth Xu_past_max for the unit catchment (F ≤ 1000 km2) in the basins of the Volga, Don, and Dnepr Rivers for the period 18–14 cal ka BP, calculated with Equations (4) and (9). For other elements of the legend, see Figure 3.
Quaternary 07 00032 g008
Figure 9. The ratio R of the anomalies of the maximum flood runoff depths for the basins of the Volga, Don, and Dnepr Rivers, calculated as Xu_past_max/44.2 divided on Xu_mod_max/7.4. For other elements of the legend, see Figure 3.
Quaternary 07 00032 g009
Figure 10. The climatic characteristics of the period 21–14 ka BP (within MIS 2), including the time of the large river formation (18–14 ka BP). (A) NGRIP oxygen isotope curve [43], (BD) anomalies of the air temperatures for January (B) and June (C), and for annual precipitation (D) in the upper Volga (green boxes) and upper Dnepr (yellow boxes) basins. Adapted from [47], with additions.
Quaternary 07 00032 g010
Table 1. The coefficients and exponents in Equation (3) for the river basins of the southern megaslope of the East European Plain.
River BasinCoefficient aExponent b
MeanSTD Err+95.00% Cnf. Lmt+95.00% Cnf. LmtMeanSTD Err+95.00% Cnf. Lmt+95.00% Cnf. Lmt
Volga1.662.380.446.251.380.161.051.72
Don1.741.291.022.951.370.11.171.57
Dnepr1.31.250.832.041.370.061.241.49
Table 2. The coefficients and exponents in Equations (7) and (8) for the rivers of the Don River basin for the different basin areas and the different modern landscapes.
Modern
Basin AreaLandscapeCoefficient a1Exponent b1
F ≤ 1000 km2Forest–steppe0.141
F > 10001.60.65
F ≤ 1000 km2steppe0.0821
F > 10000.410.75
F ≤ 1000 km2Dry steppe0.0631
F > 10000.190.79
Table 3. The characteristics of the maximum runoff during the floods for the modern and ancient rivers of the southern megaslope of the East European Plain.
River Basin Modern Rivers Ancient RiversThe Ratio Ancient/Modern
NameBasin Area for the Lowermost Gauging Stations, 103 km2Mean Daily Runoff Depth at the Unit Basin, mmMean Maximum Discharges for the Lowermost Gauging Stations m3/sMean Daily Runoff Depth at the Unit Basin, mmMean Maximum Discharges for the Lowermost Point, m3/sMean Daily Runoff DepthMean Maximum Discharges
Volga13608.325,1004698,3005.53.9
Don3787.256204532,0006.35.7
Dnepr4594.976803913,00081.7
Disclaimer/Publisher’s Note: The statements, opinions and data contained in all publications are solely those of the individual author(s) and contributor(s) and not of MDPI and/or the editor(s). MDPI and/or the editor(s) disclaim responsibility for any injury to people or property resulting from any ideas, methods, instructions or products referred to in the content.