Abstract
Combined with eustatic sea-level changes, uplifted Quaternary marine terraces provide insight into the tectonics of coastal areas. Cephalonia Island lies 35 km off the western coast of mainland Greece and 15 km northeast of the Hellenic subduction zone. Late Pleistocene eustatic sea-level oscillations and the long-term tectonic movements are imprinted on the landscape of the southern part of the island, in the form of seven uplifted marine terraces. In the present study we aim to identify and map in detail these terraces, applying Digital Elevation Model analysis, utilizing Geographic Information Systems techniques and extensive fieldwork. The GIS-based analysis combined with field geomorphological observations revealed a sequence of seven marine terraces at the southern part of the main island ranging in elevation between 4 m and 176 m asl. Microscope, petrological and microgeomorphological analyses on two caprock samples suggest strong marine influence during the deposition of the sediments covering the marine terraces. The age of the formation of the 32 m marine terrace was assigned to the MIS 3e, based on OSL dating of a caprock sample, and an average uplift rate of 1.4 ± 0.35 mm a−1 was calculated for the last 61 ± 5.5 ka. Assuming a uniform uplift rate for the Late Pleistocene allowed us to correlate the marine terrace with the sea-level highstands and constrain their ages.
1. Introduction
Late Pleistocene fluctuations in sea level can leave their marks on the landscape, in coastal areas that are subjected to tectonic uplift relative to the sea or ocean [1,2,3,4]. During periods of relatively stable sea level, a wave-cut platform can be carved into the landscape [1]. On uplifting coastal areas, the wave-cut platforms carved during each episode of sea-level highstand are preserved as uplifted marine terraces [5]. On such tectonically active coasts with fast enough uplift rates, several marine terraces may be cut and preserved in the form of a staircase, with each terrace’s inner edge representing the position of the shore at some time in the past [5]. In this way, several cycles of sea-level oscillations can be recorded on the landscape [4]. Marine terraces are widely used in studies of active tectonics as their morphological characteristics reflect the complex history of the late Pleistocene sea-level fluctuations and their interaction with the tectonic activity [6,7,8,9,10]. The inner edge, (i.e., the junction of the terrace’s palaeosurface with the palaeo-cliff) of each terrace corresponds to a sea-level highstand and can therefore be correlated with a Marine Isotope Stage (MIS) [11,12,13,14,15,16]. Assuming that the uplift has a steady rate, the absolute age of one terrace can be applied to extrapolate the ages of the remaining terraces in the same sequence [3,11]. Furthermore, considering a long-term continuous tectonic uplift of a coastal area, we can correlate the whole flight of uplifted marine terraces with the sea-level highstands of the global eustatic sea-level curves (among others: [2,17,18]) and therefore constrain their ages.
A significant amount of research was undertaken along tectonically active coasts where it was attempted to reconstruct past sea-level changes and infer long-term tectonic uplift rates, by correlating uplifted marine terraces with sea-level highstands [19,20,21,22,23,24,25,26,27,28,29]. These studies laid the foundation for estimating tectonic patterns derived from flights of marine terraces.
Considerable scientific interest has been focused on Greece, as marine terraces occur in tectonically active coastal areas mainly close to the Hellenic Subduction Zone (Cephalonia, southern Peloponnese, Crete, Karpathos and Rhodes), as well as along the coasts of the active tectonic grabens of the Gulf of Corinth and the North Evoikos Gulf. The authors of [17,30] focused on the Quaternary evolution of the Corinth Rift. Other authors [17] used a detailed analysis of aerial and SPOT imagery combined with field observations to identify 10 terrace platforms and strandlines, ranging in elevation from 10 to 400 m, and correlated them to Marine Isotope Stages of late Pleistocene age. The study [31] mapped in detail a sequence of five uplifted marine terraces that occur along the southern coast of the island of Crete and correlated them with Middle-Late Pleistocene sea-level highstands. By estimating the tectonic deformation of the terraces by the vertical displacement of the north-northeast–south-southwest trending Ierapetra normal fault, they obtained uplift rates of 0.3 mm/year for the regional component of uplift due to the proximity to the subduction zone, and 0.1 mm/year for the vertical slip movements of the Ierapetra fault. The authors of [32] combined geomorphological, sedimentological, and micro- and macro-palaeontological approaches to evaluate the Late Quaternary geomorphic evolution of the Arkitsa area (North Evoikos Gulf), focusing on prominent uplifted terraces, which are present in the hanging wall of the Arkitsa fault. Three glaciolacustrine terraces and previously reported raised marginal marine deposits suggest continuous tectonic uplift at an average rate of 1–1.5 mm/year over the past at least 40 ka. The study [33] produced the geomorphological map of Cephalonia Island in western Greece (scale 1:50,000), and mapped in detail a flight of eight marine terraces in Paliki Peninsula (western part of the island) and seven marine terraces in the southern part of the main island. They concluded that the recent (Quaternary) evolution of the landscape is dependent mostly on neotectonic processes and eustatism.
Cephalonia Island is in the Ionian Sea (western Greece), in close proximity to the subduction zone. The tectonic regime of the broader study area is highly complicated as collision, subduction, transform faulting and spreading processes are concentrated in a restricted region [34]. The prevailing long-term vertical movement of the island is uplift [35,36]. The area is characterized by intense seismicity with strong frequent earthquakes. Since the fifteenth century, 21 earthquakes with magnitudes greater than 6.5 have severely affected the island while nine of them have occurred during the last century [34,35,36]. In the present study we aim to investigate the spatial distribution of the marine terraces that occupy the southern part of the main island of Cephalonia in western Greece, to provide age constraints on the formation of the marine terraces, to correlate them with the sea-level highstands during the late Pleistocene and to deduce a tectonic uplift rate for the coastal area of the southern part of the Cephalonia Island.
2. Regional Setting—Study Area
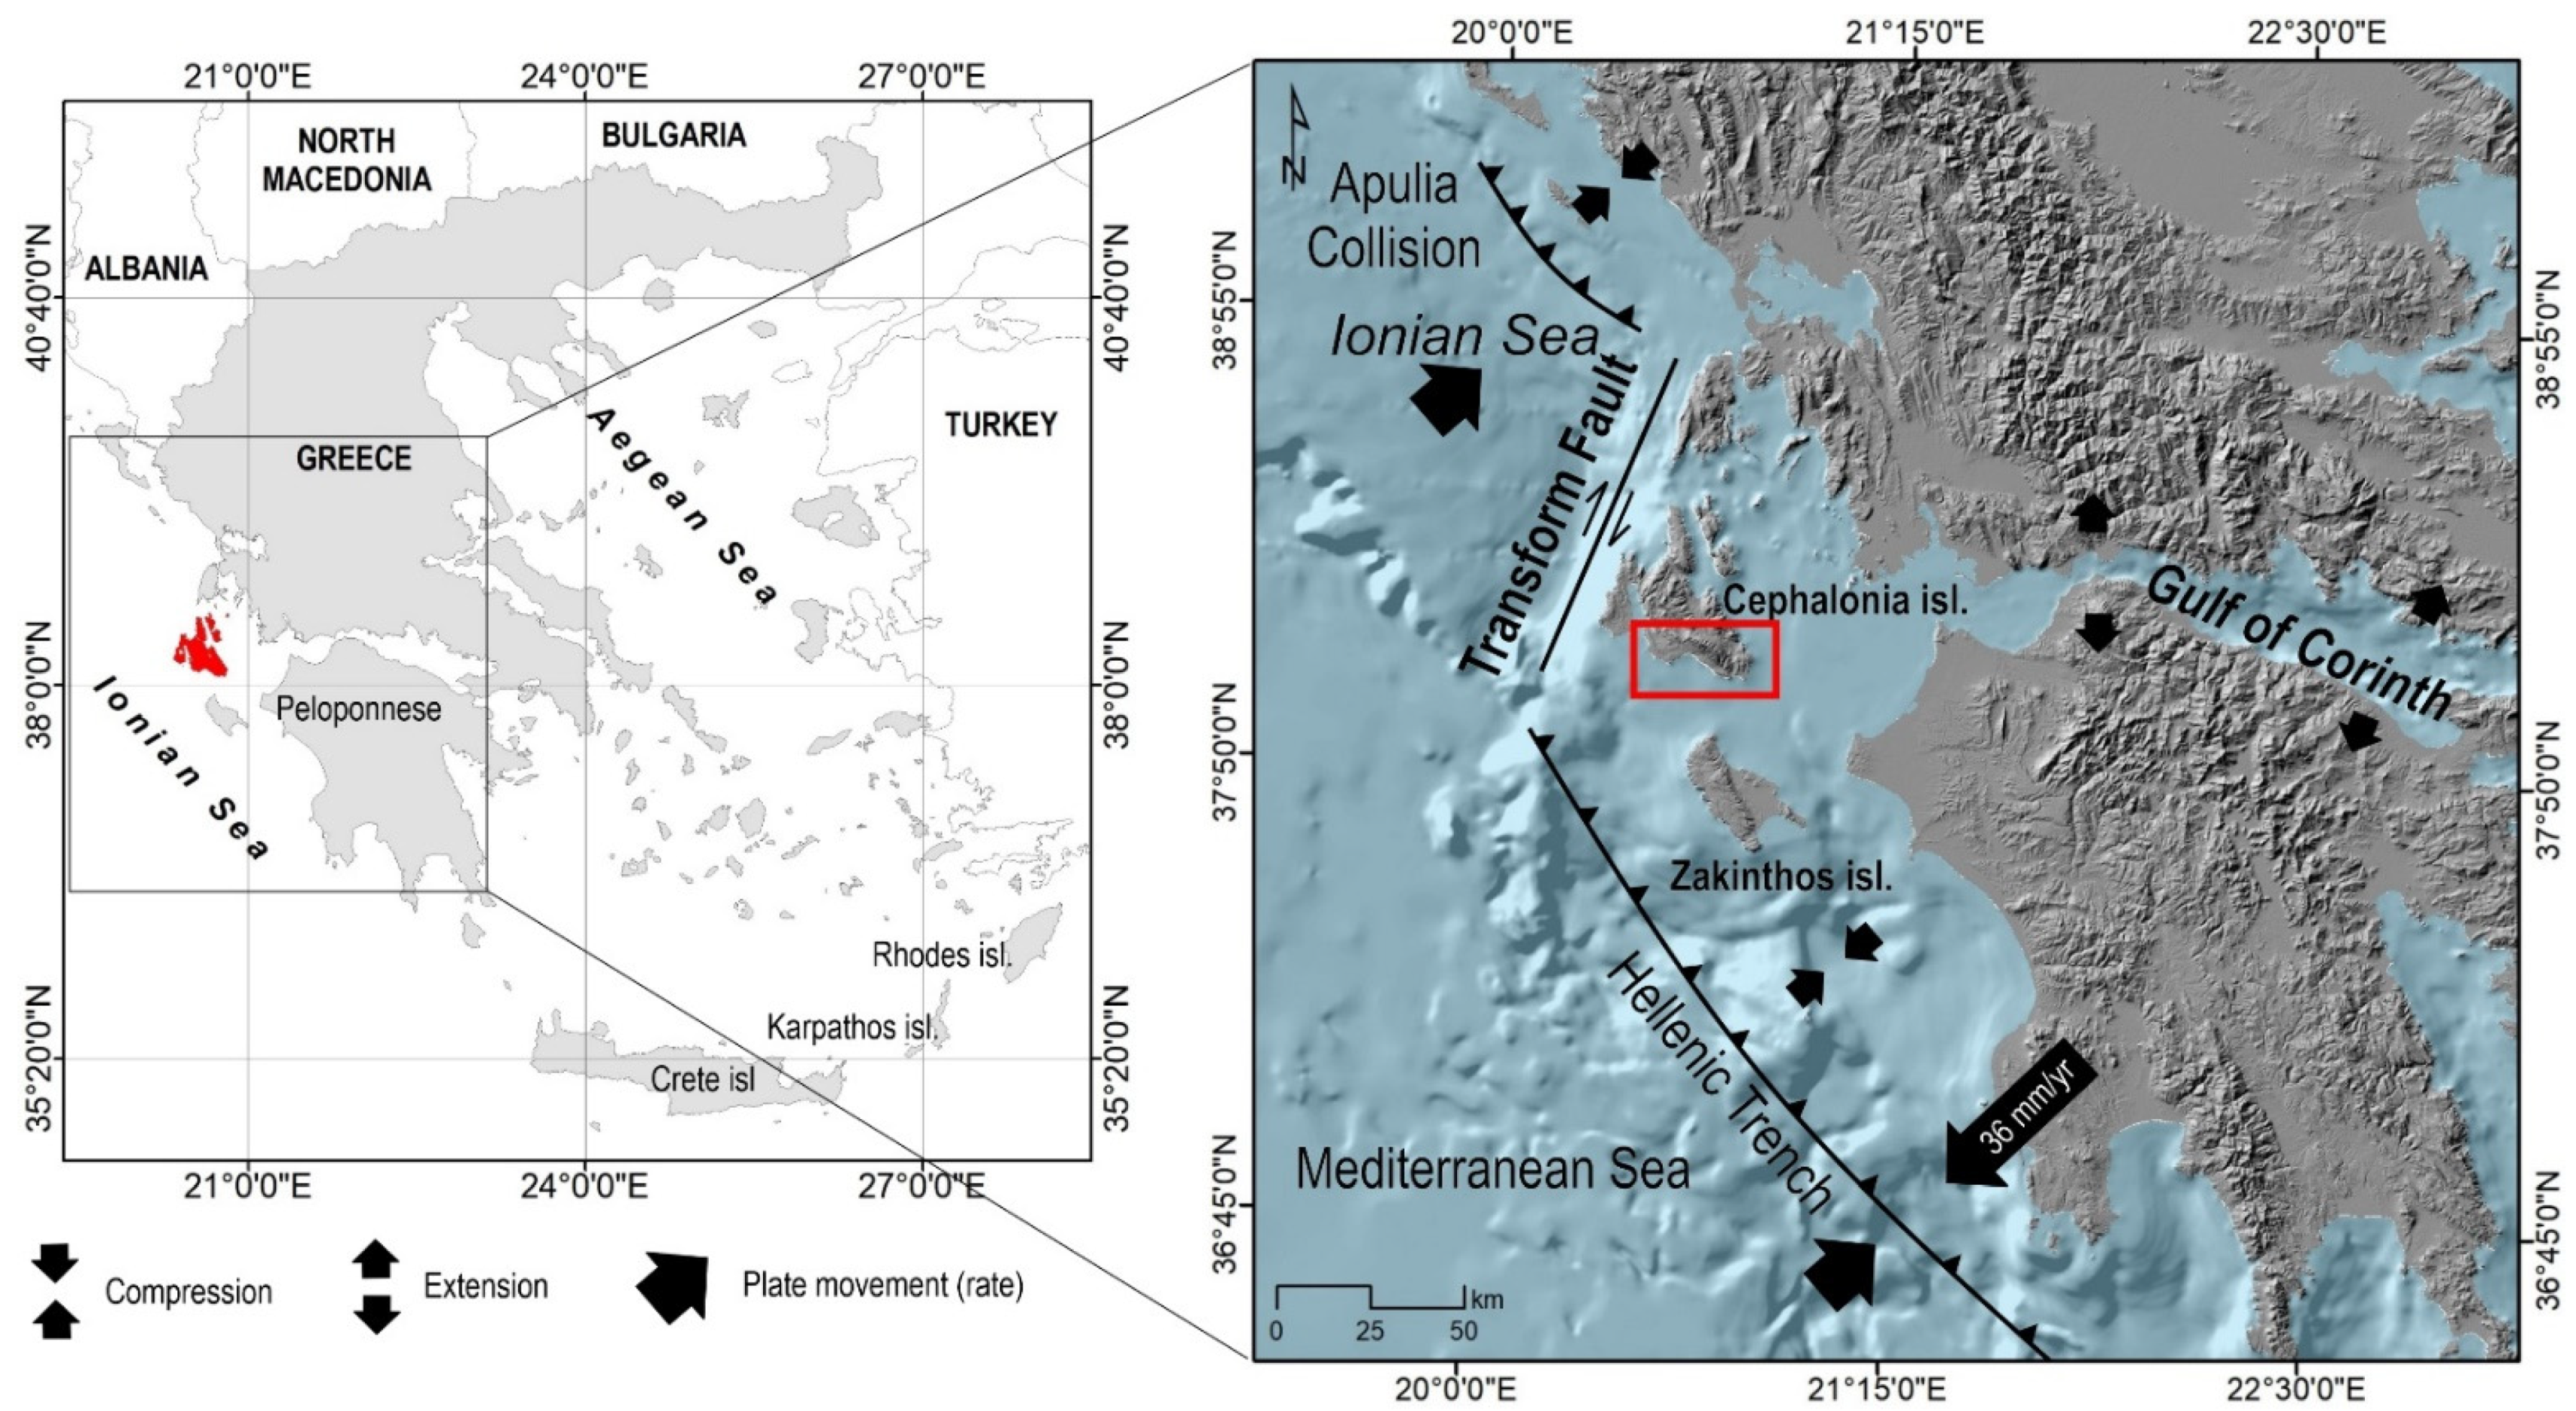
Cephalonia Island lies approximately 35 km off the western coast of mainland Greece (Figure 1). The island covers an area of 781 km2 and exhibits a mountainous relief and a steep coastal morphology along the two thirds of the total coastline length. The study area is located at the southern coast of the main island between 20°27′E and 20°49′E. The coastline has a general northwest–southeast direction for about 45 km between the settlements of Argostoli to the west and Skala to the east. The coastal morphology of the study area is dominated by steep cliffs with slopes ranging from 32% to 64%, interrupted by sandy beaches with gentle slopes [33].

Figure 1.
Location of the study area and the general tectonic setting in the Ionian Sea. The study area is indicated with the red rectangular. Note the transform fault (Cephalonia Fault Zone), a major dextral strike slip fault, located offshore, west of the island.
Cephalonia Island is directly affected by the tectonically highly active Hellenic Trench to the southwest, where collision, subduction, transform faulting and spreading processes are focused on a restricted region [34]. The tectonic evolution of the island is dependent primarily on the geodynamic processes in the area that are related to the active subduction of the African plate beneath the Aegean microplate. Cephalonia fault zone is a major dextral strike slip fault, located offshore, west of the island [35,36,37,38,39,40,41,42]. Tectonic uplift is the dominant long-term vertical movement of the island and has been imprinted on the landscape of Cephalonia [33,34]. Geomorphological evidence of tectonic uplift during the late Pleistocene has been provided by [33], who have mapped a series of uplifted marine terraces at Paliki Peninsula and at the southern part of the main island, as well as fragmented erosional—dissolutional planation surfaces at various elevations. Holocene tectonism is suggested by several researchers [33,43,44]. Other researchers [44] suggest Holocene tectonic uplift based on radiocarbon dating of a peat layer collected from sediment drilling at the Livadi plain at the northern part of the Gulf of Argostoli. Tectonic uplift of the same area is further enhanced by [45] based on an unexpected peak in the order of 1 m in their relative sea-level band around 3950–3750 cal BC. Other authors [46] reported a recent co-seismic uplift of ca. 0.2 m during the 2014 Cephalonia earthquake (M = 6.1). Recent tectonic uplift which mainly uplifted the south-eastern part of the island by 50 and 70 cm has also been produced by two earthquakes, the first between 350 and 710 AD and the second in 1953 [36,47]. Differential Global Position System (DGPS) measurements by [48], indicate recent vertical deformation in two time periods: during the period between 1992 and 2003, linear minor subsidence of around 1 mm/year has been documented, while during the second period, from 2003 to 2010, an uplift rate of 2–4 mm/year has been estimated, which occurred mostly along the southern and south-eastern parts of the island. Larger magnitudes in the order of 4 mm/year occur at the western part [48]. These results represent the complicated tectonics of the island, indicating that it is comprised of several tectonic blocks [48].
The bedrock of the study area consists of thin bedded pelagic limestone of the Ionian and Paxos geotectonic units underlain by conglomeratic and brecciated limestone of Upper Oligocene–Upper Miocene age [49] (Figure 2). Extensive outcrops of Neogene and Quaternary deposits overlay this bedrock while transgressive well-bedded conglomeratic facies of the Lower Pliocene have been identified in the form of a short stratigraphic hiatus [49]. Pleistocene formations are composed mostly of conglomerate and sandstone that occur along the southern flank of Mt. Aenos. Holocene alluvial fans, scree talus and talus cones, as well as high-energy fluvial deposits along the stream channels, have been observed at several places within the study area. The strike of the faults is mostly northwest–southeast (Figure 2).
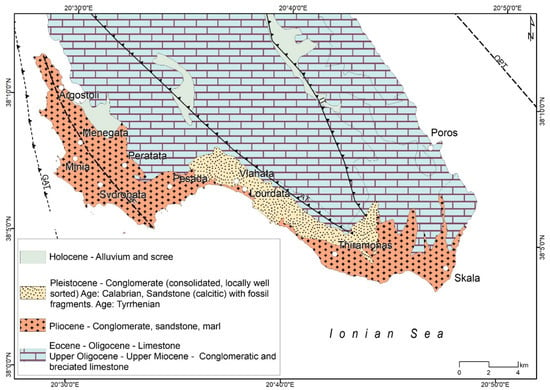
Figure 2.
Simplified geology of the investigated area. GAT: Gulf of Argostoli Thrust, AF: Argostoli Fault, AT: Ainos Thrust, IT: Ionian Thrust, OPT: Offshore Poros Thrust.
The region has a typical Mediterranean climate, classified as Csa under the Köppen–Geiger climate classification [50,51], with hot, dry summers and mild, wet winters. The mean annual temperature at Argostoli is 18.18 °C while mean annual rainfall reaches 820 mm [52].
3. Materials and Methods
3.1. Mapping Marine Terraces
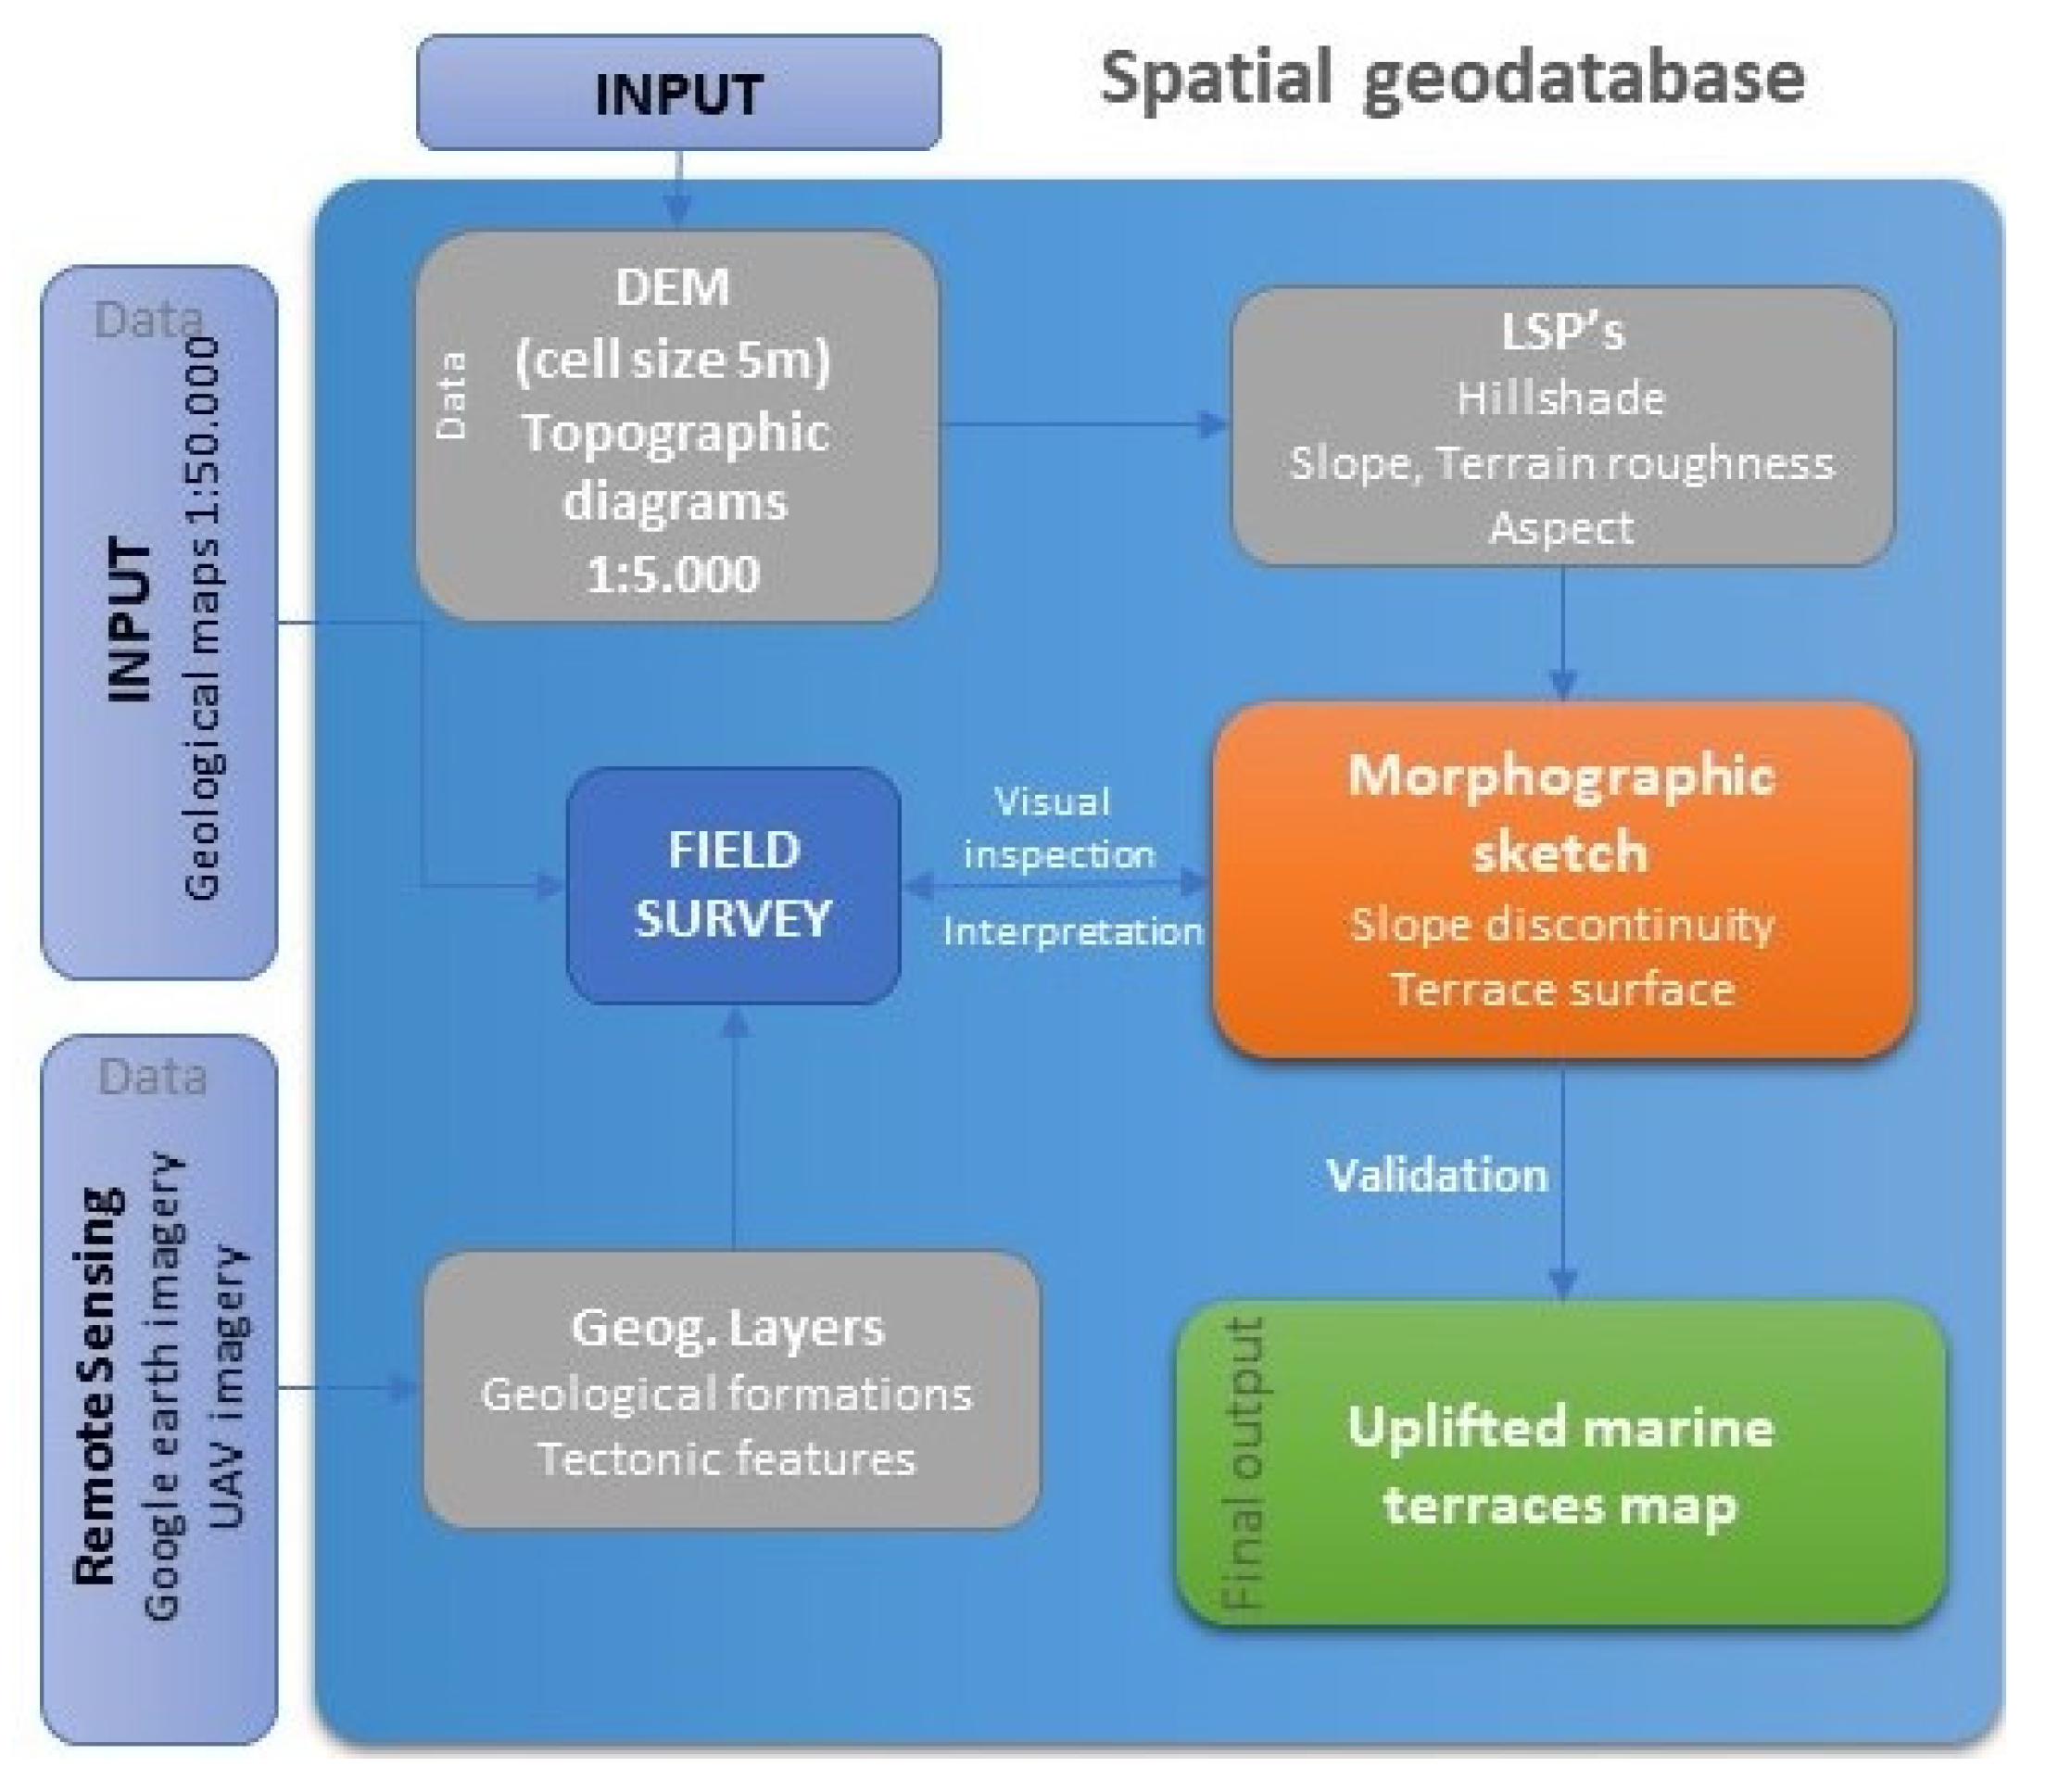
The detailed mapping of the distinct marine terrace surfaces and their inner edges was carried out using both Geographic Information System (GIS) and field techniques [53] (Figure 3). A GIS spatial geodatabase was created using as primary data a 5 m cell-size Digital Elevation Model, topographic maps at a scale of 1:5000 obtained from the Hellenic Military Geographical Service, and the geological map of the area at 1:50,000 scale, published by the Institute of Geology and Mineral Exploration of Greece. Secondary layers such as terrain roughness and slope were produced, to facilitate the identification of the marine terraces and to determine their spatial distribution [54]. Additionally, the above-mentioned derivatives along with Google Earth and UAV imagery were visually inspected and interpreted to produce a preliminary morphographic sketch of the study area depicting the marine terraces’ surfaces and their inner edges.
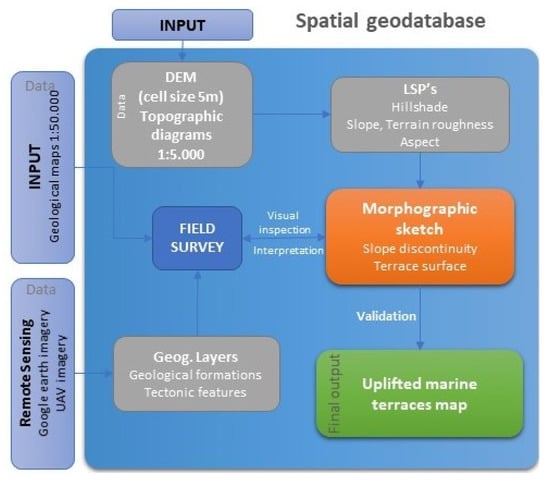
Figure 3.
Workflow diagram of the main steps of the terrace-mapping methodological procedures.
Field investigations focused upon the spatial distribution of the late Pleistocene marine terraces along the southern coast of main Cephalonia Island. During fieldwork, extensive Differential GPS survey took place using a TOPCON GMS-2 DGPS instrument at an accuracy of ±3 cm for both the horizontal and vertical components. Waypoints were marked along the inner edges of each terrace that approximate palaeo-sea level at the time of terrace formation [2,55], to determine their precise position and elevation. All terraces that were mapped on the preliminary morphographic sketch were examined and validated during the field survey. Furthermore, one sample (K5_SKL) was collected from a caprock formation of the V terrace at the southeast part of the island for Optically Stimulated Luminescence dating and two samples (KESK and KEAM) were retrieved from the caprock formations of terraces V and VI, respectively, for microscope, petrological and microgeomorphological analyses.
3.2. Microscope, Petrological and Microgeomorphological Analyses
Two samples were retrieved from the thin veneer of sediments covering the marine terraces for mineralogical analysis. The first sample (KΕSK) was collected from Terrace V at Skala while the second one (KEAΜ) was retrieved from Terrace VI at Cape Agia Pelagia. The mineralogical composition and textural characteristics of the caprock samples were described based on petrographic thin sections prepared that aimed to identify the constituents and the presence of bioclasts, as well as the type of cement. The samples were analysed for the determination of their mineralogical composition and textural characteristics with a Leica DMLP (Leica Microsystems GmbH, Wetzlar, Germany) petrographic microscope with a digital camera and the corresponding image treatment software. All microscopy investigations were conducted at the laboratory of Department of Mineralogy and Petrography, Institute of Geology and Mineral Exploration, Athens, Greece.
3.3. Optically Stimulated Luminescence (OSL) Dating
No previous effort has been recorded in the literature that provides absolute ages of the marine terraces of Cephalonia Island. Even though it was initially intended by the authors to provide multiple ages of the marine terraces, this proved to be impossible for two reasons. First of all, no apparent caprock was found for any other terrace except for terraces V and VI. Furthermore, the caprock deposits corresponding to marine terrace VI were not suitable for OSL dating as they did not contain enough quartz material. One sample (K5_SKL) was collected from Terrace V (38°04′05.7″ N 20°47′52.2″ E) at an elevation of 32 m applying standard sampling techniques [56], in order to determine the age of sediment burial using OSL. The sample was processed and measured at the Luminescence Dating Laboratory of the Institute of Physics, Silesian University of Technology, Poland. The determination of the dose rate radioactivity was measured by a germanium spectrometer using quartz grains of 125–200 μm size. These quartz grains were extracted by wet sieving and acid treatment (etched in 40% HF for 60 min) under subdued red-light conditions. The sample was found to contain enough quartz and could provide a solid OSL age. The single aliquot regeneration protocol (OSL-SAR) [56] was adopted for the determination of the equivalent dose (De) considering the Central Age Model (CAM) on 23 aliquots. All measurements were performed on an automated Riso TL/OSL-DA-20 reader equipped with a 90Sr/90Y beta radiation source. Signals were detected using a 7 mm Hoya U-340 optical filter. The concentration of U, Th, and K by neutron activation analysis was also measured, and elemental concentrations were then converted into an annual dose rate, taking into account the water content effect [56].
3.4. Uplift Rates
In order to estimate the uplift rate, three main parameters should be taken into consideration which include the absolute elevation of an uplifted marine terrace, the elevation of the sea level in respect to the present-day sea level and the age of the formation of the respective terrace according to the following equation [2,57]:
where U: Uplift rate, Z: absolute elevation of the marine terrace, SL: Sea level at the time of formation of the terrace and T: Age of the terrace.
U = (Z − SL)/T
It should be noted that in Equation (1) the absolute elevation of the uplifted marine terrace should normally correspond to the elevation of the inner edge of the terrace. Given that the dated sample (K5_SKL) was collected from the marine sediments (caprock) covering the terrace VI, it is considered that the elevation of the sample does not correspond to a precise sea-level indicator. Hence, in our uplift rates calculations, we took into consideration the absolute elevation of the inner edge of corresponding terrace VI. Furthermore, the above Equation (1), although it generally includes all the necessary parameters (total uplift and age) to deduce an uplift rate, does not take into account the errors on the eustatic sea-level curve. In this respect, it was considered mandatory to include in our calculations minimum and maximum values of the sea level at the time of the formation of the terrace following the sea-level curve proposed by [15], as well as the duration of the MIS that corresponds to Terrace VI (Tmax and Tmin), and therefore estimate a minimum and maximum uplift using a modified version of Equation (1):
Umin = (Z − SLmax)/Tmax
Umax = (Z − SLmin)/Tmin
In this context, we first calculate the total uplift of the marine terrace and by dividing by the age of the terrace, we obtain the uplift rate U.
4. Results
4.1. Mapping Marine Terraces
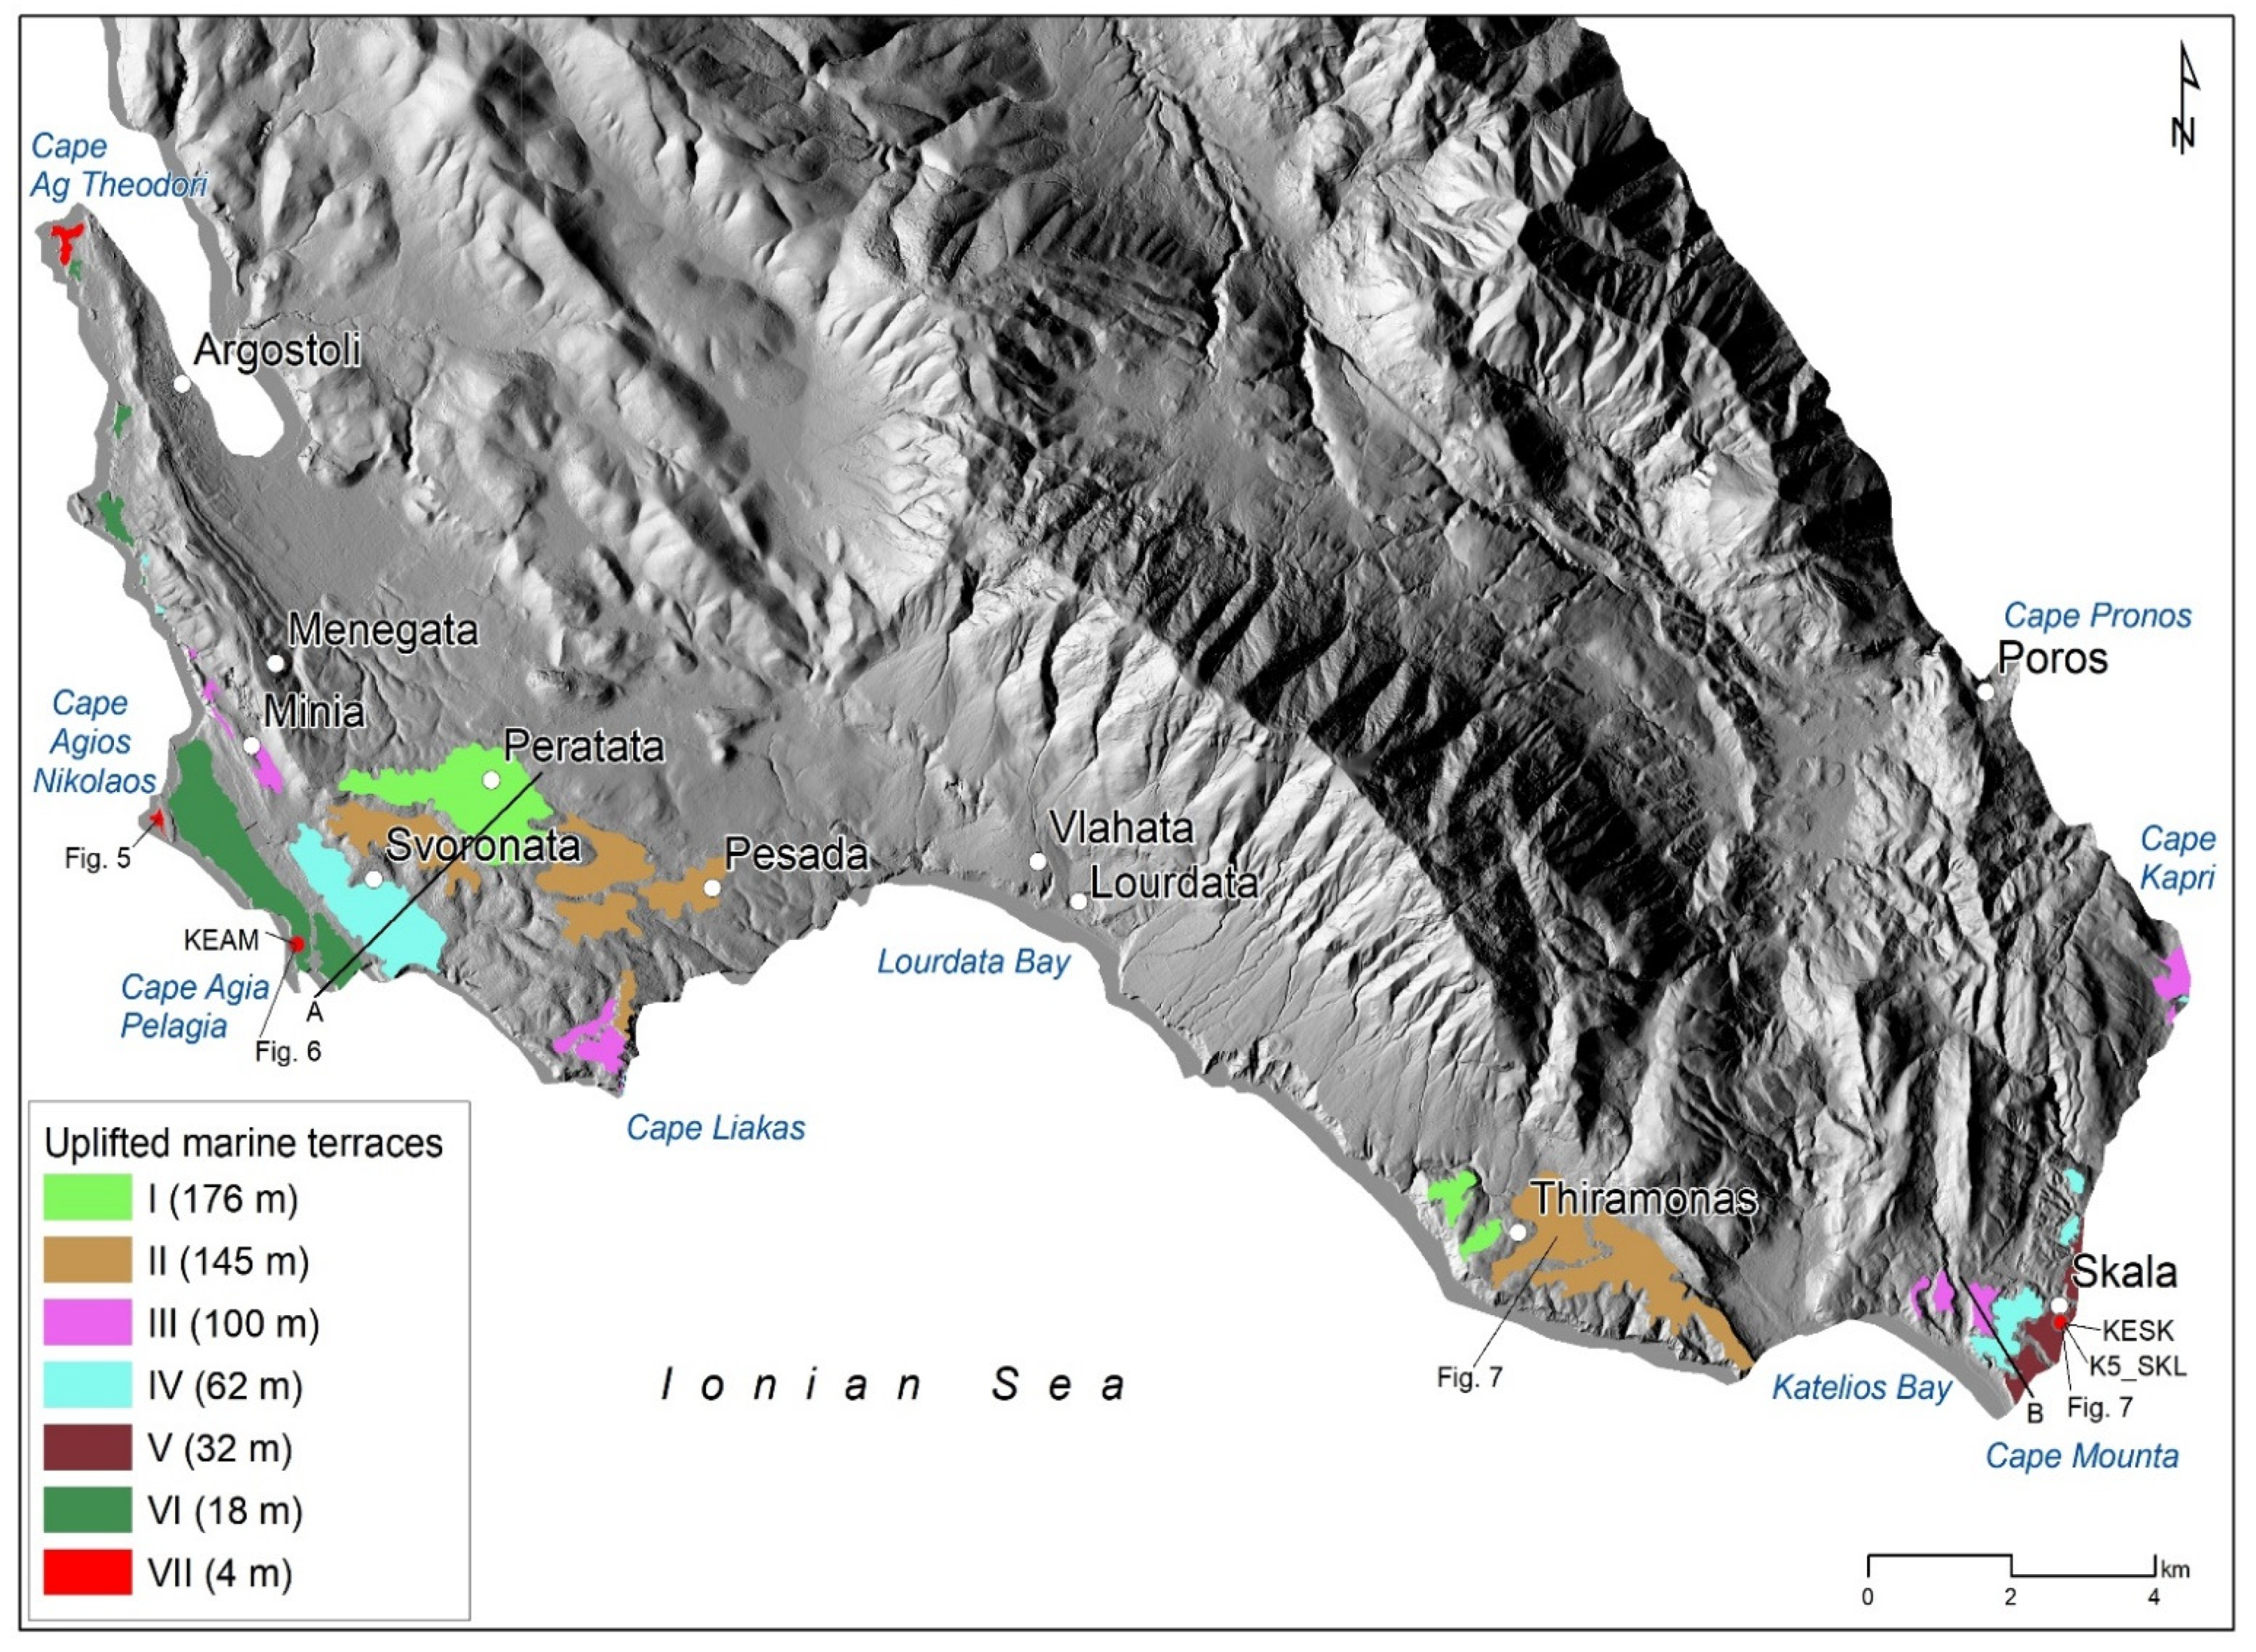
The GIS procedures combined with field survey identified a sequence of seven uplifted marine terraces (I to VII) along the southern coast of the Cephalonia Island, located between Cape Agioi Theodoroi and Cape Kapri. The elevation of their inner edge ranges between 4 m for the lower and 176 m for the higher palaeoplatform. The spatial distribution and elevations of the marine terraces are consistent with [33]. The two higher and older terraces are deeply dissected down to a few tens of meters by fluvial incision. The terraces are mainly cut into Pliocene conglomerates, sandstones and limestones, which at some locations are unconformably overlain (most clearly in terrace VI and V) by well-cemented sediments, forming a prominent caprock. The terraces do not appear to be laterally continuous along the coastal zone of the southern part of the island. This can probably be attributed to the erodible lithology at several locations. Their spatial distribution is presented in Figure 4 and a detailed description of the terraces is given below.
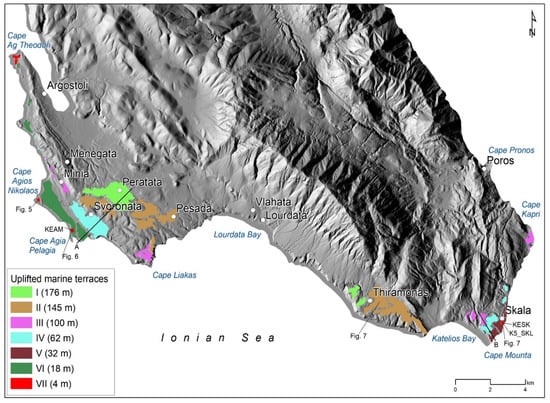
Figure 4.
Spatial distribution of the prominent uplifted marine terraces which have evolved mainly on Plio–Pleistocene formations. Their lateral continuity is disturbed by the fluvial action of many ephemeral streams.
Terrace VII: This is the lowest and youngest terrace of the area. It is a clearly defined emerged platform, at the base of a cliff, observed at Cape Ag. Theodoroi and at Cape Agios Nikolaos (Figure 5). The surface of the terrace is almost flat and extensive. Its inner edge is found at an elevation of about 4 m asl and it is indicative of recent coastal uplift. The terrace is cut into Pliocene formations. A prominent exposure of terrace VII was located at Cape Agios Nikolaos, at an elevation of 4 m (Figure 5).
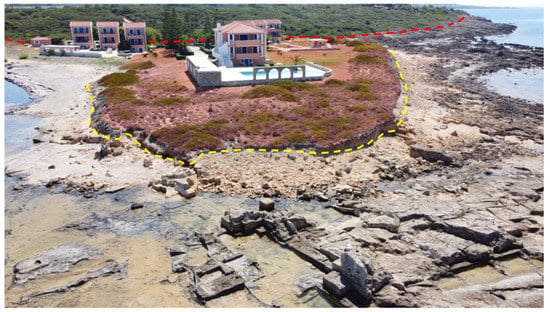
Figure 5.
Drone image of the marine terrace VII located at cape Agios Nikolaos (view towards east-northeast). The red dashed line corresponds to the inner edge of the terrace at 4 m while the yellow dashed line corresponds to the base of the modern sea cliff. The elevated palaeosurface is highlighted with transparent red color.
Terrace VI: This is one of the most prominent terraces and extends for 4 km in a northwest–southeast direction (Figure 6). It has been observed at the northwest part of the study area between Cape Agioi Theodoroi and Cape Agia Pelagia. Its inner edge is found at 18 m asl and shows no apparent change toward the southeast. The palaeosurface is dipping 1% to the southwest. A distinct seaside exposure of terrace VI was located at 38°06′21.7″ N 20°30′41.6″ E, at an elevation of +8 m. The exposure comprised of a 2-m-thick section of well-cemented sandstone (caprock), which was unconformably overlying a lower unit (~6 m thick) of yellow-white marls. Bed thickness in this lower (Pliocene) unit was 0.2–0.3 m, dipping at 23° east-northeast. The upper, caprock unit (which corresponds to palaeobeach deposits) consisted of well-cemented coarse carbonate sand and subrounded pebbles of limestone composition. Disperse pebbles were found ranging in diameter from 1 to 3 cm, while large (3 cm) isolated intact bivalves and bivalve fragments were also locally present. A less clear and extensive exposure of 1.8 m, of the consolidated caprock was located at 38°09′41.6″ N 20°28′49.0″ E, showing 0.40 m of well-consolidated sandstone overlying 1.40 m of bedded, well-cemented medium–coarse sand.
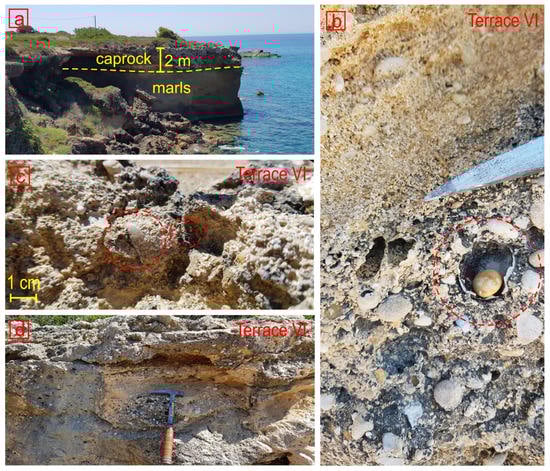
Figure 6.
(a) Drone image of terrace VI exposure at 38°06′21.7″ N 20°30′41.6″ E (view southeast). Yellow dotted line represents the unconformable contact between the caprock and the underlying marls of Pliocene age. (b,c) Close-up of caprock formation consisting of a well-cemented coarse sand and subrounded pebbles of limestone composition. Dotted circles represent isolated bivalves and bivalve fragments (d) Close-up of a less complete and extensive sequence of the well-cemented caprock (same stratigraphy) on adjacent private land at 38°09′41.6″ N 20°28′49.0″ E.
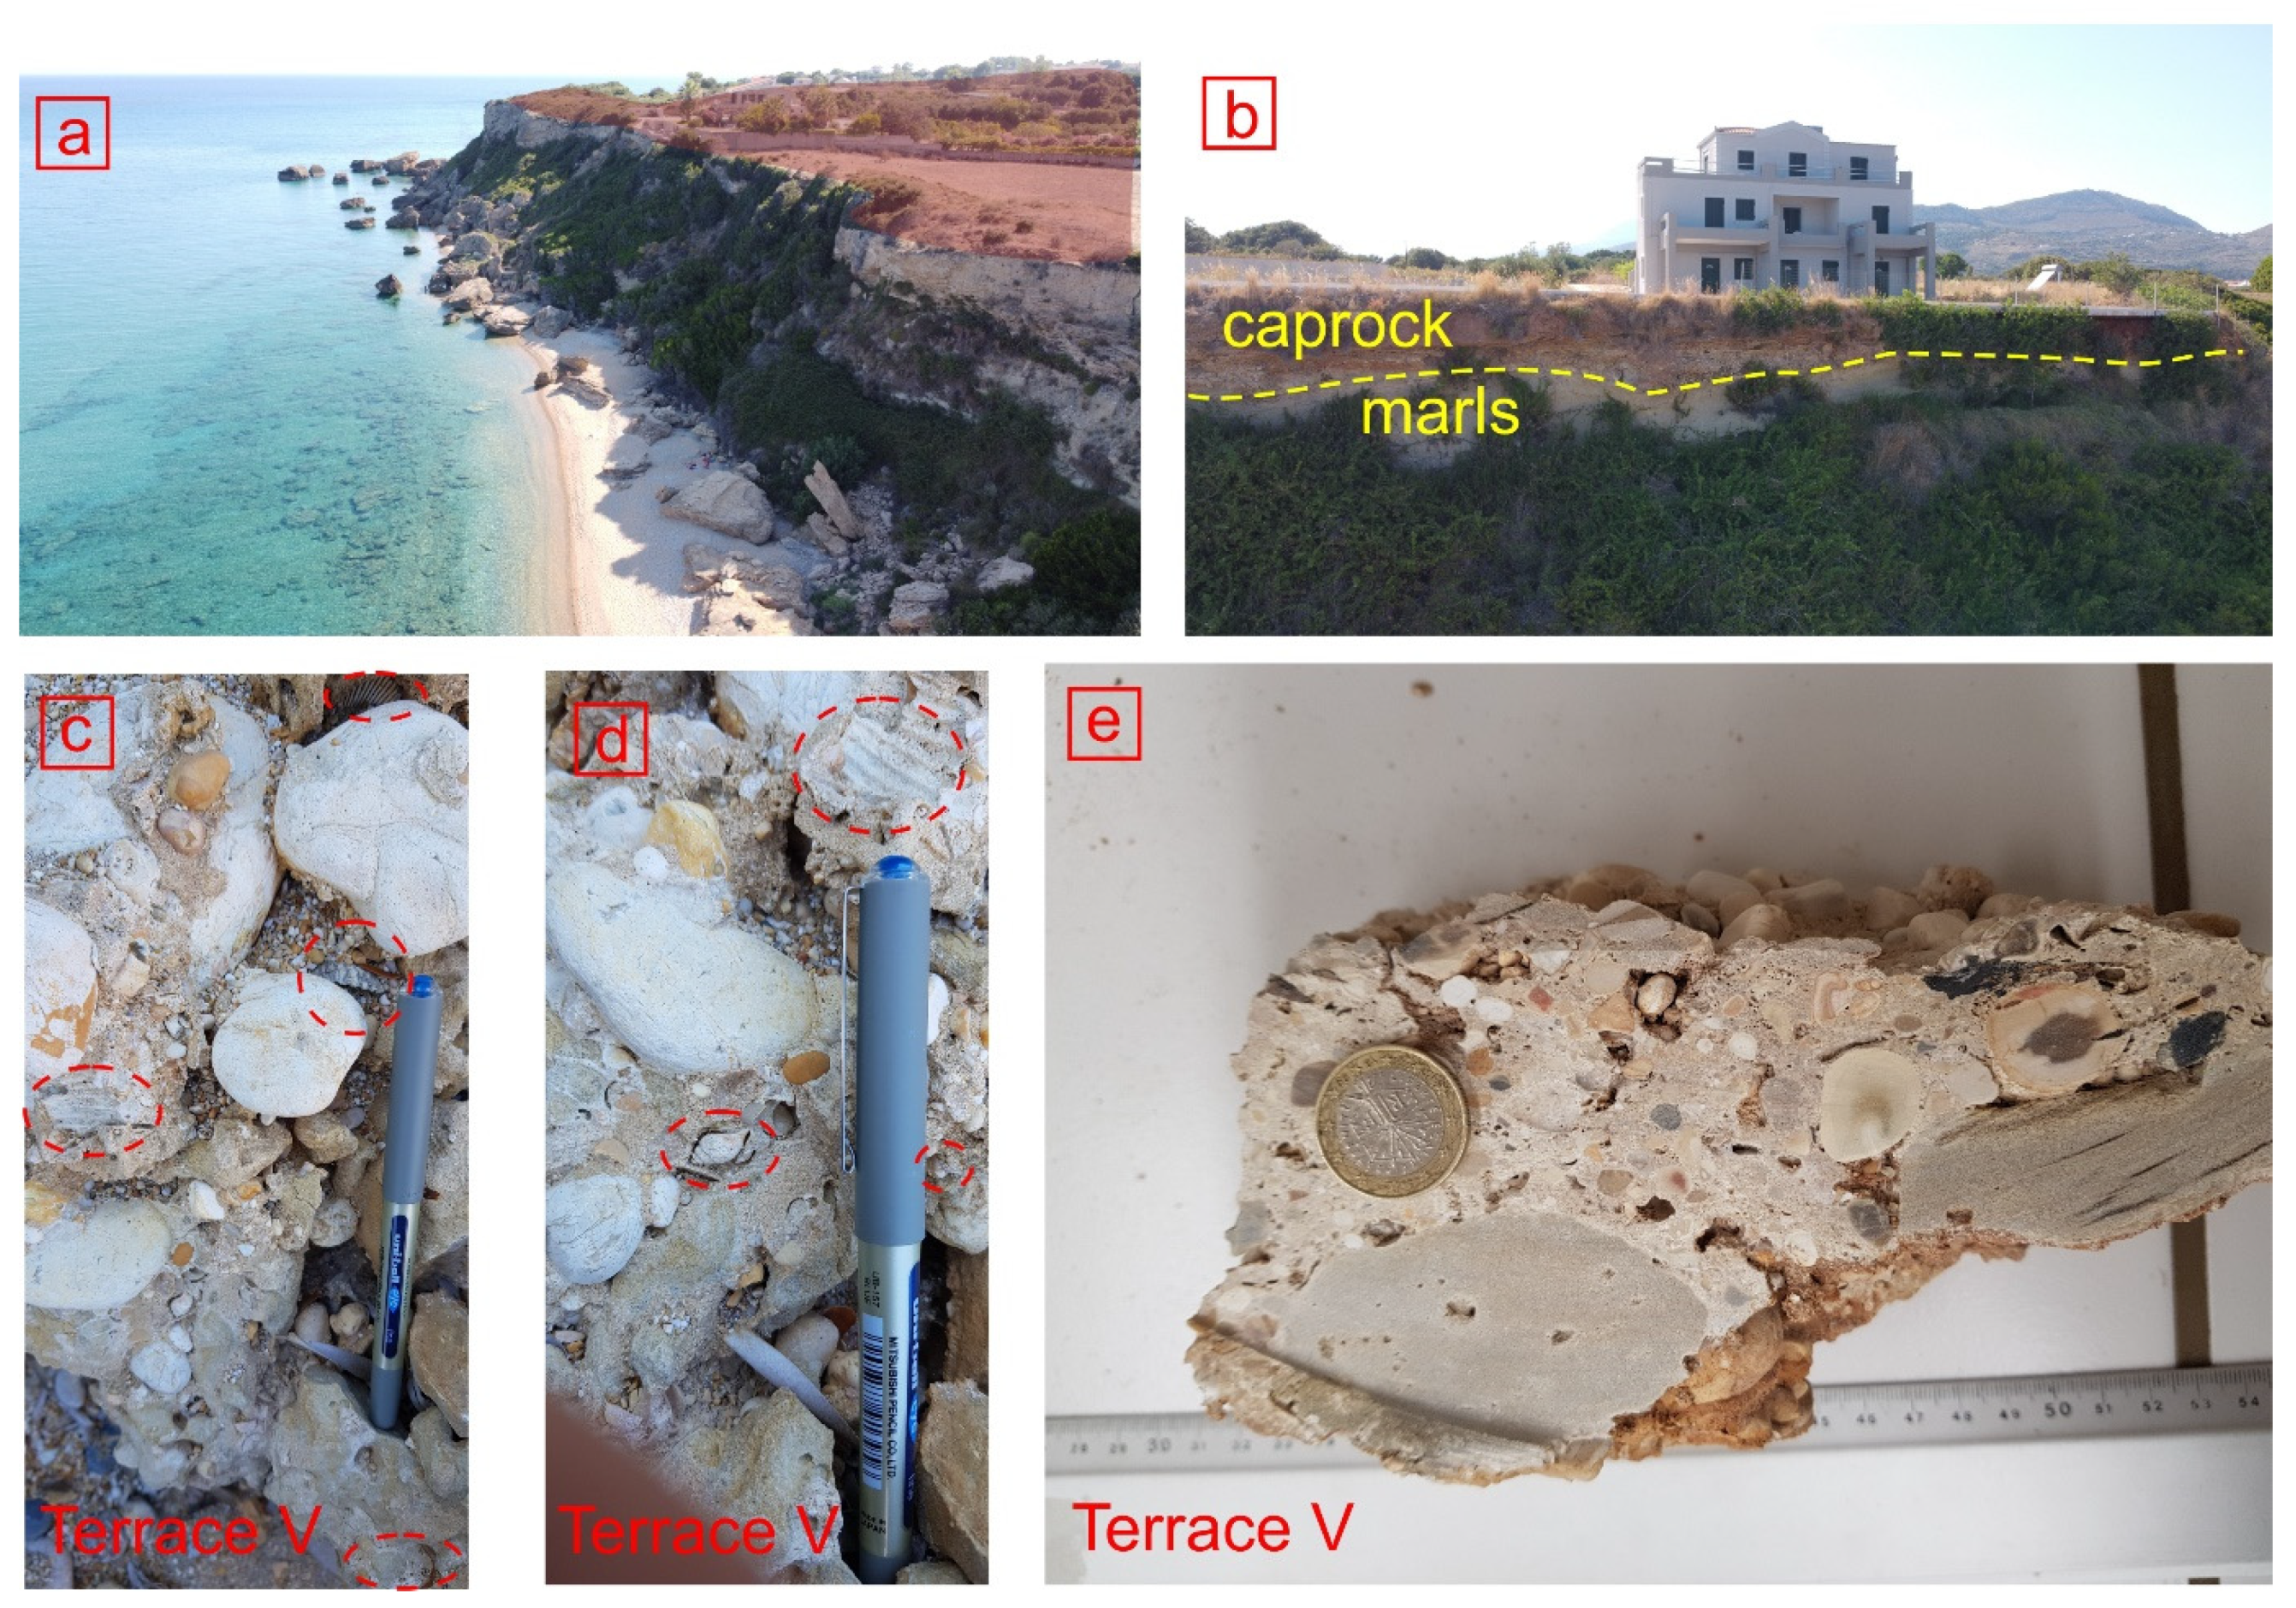
Terrace V: This terrace has been observed at the southeast part of the study area (Figure 7). It extends for 3.5 km in a southwest–northeast direction along the coastline. Its inner edge has been measured at 32 m asl. The palaeosurface is tilted to the southeast, with a dip of 1.3%. A prominent exposure 300 m away from Skala village, at 38°04′05.7″ N 20°47′52.2″ E, showed ca. 2–3.5 m of well-cemented, conglomerate in a coarse quartz sand matrix (caprock), unconformably overlying yellow-white marls of Pliocene age. The upper unit (caprock) corresponds to palaeobeach sediments that were deposited during the time period when terrace V was located at sea level and was still active. While the exposure was relatively obscured, the difference in dip angle was laterally extensive and the unconformable relationship between the two units was clear, indicating that the lower unit was exposed to erosion before the deposition of the upper unit. The stratigraphy of the lower unit is similar as the lower unit of terrace VI exposure. The conglomeratic unit in the upper part of the exposure is very well cemented and the bedding is horizontal. It contains frequent well-rounded limestone pebbles of 1.5–6 cm in diameter. Occasional intact bivalves (3 cm in diameter), bivalve fragments and intact gastropods (1 cm in diameter) were also present. A sample from the upper part of the unit was collected for Optically Stimulated Luminescence dating to provide age constraints for the timing of the formation of the terrace V.

Figure 7.
(a) Terrace V exposure (view SSW). The red transparent polygon represents the palaeosurface. The outer edge of the palaeosurface corresponds to the modern sea cliff. (b) Same location exposure of terrace V (view W), carved on Pliocene marls, unconformably underlying a caprock formation (contact represented with a yellow dashed line). (c–e) Close-up of the caprock formation consisting of well-cemented coarse sand, grit with well-rounded pebbles of limestone composition (1.5–6 cm in diameter). Red dashed circles represent frequent bivalves, bivalve fragments and gastropods.
Terrace IV: This terrace was observed at two locations. At the western part of the study area, it was observed at 38°07′06.4″ N 20°31′21.3″ E, at Svoronata village, carved on Pliocene formations. It extends for 2 km in a northwest–southeast direction along the coastline, has a width of 1 km and exhibits a well-defined palaeosurface that tilts to the southwest at a dip of 1.8%. Its inner edge was found at 62 m asl. At the southeast part of the island, it is recognized in a non-continuous way along a coastal segment of 6.5 km between Cape Mounta and Cape Kapri where it is carved on limestones and Pleistocene marls. Its inner edge was found at the same elevation as at the western part of the study area (62 m asl). The terrace exhibits a well-defined palaeosurface near Cape Mountra while smaller outcrops were observed toward the northeast (Cape Kapri). No caprock formation has been observed for this terrace at any location.
Terrace III: This terrace has also developed at the western and southeastern parts of the study area. At the western part, small outcrops have been observed near Minia village, while a more prominent palaeosurface has developed at Cape Liakas. The inner edge was found at 100 m asl. The terrace is cut into Pliocene formations and exhibits a clear dip of 2% to the southwest. At the southeast part of the area the same terrace has clearly developed near Cape Mounta on Pliocene formations, while a less prominent exposure was found at Cape Kapri that was cut into limestones. The inner age was found at 100 m asl and the palaeosurfaces exhibit a clear dip of 1.8% to the southeast.
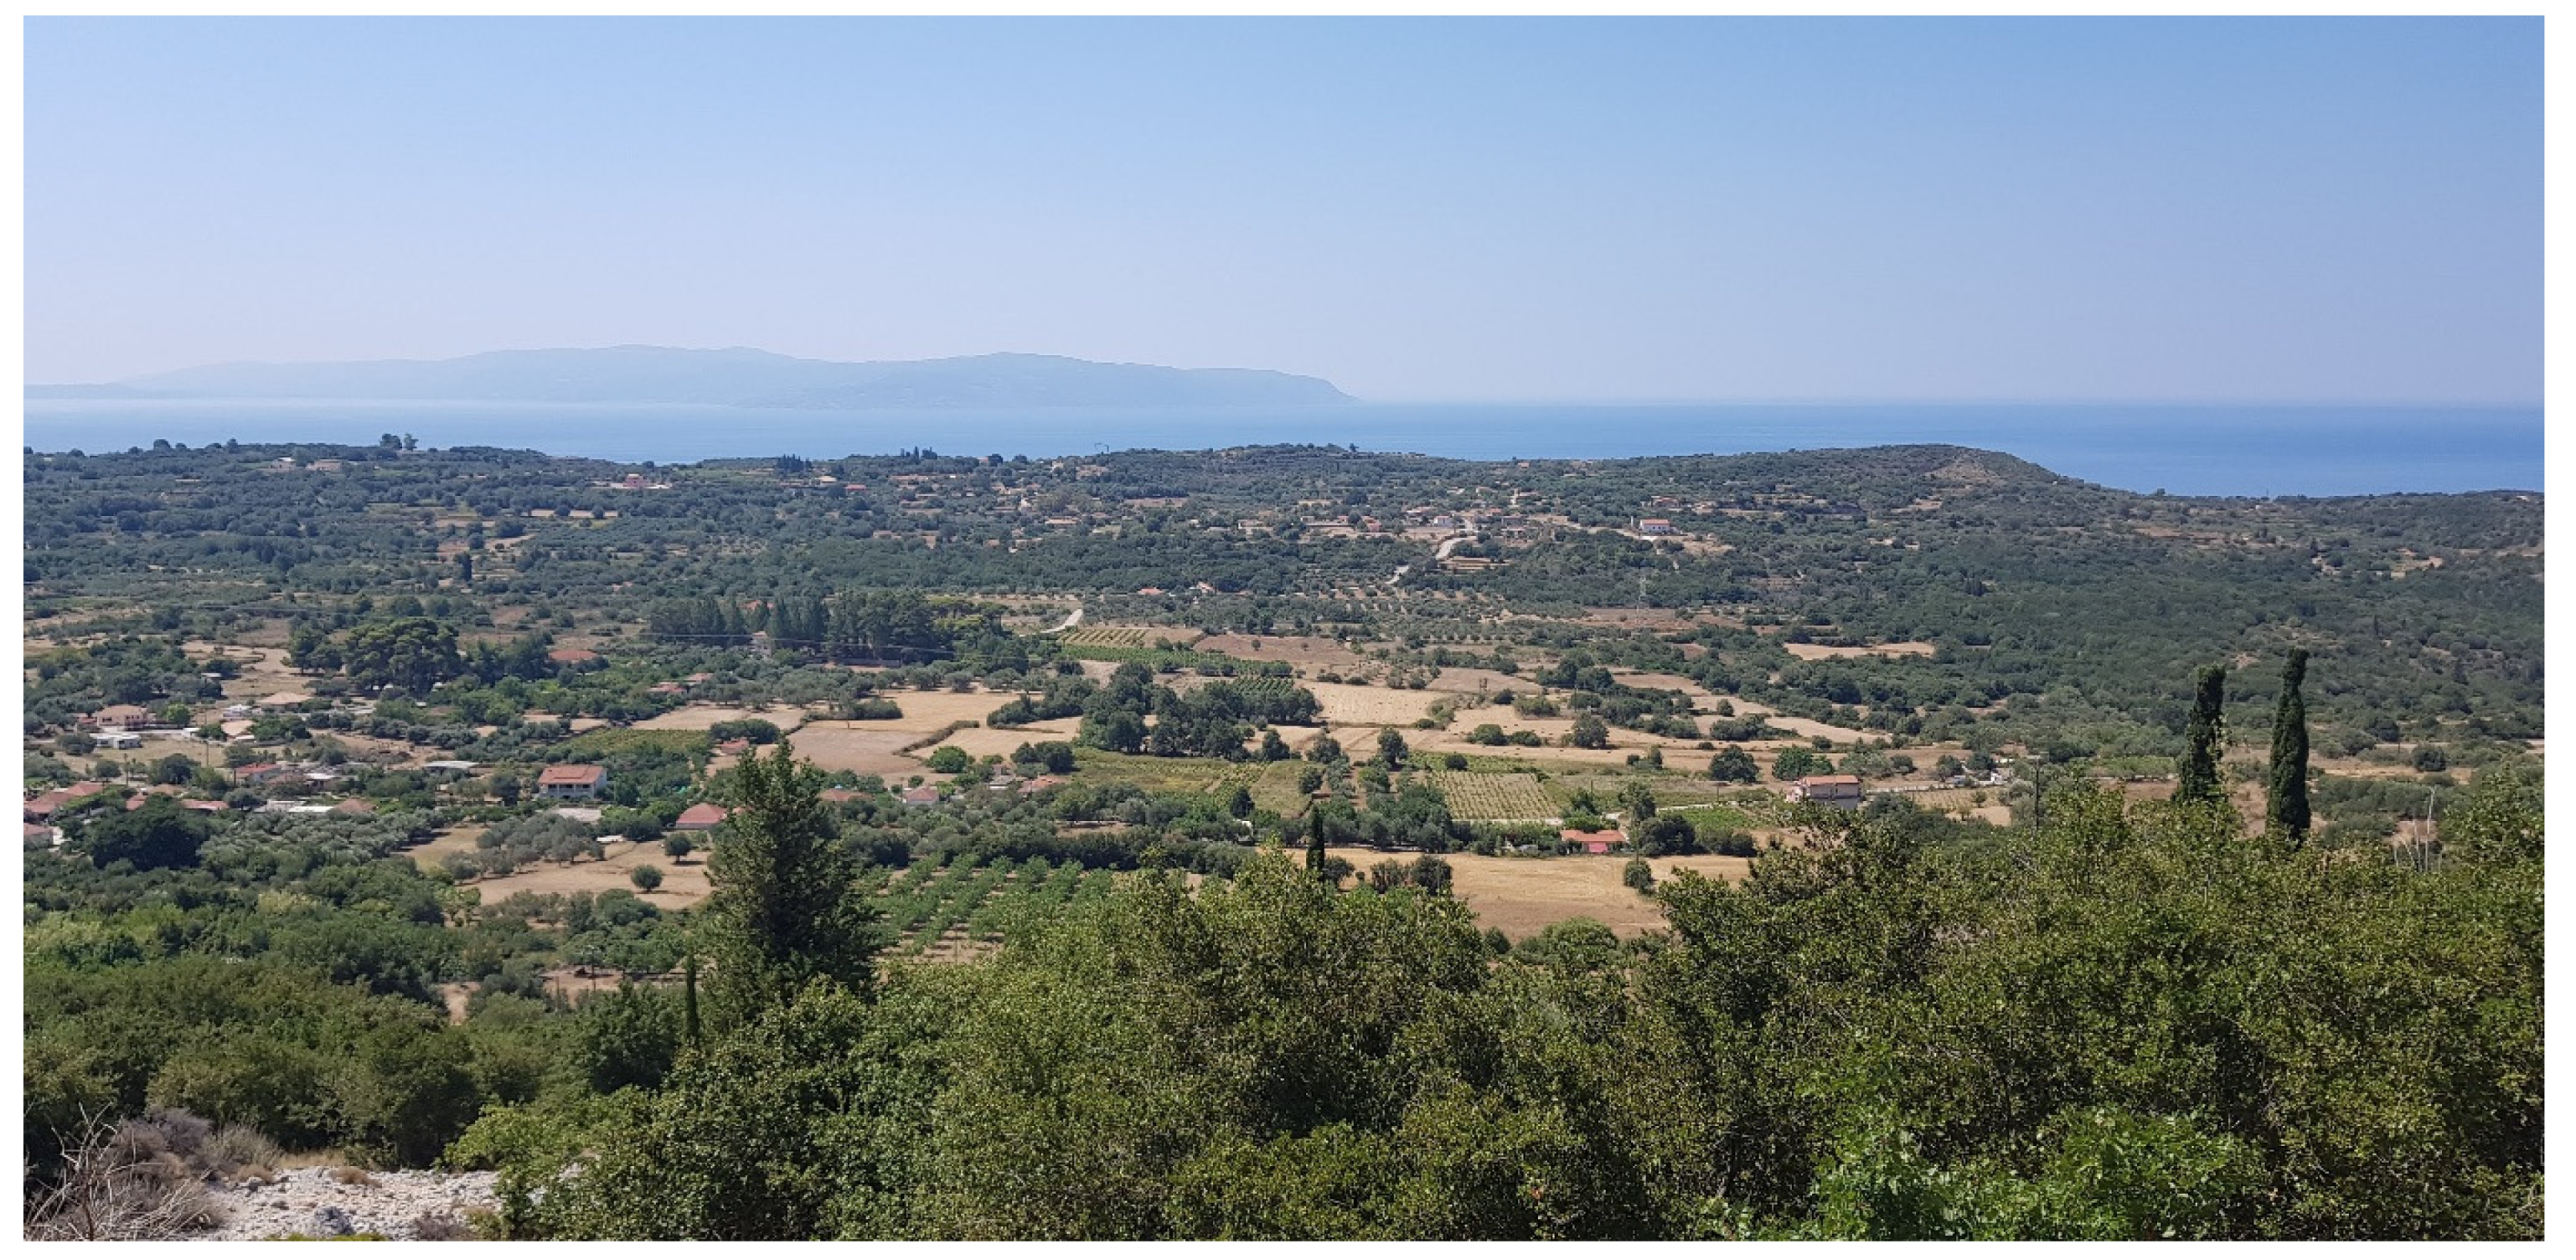
Terrace II: This terrace is the most prominent of the study area. It has been observed near Thiramonas village (Figure 8) where it extends for 5 km in a northwest–southeast direction while smaller but clearly defined palaeosurfaces of the same terrace have been observed between the villages Menegata and Pesada, at the central–western part of the region. The inner edge was found at 145 m asl, and the palaeosurfaces exhibit a clear dip of 2% to the southwest. The terrace has developed on Plio–Pleistocene formations and limestones at both locations. No apparent caprock was found for this terrace.
Figure 8.
Panoramic drone image of a prominent Terrace II palaeosurface at 145 m asl (view South) east of Thiramonas village.
Terrace I: This terrace is the highest and oldest one. It has been observed at Peratata village where it extends for 3 km in a west–east direction while smaller outcrops have been found west of Thiramons village. Its inner edge was found at 176 m asl, and the palaeosurfaces exhibit a clear dip of 2.2% to the southwest. The terrace has developed on limestones and Pliocene formations. No apparent caprock was found for this terrace either.
4.2. Microscope, Petrological and Microgeomorphological Analyses
Both caprock samples from Cefalonia Island marine terraces, namely from KEAM and KESK, are composed of sub-rounded intrasparites and biomicrites with sorted allochemicals as lithoclasts, bioclasts and fragments of mineral grains (mainly quartz, calcite), with high bioclast contribution. More precisely, the sample KEAM from terrace VI consisted of 80% bioclasts and algae fragments, 10% minerals and lithoclasts, and 10% pores. The cement is mainly characterized by well-developed sparitic calcite forming isotropic bladed isopachous coating around the sediment grains (Figure 9). On the other hand, the sample KESK from terrace V consisted mainly of lithoclasts and only a 10% of bioclasts and algae fragments as well as 15% pores. The caprock sediments are sub-rounded and well sorted lithoclasts, which consist of mainly quartz and calcite grains. The cement is a coherent microcrystalline calcite with additional well developed spiritic calcite crystals. The cement is forming an isopachous coating around the sediment grains and has a pore-filling attribute (Figure 10).
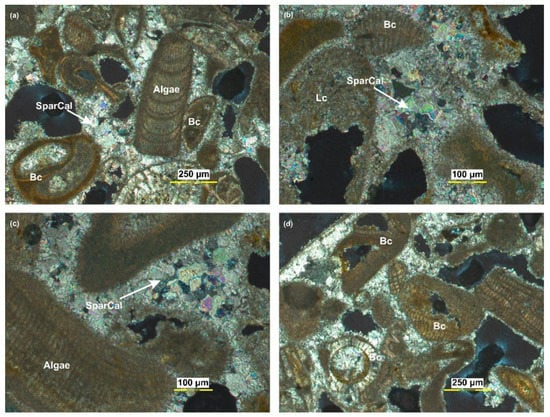
Figure 9.
Representative photomicrographs under crossed polars illustrating caprock composition of marine terrace VI. The photomicrographs are taken from polished thin sections of caprock sample KEAM SparCal: Sparitic Calcite cement, Lc: lithoclast, Bc: bioclast. Well-developed calcite crystals with light brown color are indicative of cement. (a,b) Thick cement consolidates bioclasts, lithoclasts and minerals, (c), Close look of the bonding between bioclasts and algae by spartic calcite, (d) high contribution of bioclast.
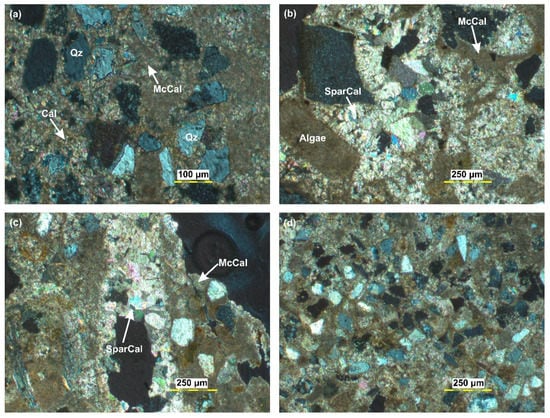
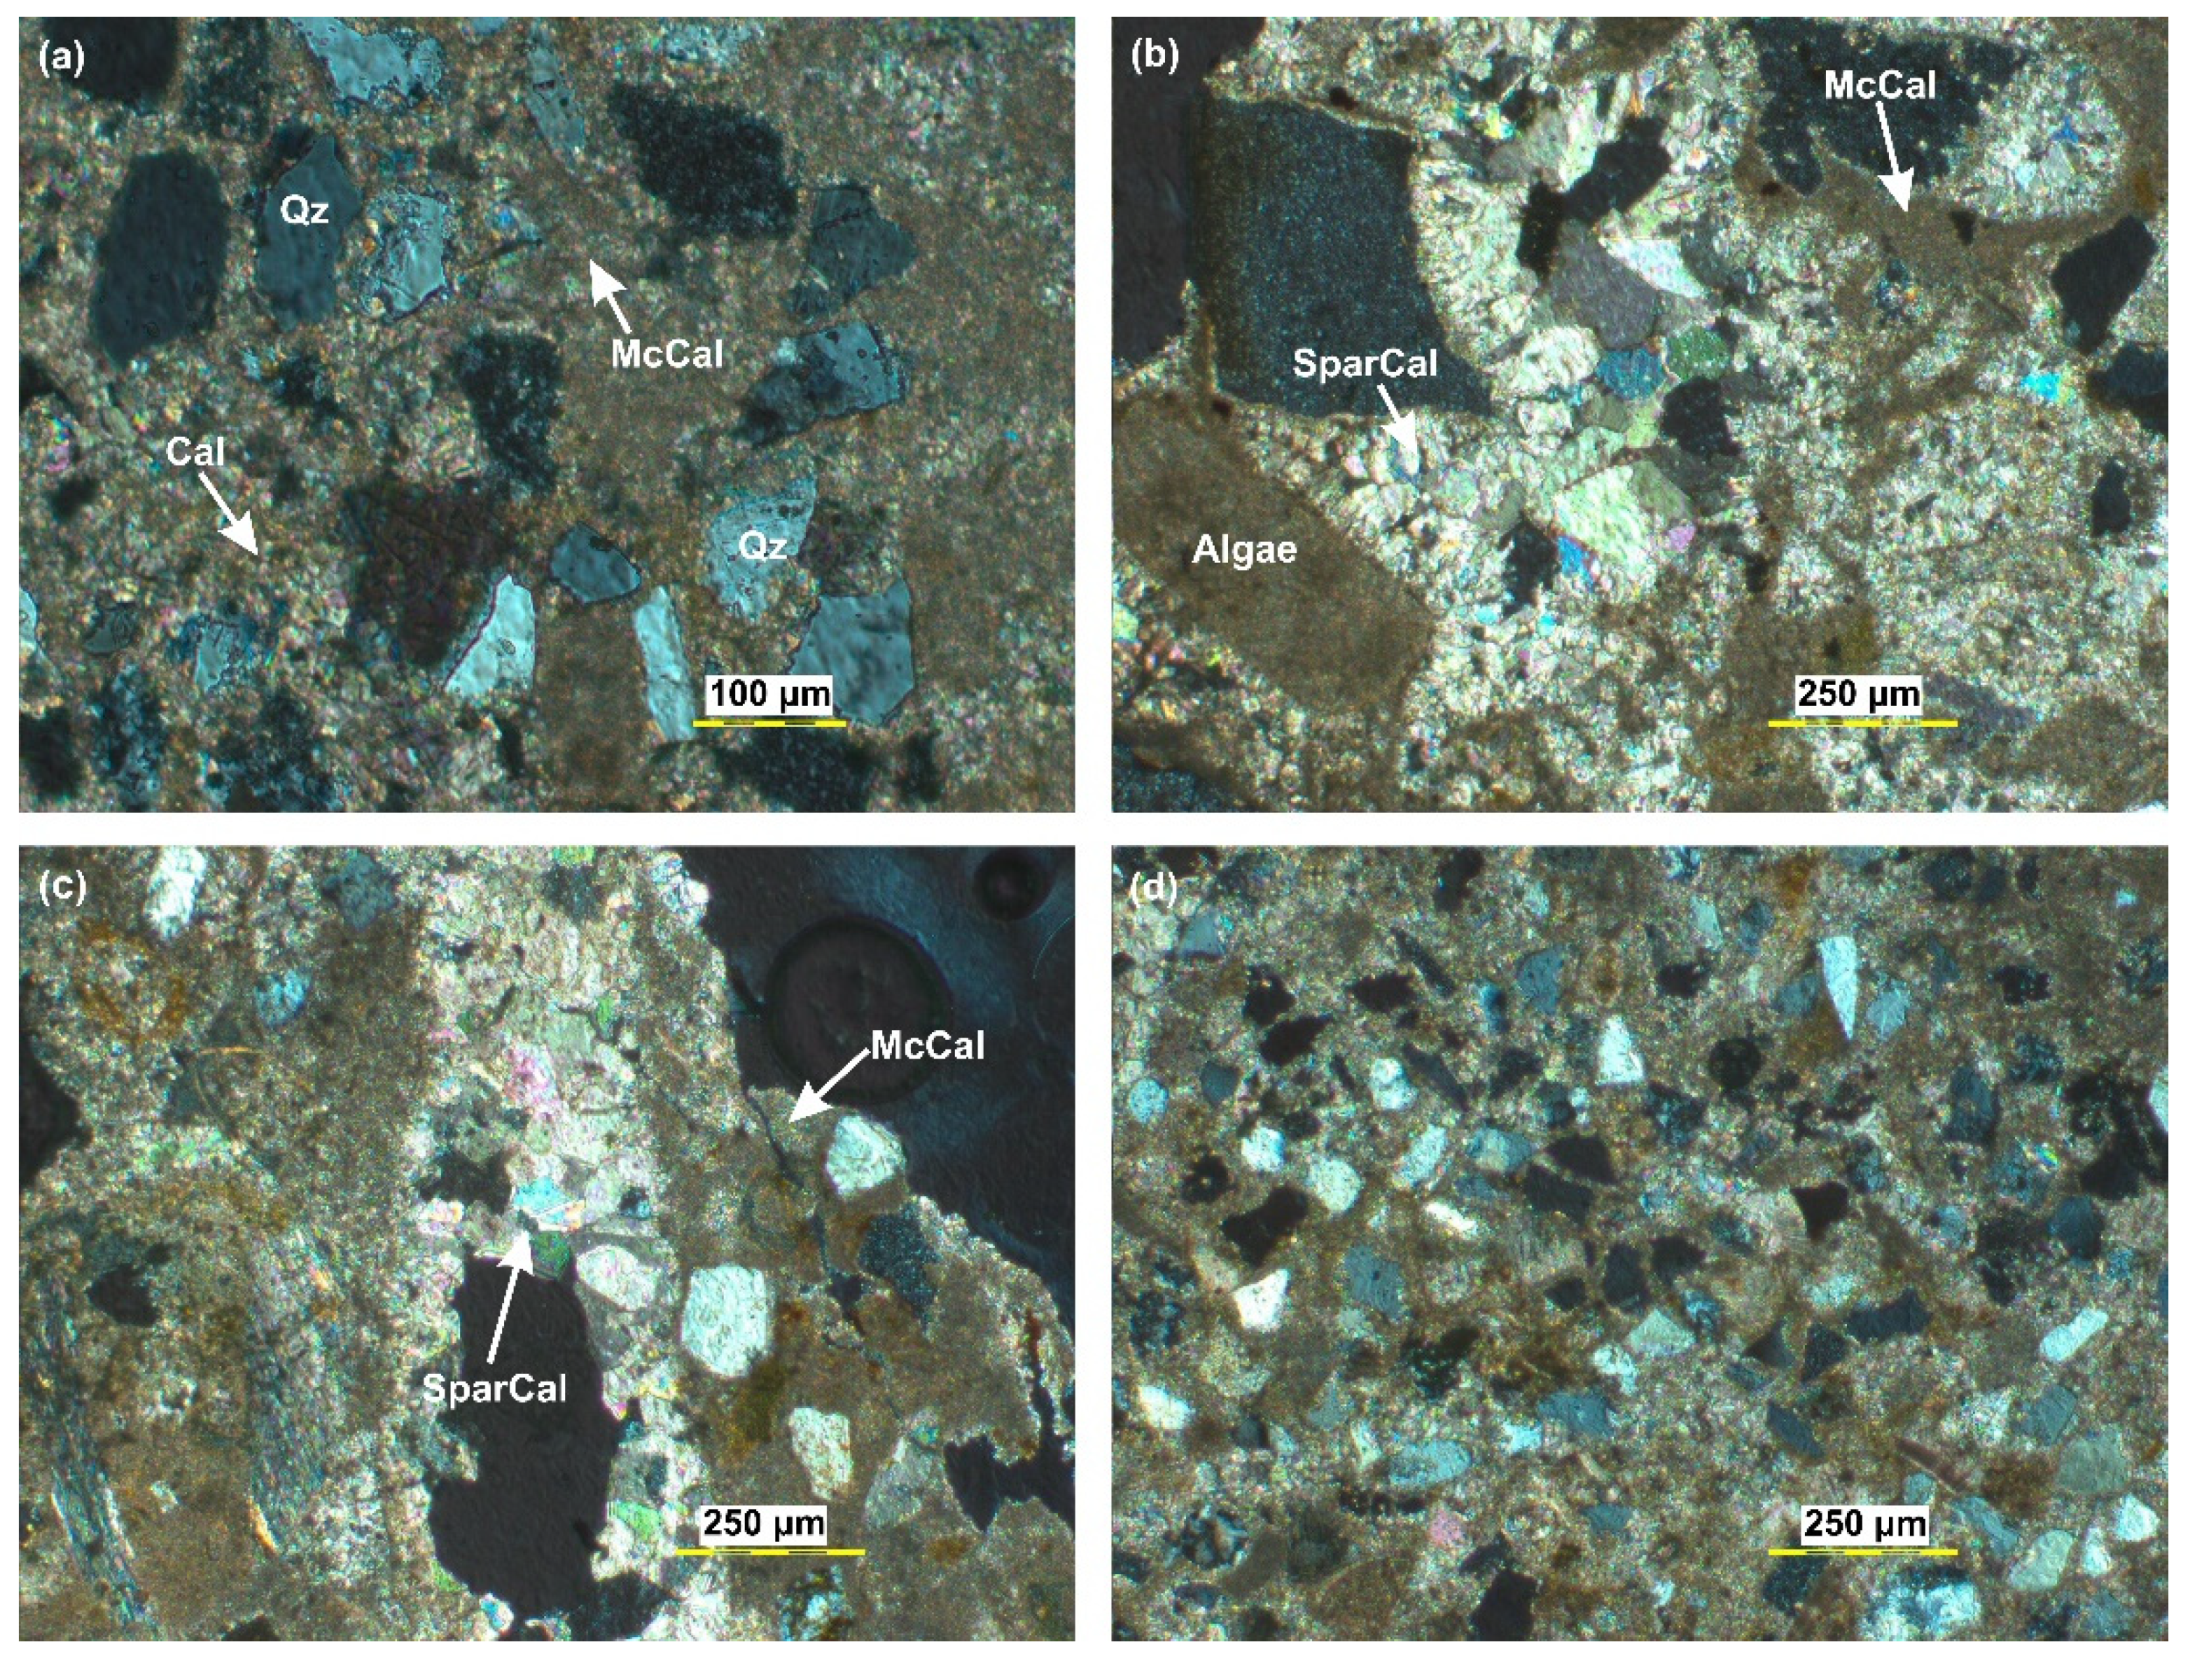
Figure 10.
Representative photomicrographs under crossed polars illustrating caprock composition of marine terrace V. The photomicrographs are taken from polished thin sections of caprock sample KESK SaprCal: Sparitic Calcite cement, McCal: Micritic Calcite, Cal: Calcite, Qz: quartz. Well-developed sparitic and micritic calcite crystals with light brown color are indicative of cement. (a), Micritic calcite consolidates lithoclasts and minerals, (b,c) well developed sparitic calcite crystals are observed, (d) general look of sample KESK bioclasts, lithoclasts and minerals, (c), Close look of the bonding between bioclasts and algae by spartic calcite, (d) high contribution of bioclast.
Results from the mineralogical analysis of the samples KEAM (terrace IV) and KESK reveal that the caprocks are characterized by sparry and microcrystalline intraclastic calcarenite, of mean shorting sediments and intrasparry and intramicrite texture. During the formation of caprocks the marine influence was high as the spiritic (KEAM caprock) and micritic crystals (KESK caprock) of calcite are marine environment indicators of high and weak energy environments, respectively [58,59]. Furthermore, the high contribution of bioclasts is also an indicator of coastal environment [58].
4.3. Optically Stimulated Luminescence (OSL) Dating—Uplift Rates
The OSL dating of the caprock sample (K5_SKL) collected from VI terrace near Skala village gave an age of 59.1 ± 0.3 ka (Table 1).

Table 1.
Results and details of OSL dating. Equivalent dose values were determined using the central age model (CAM) of Galbraith et al. [30]. Water content expressed as a percentage of the mass of dry sediment, calculated using field values. Beta, gamma, and cosmic dose rates were combined to calculate the total dose rates after Aitken [60]. Beta and gamma dose rates were calculated using the conversion factors of Liritzis et al. [61]. Beta dose rates have been corrected for the effect of the water content, grain size, and chemical etching. Gamma dose rates have been corrected for the effect of the water content. Cosmic dose rates were calculated according to [62,63]. Age, before 2016 AD.
As this sample was collected from a caprock exposure of terrace V, it can be used to estimate a minimum age of the caprock of 59.1 ± 0.3 ka (e.g., [64,65,66,67,68,69,70,71,72,73,74]). It is generally considered that the sediments covering the palaeosurfaces of the terraces, were deposited immediately after a sea-level highstand (e.g., [1,6]). In this way, taking into account a minimum age of 59.1 ± 0.3 ka for the caprock and the age of the nearest previous sea-level highstand of approximately 61 ka [15], we can assign the formation of the terrace V to the MIS 3e. In our uplift rate calculation, we considered the duration of the MIS 3e, which according to [75] lasted from 55.5 ka (Tmin) until 66.5 ka BP (Tmax). Considering the absolute elevation of the inner edge of the marine terrace V at +32 m asl and an additional minimum sea level (SLmιn) at −65 m [15], a total uplift of 97 m can be calculated, which divided by 55.5 ka (Tmin) gives a maximum uplift rate of 1.75 mm a−1. On the other hand, when taking into account the same elevation of the inner edge of the marine terrace VI at +32 m asl and an additional maximum sea level at −38 m (SLmax) [15], a minimum uplift rate of 1.05 mm a−1 can be estimated averaging 1.4 ± 0.35 mm a−1 of uplift for the last 61 ± 5.5 ka BP.
5. Discussion
The age of marine terrace V revealed a considerable average uplift rate of 1.4 ± 0.35 mm a−1 for the southern part of Cephalonia Island, which can be attributed to the close proximity of the island to the active margin of the Hellenic subduction zone (~35 km) [56]. This uplift rate is generally close to the GPS measurements by [39], according to which uplift of 2–4 mm a−1 has been documented at the southern part of the main Cephalonia Island during the time period 2003–2010. Similar values of uplifts rates (1–2 mm a−1) have been deduced by [70] for the western part of Crete, which also lies in close proximity to the Hellenic subduction zone (~30 km) even though it is argued that this estimate is not representative on time scales of several hundred thousand years. Uplift rates of 1–1.5 mm a−1 since 40 ka to 75 ka BP have been documented by [32], based on radiocarbon dating of marine terraces of North Evoikos Gulf. However, it is concluded that the development of the terraces and other geomorphic indicators of uplift in North Evoikos Gulf may be attributed at least partly to non-extensional faulting mechanisms, such as Quaternary (intrusive and/or extrusive) volcanic activity associated with evolution of nearby volcanic centers.
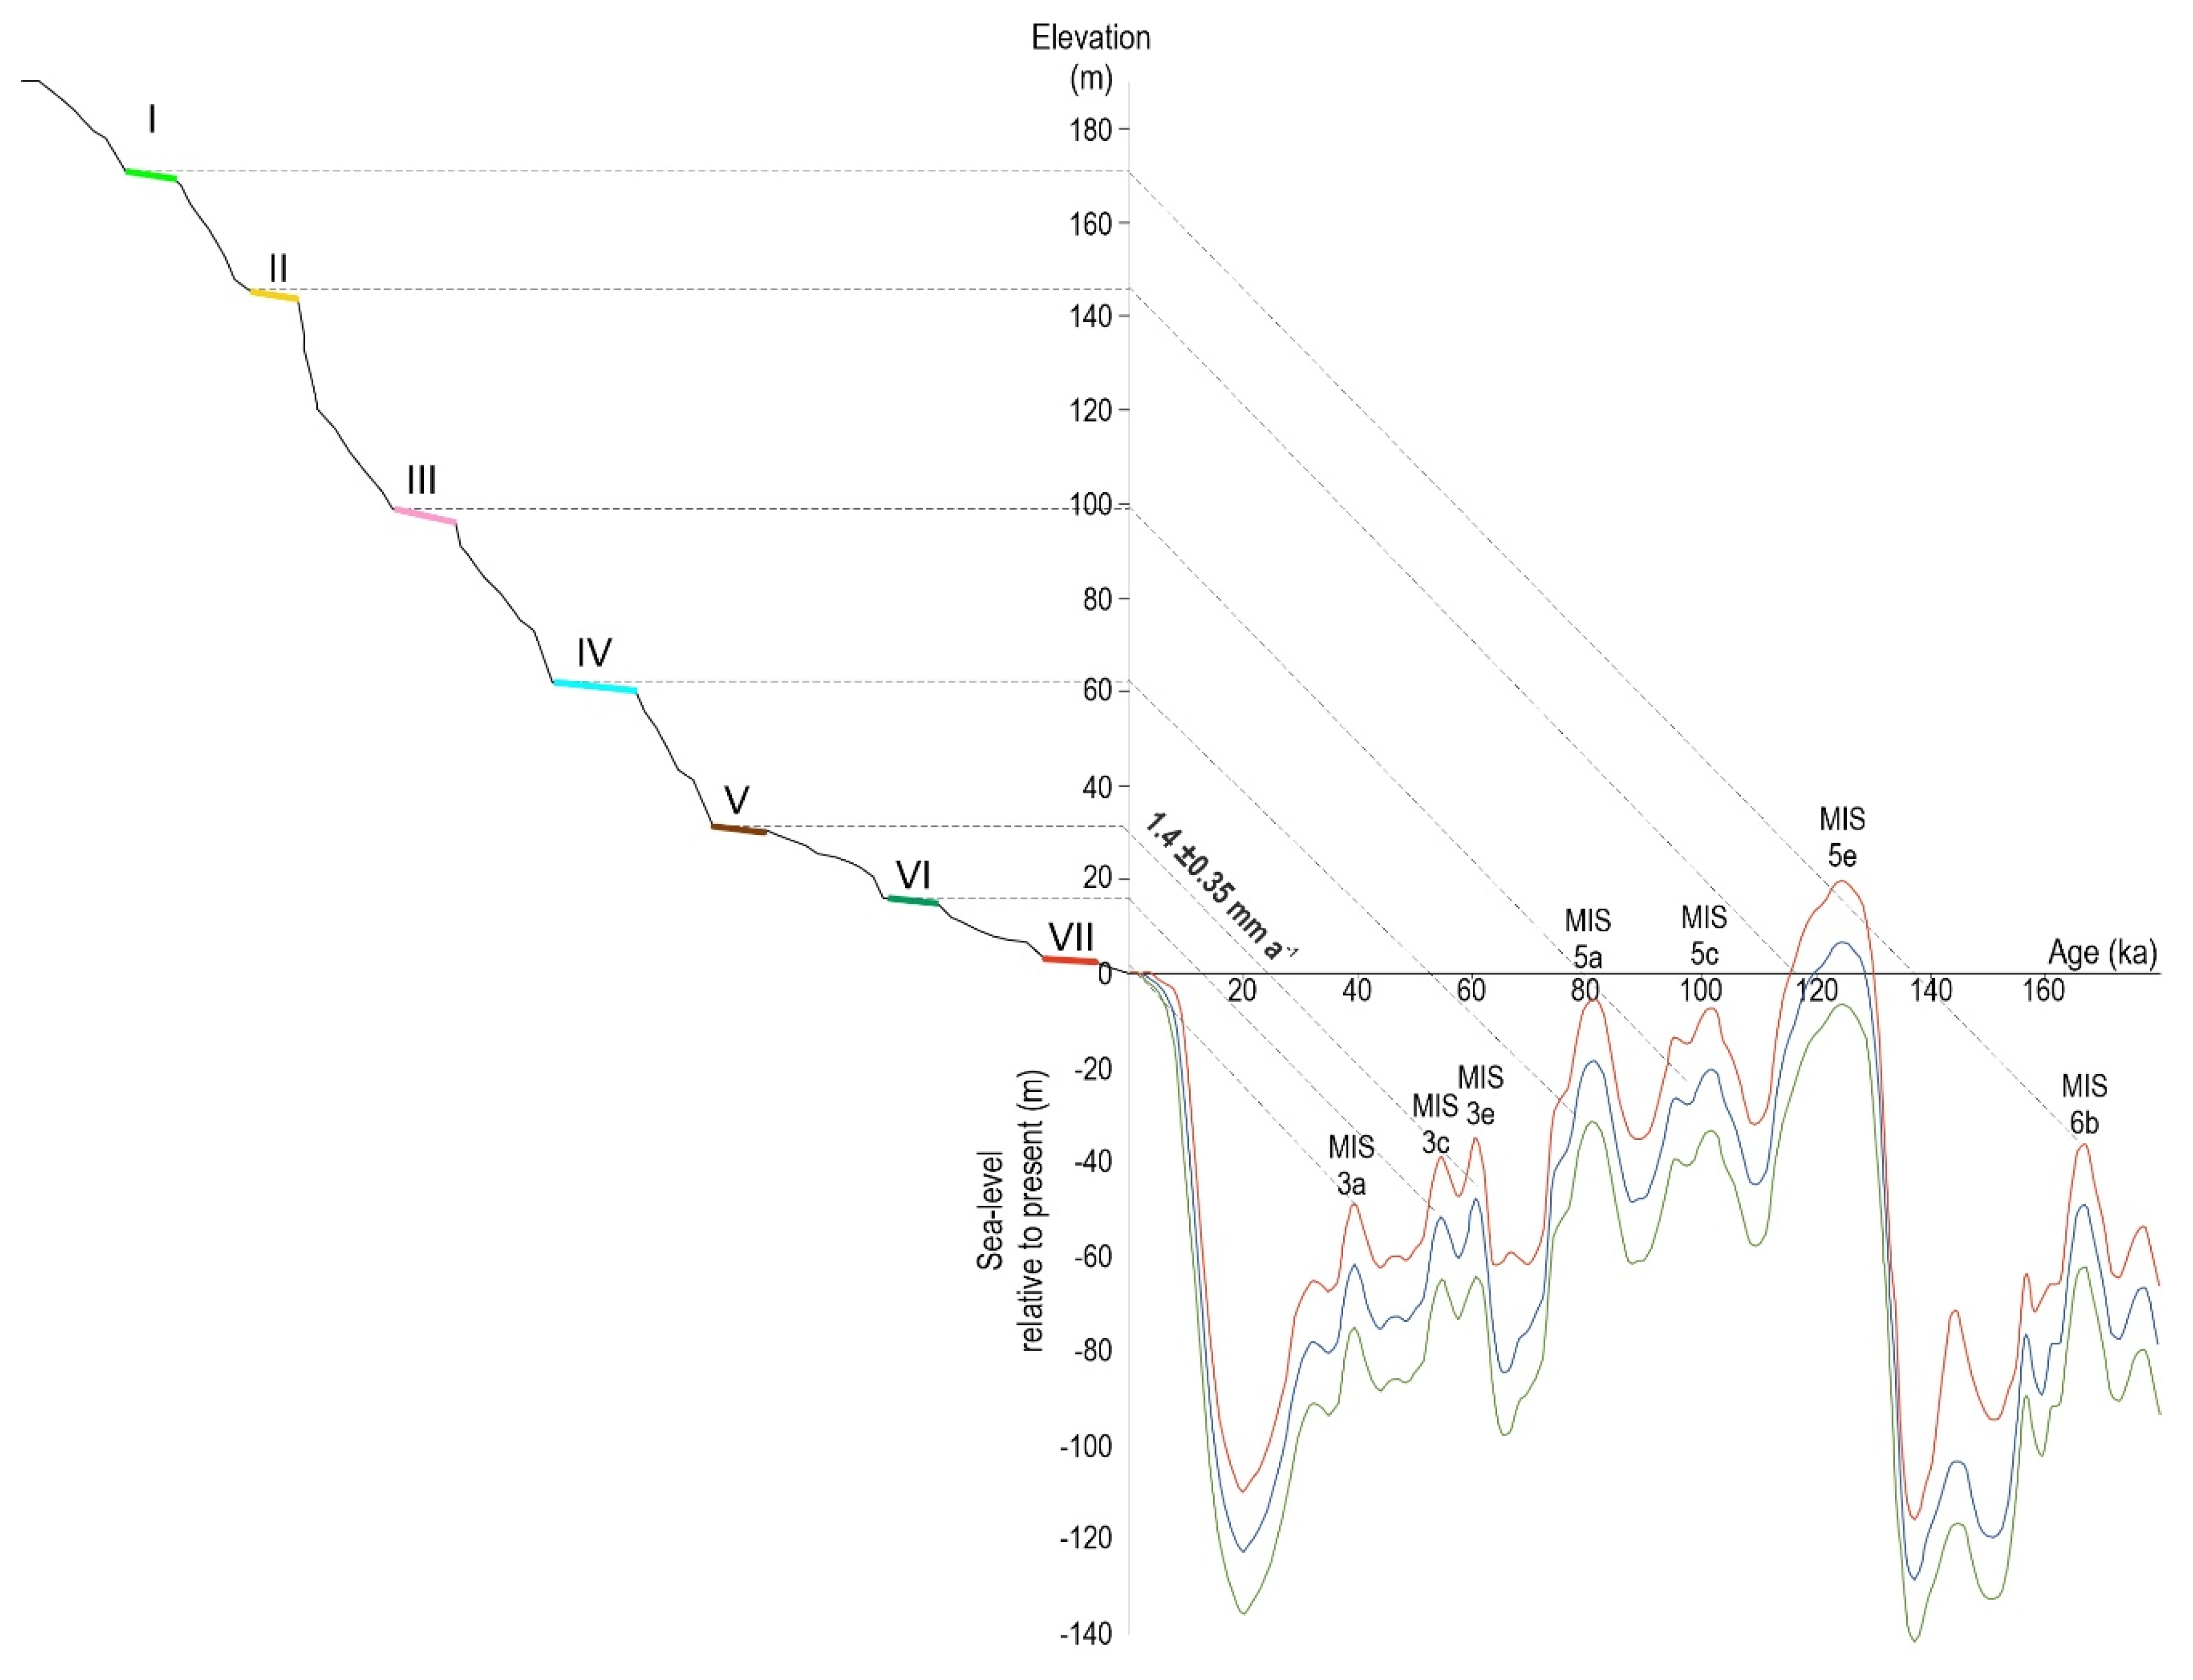
Comparing our OSL dating to the sea-level variations on the eustatic curve of [15], it is suggested that the +32 m terrace age of 61 ± 5.5 ka corresponds to the marine isotopic substage (MIS) 3e. Given that the sequence of uplifted marine terraces observed in the landscape is considered to be the geomorphic record of Quaternary sea-level highstands [2], and assuming that the estimated uplift rate is uniform over the past tens of thousands of years, we can corelate each terrace to a Marine Isotope Stage (Figure 11).
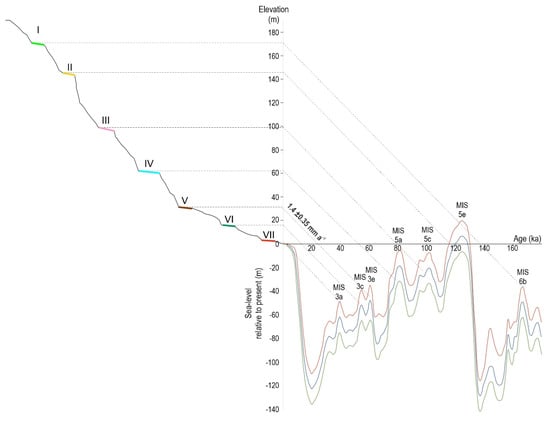
Figure 11.
Potential correlation of the marine terraces on the southern part of the main Cephalonia Island with highstands (MIS) of the sea-level curve derived by [15]. The red, blue and green lines correspond to a maximum, mean and minimum sea level, respectively.
According to the estimated uplift rate, terrace VII is assigned to MIS 3a and taking into consideration the uplift rate and the elevation range of the sea level of the MIS 3a, an expected elevation of 7.8 ± 6.2 m can be calculated that generally fits with its actual elevation (4 m asl). The expected elevation of the terrace VI (MIS 3c) was calculated at 19.4 ± 1.6 m, which also fits well with its actual elevation (18 m asl). Terrace IV can be assigned to MIS 5a and the expected elevation for this terrace was calculated at 67.6 ± 9 m. Its actual elevation is 62 m, which falls into the error range of the expected elevation and therefore is considered to fit well with it. Terrace III is assigned to MIS 5c. Following the same procedure, and taking into account the parameters for MIS 5c, an expected elevation of 109.2 ± 11.9 m is calculated. The actual elevation of terrace III is 100 m which correlates well with the expected elevation. Terrace III is assigned to MIS 5c. Following the same procedure and taking into account the parameters for MIS 5c, an expected elevation of 106.4 ± 11.4 m is calculated. The actual elevation of terrace III is 100 m which correlates well with the expected elevation. As far as terrace II is concerned, it can be assigned to MIS 5e. Considering the elevation range for MIS 5e and the same uplift rate, terrace II is expected to be found at an elevation of 154.9 ± 17 m which also fits well with its actual elevation (145 m asl). Finally, terrace I can be assigned to MIS 6b. Taking into consideration the elevation range of the sea level at MIS 6b, and the estimated uplift rate, an expected elevation of 171 ± 12.5 m can be calculated which generally fits well with the actual elevation of the inner edge of terrace I (176 m asl) (Figure 4 and Figure 12). It should be noted that minor deviations between the expected elevations of the marine terraces and their actual elevations could be attributed to a series of errors regarding the production of the sea-level curve by [15], as well as the vertical accuracy of the shoreline angle’s elevation, as in many cases it could be covered by a colluvial wedge. Our future work includes more dating and more precise measurements of the shoreline angle’s altitude, taking into account the surficial erosion of the palaeosurfaces [65,66] and/or the colluvium that possibly covers the shoreline angle of the terraces [67,68], as well as detailed mapping and dating of the marine terraces at Paliki peninsula (western part of Cephalonia Island) in order to provide a link of the uplifted marine terraces with the regional tectonics.
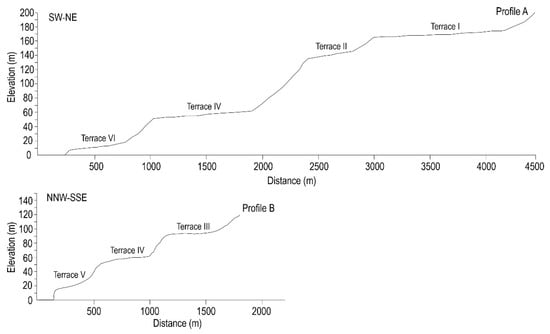
Figure 12.
Topographic profiles A and B constructed at Capes Agia Pelagia and Mounta, respectively. For locations of the profiles, see map in Figure 4.
6. Conclusions
The identification and mapping of a sequence of seven uplifted marine terraces at the southern part of main Cephalonia Island suggests a sustained uplift of the area for at least the last 165 ka. This uplift is primarily owed to the proximity of the study area to the active subduction zone, southwest of the Cephalonia Island. The mineralogical analysis of two caprock samples indicated high marine influence during the deposition of the sediments that cover the palaeosurfaces of the terraces. OSL dating performed on a caprock sample retrieved from terrace V revealed a minimum age of 59.1 ± 0.3 ka; therefore, the formation of this terrace was assigned to the Marine Isotope Stage 3e. An average uplift rate of 1.4 ± 0.35 mm a−1 was estimated for the southern part of Cephalonia Island for the last 61 ± 5.5 ka. Correlation of the uplifted marine terraces to the Quaternary sea-levels suggests that their formation is associated with sea-level highstands.
Author Contributions
Conceptualization, E.K.; methodology, K.T., E.K. and G.S.; writing—original draft preparation, K.T.; writing—review and editing, K.T., N.E., E.K. and A.K.; visualization, K.T.; supervision, N.E. All authors have read and agreed to the published version of the manuscript.
Funding
The present work was co-funded by the European Union and Greek national funds through the Operational Program “Human Resources Development, Education and Lifelong Learning” (NSRF 2014–2020), under the call “Supporting Researchers with an Emphasis on Young Researchers—Cycle B” (MIS: 5047955).
Institutional Review Board Statement
Not applicable
Informed Consent Statement
Not applicable
Conflicts of Interest
The authors declare no conflict of interest.
References
- Bradley, W.C. Origin of marine-terrace deposits in the Santa Cruz area, California. Geol. Soc. Am. Bull. 1957, 68, 421–444. [Google Scholar] [CrossRef]
- Lajoie, K.R. Coastal tectonics. Act. Tect. 1986, 95–124. [Google Scholar]
- Muhs, D.R.; Kelsey, H.M.; Miller, G.H.; Kennedy, G.L.; Whelan, J.F.; McInelly, G.W. Age estimates and uplift rates for Late Pleistocene marine terraces: Southern Oregon portion of the Cascadia Forearc. J. Geophys. Res. 1990, 95, 6685–6698. [Google Scholar] [CrossRef] [Green Version]
- Anderson, R.; Densmore, A.; Ellist, M. The generation and degradation of marine terraces. Basin Res. 1999, 11, 7–19. [Google Scholar] [CrossRef]
- Rosenbloom, N.A.; Anderson, R.S. Hillslope and channel evolution in a marine terraced landscape, Santa Cruz, California. J. Geophys. Res. Solid Earth 1994, 99, 14013–14029. [Google Scholar] [CrossRef]
- Dupre, W.R. Reconstruction of paleo-wave conditions during the late Pleistocene from marine terrace deposits, Monterey Bay, California. Mar. Geol. 1984, 60, 435–454. [Google Scholar] [CrossRef]
- Trenhaile, A.S. Modeling the development of marine terraces on tectonically mobile rock coasts. Mar. Geol. 2002, 185, 341–361. [Google Scholar] [CrossRef]
- Marquardt, C.; Lavenu, A.; Ortlieb, L.; Godoy, E.; Comte, D. Coastal neotectonics in Southern Central Andes: Uplift and deformation of marine terraces in Northern Chile (27 S). Tectonophysics 2004, 394, 193–219. [Google Scholar] [CrossRef]
- Saillard, M.; Hall, S.R.; Audin, L.; Farber, D.L.; Herail, G.; Martinod, J.; Regard, V.; Finkel, R.C.; Bondoux, F. Non-steady long-term uplift rates and Pleistocene marine terrace development along the Andean margin of Chile (31o S) inferred from 10Be dating. Earth Planet. Sci. Lett. 2009, 277, 50–63. [Google Scholar] [CrossRef]
- Limber, P.W.; Murray, A.B. Beach and sea-cliff dynamics as a driver of longterm rocky coastline evolution and stability. Geology 2011, 39, 1147–1150. [Google Scholar] [CrossRef] [Green Version]
- Muhs, D.R.; Rockwell, T.K.; Kennedy, G.L. Late Quaternary uplift rates of marine terraces on the Pacific coast of North America, southern Oregon to Baja California. Quat. Int. 1992, 15, 121–133. [Google Scholar] [CrossRef]
- Imbrie, J.; Hays, J.D.; Martinson, D.G.; McIntyre, A.; Mix, A.C.; Morley, J.J.; Pisias, N.G.; Prell, W.L.; Shackleton, N.J. The orbital theory of Pleistocene climate: Support from a revised chronology of the marine 18O record. In Milankovitch and Climate, Part 1; Berger, A., Ed.; D. Reidel Publishing Company: Dordrecht, The Netherlands, 1984; pp. 269–1305. [Google Scholar]
- Chappell, J.; Shackleton, N.J. Oxygen isotopes and sea level. Nature 1986, 324, 137–140. [Google Scholar] [CrossRef]
- Bassinot, F.C.; Labeyrie, L.D.; Vincent, E.; Quidelleur, X.; Shackleton, N.J.; Lancelot, Y. The astronomical theory of climate and the age of the Brunhes-Matuyama magnetic reversal. Earth Planet. Sci. Lett. 1994, 126, 91–108. [Google Scholar] [CrossRef]
- Waelbroeck, C.; Labeyrie, L.; Michel, E.; Duplessy, J.C.; McManus, J.F.; Lambeck, K.; Balbon, E.; Labracherie, M. Sea-level and deep water temperature changes derived from benthic foraminifera isotopic records. Quat. Sci. Rev. 2002, 21, 295–305. [Google Scholar] [CrossRef]
- Rohling, E.; Grant, K.; Bolshaw, M.; Roberts, A.; Siddall, M.; Hemleben, C.; Kucera, M. Antarctic temperature and global sea level closely coupled over the past five glacial cycles. Nat. Geosci. 2009, 2, 500–504. [Google Scholar] [CrossRef]
- Armijo, R.; Meyer, B.; King, G.C.P.; Rigo, A.; Papanastassiou, D. Quaternary evolution of the Corinth Rift and its implications for the Late Cenozoic evolution of the Aegean. Geophys. J. Int. 1996, 126, 11–53. [Google Scholar] [CrossRef] [Green Version]
- Tortorici, G.; Bianca, M.; de Guidi, G.; Monaco, C.; Tortorici, L. Fault activity and marine terracing in the Capo Vaticano area (s. Calabria) during the Middle-Late Quaternary. Quat. Int. 2003, 101, 269–278. [Google Scholar] [CrossRef]
- Upson, J.E. Former marine shorelines of the Gaviota Quadrangle, Santa Barbara County, California. J. Geol. 1951, 59, 415–446. [Google Scholar] [CrossRef]
- Bloom, A.L.; Broecker, W.S.; Chappell, J.; Matthews, R.K.; Mesolella, K.J. Quaternary sea level fluctuations on a tectonic coast; new 230Th/234U dates from the Huon Peninsula, New Guinea. Quat. Res. 1974, 4, 185–205. [Google Scholar] [CrossRef]
- Ota, Y. Late Quaternary vertical movement in Japan estimated from deformed shorelines. In Quaternary Studies; Suggate, R.P., Creswell, M.M., Eds.; Royal Society of New Zealand: Wellington, New Zealand, 1975; pp. 231–239. [Google Scholar]
- Muhs, D.R.; Szabo, B.J. Uranium-series age of the Eel Point terrace, San Clemente Island, California. Geology 1982, 10, 23–26. [Google Scholar] [CrossRef] [Green Version]
- Sarna-Wojcicki, A.M.; Lajoie, K.R.; Yerkes, R.F. Recurrent Holocene displacement on the Javon Canyon Fault; a comparison of fault-movement history with calculated average recurrence intervals. In Recent Reverse Faulting in the Transverse Ranges, California; Geological Survey: Reston, VA, USA, 1987; p. 1339. [Google Scholar]
- Rockwell, T.; Nolan, J.; Johnson, D.L.; Patterson, R.H. Ages and deformation of marine terraces between Point Conception and Gaviota, Western Transverse Ranges, California. SEPM Spec. Publ. 1992, 48, 333–341. [Google Scholar]
- Ota, Y.; Chappell, J.; Kelley, R.; Yonekura, N.; Matsumoto, E.; Nishimura, T. Holocene coral reef terraces and coseismic uplift of Huon Peninsula, Papua New Guinea. Quat. Res. 1993, 40, 177–188. [Google Scholar] [CrossRef]
- Perg, L.A.; Anderson, R.S.; Finkel, R.C. Use of a new 10Be and 26Al inventory method to date marine terraces, Santa Cruz, California, USA. Geology 2001, 29, 879–882. [Google Scholar] [CrossRef]
- Bookhagen, B.; Echtler, H.P.; Melnick, D.; Strecker, M.R.; Spencer, J.Q.G. Using uplifted Holocene beach berms for paleoseismic analysis on the Santa Maria Island, southcentral Chile. Geophys. Res. Lett. 2006, 33, 5. [Google Scholar] [CrossRef] [Green Version]
- Muhs, D.R.; Simmons, K.R.; Schumann, R.R.; Groves, L.T.; Mitrovica, J.X.; Laurel, D. Sea-level history during the Last Interglacial complex on San Nicolas Island, California: Implications for glacial isostatic adjustment processes, paleozoogeography and tectonics. Quat. Sci. Rev. 2012, 37, 1–25. [Google Scholar] [CrossRef]
- Karymbalis, E.; Tsanakas, K.; Karkani, A.; Evelpidou, N. Tectonics and Sea-Level Fluctuations. J. Mar. Sci. Eng. 2022, 10, 334. [Google Scholar] [CrossRef]
- Galbraith, R.F.; Roberts, R.G.; Laslett, G.M.; Yoshida, H.; Olley, J.M. Optical dating of single and multiple grains of quartz from Jinmium rock shelter, northern Australia: Part I, experimental design and statistical models. Archaeometry 1999, 41, 339–364. [Google Scholar] [CrossRef]
- Gaki-Papanastassiou, K.; Karymbalis, E.; Papanastassiou, D.; Maroukian, H. Quaternary marine terraces as indicators of neotectonic activity of the Ierapetra normal fault SE Crete (Greece). Geomorphology 2009, 104, 38–46. [Google Scholar] [CrossRef]
- Papanastassiou, D.; Cundy, A.; Gaki-Papanastassiou, K.; Frogley, M.; Tsanakas, K.; Maroukian, H. The uplifted terraces of the Arkitsa region, NW Evoikos Gulf, Greece: A result of combined tectonic and volcanic processes? J. Geol. 2014, 122, 397–410. [Google Scholar] [CrossRef] [Green Version]
- Karymbalis, E.; Papanastassiou, D.; Gaki-Papanastassiou, K.; Tsanakas, K.; Maroukian, H. Geomorphological study of Cephalonia Island, Ionian Sea, Western Greece. J. Maps 2013, 9, 121–134. [Google Scholar] [CrossRef]
- Sachpazi, M.; Hirn, A.; Clement, C.; Haslinger, F.; Laigle, M.; Kissling, E.; Charvis, P.; Hello, Y.; Lepine, J.C.; Sapin, M.; et al. Western Hellenic subduction and Cephalonia Transform: Local earthquakes and plate transport and strain. Tectonophysics 2000, 319, 301–319. [Google Scholar] [CrossRef]
- Sorel, D. Etude Néotectonique des îles Ioniennes de Céphalonie et de Zante et de l’Elide Occidentale (Grèce). Thèse 3e cycle, University Paris Sud Orsay, Bures-sur-Yvette, France, 1976. [Google Scholar]
- Stiros, S.C.; Pirazzoli, P.A.; Laborel, J.; Laborel-Deguen, F. The 1953 earthquake in Cephalonia (Western Hellenic Arc): Coastal uplift and halotectonic faulting. Geophys. J. Int. 1994, 117, 834–849. [Google Scholar] [CrossRef] [Green Version]
- Koukouvelas, I.; Mpresiakas, A.; Sokos, E.; Doutsos, T. The tectonic setting and earthquake ground hazards of the 1993 Pyrgos earthquake, Peloponnese, Greece. J. Geol. Soc. 1996, 153, 39–49. [Google Scholar] [CrossRef]
- Clement, C.; Hirn, A.; Charvis, P.; Sachpazi, M.; Marnelis, F. Seismic structure and the active Hellenic subduction in the Ionian islands. Tectonophysics 2000, 329, 141–156. [Google Scholar] [CrossRef]
- Lagios, E.; Sakkas, V.; Papadimitriou, P.; Damiata, B.N.; Parcharidis, I.; Chousianitis, K.; Vassilopoulou, S. Crustal deformation in the Central Ionian Islands (Greece): Results from DGPS and DInSAR analyses (1995–2006). Tectonophysics 2007, 444, 119–145. [Google Scholar] [CrossRef]
- Hollenstein, C.H.; Müller, M.D.; Geiger, A.; Kahle, H.G. Crustal motion and deformation in Greece from a decade of GPS measurements 1993–2003. Tectonophysics 2008, 449, 17–40. [Google Scholar] [CrossRef]
- Louvari, E.; Kiratzi, A.A.; Papazachos, B.C. The Cephalonia transform fault and its extension to western Lefkada Island (Greece). Tectonophysics 1999, 308, 223–236. [Google Scholar] [CrossRef]
- Scordilis, E.; Karakaisis, G.; Karakostas, B.; Panagiotopoulos, D.; Comninakis, P.; Papazachos, B. Evidence for transform faulting in the Ionian Sea: The Cephalonia Island earthquake sequence of 1983. Pure Appl. Geophys. 1985, 123, 388–397. [Google Scholar] [CrossRef]
- Evelpidou, N.; Karkani, A.; Kázmér, M.; Pirazzoli, P. Late Holocene shorelines deduced from tidal notches on both sides of the Ionian thrust (Greece): Fiscardo peninsula (Cephalonia) and Ithaca island. Geol. Acta 2016, 14, 13–24. [Google Scholar]
- Tsanakas, K.; Karymbalis, E.; Cundy, A.; Gaki-Papanastassiou, K.; Papanastassiou, G.; Drinia, H.; Koskeridou, E.; Maroukian, H. Late Holocene geomorphic evolution of the Livadi coastal plain, gulf of Argostoli, Cephalonia island, western Greece. Geogr. Fis. Din. Quat. 2019, 42, 43–60. [Google Scholar] [CrossRef]
- Willershäuser, T.; Vött, A.; Brückner, H.; Bareth, G.; Nelle, O.; Nadeau, M.J.; Hadler, H.; Ntageretzis, K. Holocene tsunami landfalls along the shores of the inner Gulf of Argostoli (Cefalonia Island, Greece). Z. Für Geomorphol. 2013, 57 (Suppl. 4), 105–138. [Google Scholar] [CrossRef]
- Valkaniotis, S.; Ganas, A.; Papathanassiou, G.; Papanikolaou, M. Field observations of geological effects triggered by the January-February 2014 Cephalonia (Ionian Sea, Greece) earthquakes. Tectonophysics 2014, 630, 150–157. [Google Scholar] [CrossRef]
- Pirazzoli, P.A.; Stiros, S.C.; Laborel, J.; Laborel-Deguen, F.; Arnold, M.; Papageorgiou, S.; Morhange, C. Late Holocene shoreline changes related to palaeoseismic events in the Ionian Islands, Greece. Holocene 1994, 4, 397–405. [Google Scholar] [CrossRef]
- Lagios, E.; Papadimitriou, P.; Novali, F.; Sakkas, V.; Fumagalli, A.; Vlachou, K.; Del Conte, S. Combined seismicity pattern analysis, DGPS and PSInSAR studies in the broader area of Cephalonia (Greece). Tectonophysics 2012, 524, 43–58. [Google Scholar] [CrossRef]
- Institute of Geology and Mineral Exploration (IGME). 1985, Geological map of Kefalonia Island. Scale 1:50000; Institute of Geology and Mineral Exploration (IGME): Thessaloniki, Greece, 1985. [Google Scholar]
- Köppen, W. Versuch einer Klassifikation der Klimate, vorzugsweise nach ihren Beziehungen zur Pflanzenwelt. Geogr. Z. 1900, 6, 657–679. [Google Scholar]
- Köppen, W.; Geiger, R. Handbuch der Klimatologie; Gebrueder Borntraeger: Berlin, Germany, 1930. [Google Scholar]
- Hellenic National Meteorological Service. 2010. Available online: http://emy.gr/emy/en (accessed on 15 November 2021).
- Tsanakas, K.; Karymbalis, E.; Gaki-Papanastassiou, K.; Maroukian, H. Geomorphology of the Pieria Mtns, Northern Greece. J. Maps 2019, 15, 499–508. [Google Scholar] [CrossRef] [Green Version]
- Bowles, C.J.; Cowgill, E. Discovering marine terraces using airborne LiDAR along the Mendocino-Sonoma coast, northern California. Geosphere 2012, 8, 386–402. [Google Scholar] [CrossRef]
- Merritts, D.; Bull, W.B. Interpreting Quaternary uplift rates at the Mendocino triple junction, northern California, from uplifted marine terraces. Geology 1989, 17, 1020–1024. [Google Scholar] [CrossRef]
- Strobl, M.; Hetzel, R.; Fassoulas, C.; Kubik, P.W. A long-term rock uplift rate for eastern Crete and geodynamic implications for the Hellenic subduction zone. J. Geodyn. 2014, 78, 21–31. [Google Scholar] [CrossRef]
- Chappel, J.; Omura, A.; Esat, T.; McCulloch, M.; Pandolfi, J.; Ota, Y.; Pillans, B. Reconcilation of late Quaternary sea levels derived from coral terraces at HuonPeninsula with deep sea oxygen isotope records. Earth Planet. Sci. Lett. 1996, 141, 227–236. [Google Scholar] [CrossRef]
- Munnecke, A.; Westphal, H.; Reijmer, J.J.G.; Samtleben, C. Microspar development during early marine burial diagenesis: A comparison of Pliocene carbonates from the Bahamas with Silurian limestones from Gotland (Sweden). Sedimentology 1997, 44, 977–990. [Google Scholar] [CrossRef]
- Folk, R.L. Spectral Subdivision of Limestones Types. In In Classification of Carbonates Rocks. A Symposium; Ham, W.E., Ed.; American Association of Petroleum Geologist Memoirs: Tulsa, OK, USA, 1962; pp. 62–84. [Google Scholar]
- Aitken, M.J. Thermoluminescence Dating; Academic Press: Orlando, FL, USA; London, UK, 1985; p. 351. [Google Scholar]
- Liritzis, I.; Stamoulis, K.; Papachristodoulou, C.; Ioannides, K. A re-evaluation of radiation dose-rate conversion factors. Mediterr. Archaeol. Archaeom. 2013, 13, 1–15. [Google Scholar]
- Murray, A.S.; Wintle, A.G. Luminescence dating of quartz using an improved single-aliquot regenerative-dose protocol. Radiat. Meas. 2000, 32, 57–73. [Google Scholar] [CrossRef]
- Prescott, J.R.; Hutton, J.T. Cosmic ray contribution to dose rates for luminescence and ESR dating: Large depths and long-term time variations. Radiat. Meas. 1994, 23, 497–500. [Google Scholar] [CrossRef]
- Muhs, D.R. Evidence for the timing and duration of the last interglacial period from high-precision uranium-series ages of corals on tectonically stable coastlines. Quat. Res. 2002, 58, 36–40. [Google Scholar] [CrossRef] [Green Version]
- Zazo, C.; Goy, J.L.; Dabrio, C.J.; Bardají, T.; Hillaire-Marcel, C.; Ghaleb, B.; Gonz alezDelgado, J.-A.; Soler, V. Pleistocene raised marine terraces of the Spanish Mediterranean and Atlantic coasts: Records of coastal uplift, sea-level highstands and climate changes. Mar. Geol. 2003, 194, 103–133. [Google Scholar] [CrossRef] [Green Version]
- Zecchin, M.; Civile, D.; Caffau, M.; Roda, C. Facies and cycle architecture of a Pleistocene marine terrace (Crotone, southern Italy): A sedimentary response to late Quaternary, high-frequency glacio-eustatic changes. Sediment. Geology 2009, 216, 138–157. [Google Scholar] [CrossRef]
- Bianca, M.; Catalano, S.; De Guidi, G.; Gueli, A.; Monaco, C.; Ristuccia, G.; Stella, G.; Tortorici, G.; Tortorici, L.; Troja, S. Luminescence chronology of Pleistocene marine terraces of Capo Vaticano peninsula (Calabria, southern Italy). Quat. Int. 2011, 232, 114–121. [Google Scholar] [CrossRef]
- Gurrola, L.D.; Keller, E.A.; Chen, J.H.; Owen, L.A.; Spencer, J.Q. Tectonic geomorphology of marine terraces: Santa Barbara fold belt, California. Geol. Soc. Am. Bull. 2014, 126, 219–233. [Google Scholar] [CrossRef]
- Lambeck, K. Late Pleistocene and Holocene sea-level change in Greece and south-western Turkey: A separation of eustatic, isostatic and tectonic contributions. Geophys. J. Int. 1995, 122, 1022–1044. [Google Scholar] [CrossRef] [Green Version]
- Gallen, S.F.; Wegmann, K.W.; Bohnenstiehl, D.R.; Pazzaglia, F.J.; Brandon, M.T.; Fassoulas, C. Active simultaneous uplift and margin-normal extension in a forearc high, Crete, Greece. Earth Plant. Sci. Lett. 2014, 398, 11–24. [Google Scholar] [CrossRef]
- Normand, R.; Simpson, G.; Herman, F.; Biswas, R.H.; Bahroudi, A.; Schneider, B. Dating and morpho-stratigraphy of uplifted marine terraces in the Makran subduction zone (Iran). Earth Surf. Dyn. 2019, 7, 321–344. [Google Scholar] [CrossRef] [Green Version]
- Snead, R.J. Recent Morphological changes along the coast of West Pakistan. Ann. Assoc. Am. Geogr. 1967, 57, 550–565. [Google Scholar] [CrossRef]
- Karymbalis, E.; Tsanakas, K.; Tsodoulos, I.; Gaki-Papanastassiou, K.; Papanastassiou, D.; Batzakis, D.-V.; Stamoulis, K. Late Quaternary Marine Terraces and Tectonic Uplift Rates of the Broader Neapolis Area (SE Peloponnese, Greece). J. Mar. Sci. Eng. 2022, 10, 99. [Google Scholar] [CrossRef]
- De Gelder, G.; Fernandez-Blanco, D.; Lacassin, R.; Armijo, R.; Delorme, A.; Jara-Muñoz, J.; Melnick, D. Corinth terraces revisited: Improved paleoshoreline determination using Pleiades-DEM. Geotecton. Res. 2015, 97, 12–14. [Google Scholar] [CrossRef] [Green Version]
- Lisiecki, L.E.; Raymo, M.E. A Pliocene–Pleistocene stack of 57 globally distributed benthic d18O records. Paleoceanography 2005, 20, PA1003. [Google Scholar]


Publisher’s Note: MDPI stays neutral with regard to jurisdictional claims in published maps and institutional affiliations. |
© 2022 by the authors. Licensee MDPI, Basel, Switzerland. This article is an open access article distributed under the terms and conditions of the Creative Commons Attribution (CC BY) license (https://creativecommons.org/licenses/by/4.0/).