From Single Level Analysis to Multi-Omics Integrative Approaches: A Powerful Strategy towards the Precision Oncology


 ,
, 


Abstract
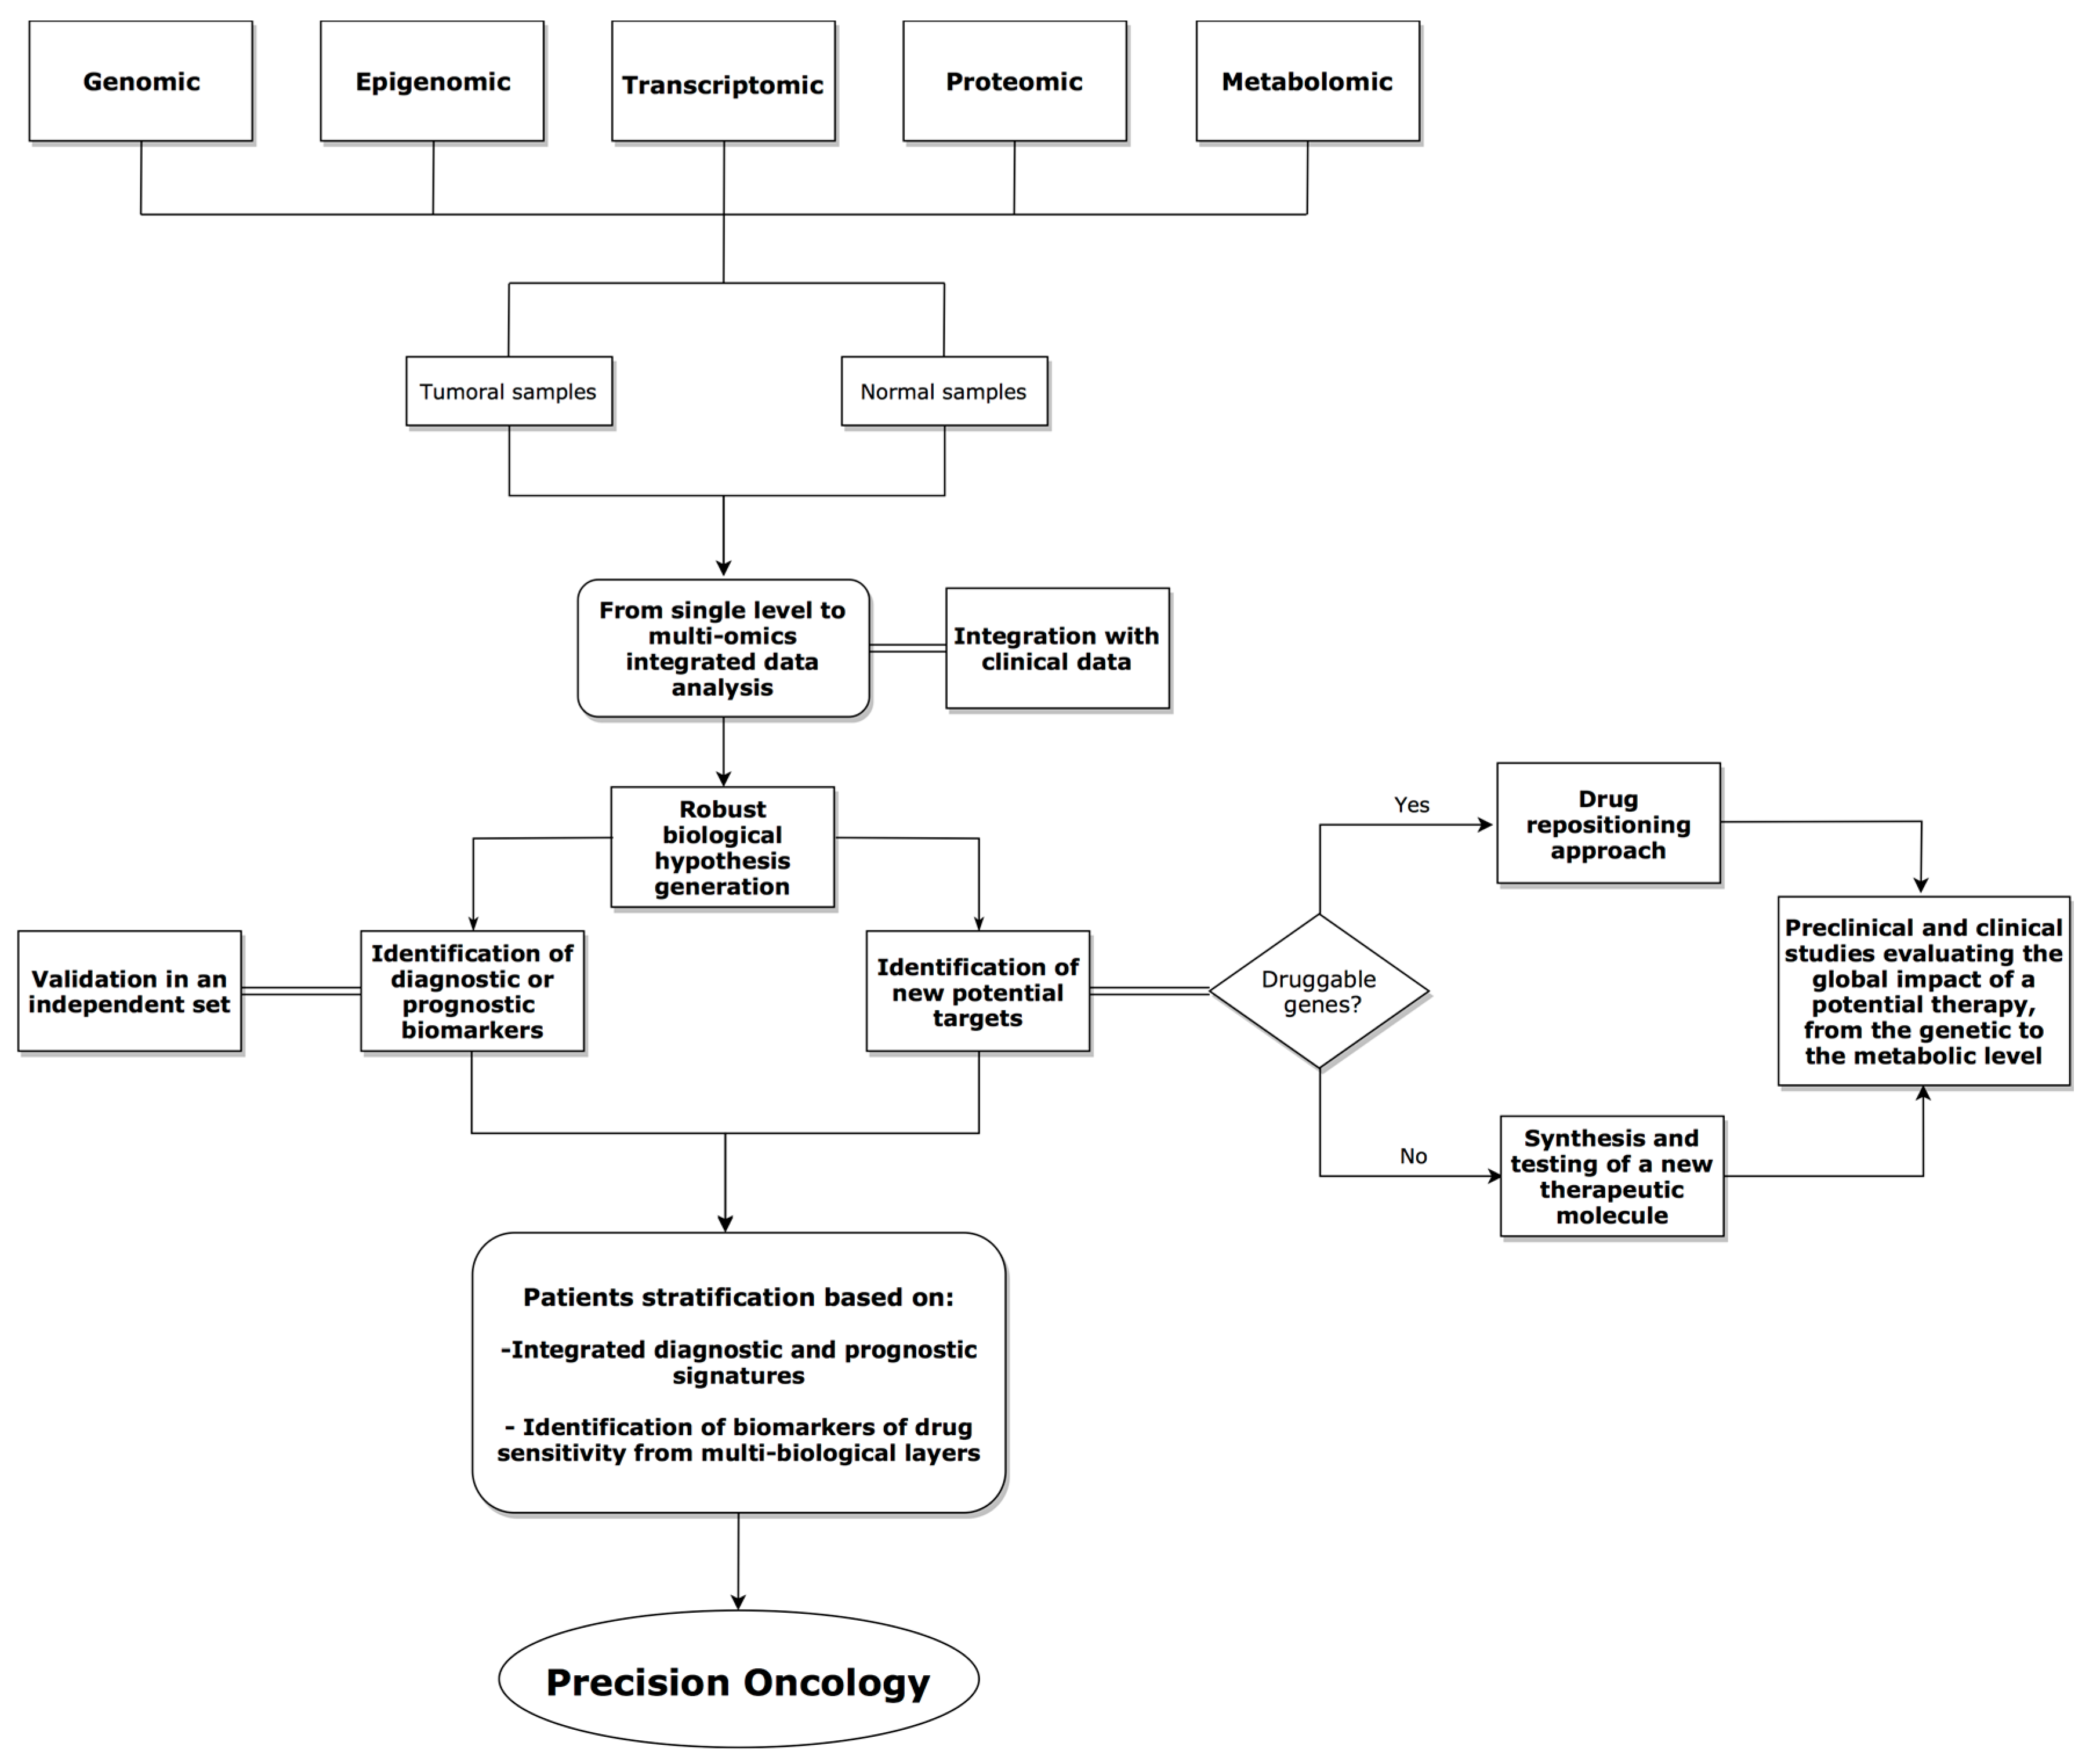
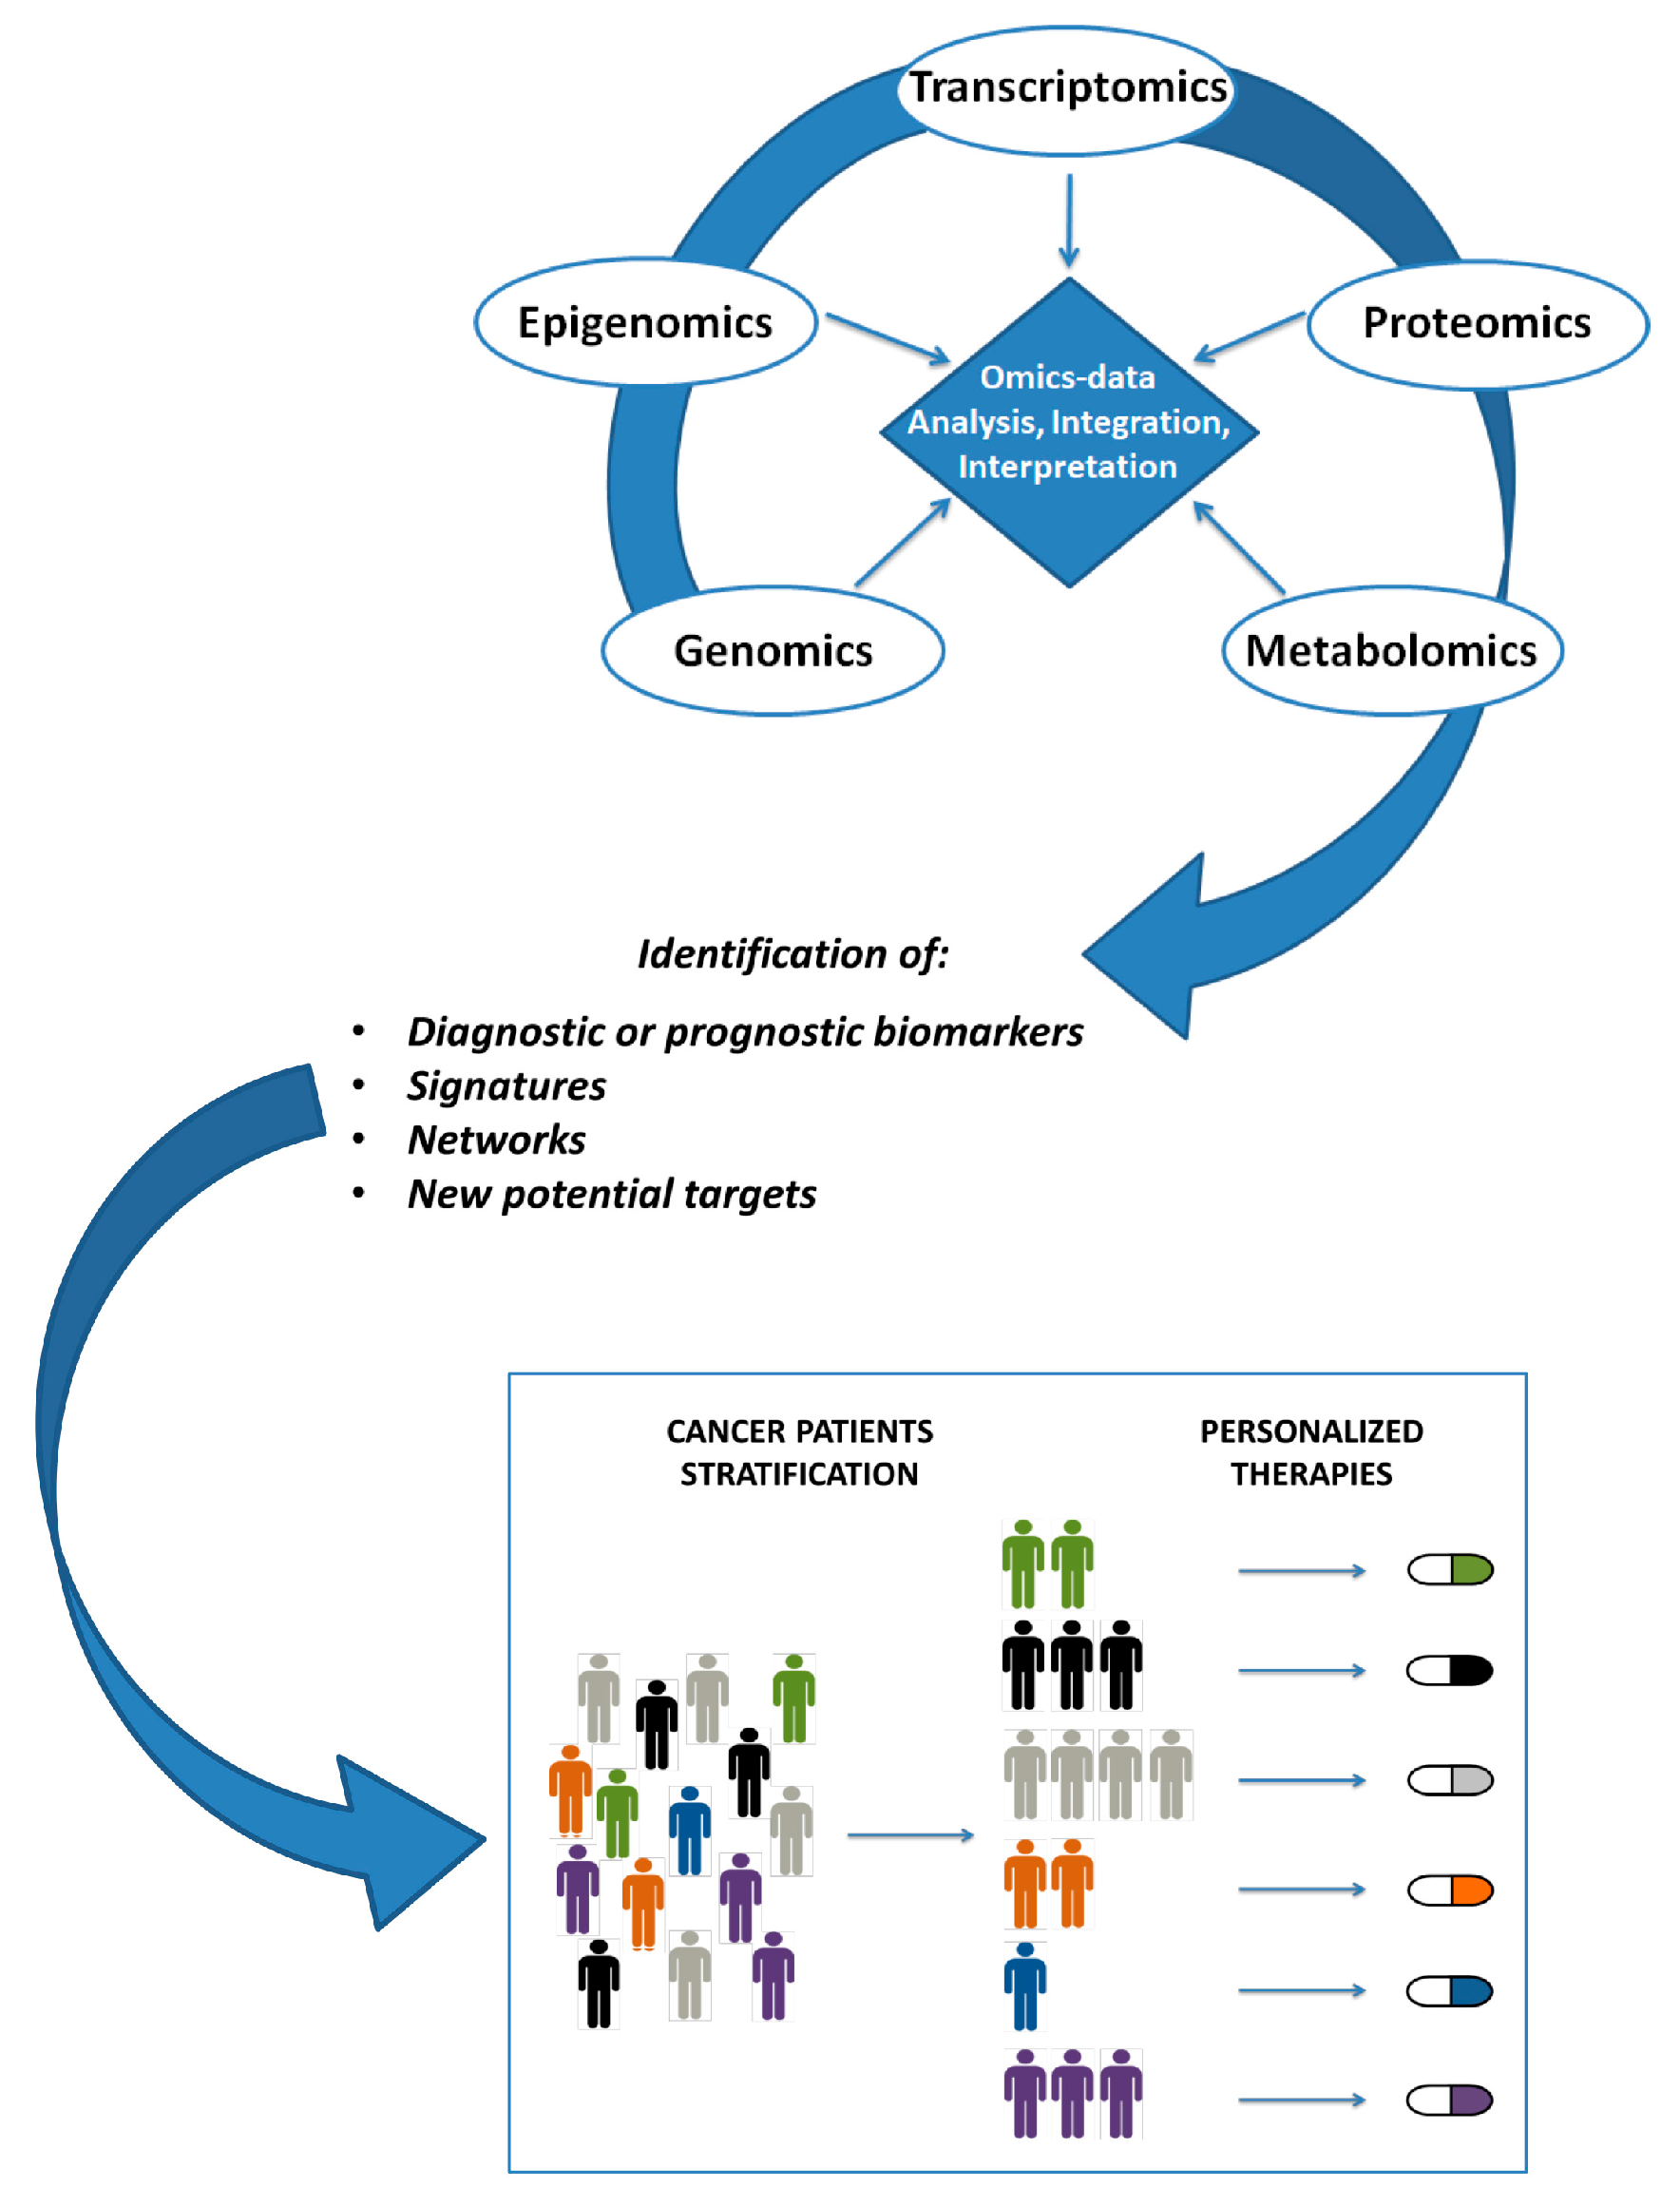
:1. Introduction
2. Omics Data Production
2.1. Genomic Profile
2.2. Epigenomic Profile
2.3. Transcriptomic Profile
2.4. Proteomic Profile
2.5. Metabolomic Profile
3. Integrative Analysis Tools
- (a)
- MENT, which is a database containing integrated data of DNA methylation and gene expression of normal and tumor tissues together with clinical data from GEO and TCGA [115].
- (b)
- MethHC, which includes a systematic integration of DNA methylation and mRNA/microRNA expression data from human cancers [109].
- (c)
- Wanderer, which is a web tool allowing user-friendly access to gene expression and DNA methylation data from TCGA [116].
- (d)
- MethCNA, a database in which raw array data obtained by Infinium HumanMethylation450 bead chip and deposited in TCGA and GEO databases are collected and re-analyzed through a pipeline that includes multiple computational tools and resources for omics data integration. In this database DNA methylation and copy number alteration data refer to exactly the same genetic loci from the same DNA specimen, providing an important advantage respect than other databases that instead integrate data deriving from different patients and platforms [117].
4. Integrative Analysis Approaches in Cancer Research
5. Discussion
Funding
Conflicts of Interest
References
- Alexandrov, L.B.; Nik-Zainal, S.; Wedge, D.C.; Aparicio, S.A.; Behjati, S.; Biankin, A.V.; Bignell, G.R.; Bolli, N.; Borg, A.; Borresen-Dale, A.L.; et al. Signatures of mutational processes in human cancer. Nature 2013, 500, 415–421. [Google Scholar] [CrossRef] [PubMed] [Green Version]
- Burrell, R.A.; McGranahan, N.; Bartek, J.; Swanton, C. The causes and consequences of genetic heterogeneity in cancer evolution. Nature 2013, 501, 338–345. [Google Scholar] [CrossRef] [PubMed]
- McGranahan, N.; Favero, F.; de Bruin, E.C.; Birkbak, N.J.; Szallasi, Z.; Swanton, C. Clonal status of actionable driver events and the timing of mutational processes in cancer evolution. Sci. Transl. Med. 2015, 7, 283ra254. [Google Scholar] [CrossRef] [PubMed]
- Collins, D.C.; Sundar, R.; Lim, J.S.J.; Yap, T.A. Towards Precision Medicine in the Clinic: From Biomarker Discovery to Novel Therapeutics. Trends Pharmacol. Sci. 2017, 38, 25–40. [Google Scholar] [CrossRef] [PubMed]
- Wedge, D.C.; Gundem, G.; Mitchell, T.; Woodcock, D.J.; Martincorena, I.; Ghori, M.; Zamora, J.; Butler, A.; Whitaker, H.; Kote-Jarai, Z.; et al. Sequencing of prostate cancers identifies new cancer genes, routes of progression and drug targets. Nat. Genet. 2018, 50, 682–692. [Google Scholar] [CrossRef] [PubMed]
- Miao, D.; Margolis, C.A.; Vokes, N.I.; Liu, D.; Taylor-Weiner, A.; Wankowicz, S.M.; Adeegbe, D.; Keliher, D.; Schilling, B.; Tracy, A.; et al. Genomic correlates of response to immune checkpoint blockade in microsatellite-stable solid tumors. Nat. Genet. 2018, 50, 1271–1281. [Google Scholar] [CrossRef] [PubMed]
- Yeung, C.C.S.; McElhone, S.; Chen, X.Y.; Ng, D.; Storer, B.E.; Deeg, H.J.; Fang, M. Impact of copy neutral loss of heterozygosity and total genome aberrations on survival in myelodysplastic syndrome. Mod. Pathol. 2018, 31, 569–580. [Google Scholar] [CrossRef] [PubMed]
- Diaz, L.A., Jr.; Bardelli, A. Liquid biopsies: Genotyping circulating tumor DNA. J. Clin. Oncol. 2014, 32, 579–586. [Google Scholar] [CrossRef] [PubMed]
- Zill, O.A.; Banks, K.C.; Fairclough, S.R.; Mortimer, S.A.; Vowles, J.V.; Mokhtari, R.; Gandara, D.R.; Mack, P.C.; Odegaard, J.I.; Nagy, R.J.; et al. The Landscape of Actionable Genomic Alterations in Cell-Free Circulating Tumor DNA from 21,807 Advanced Cancer Patients. Clin. Cancer Res. 2018, 24, 3528–3538. [Google Scholar] [CrossRef] [PubMed] [Green Version]
- Krebs, M.G.; Hou, J.M.; Ward, T.H.; Blackhall, F.H.; Dive, C. Circulating tumour cells: Their utility in cancer management and predicting outcomes. Ther. Adv. Med. Oncol. 2010, 2, 351–365. [Google Scholar] [CrossRef] [PubMed]
- Mishima, Y.; Paiva, B.; Shi, J.; Park, J.; Manier, S.; Takagi, S.; Massoud, M.; Perilla-Glen, A.; Aljawai, Y.; Huynh, D.; et al. The mutational landscape of circulating tumor cells in multiple myeloma. Cell Rep. 2017, 19, 218–224. [Google Scholar] [CrossRef] [PubMed]
- Carter, H.; Marty, R.; Hofree, M.; Gross, A.M.; Jensen, J.; Fisch, K.M.; Wu, X.; DeBoever, C.; Van Nostrand, E.L.; Song, Y.; et al. Interaction landscape of inherited polymorphisms with somatic events in cancer. Cancer Discov. 2017, 7, 410–423. [Google Scholar] [CrossRef] [PubMed]
- Garcia-Closas, M.; Rothman, N.; Figueroa, J.D.; Prokunina-Olsson, L.; Han, S.S.; Baris, D.; Jacobs, E.J.; Malats, N.; De Vivo, I.; Albanes, D.; et al. Common genetic polymorphisms modify the effect of smoking on absolute risk of bladder cancer. Cancer Res. 2013, 73, 2211–2220. [Google Scholar] [CrossRef] [PubMed]
- Nebbioso, A.; Tambaro, F.P.; Dell’Aversana, C.; Altucci, L. Cancer epigenetics: Moving forward. PLoS Genet. 2018, 14, e1007362. [Google Scholar] [CrossRef] [PubMed]
- Vogelstein, B.; Papadopoulos, N.; Velculescu, V.E.; Zhou, S.; Diaz, L.A., Jr.; Kinzler, K.W. Cancer genome landscapes. Science 2013, 339, 1546–1558. [Google Scholar] [CrossRef] [PubMed]
- Delhommeau, F.; Dupont, S.; Della Valle, V.; James, C.; Trannoy, S.; Masse, A.; Kosmider, O.; Le Couedic, J.P.; Robert, F.; Alberdi, A.; et al. Mutation in TET2 in myeloid cancers. N. Engl. J. Med. 2009, 360, 2289–2301. [Google Scholar] [CrossRef] [PubMed]
- Ley, T.J.; Ding, L.; Walter, M.J.; McLellan, M.D.; Lamprecht, T.; Larson, D.E.; Kandoth, C.; Payton, J.E.; Baty, J.; Welch, J.; et al. DNMT3A mutations in acute myeloid leukemia. N. Engl. J. Med. 2010, 363, 2424–2433. [Google Scholar] [CrossRef] [PubMed]
- Morin, R.D.; Johnson, N.A.; Severson, T.M.; Mungall, A.J.; An, J.; Goya, R.; Paul, J.E.; Boyle, M.; Woolcock, B.W.; Kuchenbauer, F.; et al. Somatic mutations altering EZH2 (Tyr641) in follicular and diffuse large B-cell lymphomas of germinal-center origin. Nat. Genet. 2010, 42, 181–185. [Google Scholar] [CrossRef] [PubMed] [Green Version]
- Beggs, A.D.; Jones, A.; El-Bahrawy, M.; Abulafi, M.; Hodgson, S.V.; Tomlinson, I.P. Whole-genome methylation analysis of benign and malignant colorectal tumours. J. Pathol. 2013, 229, 697–704. [Google Scholar] [CrossRef] [PubMed] [Green Version]
- Ganesan, A. Epigenetics: The first 25 centuries. Philos. Trans. R. Soc. Lond. B Biol. Sci. 2018, 373. [Google Scholar] [CrossRef] [PubMed]
- Amodio, N.; D’Aquila, P.; Passarino, G.; Tassone, P.; Bellizzi, D. Epigenetic modifications in multiple myeloma: Recent advances on the role of DNA and histone methylation. Expert Opin. Ther. Targets 2017, 21, 91–101. [Google Scholar] [CrossRef] [PubMed]
- Serre, D.; Lee, B.H.; Ting, A.H. MBD-isolated Genome Sequencing provides a high-throughput and comprehensive survey of DNA methylation in the human genome. Nucleic Acids Res. 2010, 38, 391–399. [Google Scholar] [CrossRef] [PubMed]
- Brinkman, A.B.; Simmer, F.; Ma, K.; Kaan, A.; Zhu, J.; Stunnenberg, H.G. Whole-genome DNA methylation profiling using MethylCap-seq. Methods 2010, 52, 232–236. [Google Scholar] [CrossRef] [PubMed]
- Maunakea, A.K.; Nagarajan, R.P.; Bilenky, M.; Ballinger, T.J.; D’Souza, C.; Fouse, S.D.; Johnson, B.E.; Hong, C.; Nielsen, C.; Zhao, Y.; et al. Conserved role of intragenic DNA methylation in regulating alternative promoters. Nature 2010, 466, 253–257. [Google Scholar] [CrossRef] [PubMed] [Green Version]
- Hayatsu, H. Discovery of bisulfite-mediated cytosine conversion to uracil, the key reaction for DNA methylation analysis—A personal account. Proc. Jpn. Acad. Ser. B Phys. Biol. Sci. 2008, 84, 321–330. [Google Scholar] [CrossRef] [PubMed]
- Shi, D.Q.; Ali, I.; Tang, J.; Yang, W.C. New Insights into 5hmC DNA Modification: Generation, Distribution and Function. Front. Genet. 2017, 8, 100. [Google Scholar] [CrossRef] [PubMed]
- Dapprich, J.; Ferriola, D.; Mackiewicz, K.; Clark, P.M.; Rappaport, E.; D’Arcy, M.; Sasson, A.; Gai, X.; Schug, J.; Kaestner, K.H.; et al. The next generation of target capture technologies–large DNA fragment enrichment and sequencing determines regional genomic variation of high complexity. BMC Genom. 2016, 17, 486. [Google Scholar] [CrossRef] [PubMed]
- Clark, T.A.; Spittle, K.E.; Turner, S.W.; Korlach, J. Direct detection and sequencing of damaged DNA bases. Genome Integr. 2011, 2, 10. [Google Scholar] [CrossRef] [PubMed]
- Schatz, M.C. Nanopore sequencing meets epigenetics. Nat. Methods 2017, 14, 347–348. [Google Scholar] [CrossRef] [PubMed]
- Barros-Silva, D.; Marques, C.J.; Henrique, R.; Jeronimo, C. Profiling DNA Methylation Based on Next-Generation Sequencing Approaches: New Insights and Clinical Applications. Genes (Basel) 2018, 9. [Google Scholar] [CrossRef] [PubMed]
- Barski, A.; Cuddapah, S.; Cui, K.; Roh, T.Y.; Schones, D.E.; Wang, Z.; Wei, G.; Chepelev, I.; Zhao, K. High-resolution profiling of histone methylations in the human genome. Cell 2007, 129, 823–837. [Google Scholar] [CrossRef] [PubMed]
- Johnson, D.S.; Mortazavi, A.; Myers, R.M.; Wold, B. Genome-wide mapping of in vivo protein-DNA interactions. Science 2007, 316, 1497–1502. [Google Scholar] [CrossRef] [PubMed]
- Neph, S.; Vierstra, J.; Stergachis, A.B.; Reynolds, A.P.; Haugen, E.; Vernot, B.; Thurman, R.E.; John, S.; Sandstrom, R.; Johnson, A.K.; et al. An expansive human regulatory lexicon encoded in transcription factor footprints. Nature 2012, 489, 83–90. [Google Scholar] [CrossRef] [PubMed] [Green Version]
- Cui, K.; Zhao, K. Genome-wide approaches to determining nucleosome occupancy in metazoans using MNase-Seq. Methods Mol. Biol. 2012, 833, 413–419. [Google Scholar] [CrossRef] [PubMed]
- Splinter, E.; de Wit, E.; Nora, E.P.; Klous, P.; van de Werken, H.J.; Zhu, Y.; Kaaij, L.J.; van Ijcken, W.; Gribnau, J.; Heard, E.; et al. The inactive X chromosome adopts a unique three-dimensional conformation that is dependent on Xist RNA. Genes Dev. 2011, 25, 1371–1383. [Google Scholar] [CrossRef] [PubMed] [Green Version]
- He, X.; Chang, S.; Zhang, J.; Zhao, Q.; Xiang, H.; Kusonmano, K.; Yang, L.; Sun, Z.S.; Yang, H.; Wang, J. MethyCancer: The database of human DNA methylation and cancer. Nucleic Acids Res. 2008, 36, D836–D841. [Google Scholar] [CrossRef] [PubMed]
- Cancer Genome Atlas Research Network. Comprehensive genomic characterization defines human glioblastoma genes and core pathways. Nature 2008, 455, 1061–1068. [Google Scholar] [CrossRef] [PubMed]
- Mei, S.; Meyer, C.A.; Zheng, R.; Qin, Q.; Wu, Q.; Jiang, P.; Li, B.; Shi, X.; Wang, B.; Fan, J.; et al. Cistrome Cancer: A web resource for integrative gene regulation modeling in cancer. Cancer Res. 2017, 77, e19–e22. [Google Scholar] [CrossRef] [PubMed]
- Marino-Ramirez, L.; Levine, K.M.; Morales, M.; Zhang, S.; Moreland, R.T.; Baxevanis, A.D.; Landsman, D. The Histone Database: An integrated resource for histones and histone fold-containing proteins. Database (Oxford) 2011, 2011, bar048. [Google Scholar] [CrossRef] [PubMed]
- Khare, S.P.; Habib, F.; Sharma, R.; Gadewal, N.; Gupta, S.; Galande, S. HIstome—A relational knowledgebase of human histone proteins and histone modifying enzymes. Nucleic Acids Res. 2012, 40, D337–D342. [Google Scholar] [CrossRef] [PubMed]
- Guo, S.; Yan, F.; Xu, J.; Bao, Y.; Zhu, J.; Wang, X.; Wu, J.; Li, Y.; Pu, W.; Liu, Y.; et al. Identification and validation of the methylation biomarkers of non-small cell lung cancer (NSCLC). Clin. Epigenetics 2015, 7, 3. [Google Scholar] [CrossRef] [PubMed] [Green Version]
- Exner, R.; Pulverer, W.; Diem, M.; Spaller, L.; Woltering, L.; Schreiber, M.; Wolf, B.; Sonntagbauer, M.; Schroder, F.; Stift, J.; et al. Potential of DNA methylation in rectal cancer as diagnostic and prognostic biomarkers. Br. J. Cancer 2015, 113, 1035–1045. [Google Scholar] [CrossRef] [PubMed] [Green Version]
- Legendre, C.; Gooden, G.C.; Johnson, K.; Martinez, R.A.; Liang, W.S.; Salhia, B. Whole-genome bisulfite sequencing of cell-free DNA identifies signature associated with metastatic breast cancer. Clin. Epigenetics 2015, 7, 100. [Google Scholar] [CrossRef] [PubMed]
- Qu, K.; Zaba, L.C.; Satpathy, A.T.; Giresi, P.G.; Li, R.; Jin, Y.; Armstrong, R.; Jin, C.; Schmitt, N.; Rahbar, Z.; et al. Chromatin accessibility landscape of cutaneous T cell lymphoma and dynamic response to HDAC inhibitors. Cancer Cell 2017, 32, 27–41. [Google Scholar] [CrossRef] [PubMed]
- Cai, M.; Kim, S.; Wang, K.; Farnham, P.J.; Coetzee, G.A.; Lu, W. 4C-seq revealed long-range interactions of a functional enhancer at the 8q24 prostate cancer risk locus. Sci. Rep. 2016, 6, 22462. [Google Scholar] [CrossRef] [PubMed] [Green Version]
- Consortium, E.P. An integrated encyclopedia of DNA elements in the human genome. Nature 2012, 489, 57–74. [Google Scholar] [CrossRef] [PubMed]
- Barretina, J.; Caponigro, G.; Stransky, N.; Venkatesan, K.; Margolin, A.A.; Kim, S.; Wilson, C.J.; Lehar, J.; Kryukov, G.V.; Sonkin, D.; et al. The Cancer Cell Line Encyclopedia enables predictive modelling of anticancer drug sensitivity. Nature 2012, 483, 603–607. [Google Scholar] [CrossRef] [PubMed] [Green Version]
- Klijn, C.; Durinck, S.; Stawiski, E.W.; Haverty, P.M.; Jiang, Z.; Liu, H.; Degenhardt, J.; Mayba, O.; Gnad, F.; Liu, J.; et al. A comprehensive transcriptional portrait of human cancer cell lines. Nat. Biotechnol. 2015, 33, 306–312. [Google Scholar] [CrossRef] [PubMed]
- Consortium, G.T. The Genotype-Tissue Expression (GTEx) project. Nat. Genet. 2013, 45, 580–585. [Google Scholar] [CrossRef] [Green Version]
- Uhlen, M.; Fagerberg, L.; Hallstrom, B.M.; Lindskog, C.; Oksvold, P.; Mardinoglu, A.; Sivertsson, A.; Kampf, C.; Sjostedt, E.; Asplund, A.; et al. Proteomics. Tissue-based map of the human proteome. Science 2015, 347, 1260419. [Google Scholar] [CrossRef] [PubMed]
- Cancer Genome Atlas Research Network; Weinstein, J.N.; Collisson, E.A.; Mills, G.B.; Shaw, K.R.; Ozenberger, B.A.; Ellrott, K.; Shmulevich, I.; Sander, C.; Stuart, J.M. The Cancer Genome Atlas Pan-Cancer analysis project. Nat. Genet. 2013, 45, 1113–1120. [Google Scholar] [CrossRef] [PubMed] [Green Version]
- Robinson, D.; Van Allen, E.M.; Wu, Y.M.; Schultz, N.; Lonigro, R.J.; Mosquera, J.M.; Montgomery, B.; Taplin, M.E.; Pritchard, C.C.; Attard, G.; et al. Integrative clinical genomics of advanced prostate cancer. Cell 2015, 162, 454. [Google Scholar] [CrossRef] [PubMed]
- Mody, R.J.; Wu, Y.M.; Lonigro, R.J.; Cao, X.; Roychowdhury, S.; Vats, P.; Frank, K.M.; Prensner, J.R.; Asangani, I.; Palanisamy, N.; et al. Integrative Clinical sequencing in the management of refractory or relapsed cancer in youth. JAMA 2015, 314, 913–925. [Google Scholar] [CrossRef] [PubMed]
- Oberg, J.A.; Glade Bender, J.L.; Sulis, M.L.; Pendrick, D.; Sireci, A.N.; Hsiao, S.J.; Turk, A.T.; Dela Cruz, F.S.; Hibshoosh, H.; Remotti, H.; et al. Implementation of next generation sequencing into pediatric hematology-oncology practice: Moving beyond actionable alterations. Genome Med. 2016, 8, 133. [Google Scholar] [CrossRef] [PubMed]
- Robinson, D.R.; Wu, Y.M.; Lonigro, R.J.; Vats, P.; Cobain, E.; Everett, J.; Cao, X.; Rabban, E.; Kumar-Sinha, C.; Raymond, V.; et al. Integrative clinical genomics of metastatic cancer. Nature 2017, 548, 297–303. [Google Scholar] [CrossRef] [PubMed]
- Kurimoto, K.; Yabuta, Y.; Ohinata, Y.; Ono, Y.; Uno, K.D.; Yamada, R.G.; Ueda, H.R.; Saitou, M. An improved single-cell cDNA amplification method for efficient high-density oligonucleotide microarray analysis. Nucleic Acids Res. 2006, 34, e42. [Google Scholar] [CrossRef] [PubMed]
- Huet, S.; Tesson, B.; Salles, G. Predictive gene-expression score for follicular lymphoma—Authors’ reply. Lancet Oncol. 2018, 19, e282. [Google Scholar] [CrossRef]
- Boyault, S.; Rickman, D.S.; de Reynies, A.; Balabaud, C.; Rebouissou, S.; Jeannot, E.; Herault, A.; Saric, J.; Belghiti, J.; Franco, D.; et al. Transcriptome classification of HCC is related to gene alterations and to new therapeutic targets. Hepatology 2007, 45, 42–52. [Google Scholar] [CrossRef] [PubMed] [Green Version]
- Hoshida, Y.; Nijman, S.M.; Kobayashi, M.; Chan, J.A.; Brunet, J.P.; Chiang, D.Y.; Villanueva, A.; Newell, P.; Ikeda, K.; Hashimoto, M.; et al. Integrative transcriptome analysis reveals common molecular subclasses of human hepatocellular carcinoma. Cancer Res. 2009, 69, 7385–7392. [Google Scholar] [CrossRef] [PubMed]
- Amodio, N.; Raimondi, L.; Juli, G.; Stamato, M.A.; Caracciolo, D.; Tagliaferri, P.; Tassone, P. MALAT1: A druggable long non-coding RNA for targeted anti-cancer approaches. J. Hematol. Oncol. 2018, 11, 63. [Google Scholar] [CrossRef] [PubMed]
- Ochoa, A.E.; Choi, W.; Su, X.; Siefker-Radtke, A.; Czerniak, B.; Dinney, C.; McConkey, D.J. Specific micro-RNA expression patterns distinguish the basal and luminal subtypes of muscle-invasive bladder cancer. Oncotarget 2016, 7, 80164–80174. [Google Scholar] [CrossRef] [PubMed] [Green Version]
- Raimondi, L.; De Luca, A.; Morelli, E.; Giavaresi, G.; Tagliaferri, P.; Tassone, P.; Amodio, N. MicroRNAs: Novel crossroads between myeloma cells and the bone marrow microenvironment. Biomed. Res. Int. 2016, 2016, 6504593. [Google Scholar] [CrossRef] [PubMed]
- Volinia, S.; Galasso, M.; Sana, M.E.; Wise, T.F.; Palatini, J.; Huebner, K.; Croce, C.M. Breast cancer signatures for invasiveness and prognosis defined by deep sequencing of microRNA. Proc. Natl. Acad. Sci. USA 2012, 109, 3024–3029. [Google Scholar] [CrossRef] [PubMed] [Green Version]
- Namkung, J.; Kwon, W.; Choi, Y.; Yi, S.G.; Han, S.; Kang, M.J.; Kim, S.W.; Park, T.; Jang, J.Y. Molecular subtypes of pancreatic cancer based on miRNA expression profiles have independent prognostic value. J. Gastroenterol. Hepatol. 2016, 31, 1160–1167. [Google Scholar] [CrossRef] [PubMed]
- Karczewski, K.J.; Snyder, M.P. Integrative omics for health and disease. Nat. Rev. Genet. 2018, 19, 299–310. [Google Scholar] [CrossRef] [PubMed]
- Poste, G. Biospecimens, biomarkers, and burgeoning data: The imperative for more rigorous research standards. Trends Mol. Med. 2012, 18, 717–722. [Google Scholar] [CrossRef] [PubMed]
- Hanash, S.; Taguchi, A. Application of proteomics to cancer early detection. Cancer J. 2011, 17, 423–428. [Google Scholar] [CrossRef] [PubMed]
- Baker, E.S.; Liu, T.; Petyuk, V.A.; Burnum-Johnson, K.E.; Ibrahim, Y.M.; Anderson, G.A.; Smith, R.D. Mass spectrometry for translational proteomics: Progress and clinical implications. Genome Med. 2012, 4, 63. [Google Scholar] [CrossRef] [PubMed]
- Yates, J.R., 3rd. The revolution and evolution of shotgun proteomics for large-scale proteome analysis. J. Am. Chem. Soc. 2013, 135, 1629–1640. [Google Scholar] [CrossRef] [PubMed]
- Aslam, B.; Basit, M.; Nisar, M.A.; Khurshid, M.; Rasool, M.H. Proteomics: Technologies and their applications. J. Chromatogr. Sci. 2017, 55, 182–196. [Google Scholar] [CrossRef] [PubMed]
- Padoan, A.; Basso, D.; Zambon, C.F.; Prayer-Galetti, T.; Arrigoni, G.; Bozzato, D.; Moz, S.; Zattoni, F.; Bellocco, R.; Plebani, M. MALDI-TOF peptidomic analysis of serum and post-prostatic massage urine specimens to identify prostate cancer biomarkers. Clin. Proteom. 2018, 15, 23. [Google Scholar] [CrossRef] [PubMed]
- Walther, T.C.; Mann, M. Mass spectrometry-based proteomics in cell biology. J. Cell Biol. 2010, 190, 491–500. [Google Scholar] [CrossRef] [PubMed]
- Fernandez-Coto, D.L.; Gil, J.; Hernandez, A.; Herrera-Goepfert, R.; Castro-Romero, I.; Hernandez-Marquez, E.; Arenas-Linares, A.S.; Calderon-Sosa, V.T.; Sanchez-Aleman, M.A.; Mendez-Tenorio, A.; et al. Quantitative proteomics reveals proteins involved in the progression from non-cancerous lesions to gastric cancer. J. Proteom. 2018, 186, 15–27. [Google Scholar] [CrossRef] [PubMed]
- Wang, X.; He, Y.; Ye, Y.; Zhao, X.; Deng, S.; He, G.; Zhu, H.; Xu, N.; Liang, S. SILAC-based quantitative MS approach for real-time recording protein-mediated cell-cell interactions. Sci. Rep. 2018, 8, 8441. [Google Scholar] [CrossRef] [PubMed]
- Shin, J.; Lee, W.; Lee, W. Structural proteomics by NMR spectroscopy. Expert Rev. Proteom. 2008, 5, 589–601. [Google Scholar] [CrossRef] [PubMed]
- Vizcaino, J.A.; Cote, R.G.; Csordas, A.; Dianes, J.A.; Fabregat, A.; Foster, J.M.; Griss, J.; Alpi, E.; Birim, M.; Contell, J.; et al. The PRoteomics IDEntifications (PRIDE) database and associated tools: Status in 2013. Nucleic Acids Res. 2013, 41, D1063–D1069. [Google Scholar] [CrossRef] [PubMed]
- Croft, D.; O’Kelly, G.; Wu, G.; Haw, R.; Gillespie, M.; Matthews, L.; Caudy, M.; Garapati, P.; Gopinath, G.; Jassal, B.; et al. Reactome: A database of reactions, pathways and biological processes. Nucleic Acids Res. 2011, 39, D691–D697. [Google Scholar] [CrossRef] [PubMed]
- Kanehisa, M.; Goto, S.; Sato, Y.; Furumichi, M.; Tanabe, M. KEGG for integration and interpretation of large-scale molecular data sets. Nucleic Acids Res. 2012, 40, D109–D114. [Google Scholar] [CrossRef] [PubMed]
- Kanehisa, M.; Furumichi, M.; Tanabe, M.; Sato, Y.; Morishima, K. KEGG: New perspectives on genomes, pathways, diseases and drugs. Nucleic Acids Res. 2017, 45, D353–D361. [Google Scholar] [CrossRef] [PubMed]
- Tyanova, S.; Albrechtsen, R.; Kronqvist, P.; Cox, J.; Mann, M.; Geiger, T. Proteomic maps of breast cancer subtypes. Nat. Commun. 2016, 7, 10259. [Google Scholar] [CrossRef] [PubMed] [Green Version]
- Lawrence, R.T.; Perez, E.M.; Hernandez, D.; Miller, C.P.; Haas, K.M.; Irie, H.Y.; Lee, S.I.; Blau, C.A.; Villen, J. The proteomic landscape of triple-negative breast cancer. Cell Rep. 2015, 11, 990. [Google Scholar] [CrossRef] [PubMed]
- Bohnenberger, H.; Kaderali, L.; Strobel, P.; Yepes, D.; Plessmann, U.; Dharia, N.V.; Yao, S.; Heydt, C.; Merkelbach-Bruse, S.; Emmert, A.; et al. Comparative proteomics reveals a diagnostic signature for pulmonary head-and-neck cancer metastasis. EMBO Mol. Med. 2018, 10. [Google Scholar] [CrossRef] [PubMed]
- Wilhelm, M.; Schlegl, J.; Hahne, H.; Gholami, A.M.; Lieberenz, M.; Savitski, M.M.; Ziegler, E.; Butzmann, L.; Gessulat, S.; Marx, H.; et al. Mass-spectrometry-based draft of the human proteome. Nature 2014, 509, 582–587. [Google Scholar] [CrossRef] [PubMed]
- Swiatly, A.; Horala, A.; Matysiak, J.; Hajduk, J.; Nowak-Markwitz, E.; Kokot, Z.J. Understanding ovarian Cancer: ITRAQ-Based proteomics for biomarker discovery. Int. J. Mol. Sci. 2018, 19. [Google Scholar] [CrossRef] [PubMed]
- Ali, M.; Khan, S.A.; Wennerberg, K.; Aittokallio, T. Global proteomics profiling improves drug sensitivity prediction: Results from a multi-omics, pan-cancer modeling approach. Bioinformatics 2018, 34, 1353–1362. [Google Scholar] [CrossRef] [PubMed]
- Yanovich, G.; Agmon, H.; Harel, M.; Sonnenblick, A.; Peretz, T.; Geiger, T. Clinical proteomics of breast cancer reveals a novel layer of breast cancer classification. Cancer Res. 2018. [Google Scholar] [CrossRef] [PubMed]
- Cruz, I.N.; Coley, H.M.; Kramer, H.B.; Madhuri, T.K.; Safuwan, N.A.; Angelino, A.R.; Yang, M. Proteomics analysis of ovarian cancer cell lines and tissues reveals drug resistance-associated proteins. Cancer Genom. Proteom. 2017, 14, 35–51. [Google Scholar] [CrossRef] [PubMed]
- Creighton, C.J.; Huang, S. Reverse phase protein arrays in signaling pathways: A data integration perspective. Drug Des. Dev. Ther. 2015, 9, 3519–3527. [Google Scholar] [CrossRef]
- Mueller, C.; deCarvalho, A.C.; Mikkelsen, T.; Lehman, N.L.; Calvert, V.; Espina, V.; Liotta, L.A.; Petricoin, E.F., 3rd. Glioblastoma cell enrichment is critical for analysis of phosphorylated drug targets and proteomic-genomic correlations. Cancer Res. 2014, 74, 818–828. [Google Scholar] [CrossRef] [PubMed]
- Masuda, M.; Chen, W.Y.; Miyanaga, A.; Nakamura, Y.; Kawasaki, K.; Sakuma, T.; Ono, M.; Chen, C.L.; Honda, K.; Yamada, T. Alternative mammalian target of rapamycin (mTOR) signal activation in sorafenib-resistant hepatocellular carcinoma cells revealed by array-based pathway profiling. Mol. Cell Proteom. 2014, 13, 1429–1438. [Google Scholar] [CrossRef] [PubMed]
- Patti, G.J.; Yanes, O.; Siuzdak, G. Innovation: Metabolomics: The apogee of the omics trilogy. Nat. Rev. Mol. Cell Biol. 2012, 13, 263–269. [Google Scholar] [CrossRef] [PubMed]
- Zhang, A.; Sun, H.; Yan, G.; Wang, P.; Han, Y.; Wang, X. Metabolomics in diagnosis and biomarker discovery of colorectal cancer. Cancer Lett. 2014, 345, 17–20. [Google Scholar] [CrossRef] [PubMed]
- Brown, D.G.; Rao, S.; Weir, T.L.; O’Malia, J.; Bazan, M.; Brown, R.J.; Ryan, E.P. Metabolomics and metabolic pathway networks from human colorectal cancers, adjacent mucosa, and stool. Cancer Metab. 2016, 4, 11. [Google Scholar] [CrossRef] [PubMed]
- Wishart, D.S.; Feunang, Y.D.; Marcu, A.; Guo, A.C.; Liang, K.; Vazquez-Fresno, R.; Sajed, T.; Johnson, D.; Li, C.; Karu, N.; et al. HMDB 4.0: The human metabolome database for 2018. Nucleic Acids Res. 2018, 46, D608–D617. [Google Scholar] [CrossRef] [PubMed]
- Chen, W.L.; Wang, J.H.; Zhao, A.H.; Xu, X.; Wang, Y.H.; Chen, T.L.; Li, J.M.; Mi, J.Q.; Zhu, Y.M.; Liu, Y.F.; et al. A distinct glucose metabolism signature of acute myeloid leukemia with prognostic value. Blood 2014, 124, 1645–1654. [Google Scholar] [CrossRef] [PubMed] [Green Version]
- Chaturvedi, A.; Araujo Cruz, M.M.; Jyotsana, N.; Sharma, A.; Yun, H.; Gorlich, K.; Wichmann, M.; Schwarzer, A.; Preller, M.; Thol, F.; et al. Mutant IDH1 promotes leukemogenesis in vivo and can be specifically targeted in human AML. Blood 2013, 122, 2877–2887. [Google Scholar] [CrossRef] [PubMed] [Green Version]
- Zhang, Y.; He, C.; Qiu, L.; Wang, Y.; Qin, X.; Liu, Y.; Li, Z. Serum unsaturated free fatty acids: A potential biomarker panel for early-stage detection of colorectal cancer. J. Cancer 2016, 7, 477–483. [Google Scholar] [CrossRef] [PubMed]
- Locasale, J.W.; Grassian, A.R.; Melman, T.; Lyssiotis, C.A.; Mattaini, K.R.; Bass, A.J.; Heffron, G.; Metallo, C.M.; Muranen, T.; Sharfi, H.; et al. Phosphoglycerate dehydrogenase diverts glycolytic flux and contributes to oncogenesis. Nat. Genet. 2011, 43, 869–874. [Google Scholar] [CrossRef] [PubMed] [Green Version]
- Giskeodegard, G.F.; Bertilsson, H.; Selnaes, K.M.; Wright, A.J.; Bathen, T.F.; Viset, T.; Halgunset, J.; Angelsen, A.; Gribbestad, I.S.; Tessem, M.B. Spermine and citrate as metabolic biomarkers for assessing prostate cancer aggressiveness. PLoS ONE 2013, 8, e62375. [Google Scholar] [CrossRef] [PubMed] [Green Version]
- Mayers, J.R.; Wu, C.; Clish, C.B.; Kraft, P.; Torrence, M.E.; Fiske, B.P.; Yuan, C.; Bao, Y.; Townsend, M.K.; Tworoger, S.S.; et al. Elevation of circulating branched-chain amino acids is an early event in human pancreatic adenocarcinoma development. Nat. Med. 2014, 20, 1193–1198. [Google Scholar] [CrossRef] [PubMed] [Green Version]
- Guzzi, P.H.; Milenkovic, T. Survey of local and global biological network alignment: The need to reconcile the two sides of the same coin. Brief. Bioinform. 2018, 19, 472–481. [Google Scholar] [CrossRef] [PubMed]
- Hofree, M.; Shen, J.P.; Carter, H.; Gross, A.; Ideker, T. Network-based stratification of tumor mutations. Nat. Methods 2013, 10, 1108–1115. [Google Scholar] [CrossRef] [PubMed] [Green Version]
- Zhang, W.; Ota, T.; Shridhar, V.; Chien, J.; Wu, B.; Kuang, R. Network-based survival analysis reveals subnetwork signatures for predicting outcomes of ovarian cancer treatment. PLoS Comput. Biol. 2013, 9, e1002975. [Google Scholar] [CrossRef] [PubMed]
- Przytycki, P.F.; Singh, M. Differential analysis between somatic mutation and germline variation profiles reveals cancer-related genes. Genome Med. 2017, 9, 79. [Google Scholar] [CrossRef] [PubMed]
- Guzzi, P.H.; Di Martino, M.T.; Tagliaferri, P.; Tassone, P.; Cannataro, M. Analysis of miRNA, mRNA, and TF interactions through network-based methods. EURASIP J. Bioinform. Syst. Biol. 2015, 2015, 4. [Google Scholar] [CrossRef] [PubMed]
- Yan, Z.; Shah, P.K.; Amin, S.B.; Samur, M.K.; Huang, N.; Wang, X.; Misra, V.; Ji, H.; Gabuzda, D.; Li, C. Integrative analysis of gene and miRNA expression profiles with transcription factor-miRNA feed-forward loops identifies regulators in human cancers. Nucleic Acids Res. 2012, 40, e135. [Google Scholar] [CrossRef] [PubMed]
- Agarwal, V.; Bell, G.W.; Nam, J.W.; Bartel, D.P. Predicting effective microRNA target sites in mammalian mRNAs. Elife 2015, 4. [Google Scholar] [CrossRef] [PubMed] [Green Version]
- Bisognin, A.; Sales, G.; Coppe, A.; Bortoluzzi, S.; Romualdi, C. MAGIA(2): From miRNA and genes expression data integrative analysis to microRNA-transcription factor mixed regulatory circuits (2012 update). Nucleic Acids Res. 2012, 40, W13–W21. [Google Scholar] [CrossRef] [PubMed]
- Huang, G.T.; Athanassiou, C.; Benos, P.V. mirConnX: Condition-specific mRNA-microRNA network integrator. Nucleic Acids Res. 2011, 39, W416–W423. [Google Scholar] [CrossRef] [PubMed]
- Afshar, A.S.; Xu, J.; Goutsias, J. Integrative identification of deregulated miRNA/TF-mediated gene regulatory loops and networks in prostate cancer. PLoS ONE 2014, 9, e100806. [Google Scholar] [CrossRef] [PubMed]
- Forsberg, E.M.; Huan, T.; Rinehart, D.; Benton, H.P.; Warth, B.; Hilmers, B.; Siuzdak, G. Data processing, multi-omic pathway mapping, and metabolite activity analysis using XCMS Online. Nat. Protoc. 2018, 13, 633–651. [Google Scholar] [CrossRef] [PubMed] [Green Version]
- Ruffalo, M.; Koyuturk, M.; Sharan, R. Network-Based Integration of Disparate Omic Data to Identify “Silent Players” in Cancer. PLoS Comput. Biol. 2015, 11, e1004595. [Google Scholar] [CrossRef] [PubMed]
- Ru, B.; Tong, Y.; Zhang, J. MR4Cancer: A web server prioritizing master regulators for cancer. Bioinformatics 2018. [Google Scholar] [CrossRef] [PubMed]
- Krempel, R.; Kulkarni, P.; Yim, A.; Lang, U.; Habermann, B.; Frommolt, P. Integrative analysis and machine learning on cancer genomics data using the Cancer Systems Biology Database (CancerSysDB). BMC Bioinform. 2018, 19, 156. [Google Scholar] [CrossRef] [PubMed]
- Baek, S.J.; Yang, S.; Kang, T.W.; Park, S.M.; Kim, Y.S.; Kim, S.Y. MENT: Methylation and expression database of normal and tumor tissues. Gene 2013, 518, 194–200. [Google Scholar] [CrossRef] [PubMed]
- Diez-Villanueva, A.; Mallona, I.; Peinado, M.A. Wanderer, an interactive viewer to explore DNA methylation and gene expression data in human cancer. Epigenetics Chromatin 2015, 8, 22. [Google Scholar] [CrossRef] [PubMed]
- Deng, G.; Yang, J.; Zhang, Q.; Xiao, Z.X.; Cai, H. MethCNA: A database for integrating genomic and epigenomic data in human cancer. BMC Genom. 2018, 19, 138. [Google Scholar] [CrossRef] [PubMed]
- Cancer Genome Atlas Network. Comprehensive molecular portraits of human breast tumours. Nature 2012, 490, 61–70. [Google Scholar] [CrossRef] [PubMed] [Green Version]
- Tomczak, K.; Czerwinska, P.; Wiznerowicz, M. The Cancer Genome Atlas (TCGA): An immeasurable source of knowledge. Contemp. Oncol. (Pozn) 2015, 19, A68–A77. [Google Scholar] [CrossRef] [PubMed]
- Akbani, R.; Ng, P.K.; Werner, H.M.; Shahmoradgoli, M.; Zhang, F.; Ju, Z.; Liu, W.; Yang, J.Y.; Yoshihara, K.; Li, J.; et al. A pan-cancer proteomic perspective on The Cancer Genome Atlas. Nat. Commun. 2014, 5, 3887. [Google Scholar] [CrossRef] [PubMed] [Green Version]
- Hoadley, K.A.; Yau, C.; Wolf, D.M.; Cherniack, A.D.; Tamborero, D.; Ng, S.; Leiserson, M.D.M.; Niu, B.; McLellan, M.D.; Uzunangelov, V.; et al. Multiplatform analysis of 12 cancer types reveals molecular classification within and across tissues of origin. Cell 2014, 158, 929–944. [Google Scholar] [CrossRef] [PubMed]
- Zhu, B.; Song, N.; Shen, R.; Arora, A.; Machiela, M.J.; Song, L.; Landi, M.T.; Ghosh, D.; Chatterjee, N.; Baladandayuthapani, V.; et al. Integrating clinical and multiple omics data for prognostic assessment across human cancers. Sci. Rep. 2017, 7, 16954. [Google Scholar] [CrossRef] [PubMed]
- Koplev, S.; Lin, K.; Dohlman, A.B.; Ma’ayan, A. Integration of pan-cancer transcriptomics with RPPA proteomics reveals mechanisms of epithelial-mesenchymal transition. PLoS Comput. Biol. 2018, 14, e1005911. [Google Scholar] [CrossRef] [PubMed]
- Snyder, A.; Nathanson, T.; Funt, S.A.; Ahuja, A.; Buros Novik, J.; Hellmann, M.D.; Chang, E.; Aksoy, B.A.; Al-Ahmadie, H.; Yusko, E.; et al. Contribution of systemic and somatic factors to clinical response and resistance to PD-L1 blockade in urothelial cancer: An exploratory multi-omic analysis. PLoS Med. 2017, 14, e1002309. [Google Scholar] [CrossRef] [PubMed]
- Mancikova, V.; Montero-Conde, C.; Perales-Paton, J.; Fernandez, A.; Santacana, M.; Jodkowska, K.; Inglada-Perez, L.; Castelblanco, E.; Borrego, S.; Encinas, M.; et al. Multilayer OMIC data in medullary thyroid carcinoma identifies the STAT3 pathway as a potential therapeutic target in RET(M918T) tumors. Clin. Cancer Res. 2017, 23, 1334–1345. [Google Scholar] [CrossRef] [PubMed]
- Piccolo, S.R.; Hoffman, L.M.; Conner, T.; Shrestha, G.; Cohen, A.L.; Marks, J.R.; Neumayer, L.A.; Agarwal, C.A.; Beckerle, M.C.; Andrulis, I.L.; et al. Integrative analyses reveal signaling pathways underlying familial breast cancer susceptibility. Mol. Syst. Biol. 2016, 12, 860. [Google Scholar] [CrossRef] [PubMed]
- Robles, A.I.; Harris, C.C. Integration of multiple “OMIC” biomarkers: A precision medicine strategy for lung cancer. Lung Cancer 2017, 107, 50–58. [Google Scholar] [CrossRef] [PubMed] [Green Version]
- Li, Z.; Liu, H.; Niu, Z.; Zhong, W.; Xue, M.; Wang, J.; Yang, F.; Zhou, Y.; Zhou, Y.; Xu, T.; et al. Temporal proteomic analysis of pancreatic β-cells in response to lipotoxicity and glucolipotoxicity. Mol. Cell. Proteom. 2018. [Google Scholar] [CrossRef] [PubMed]
- Di Martino, M.T.; Guzzi, P.H.; Caracciolo, D.; Agnelli, L.; Neri, A.; Walker, B.A.; Morgan, G.J.; Cannataro, M.; Tassone, P.; Tagliaferri, P. Integrated analysis of microRNAs, transcription factors and target genes expression discloses a specific molecular architecture of hyperdiploid multiple myeloma. Oncotarget 2015, 6, 19132–19147. [Google Scholar] [CrossRef] [PubMed] [Green Version]


| Data Type | Main Platforms | Applications | |
|---|---|---|---|
| Genomic | Microarray | Array-CGH | Identification of CNVs |
| SNP-array Array-CGH + SNP | Identification of CNVs, copy neutral of LOH, SNPs genotyping in defined sequences | ||
| DNA-seq | WES | Identification of DNA mutations and CNVs | |
| WGS | |||
| Targeted exon-seq | |||
| Epigenomic | Affinity enrichment-based methods | MeDip-Seq | DNA-methylation profiling |
| MBD-Seq | |||
| Bisulfite conversion-based methods | BS-Seq | ||
| OxBS-Seq | |||
| Capture-based methods | |||
| Restriction enzymes-based methods | |||
| ChIP-Seq | Identification of chromatin-associated proteins | ||
| MNase-Seq | Investigation of chromatin accessibility | ||
| ATAC-Seq | |||
| DNase Il-Sseq | |||
| 4C-Seq | Investigation of the 3D structure of the genome | ||
| HiC-Seq | |||
| Transcriptomic | Microarray | Quantification of a wide set of defined sequences simultaneously | |
| RNA-Seq | Detection and quantification of theoretically all RNA sequences including lncRNAs and microRNAs | ||
| Proteomic | LC–MS/MS | Analysis of complex protein mixtures with high sensitivity | |
| MALDI-TOF/TOF MS | |||
| ICAT | Labeled proteins quantification | ||
| SILAC | |||
| iTRAQ | |||
| X-ray crystallography | Identification of the 3D structure of proteins | ||
| NMR | |||
| RPPA | Quantification of either total proteins or post-translationally modified proteins | ||
| Metabolomic | NMR | Discrimination of metabolic markers | |
| MS | Analysis of complex metabolite mixtures with high sensitivity | ||
© 2018 by the authors. Licensee MDPI, Basel, Switzerland. This article is an open access article distributed under the terms and conditions of the Creative Commons Attribution (CC BY) license (http://creativecommons.org/licenses/by/4.0/).
Share and Cite
Gallo Cantafio, M.E.; Grillone, K.; Caracciolo, D.; Scionti, F.; Arbitrio, M.; Barbieri, V.; Pensabene, L.; Guzzi, P.H.; Di Martino, M.T. From Single Level Analysis to Multi-Omics Integrative Approaches: A Powerful Strategy towards the Precision Oncology. High-Throughput 2018, 7, 33. https://doi.org/10.3390/ht7040033
Gallo Cantafio ME, Grillone K, Caracciolo D, Scionti F, Arbitrio M, Barbieri V, Pensabene L, Guzzi PH, Di Martino MT. From Single Level Analysis to Multi-Omics Integrative Approaches: A Powerful Strategy towards the Precision Oncology. High-Throughput. 2018; 7(4):33. https://doi.org/10.3390/ht7040033
Chicago/Turabian StyleGallo Cantafio, Maria Eugenia, Katia Grillone, Daniele Caracciolo, Francesca Scionti, Mariamena Arbitrio, Vito Barbieri, Licia Pensabene, Pietro Hiram Guzzi, and Maria Teresa Di Martino. 2018. "From Single Level Analysis to Multi-Omics Integrative Approaches: A Powerful Strategy towards the Precision Oncology" High-Throughput 7, no. 4: 33. https://doi.org/10.3390/ht7040033
APA StyleGallo Cantafio, M. E., Grillone, K., Caracciolo, D., Scionti, F., Arbitrio, M., Barbieri, V., Pensabene, L., Guzzi, P. H., & Di Martino, M. T. (2018). From Single Level Analysis to Multi-Omics Integrative Approaches: A Powerful Strategy towards the Precision Oncology. High-Throughput, 7(4), 33. https://doi.org/10.3390/ht7040033