Abstract
Background/Objectives: We here describe the impact of navigated care on utilization patterns of pharmacologic and minimally invasive overactive bladder therapies. Methods: This retrospective observational cohort study used electronic medical record data from the Precision Point Specialty Analytics Portal in the United States. Eligible patients were adults (≥18 years) newly diagnosed and treated for non-neurogenic overactive bladder (1 January 2015 to 31 December 2019). Categorical endpoints were analyzed by chi-square test or Fisher exact test. Of 170,000 eligible patients, 8982 (≈5%) were randomly selected and stratified by navigation status (navigated: 1150 [12.8%]; non-navigated: 7832 [87.2%]). Results: Overall, 60.0% of patients were female, 69.9% were White, and 42.7% had Medicare coverage. Navigated care was more common among women, Black patients, and those covered by Medicaid/Medicare. Initial pharmacologic treatment rates were similar between navigated and non-navigated groups (anticholinergic: 57.0% vs. 57.4%; beta-3 agonist: 43.0% vs. 42.6%). Greater percentages of navigated versus non-navigated patients received minimally invasive therapy (23.8% vs. 10.8%, respectively; p < 0.0001). Discontinuation rates were lower for navigated versus non-navigated patients undergoing pharmacologic treatment (62.5% vs. 71.3%; p < 0.0001). Conclusions: Patient navigation for overactive bladder may help increase access to minimally invasive therapies and may be a tool to address treatment disparities.
1. Introduction
Overactive bladder (OAB) is a common condition characterized by urinary urgency, frequency, and nocturia, with or without urgency urinary incontinence (UUI), and with negative impacts on quality of life [1,2,3,4]. Although prevalence estimates vary widely, large population-based studies suggest that OAB affects approximately 15% to 40% of people in the United States, with a higher prevalence in women (30%) versus men (16%) [4,5]. OAB is commonly associated with UUI, and the prevalence of OAB with UUI and mixed urinary incontinence (UI) reportedly increases with age and varies by race [6,7,8]. In a large population-based US study, the prevalence of OAB with UUI among women was 9-fold higher in the 65- to 74-year versus the 18- to 24-year age group [4,9]. In a recent US study, UUI prevalence was higher in non-Hispanic Black women (18%) compared with other race/ethnic groups (7% to 9%) [6].
OAB is often undertreated despite the availability of effective therapies [10,11]. Common treatments include noninvasive measures (e.g., bladder training, urge control strategies, pelvic floor muscle training, fluid management) and oral pharmacologic medications, including anticholinergics or beta-3 agonists [1,12]. However, many patients have an inadequate response or intolerance to oral medications [13,14], and treatment persistence is low (e.g., 32% to 44% 30-day persistence and 5% to 9% 1-year persistence in a US study [15]; 13.5% to 35% 1-year persistence in a UK study [16]). Minimally invasive therapy options include intradetrusor onabotulinumtoxinA, percutaneous tibial nerve stimulation (PTNS), or sacral nerve stimulation (SNS) [1,12], but fewer than 5% of patients with OAB and 10% of those treated by urology providers progress to these minimally invasive therapies [13]. This suggests a need for improved support, education, and information to help patients better understand and consider their therapy options. Patient navigator programs, designed to help coordinate care and reduce healthcare disparities, are increasingly being used across a range of chronic diseases [17,18,19]. There is broad variation in program types and definitions of a navigator, which may include trained nurses, social workers, other health workers, or lay persons [17,18]. Specifically, a navigator serves as an advocate for patients by guiding efforts to create an individualized care plan [17,18]. Patient navigators address fragmentation of care and information overload and promote shared decision-making throughout the treatment journey [19,20,21]. The current literature on effectiveness of navigation programs focuses on the process of receiving care; few studies assess the impact on clinical outcomes [17,18].
Navigation of care by a dedicated professional may help optimize treatment or help patients progress to therapies that optimize OAB symptom management. In a single-practice pilot study, use of a nurse navigator increased practice retention of patients with OAB by 21% and increased the number of patients receiving trials of 2 medications by 20%. Also, 24% of patients receiving navigated care opted for minimally invasive therapy [22]. In another single-practice study assessing a clinical care pathway (CCP) for OAB management that included nurse navigators, authors reported significant increases in follow-up visits, decreases in mean time to minimally invasive therapy, and increased minimally invasive therapy utilization after 12 months (from 11.1% before CCP implementation to 16.5% with the CCP in place) [23]. However, limited information currently exists regarding real-world access to navigation and its impact on utilization patterns of pharmacologic and minimally invasive OAB therapies in a diverse national cohort of patients with OAB. The current study aimed to describe real-world demographic data and pharmacologic and minimally invasive therapy adherence and utilization rates for patients with OAB who received navigated care compared with those who did not.
2. Materials and Methods
2.1. Study Design
This retrospective observational cohort study (NCT03052764) used data from the Precision Point Specialty (PPS) Analytics Portal for OAB, extracted from electronic medical record data for more than 90 community-based urology practices in the United States that provide care to over 2.4 million patients with OAB. Data were de-identified, and the protocol was approved by an institutional review board. This study was conducted in accordance with the Strengthening the Reporting of Observational Studies in Epidemiology (STROBE) guidelines.
2.2. Inclusion and Exclusion Criteria
Newly diagnosed adults (≥18 years) treated for non-neurogenic OAB between 1 January 2015 and 31 December 2019 were enrolled. In accordance with standards for establishing and confirming a diagnosis over time in the real-world setting, patients were required to have ≥2 OAB medical visits ≥30 days apart [24]. Selection was based on International Classification of Diseases, Ninth Revision, Clinical Modification (ICD-9-CM) and International Classification of Diseases, Tenth Revision, Clinical Modification (ICD-10-CM) procedure codes (Appendix A Table A1). Patients were excluded if they had OAB symptoms associated with a neurologic condition, had a history of chronic urinary retention treated with intermittent catheterization or an indwelling catheter, had interstitial cystitis or cystitis after radiation treatment, or were pregnant.
2.3. Sample Size
A random sample from the PPS Analytics Portal showed that the ratio of non-navigated to navigated patients in the database was 7:1, and that approximately 5% of patients in the non-navigated group and 10% in the navigated group received onabotulinumtoxinA. To enable the meaningful analysis of each study endpoint and to compensate for potential missing data in the electronic medical records database, it was estimated that ≥120 patients treated with onabotulinumtoxinA in the navigated group would be needed. To meet this target, a total of 9000 (≈5%) patients were randomly selected from the database and stratified by navigation status. Eighteen patients did not have a clear diagnosis code for OAB and were thus excluded from the analysis, yielding an overall analysis population of 8982 patients.
2.4. Definition of Treatment Navigation
Treatment navigator was defined as any healthcare personnel focused on patient needs and guidance through the OAB clinical pathway. Patients were considered “navigated” if they had been assigned to a navigator list and the navigator had initiated care through notes or action items in their charts. Patients not on a navigator list or those on a navigator list without notes or action items were classified as “non-navigated”.
2.5. Outcomes
Outcomes analyzed in the navigated and non-navigated groups included patient demographics and geographic distribution, rates and types of initial pharmacologic OAB treatment, rates of switching or discontinuing pharmacologic treatment, and time to discontinuation of pharmacologic treatment. Discontinuation was defined as the date a patient stopped using an OAB therapy, identified through provider or navigator notes, when a patient began treatment for a different OAB therapy without evidence of continuing the prior treatment, or when a patient did not meet the definition for therapy adherence. Discontinuation by treatment type is defined in Appendix A. The primary endpoint was the rate of progression to minimally invasive therapy with onabotulinumtoxinA for OAB. Other endpoints included types of minimally invasive therapy and time to initiation of onabotulinumtoxinA.
2.6. Covariates
We examined key covariates, including age, sex, race and ethnicity, insurance type, practice size, and Medicare region (Medicare regions are depicted in Appendix A Figure A1) [25].
2.7. Statistical Analysis
Primary and secondary objectives were evaluated using univariate and multivariate analyses. Categorical parameters were compared using chi-square test or Fisher exact test. For continuous parameters, comparisons used a Student t test or Mann–Whitney U test. Comparisons of time-to-event data between navigated and non-navigated patients utilized a log-rank test with 2-sided p value, with time-to-event curves estimated using Kaplan–Meier analysis. p values less than 0.05 were considered statistically significant. A post hoc analysis evaluated time to any initial minimally invasive therapy since the date of OAB diagnosis using Cox multivariable regression analysis. For the time-to-event analyses, the time period was truncated to 60 months, as the sample sizes of the “at-risk” cohorts at or after that time point were generally n = 10 or less, and such small numbers could lead to unstable estimates. Statistical analyses were performed using R (version 4.2.0 or greater; The R Foundation), RStudio (version 1.2.5033; RStudio, Inc., Boston, MA, USA), and Python (version 3.8.3; Python Software Foundation, Wilmington, DE, USA).
3. Results
3.1. Patients
Of 8982 randomly selected patients with OAB (from 170,000 in the database meeting inclusion criteria), 1150 (12.8%) received navigated care and 7832 (87.2%) did not. Initial International Classification of Diseases, Ninth Revision (ICD-9)/International Classification of Diseases, Tenth Revision (ICD-10) codes by study group are presented in Appendix A Table A1. Mean age was 63.5 years, 60.0% of patients were female, 69.9% identified in the database as White, and 42.7% were covered by Medicare (Table 1). Proportions of patients receiving navigated care were highest for women, Black patients, and those with Medicaid or Medicare coverage versus private or other insurance (all p < 0.0001; Table 1). The highest proportions of patients received navigated care in the Philadelphia (25.3%) and Chicago (23.5%) Medicare regions (p < 0.0001; Table 1). Proportions of patients receiving navigated care increased with increasing practice sizes (<6 clinicians: 7.1%; >50 clinicians: 30.3%; Table 1). The mean (SD) follow-up observation period was 25.0 (15.4) months (median [25th–75th percentile]: 23.3 [12.4, 36.6]) for navigated patients and 30.0 (17.0) months (median [25th–75th percentile]: 29.7 [14.9, 44.9]) for non-navigated patients (p < 0.0001).

Table 1.
Patient Demographics in the Overall Population and by Navigation Status.
3.2. Utilization of Pharmacologic Therapies
A total of 95.8% of patients (n = 8606) received oral pharmacologic OAB treatment, with 57.4% receiving an anticholinergic and 42.6% a beta-3 agonist (Appendix A Table A2). Initial medication types did not differ by navigation status (Appendix A Table A2). Overall, 27.9% of patients (n = 2502) received combination pharmacologic treatments, with a higher proportion for navigated versus non-navigated patients (34.6% vs. 26.9%; p < 0.0001). Higher proportions of navigated patients received 2 or ≥3 medications versus non-navigated patients (Figure 1).
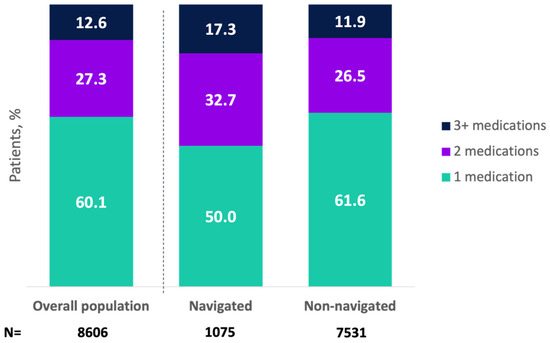
Figure 1.
Total number of pharmacologic treatments received for overactive bladder in the overall population and by navigation status (among patients receiving pharmacologic treatment). Mean (SD) number of pharmacologic medications was 1.7 (0.9) (median [25th–75th percentile]: 2.0 [1.0, 2.0]) for navigated patients and 1.5 (0.8) (median [25th–75th percentile]: 1.0 [1.0, 2.0]) for non-navigated patients (p < 0.0001). These data represent sequential lines of therapy but do not exclude combination treatments.
Among patients receiving pharmacologic OAB treatment, 9.0% switched from initial medication (i.e., starting another pharmacologic treatment within 30 days of discontinuing initial therapy), with no difference between navigated and non-navigated patients (Appendix A Table A2). In the overall population, 70.2% of patients who received pharmacologic OAB treatment discontinued initial medication; discontinuation rate was lower for navigated versus non-navigated patients (62.5% vs. 71.3%; p < 0.0001; Appendix A Table A2). Using Kaplan–Meier analysis (Appendix A Figure A2), the median time to discontinuation of initial pharmacologic therapy was longer for navigated patients (median, months [95% CI], 12.8 [10.9, 13.6]) than for non-navigated patients (median, 8.3 [7.9, 8.9]; p < 0.0001).
3.3. Utilization of Minimally Invasive Therapies
Overall, 1122 (12.5%) progressed to a minimally invasive therapy for OAB, with greater percentages of navigated patients versus non-navigated patients receiving minimally invasive therapy (23.8% vs. 10.8%, respectively; p < 0.0001; Figure 2). As an initial minimally invasive therapy, 5.1% of patients received onabotulinumtoxinA (navigated: 9.0%; non-navigated: 4.6%; p < 0.0001), 3.4% received PTNS (navigated: 5.3%; non-navigated: 3.2%; p = 0.0009), and 3.9% received SNS (navigated: 9.6%; non-navigated: 3.1%; p < 0.0001). In the analysis of the primary endpoint, 517 patients (5.8%) received onabotulinumtoxinA as minimally invasive therapy overall, and this percentage was significantly higher for navigated versus non-navigated patients (10.5% vs. 5.1%; p < 0.0001; Appendix A Figure A3).
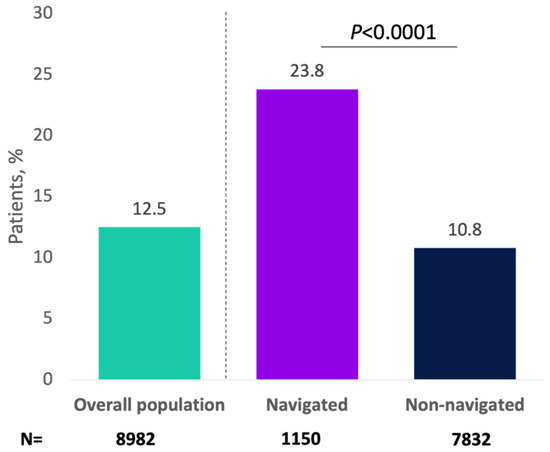
Figure 2.
Patients receiving minimally invasive therapy for overactive bladder by navigation status.
Combination pharmacologic and minimally invasive OAB therapies were received by 510 patients (5.7%), with a higher percentage in the navigated versus non-navigated group (11.2% vs. 4.9%; p < 0.0001). Kaplan–Meier analysis demonstrated a shorter time to initiation of minimally invasive therapy for OAB in navigated versus non-navigated patients; at 54 months, probability of initiating a minimally invasive therapy was 40% for the navigated group and 14% for the non-navigated group (Appendix A Figure A4).
In a post hoc multivariable analysis, receiving navigated care, older age, female sex, Medicare insurance, and living in the San Francisco Medicare region increased the likelihood of progression to minimally invasive therapy (Table 2). Receiving care from a large (26–50 providers) or extra-large (≥51 providers) practice, living in the Chicago Medicare region, and Asian race reduced the likelihood of progression to minimally invasive therapy.
Table 2.
Time to Any Initial Minimally Invasive Therapy from Date of OAB Diagnosis; Cox Multivariable Regression Analysis.
4. Discussion
This retrospective analysis of a large national database evaluated the impact of treatment navigation on utilization of pharmacologic and minimally invasive therapy for OAB in real-world practice and included data from 9000 patients. Although many patients with OAB would benefit from minimally invasive therapy due to inadequate response or intolerance to prior treatment, OAB remains undertreated [11,13,14]. Acknowledging the substantial impact of OAB symptoms on depression, anxiety, and quality of life [4,26,27], there is a need to support patients throughout the clinical pathway, incorporating shared decision-making [28], until adequate symptoms control is achieved. These study findings indicate higher proportions of patients under navigated care transitioned to minimally invasive OAB therapy, highlighting the important role of tailored patient support in ensuring consistent access to effective therapy throughout the course of treatment for this chronic condition.
Although the majority (>80%) of patients did not have a treatment navigator, the sociodemographic diversity in the navigated group was an unexpected finding, as 13.0% of the patients identifying as White, 18.2% of those identifying as Black, and 14.3% as Asian received navigated care; similarly, 20.7% of those patients on Medicaid, 14.7% of those on Medicare, and 11.0% of patients with private insurance were navigated. Considering that some of these subgroups correspond to traditionally marginalized or vulnerable populations [29], these findings suggest that patient navigation is already being utilized and holds significant potential to positively impact those patients who need it the most. However, race was unknown for 16% of patients and 24% were missing insurance data, which limits the ability to definitively draw conclusions about these findings. There were also variations in navigation status by geographic region and by practice size. For example, approximately a quarter of patients in larger practices (>26 physicians) received navigated care compared with less than 10% of patients in smaller practices (≤25 physicians); also, approximately 25% of patients from practices in Philadelphia and Chicago received navigated care, which was higher than in other regions. It is possible that larger practices and some areas of the country have greater access to healthcare resources, including treatment navigation. However, in larger practices and some regions (e.g., Philadelphia and Chicago) that had higher rates of navigated care, the likelihood of receiving minimally invasive OAB therapy was lower. These observations may reflect factors that could not be discerned from the available data and warrant further exploration. Moreover, the Precision Point Specialty Analytics Portal consists of data from community practices and does not capture data on patient navigation in academic centers, which may have contributed to regional differences in rates of navigated care and prescribing patterns.
Sociodemographic factors are important because they influence the likelihood of OAB therapy utilization [29,30,31]. In a commercially insured cohort, Syan et al. found that White and higher-income patients were more likely to progress to minimally invasive therapies than other groups [29]. Potential underlying factors were noted in an observational cohort study of women with urinary incontinence [32]. Duralde et al. found that Black and Asian women, as well as lower-income patients, were less likely to be offered surgical management for urinary incontinence [32]. Whereas the underlying causes of these observed differences are multifactorial, it appears that navigated status may have helped reduce disparities in minimally invasive therapy use for some historically marginalized sociodemographic groups in our study, including Black and Medicaid patients. However, it is important to recognize race and ethnicity as social constructs without biological basis but more often indicative of structural inequities. Barriers to therapy for these groups are complex and include lack of knowledge, dissatisfaction with frequency and quality of communication with providers, poor rapport with providers, negative experiences, scheduling challenges, and lack of culturally sensitive language to varying degrees [33]. Patient navigation may offer the support needed to address these barriers. Additional studies are needed to assess the role of patient navigators in addressing the barriers patients face in real-world clinical practice and the resources necessary to support an effective patient navigator program.
A strength of this study was that it used a large (N = 8982), diverse, geographically varied, randomly selected sample of patients with OAB to assess current practice patterns and impact of navigation on treatment utilization. Prior, smaller studies, which reported the experiences of single clinical practices with navigation programs for patients with OAB, found increased patient retention to the practice and follow-up, as well as increased utilization of minimally invasive therapies, using navigated care [22,23]. Although it is not feasible to make direct comparisons with these smaller studies, this analysis expands our understanding of the impact of patient navigation in OAB care in a broader population.
Whereas this retrospective database analysis incorporated data from multiple clinical centers, it did not include information on treatment navigation patient selection or protocols. A significant difference in sample sizes between the navigated and non-navigated groups was observed, raising the potential for sampling bias. Additionally, this analysis did not assess the total number of US practices that provided patient navigation, and the definition of navigated care is not standardized across practices. Thus, variability in navigation protocols could limit the generalizability of the findings. However, patient-centered care with additional support appeared to improve utilization and adherence regardless of specific navigation protocols. Notably, the database lacked consistent reporting of ethnicity, posing a challenge for the assessment of Hispanic patients. As they were not prespecified endpoints, this study did not assess objective outcomes regarding the clinical effectiveness or functional outcomes of OAB treatments (such as symptom improvement, quality of life, patient-reported outcomes) or patient satisfaction. Further research is warranted to establish the clinical significance and cost–benefit implications of navigated care. Because standardized clinical outcomes were not readily available in the database, additional studies will need to be conducted. Additionally, reasons for treatment discontinuation or loss to follow-up were not identified, and the significantly longer follow-up time observed in the non-navigated group may have introduced bias in analyses of time to discontinuation of the initial pharmacologic therapy, as patients in the navigated group may not have been followed up for long enough to observe the outcome. Intergroup comparisons between navigated and non-navigated populations may have been confounded by between-group differences in sample size and baseline characteristics, such as severity of OAB and rates of urgency UI. In the post hoc multivariable analysis of time to any initial minimally invasive therapy, sample sizes were small for some groups, which limited interpretation. The proportion of navigated patients may not have been accurately estimated across smaller practices with low patient counts (<11 patients). Also, prescribing patterns may have evolved since the study was conducted (2015–2019) due to the approval of new drug treatment for OAB [34].
5. Conclusions
This analysis of a large national database suggests that access to navigated care can increase patients’ treatment progression to minimally invasive OAB therapy and has the potential to decrease treatment discontinuation and help address disparities in OAB care. This study may aid efforts to increase support for patients with OAB or the availability of patient navigators in clinical practices.
Author Contributions
Conceptualization: E.E., R.S. and M.N.; Data curation: M.N., K.B.I. and M.S.; Formal analysis: M.S., M.N. and K.B.I.; Roles/Writing—original draft: E.E., M.N., K.B.I. and R.S.; Writing—review & editing: All authors. All authors have read and agreed to the published version of the manuscript.
Funding
AbbVie funded this study. No honoraria or payments were made for authorship.
Institutional Review Board Statement
Data were de-identified, and the study protocol was declared exempt from institutional review board oversight by an institutional review board (Advarra®).
Informed Consent Statement
Not applicable.
Data Availability Statement
All authors had access to relevant data and participated in the drafting, review, and approval of this publication. AbbVie is committed to responsible data sharing regarding the clinical trials we sponsor. This includes access to anonymized, individual, and trial-level data (analysis data sets), as well as other information (e.g., protocols, clinical study reports, or analysis plans), as long as the trials are not part of an ongoing or planned regulatory submission. This includes requests for clinical trial data for unlicensed products and indications. These clinical trial data can be requested by any qualified researchers who engage in rigorous, independent, scientific research, and will be provided following review and approval of a research proposal, Statistical Analysis Plan (SAP), and execution of a Data Sharing Agreement (DSA). Data requests can be submitted at any time after approval in the US and Europe and after acceptance of this manuscript for publication. The data will be accessible for 12 months, with possible extensions considered. For more information on the process or to submit a request, visit the following link: https://vivli.org/ourmember/abbvie/, then select “Home”.
Acknowledgments
The authors wish to thank Amin Boroujerdi for initiating the study and providing input on the study design, Keely Madaj from PPS Analytics for help with data analysis, and Krystal Anson-Spenta for assistance with research operations. Medical writing support was provided by Illyce Nuñez, Peloton Advantage, LLC, an OPEN Health company, and funded by AbbVie.
Conflicts of Interest
AbbVie funded this study and participated in the study design, research, analysis, data collection, interpretation of data, reviewing, and approval of the publication. Raveen Syan: no conflicts of interest to disclose. Jennifer Miles-Thomas: participated in a speaker’s bureau for AbbVie and Astellas and was a consultant for AbbVie. Nitya Abraham: participated in speaker’s bureaus for Urovant and DSMB Valencia. Diane K. Newman: serves as a consultant for Sumitomo Pharma America, Convatec, and COSM; serves as an editor for Digital Science Press; and has received grant/research support from the National Institutes of Health and Convatec Medical. Mariana Nelson: is an AbbVie employee and may hold AbbVie stock. Ekene Enemchukwu: served on research advisory board for Boston Scientific; served as a data and safety monitoring board chair for Valencia and has received grant/research support from the National Institutes of Health. Marc Schwartz: served as a biostatistical consultant for Allergan, an AbbVie company. Kimberly Becker Ifantides: is an AbbVie employee and owns stock.
Abbreviations
The following abbreviations are used in this manuscript:
| CCP | clinical care pathway |
| OAB | overactive bladder |
| PTNS | percutaneous tibial nerve stimulation |
| SNS | sacral nerve stimulation |
Appendix A
- Definitions of discontinuation and adherence by treatment type
Treatment discontinuation was defined as the date a patient discontinued use of an OAB therapy, identified through physician or navigator notes, when a patient begins treatment for a different OAB therapy without evidence of continuing the prior treatment, or when a patient does not meet the definition for therapy adherence.
- Treatment adherence was defined on the basis of treatment type:
- OnabotulinumtoxinA: Returning for retreatment within 12 months of initial treatment (index date on or before 31 December 2018)
- PTNS: Receiving 12 weekly treatment visits within 4 months of the first PTNS treatment with an additional 1-week window (index date on or before 3 September 2019)
- ○
- Completion of the first treatment cycle consisted of 12 treatments within 17 weeks of the treatment start date
- SNS: Not having the SNS implant removed during the study timeline
Table A1.
Initial ICD-9/ICD-10 Code by Navigation Status.
Table A1.
Initial ICD-9/ICD-10 Code by Navigation Status.
| Term | ICD-9 Code | ICD-10 Code | Overall Population (N = 8982) n (%) a | Navigated (n = 1150) n (%) a | Non-Navigated (n = 7832) n (%) a |
|---|---|---|---|---|---|
| Hypertonicity of bladder Urinary incontinence | 596.51 788.3 788.31 788.33 788.34 788.35 788.36 788.37 788.38 788.39 | 288 (3.2) 571 (6.4) | 82 (7.1) 145 (12.6) | 206 (2.6) 426 (5.4) | |
| Urinary frequency | 788.41 | 324 (3.6) | 43 (3.7) | 281 (3.6) | |
| Polyuria | 788.42 | R35.0, R35.1, R35.8 | 2565 (28.6) | 195 (17.0) | 2370 (30.3) |
| Nocturia | 788.43 | 225 (2.5) | 18 (1.6) | 207 (2.6) | |
| Urgency of urination | 788.63 | R39.15 | 2290 (25.5) | 303 (26.3) | 1987 (25.4) |
| Functional urinary incontinence | 788.91 | R39.81 | 23 (0.3) | 8 (0.7) | 15 (0.2) |
| Overactive bladder | N32.81 | 766 (8.5) | 111 (9.7) | 655 (8.4) | |
| Urge incontinence | N39.41 | 1026 (11.4) | 147 (12.8) | 879 (11.2) | |
| Incontinence without sensory awareness | N39.42 | 46 (0.5) | 5 (0.4) | 41 (0.5) | |
| Post-void dribbling | N39.43 | 11 (0.1) | 1 (0.1) | 10 (0.1) | |
| Nocturnal enuresis | N39.44 | 92 (1.0) | 3 (0.3) | 89 (1.1) | |
| Continuous leakage | N39.45 | 12 (0.1) | 1 (0.1) | 11 (0.1) | |
| Mixed incontinence | N39.46 | 715 (8.0) | 88 (7.7) | 627 (8.0) | |
| Other specified urinary incontinence | N39.49 N39.490 N39.498 | 28 (0.3) | 0 (0.0) | 28 (0.4) |
ICD-9, International Classification of Diseases, Ninth Revision; ICD-10, International Classification of Diseases, Tenth Revision. a Percentage based on the denominator of N or n for each column.
Table A2.
Utilization, Switching, and Discontinuation Rates of Pharmacologic Treatment for Overactive Bladder in the Overall Population and by Navigation Status.
Table A2.
Utilization, Switching, and Discontinuation Rates of Pharmacologic Treatment for Overactive Bladder in the Overall Population and by Navigation Status.
| Overall Population (N = 8982) | Navigated (n = 1150) | Non-Navigated (n = 7832) | |
|---|---|---|---|
| Patients receiving pharmacologic treatment, n | 8427 | 1070 | 7357 |
| Initial anticholinergic, n (%) a | 4835 (57.4) | 610 (57.0) | 4225 (57.4) |
| Initial beta-3 agonist, n (%) a | 3592 (42.6) | 460 (43.0) | 3132 (42.6) |
| Patients switching b from initial pharmacologic treatment, n (%) a | 772 (9.0) | 105 (9.8) p = 0.3283 c | 667 (8.9) |
| Patients discontinuing initial pharmacologic treatment, n (%) a | 6039 (70.2) | 672 (62.5) p < 0.0001 c | 5367 (71.3) |
a Percentage based on the number of patients who received initial pharmacologic treatment (N = 8606). b Switching defined as starting another pharmacologic treatment (within or between drug class) within 30 days of discontinuing initial pharmacologic treatment. c Navigated vs. non-navigated patients, chi-square test.

Figure A1.
Reference: US Department of Health and Human Services. HHS regional map. Available at: https://www.hhs.gov/about/agencies/iea/regional-offices/index.html. Accessed on 14 August 2024. Information from this website was used to create this image.
Figure A1.
Reference: US Department of Health and Human Services. HHS regional map. Available at: https://www.hhs.gov/about/agencies/iea/regional-offices/index.html. Accessed on 14 August 2024. Information from this website was used to create this image.


Figure A2.
Kaplan–Meier analysis of time to initial pharmacologic treatment discontinuation by navigation status. The solid lines are the Kaplan–Meier event-free probability estimates. The dashed lines are the 95% CIs. Non-navigated care median time (months) to event (95% CI): 8.28 (7.89, 8.9). Navigated care median time to event (months) (95% CI): 12.81 (10.91, 13.57).


Figure A3.
Patients receiving minimally invasive therapy with onabotulinumtoxinA for overactive bladder by navigation status.
Figure A3.
Patients receiving minimally invasive therapy with onabotulinumtoxinA for overactive bladder by navigation status.


Figure A4.
Kaplan–Meier analysis of time to initiation of any minimally invasive therapy from date of overactive bladder diagnosis, by navigation status. The solid lines are the Kaplan–Meier event-free probability estimates. The dashed lines are the 95% CIs. Probability of not initiating any minimally invasive therapy 54 months from date of overactive bladder diagnosis (95% CI): navigated care, 0.60 (0.54, 0.66); non-navigated care, 0.86 (0.85, 0.87); log-rank, p < 0.0001.

References
- Hutchinson, A.; Nesbitt, A.; Joshi, A.; Clubb, A.; Perera, M. Overactive bladder syndrome: Management and treatment options. Aust. J. Gen. Pract. 2020, 49, 593–598. [Google Scholar] [CrossRef]
- Irwin, D.E.; Milsom, I.; Hunskaar, S.; Reilly, K.; Kopp, Z.; Herschorn, S.; Coyne, K.; Kelleher, C.; Hampel, C.; Artibani, W.; et al. Population-based survey of urinary incontinence, overactive bladder, and other lower urinary tract symptoms in five countries: Results of the EPIC study. Eur. Urol. 2006, 50, 1306–1314; discussion 1314–1305. [Google Scholar] [CrossRef] [PubMed]
- Haylen, B.T.; de Ridder, D.; Freeman, R.M.; Swift, S.E.; Berghmans, B.; Lee, J.; Monga, A.; Petri, E.; Rizk, D.E.; Sand, P.K.; et al. An International Urogynecological Association (IUGA)/International Continence Society (ICS) joint report on the terminology for female pelvic floor dysfunction. Int. Urogynecol. J. 2010, 21, 5–26. [Google Scholar] [CrossRef]
- Stewart, W.F.; Van Rooyan, J.B.; Cundiff, G.W.; Abrams, P.; Herzog, A.R.; Corey, R.; Hunt, T.L.; Wein, A.J. Prevalence and burden of overactive bladder in the United States. World J. Urol. 2003, 20, 327–336. [Google Scholar] [CrossRef]
- Coyne, K.S.; Sexton, C.C.; Bell, J.A.; Thompson, C.L.; Dmochowski, R.; Bavendam, T.; Chen, C.I.; Quentin Clemens, J. The prevalence of lower urinary tract symptoms (LUTS) and overactive bladder (OAB) by racial/ethnic group and age: Results from OAB-POLL. Neurourol. Urodyn. 2013, 32, 230–237. [Google Scholar] [CrossRef]
- Lee, U.J.; Feinstein, L.; Ward, J.B.; Kirkali, Z.; Martinez-Miller, E.E.; Matlaga, B.R.; Kobashi, K.C. Prevalence of urinary incontinence among a nationally representative sample of women, 2005–2016: Findings from the Urologic Diseases in America Project. J. Urol. 2021, 205, 1718–1724. [Google Scholar] [CrossRef] [PubMed]
- Sze, E.H.; Jones, W.P.; Ferguson, J.L.; Barker, C.D.; Dolezal, J.M. Prevalence of urinary incontinence symptoms among black, white, and Hispanic women. Obstet. Gynecol. 2002, 99, 572–575. [Google Scholar] [PubMed]
- Thom, D.H.; van den Eeden, S.K.; Ragins, A.I.; Wassel-Fyr, C.; Vittinghof, E.; Subak, L.L.; Brown, J.S. Differences in prevalence of urinary incontinence by race/ethnicity. J. Urol. 2006, 175, 259–264. [Google Scholar] [CrossRef]
- Komesu, Y.M.; Schrader, R.M.; Ketai, L.H.; Rogers, R.G.; Dunivan, G.C. Epidemiology of mixed, stress, and urgency urinary incontinence in middle-aged/older women: The importance of incontinence history. Int. Urogynecol. J. 2016, 27, 763–772. [Google Scholar] [CrossRef]
- Herschorn, S. Global perspective of treatment failures. Can. Urological. Assoc. J. 2013, 7 (Suppl. S4), S170–S171. [Google Scholar] [CrossRef][Green Version]
- Helfand, B.T.; Evans, R.M.; McVary, K.T. A comparison of the frequencies of medical therapies for overactive bladder in men and women: Analysis of more than 7.2 million aging patients. Eur. Urol. 2010, 57, 586–591. [Google Scholar] [CrossRef]
- Gormley, E.A.; Lightner, D.J.; Burgio, K.L.; Chai, T.C.; Clemens, J.Q.; Culkin, D.J.; Das, A.K.; Foster, H.E.; Scarpero, H.M.; Tessier, C.D.; et al. Diagnosis and Treatment of Overactive Bladder (Non-Neurogenic) in Adults: AUA/SUFU Guideline: American Urological Association. 2019. Available online: https://www.auanet.org/guidelines-and-quality/guidelines (accessed on 19 February 2025).
- Moskowitz, D.; Adelstein, S.A.; Lucioni, A.; Lee, U.J.; Kobashi, K.C. Use of third line therapy for overactive bladder in a practice with multiple subspecialty providers—Are we doing enough? J. Urol. 2018, 199, 779–784. [Google Scholar] [CrossRef]
- Sussman, D.; Yehoshua, A.; Kowalski, J.; Lee, W.; Kish, J.; Chaudhari, S.; Murray, B. Adherence and persistence of mirabegron and anticholinergic therapies in patients with overactive bladder: A real-world claims data analysis. Int. J. Clin. Pract. 2017, 71, e12824. [Google Scholar] [CrossRef]
- Shaya, F.T.; Blume, S.; Gu, A.; Zyczynski, T.; Jumadilova, Z. Persistence with overactive bladder pharmacotherapy in a Medicaid population. Am. J. Manag. Care 2005, 11 (Suppl. S4), S121–S129. [Google Scholar]
- Wagg, A.; Compion, G.; Fahey, A.; Siddiqui, E. Persistence with prescribed antimuscarinic therapy for overactive bladder: A UK experience. BJU Int. 2012, 110, 1767–1774. [Google Scholar] [CrossRef] [PubMed]
- McBrien, K.A.; Ivers, N.; Barnieh, L.; Bailey, J.J.; Lorenzetti, D.L.; Nicholas, D.; Tonelli, M.; Hemmelgarn, B.; Lewanczuk, R.; Edwards, A.; et al. Patient navigators for people with chronic disease: A systematic review. PLoS ONE 2018, 13, e0191980. [Google Scholar] [CrossRef]
- Budde, H.; Williams, G.A.; Winkelmann, J.; Pfirter, L.; Maier, C.B. The role of patient navigators in ambulatory care: Overview of systematic reviews. BMC Health Serv. Res. 2021, 21, 1166. [Google Scholar] [CrossRef]
- Gentry, S. The Journey of Oncology Navigation: American Nurse. 13 December 2021. Available online: https://www.myamericannurse.com/the-journey-of-oncology-navigation/ (accessed on 19 February 2025).
- Aiello Bowles, E.J.; Tuzzio, L.; Wiese, C.J.; Kirlin, B.; Greene, S.M.; Clauser, S.B.; Wagner, E.H. Understanding high-quality cancer care: A summary of expert perspectives. Cancer 2008, 112, 934–942. [Google Scholar] [CrossRef] [PubMed]
- Carroll, J.K.; Humiston, S.G.; Meldrum, S.C.; Salamone, C.M.; Jean-Pierre, P.; Epstein, R.M.; Fiscella, K. Patients’ experiences with navigation for cancer care. Patient Educ. Couns. 2010, 80, 241–247. [Google Scholar] [CrossRef] [PubMed]
- Rohloff, M.; Peifer, G.; Thompson, J.H. Patient navigation for overactive bladder improves access to care. Int. Urogynecol. J. 2020, 31, 1007–1012. [Google Scholar] [CrossRef]
- Du, C.; Berg, W.T.; Siegal, A.R.; Huang, Z.; Nguyen, A.; Cheung, A.; Mehraban-Far, S.; Anderson, R.; Jacob, S.; Kim, J. A retrospective longitudinal evaluation of new overactive bladder patients in an FPMRS urologist practice: Are patients following up and utilizing third-line therapies? Neurourol. Urodyn. 2021, 40, 391–396. [Google Scholar] [CrossRef]
- Goldman, H.B.; Anger, J.T.; Esinduy, C.B.; Zou, K.H.; Russell, D.; Luo, X.; Ntanios, F.; Carlsson, M.O.; Clemens, J.Q. Real-world patterns of care for the overactive bladder syndrome in the United States. Urology 2016, 87, 64–69. [Google Scholar] [CrossRef]
- US Department of Health and Human Services. HHS Regional Offices Map. 2024. Available online: https://www.hhs.gov/about/agencies/iea/regional-offices/index.html (accessed on 19 February 2025).
- Coyne, K.S.; Sexton, C.C.; Irwin, D.E.; Kopp, Z.S.; Kelleher, C.J.; Milsom, I. The impact of overactive bladder, incontinence and other lower urinary tract symptoms on quality of life, work productivity, sexuality and emotional well-being in men and women: Results from the EPIC study. BJU Int. 2008, 101, 1388–1395. [Google Scholar] [CrossRef]
- Milsom, I.; Kaplan, S.A.; Coyne, K.S.; Sexton, C.C.; Kopp, Z.S. Effect of bothersome overactive bladder symptoms on health-related quality of life, anxiety, depression, and treatment seeking in the United States: Results from EpiLUTS. Urology 2012, 80, 90–96. [Google Scholar] [CrossRef]
- Cameron, A.P.; Chung, D.E.; Dielubanza, E.J.; Enemchukwu, E.; Ginsberg, D.A.; Helfand, B.T.; Linder, B.J.; Reynolds, W.S.; Rovner, E.S.; Souter, L.; et al. The AUA/SUFU guideline on the diagnosis and treatment of idiopathic overactive bladder. J. Urol. 2024, 212, 11–20. [Google Scholar] [CrossRef]
- Syan, R.; Zhang, C.A.; Enemchukwu, E.A. Racial and socioeconomic factors influence utilization of advanced therapies in commercially insured OAB patients: An analysis of over 800,000 OAB patients. Urology 2020, 142, 81–86. [Google Scholar] [CrossRef] [PubMed]
- Laudano, M.A.; Seklehner, S.; Sandhu, J.; Reynolds, W.S.; Garrett, K.A.; Milsom, J.W.; Te, A.E.; Kaplan, S.A.; Chughtai, B.; Lee, R.K. Disparities in the use of sacral neuromodulation among Medicare beneficiaries. J. Urol. 2015, 194, 449–453. [Google Scholar] [CrossRef]
- Luchristt, D.; Bretschneider, C.E.; Kenton, K.; Simon, M.; Brown, O. Inequities in Filled Overactive Bladder Medication Prescriptions in the US. JAMA Netw. Open 2023, 6, e2315074. [Google Scholar] [CrossRef] [PubMed]
- Duralde, E.R.; Walter, L.C.; Van Den Eeden, S.K.; Nakagawa, S.; Subak, L.L.; Brown, J.S.; Thom, D.H.; Huang, A.J. Bridging the gap: Determinants of undiagnosed or untreated urinary incontinence in women. Am. J. Obstet. Gynecol. 2016, 214, e261–e266. [Google Scholar] [CrossRef] [PubMed]
- Enemchukwu, E.A.; Subak, L.L.; Markland, A. Barriers and facilitators to overactive bladder therapy adherence. Neurourol. Urodyn. 2022, 41, 1983–1992. [Google Scholar] [CrossRef]
- Botox Cosmetic [Package Insert]; AbbVie Inc.: North Chicago, IL, USA, October 2024.


Disclaimer/Publisher’s Note: The statements, opinions and data contained in all publications are solely those of the individual author(s) and contributor(s) and not of MDPI and/or the editor(s). MDPI and/or the editor(s) disclaim responsibility for any injury to people or property resulting from any ideas, methods, instructions or products referred to in the content. |
© 2025 by the authors. Published by MDPI on behalf of the Société Internationale d’Urologie. Licensee MDPI, Basel, Switzerland. This article is an open access article distributed under the terms and conditions of the Creative Commons Attribution (CC BY) license (https://creativecommons.org/licenses/by/4.0/).