Article

Toward Affirmation of Recovery of Deeply Embedded Autobiographical Memory with Background Music and Identification of an EEG Biomarker in Combination with EDA Signal Using Wearable Sensors

1
Department of Computer Science, University of Minnesota, Duluth, MN 55812, USA
2
Department of Spanish, University of Minnesota, Duluth, MN 55812, USA
*
Author to whom correspondence should be addressed.
Clin. Transl. Neurosci. 2022, 6(4), 26; https://doi.org/10.3390/ctn6040026
Submission received: 23 October 2022 / Revised: 28 November 2022 / Accepted: 2 December 2022 / Published: 6 December 2022

Abstract

:
There is no disputing the role that background music plays in memory recall. Music has the power to activate the brain and trigger deeply ingrained memories. For dementia patients, background music is a common therapy because of this. Previous studies used music to recall lyrics, series of words, and long- and short-term memories. In this research, electroencephalogram (EEG) and electrodermal activity (EDA) data are collected from 40 healthy participants using wearable sensors during nine music sessions (three happy, three sad, and three neutral). A post-study survey is given to all participants after each piece of music to know if they recalled any autobiographical memories. The main objective is to find an EEG biomarker using the collected qualitative and quantitative data for autobiographical memory recall. The study finds that for all four EEG channels, alpha power rises considerably (on average 16.2%) during the memory “recall” scenario (F3: p = 0.0066, F7: p = 0.0386, F4: p = 0.0023, and F8: p = 0.0288) compared to the “no-recall” situation. Beta power also increased significantly for two channels (F3: p = 0.0100 and F4: p = 0.0210) but not for others (F7: p = 0.6792 and F8: p = 0.0814). Additionally, the phasic standard deviation (p = 0.0260), phasic max (p = 0.0011), phasic energy (p = 0.0478), tonic min (p = 0.0092), tonic standard deviation (p = 0.0171), and phasic energy (p = 0.0478) are significantly different for the EDA signal. The authors conclude by interpreting increased alpha power (8–12 Hz) as a biomarker for autobiographical memory recall.

1. Introduction

Recalling previously encoded and stored facts or experiences from the brain is known as memory retrieval. There is a direct connection between music and memory, particularly autobiographical memory (ABM). Replicating the earlier findings of the existing literature has discovered a considerable increase in ABM recall for people with Alzheimer’s disease when background music is present as opposed to quiet [1].

1.1. Types of Memories and Their Regions

Stages and processes are occasionally used to categorize memory. Others, such as sensory, short-term, and long-term memories, are not types of memory, but phases of memory, according to those who classify memory into only two separate classes, implicit and explicit memory [2].
Implicit memories are also referred to as unconscious memories. These unconscious memories could be procedural in nature, involving learned motor abilities such as how to type on a keyboard or ride a bike, for example. Explicit memories are those memories that are consciously recalled. Explicit memories can be episodic, referring to specific events or ‘episodes’ in a person’s life, or semantic, referring to facts or general knowledge. Autobiographical memory and episodic memory are frequently used interchangeably. However, autobiographical memory can be made up of information retained in episodic memory, semantic memory, or a combination of the two.
Memories are not preserved in a single area of the brain. Different sorts of information are stored in various brain regions that are linked together. For example, explicit memories are generally stored in the hippocampus, the neocortex, and the amygdala. The cerebellum and the basal ganglia store implicit memories. Short-term working memory relies on the prefrontal cortex [3]. The hippocampus, located in the brain’s temporal lobe, is where episodic memories are generated and stored for later retrieval.

1.2. Music Therapy

Music has a deep relationship with the mind and memory. According to many studies, music is stored in a portion of the brain that is unaffected by dementia, particularly Alzheimer’s disease [4,5,6]. That is why music therapy is one of the most helpful activities for those suffering from dementia or Alzheimer’s disease. Favorite music or songs related to significant life events can jog memories of the lyrics and their associated experiences [1,7]. According to two studies conducted in the United States and Japan, music not only helps people to retrieve their stored memories but also helps them to lay down new memories [8]. Research shows that music therapy can be used to reduce different behavioral and psychologic symptoms of dementia (BPSD), like delusions, agitation, anxiety, apathy, irritability, aberrant motor activity, and night-time disturbances [9]. In moderately severe and severe Alzheimer’s disease, music therapy can be used as a safe and efficient treatment for agitation and anxiety [10].

1.3. Biomarker

When working with the electrical activities of the brain, known as an electroencephalogram (EEG), biomarkers are crucial. Researchers can focus their efforts by filtering out superfluous noise and limiting scope by knowing the proper biomarkers for the specific subject being examined. The definition of a biomarker is given below [11] (p. 91).
“A characteristic that is objectively measured and evaluated as an indicator of normal biological processes, pathogenic processes, or pharmacologic responses to a therapeutic intervention.”
Biomarkers can be used as a diagnostic tool to identify patients with abnormal conditions or diseases. Researchers can also determine the stages of different diseases and the extent of diseases using biomarkers. It can also be used as an indicator of disease prognosis and for predicting and monitoring the clinical response to an intervention.
An individual alpha peak frequency is employed in [12] as a biomarker for identifying children with learning disabilities who react better to live Z-score training neurofeedback. The aim of [13] was to investigate whether quantitative EEG (qEEG) could be a useful biomarker for assessing and tracking the effects of persistent brain dysfunction brought on by head injury. The authors observed that the relative theta power increases, alpha power decreases, and beta-band interhemispheric coherence decreases for mild traumatic brain injury (mTB). The authors use sleep EEG data to estimate the neurological EEG biomarkers and predict the five classes of sleep phases in this study [14]. As sleep depth grows, the strength of slow-wave delta and theta oscillations gradually overtakes that of fast-wave alpha, beta, and gamma rhythms. So, the authors suggested delta-wave power ratios, like delta–alpha ratio (DAR), delta–theta ratio (DTR), and DTABR, as biomarkers for this experiment.

1.4. Related Works

Different researchers have examined the effect of background music on the human brain using different approaches [15,16]. Most of them concluded that background music has a significant positive impact on the human brain. It helps to improve the behavioral and psychological symptoms of dementia patients.
Ref. [1] examines the effect of music on autobiographical memory recall in mild Alzheimer’s disease individuals and healthy elderly individuals. There were two sessions, one with a music condition and the other one with a silent condition. A significant improvement was noticed in Alzheimer’s patients’ recall of the Autobiographical Memory Interview in the music condition. There was a visible performance difference between the participant groups. Healthy elderly individuals significantly outperformed Alzheimer’s individuals in silence and music conditions. Using galvanic skin response recordings, there were no changes in general arousal or attentional errors made during the sustained attention to response task. To observe the effect of music in enhancing autobiographical memory, ref. [17] research was conducted on 12 mild Alzheimer’s disease (AD) patients. The study was conducted under three conditions: (1) in “silence” mode, (2) after playing “Four Seasons” music, and (3) participant-chosen music. The results show that the participants could recall more ABMs when they were exposed to their chosen music than under the other two conditions. Even the “Four Seasons” music helped them to recall more ABMs than the silence mode. The authors compared the music-evoked autobiographical memory (MEAMs) with those evoked by famous faces in this study [18]. Compared to autobiographical memories generated by faces, MEAMs were more vivid. The authors also identified sex differences, and for both categories, women could recall more vivid memories than men.
The authors aim to find the effects of musical mood induction on childhood memory recall here [19]. Participants who were exposed to music recalled more childhood memories and happy memories than those who were not exposed. The purpose of this [20] experiment was to demonstrate how music can facilitate text memory. The result shows that music facilitates memory in both the initial learning phase and the delayed-recall test for both ballads. In [21], the researchers examine the impact of music on memory in Alzheimer’s patients by making song lyrics relevant to an older adult’s daily life and examining how musical encoding affects several distinct areas of episodic memory. This study shows that general topic information learned through sung lyrics may be recalled better than information learned through spoken lyrics. In addition, both Alzheimer’s patients and healthy older people benefited from musical encoding for general content memory but not for specific content information.
The main objective of this exploratory study is to perform an analysis of the brain’s electrical activity and other physiological changes like EDA and find an EEG biomarker that can verify autobiographical memory recall when listening to different background music. Most of the other studies mentioned in Section 1.4 used only qualitative data and did not observe any physiological changes to verify memory recall activities. In this paper, both quantitative and qualitative data were used. In addition, the goal is to not only observe the EEG and EDA signals during the memory recall but also find the EEG biomarker responsible for that memory recall.

2. Materials and Methods

Nine pieces of music have been used in this experience. Six of those pieces of music of the participants’ own choice and three of the authors’ own have been used in this study. A laptop was used to play that music. There were two sections in this experiment: a quantitative section and a qualitative section. In the quantitative section, the authors analyzed the electrical activities of the brain (EEG) and the electrodermal activities (EDA) of the skin of healthy individuals only. In the qualitative section, the authors conducted interviews with the participants and asked them questions based on the experiment. If the participants could recall any ABM, then that was identified as a memory “recall” scenario, and if the participant could not recall any ABM, that was identified as a “no-recall” scenario.
This study protocol was approved by the Institutional Review Board (IRB) (STUDY00012606; approval date: 22 July 2021). Forty healthy participants (20 men and 20 women) were recruited via email invitations to participate in this study. In a pre-study survey, participants were questioned about their physical and emotional mental well-being. The experiment was carried out if both of those results were positive. The participants did not have to go through any cognitive tests before the study. The ages ranged between 20 and 72, with a mean of 31.025 and a standard deviation of 11.53. If the participant passed the inclusion and exclusion criteria, the participant was informed of the data collection process and would have the opportunity to participate in the study by signing the consent form. Table 1 shows the demographic information of the participants.
A total of nine pieces of music were played during this study. Participants were told to provide six songs (three happy and three sad) related to their lives, culture, or community. The lyrics of those songs could be in any language. Participants selected three songs that make them happy (referred to as “happy songs”) and three songs that make them sad (referred to as “sad songs”). The authors selected three random songs (referred to as “neutral songs”) as the other three songs. The happy and sad songs selected by the participants are shown in Appendix A. The experimental procedure is shown in Figure 1.

2.1. Experimental Protocols
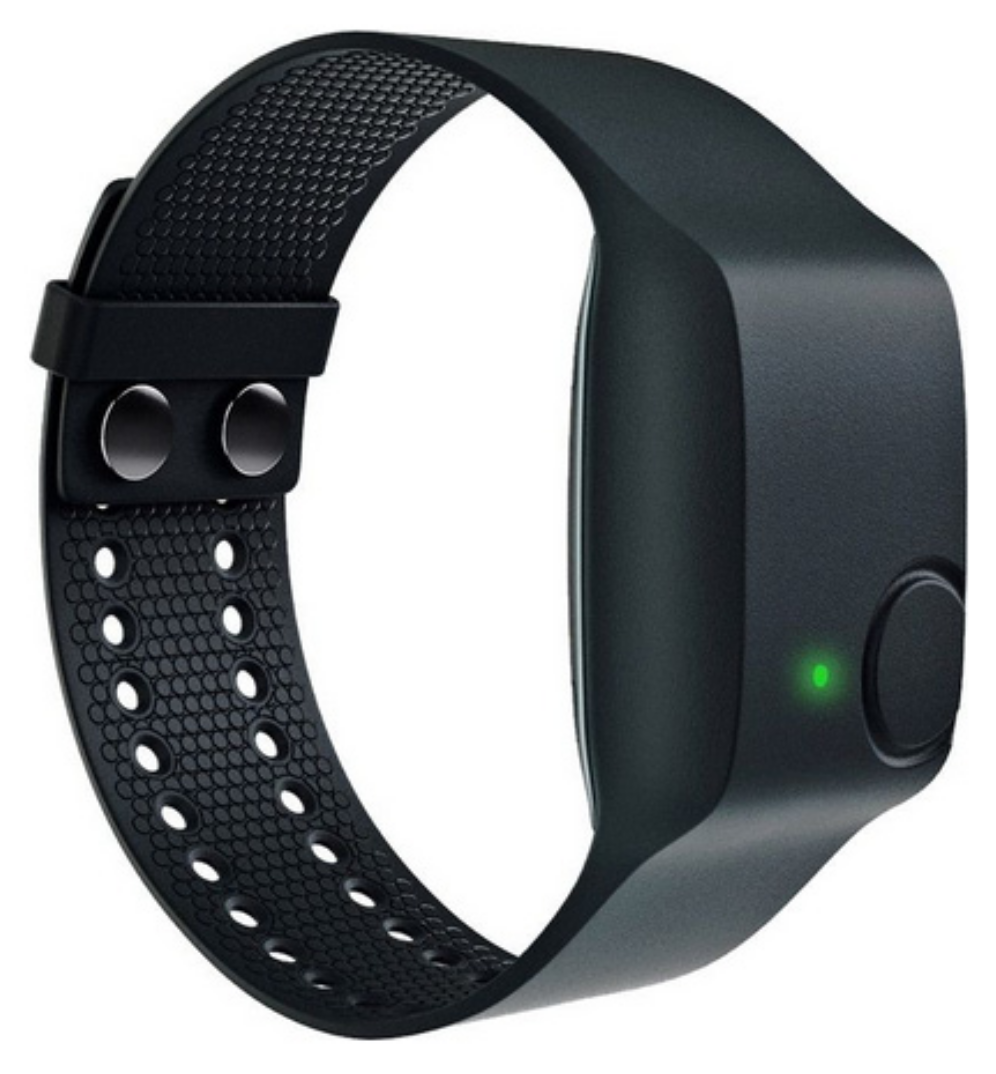
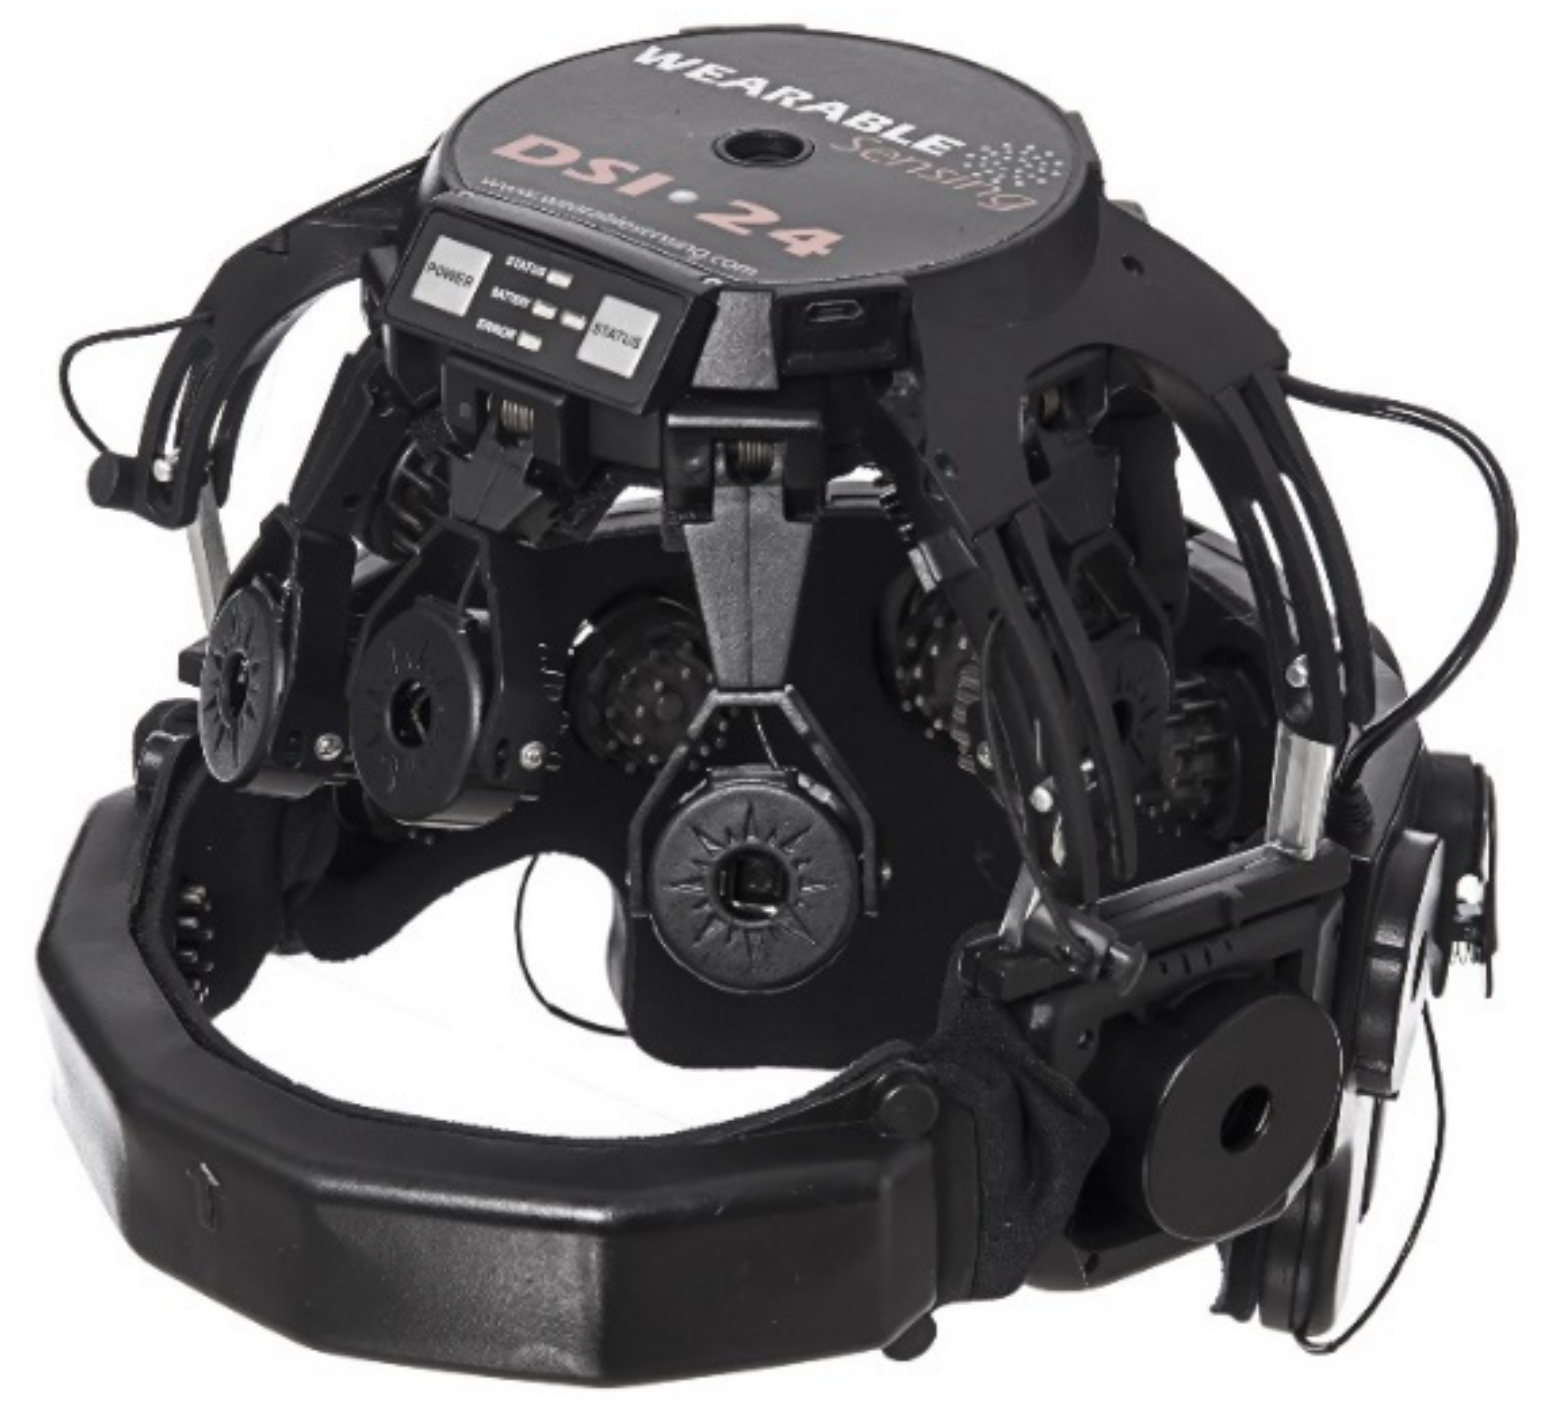
The participants were prepared by putting on two wearable sensors (Empatica E4 for EDA and DSI-24 for EEG), and the baseline data was collected before music was played to the participant. During this process, the wearable sensor data was recorded to understand the impact of music on the brain, as well as the physiology of the participant. After this, the data was collected from the wearable sensors for 27 min to track and monitor the effects of music on physiology and the brain. During this resting phase, the participant was asked to complete one survey form for each of those nine pieces of music. The data collection method is described in Table 2.

2.2. Materials

An Empatica E4 device was used to collect EDA data from the participants. It is a popular wearable device manufactured by Empatica Inc. that collects physiological data in real time, allowing researchers to perform detailed analysis and visualization. The E4 wristband is provided with several sensors that allow the user to observe and record real-time physiological signals like galvanic skin response (GSR) or electrothermal activity (EDA), blood volume response (BVP), interbeat interval (IBI), and heart rate variability (HRV). Users can access the information in three different modes: offline, Bluetooth streaming, and streaming server. In offline mode, data is stored within the E4 internal memory and might be downloaded from the E4 web server for further processing. While in Bluetooth streaming mode, which is real-time data collection, users can visualize the information at the same time because it is being gathered. Additionally, E4 is often utilized in the streaming server mode, during which E4 data are forwarded to a TCP socket connection to be processed by an application or stored in an exceedingly local data storage or on a distant server. During this study, E4 was utilized in its streaming server mode. The E4 streaming server works only with the “Bluegiga Bluetooth Smart Dongle” on a Windows laptop or PC. A Python script was developed to stream raw data from E4 through a Bluetooth dongle and send the data to a MySQL database. The code collects the user ID and gathers timestamps and data information for each of the E4 sensors, including EDA, BVP, ACC, IBI, and Temp. Figure 2 shows the Empatica E4 device. A 4 Hz sampling rate was used in this experiment.
EEG data were collected from the participants using the DSI-24 manufactured by Wearable Sensing. The DSI-24 EEG system is designed for easy and comfortable measurement of high-fidelity EEG signals in a laboratory environment and relaying the EEG data to an external PC. Bluetooth® or a wired micro-USB cable can be used to transfer data to a PC. Some DSI-24 systems also include internal memory (up to 60 h of continuous recording). The system’s basic technology comprises ultra-high-impedance dry sensor interface (DSI) sensors that work through regular hair and do not require any skin preparation or the use of conductive gels to make electrical contact with the scalp. Individual adjustments can be made to the sensors to optimize their contact with the scalp. The EEG sensors for the DSI-24 system are mounted in a portable, user-adjustable headgear that places them in the International 10/20 System’s nominal Fp1, Fp2, F7, F3, Fz, F4, F8, T3, C3, Cz, T4, T5, P3, P4, T6, O1, and O2 positions. Either the mastoids (M1, M2) or the earlobes can be measured with the DSI-24 system (A1, A2). A reference sensor (common-mode follower, CMF) is put at the nominal Pz location. Data generated by Wearable Sensing’s EEG equipment can be gathered, stored, and reviewed with the help of the DSI-Streamer software. Figure 3 shows the structure of a DSI-24 device. Data were collected using all 24 channels at a sampling rate of 300 Hz.

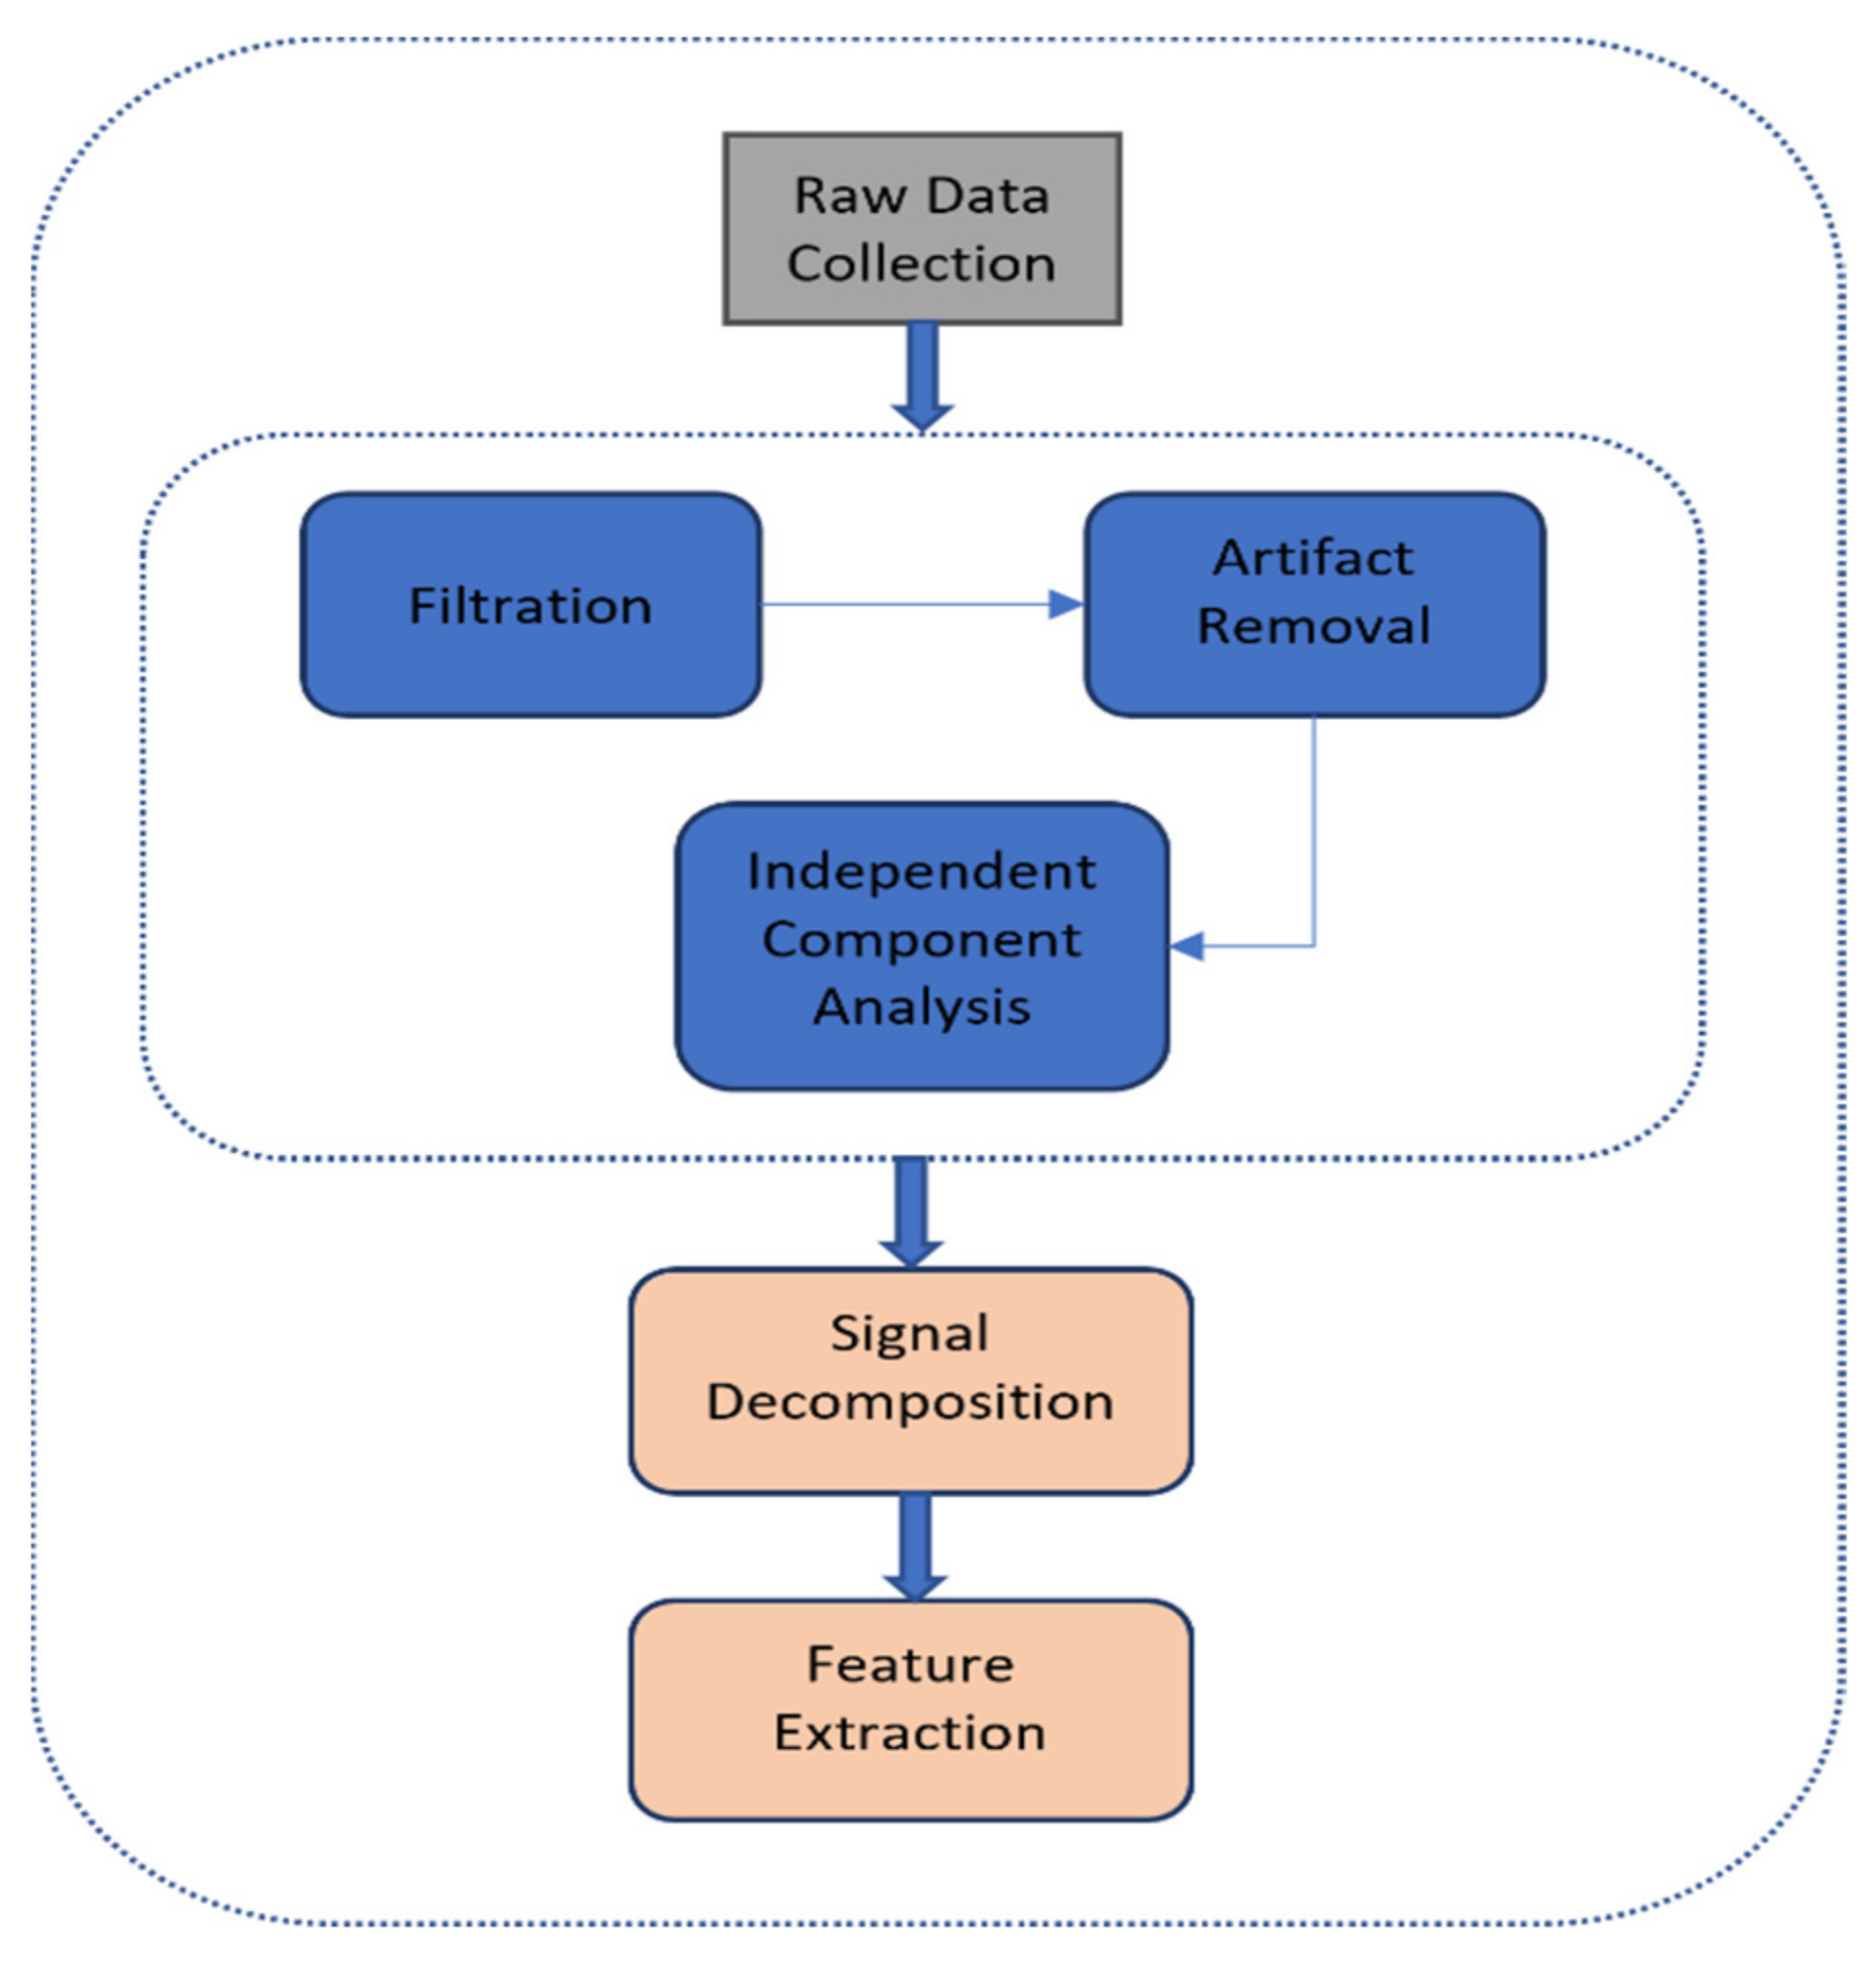
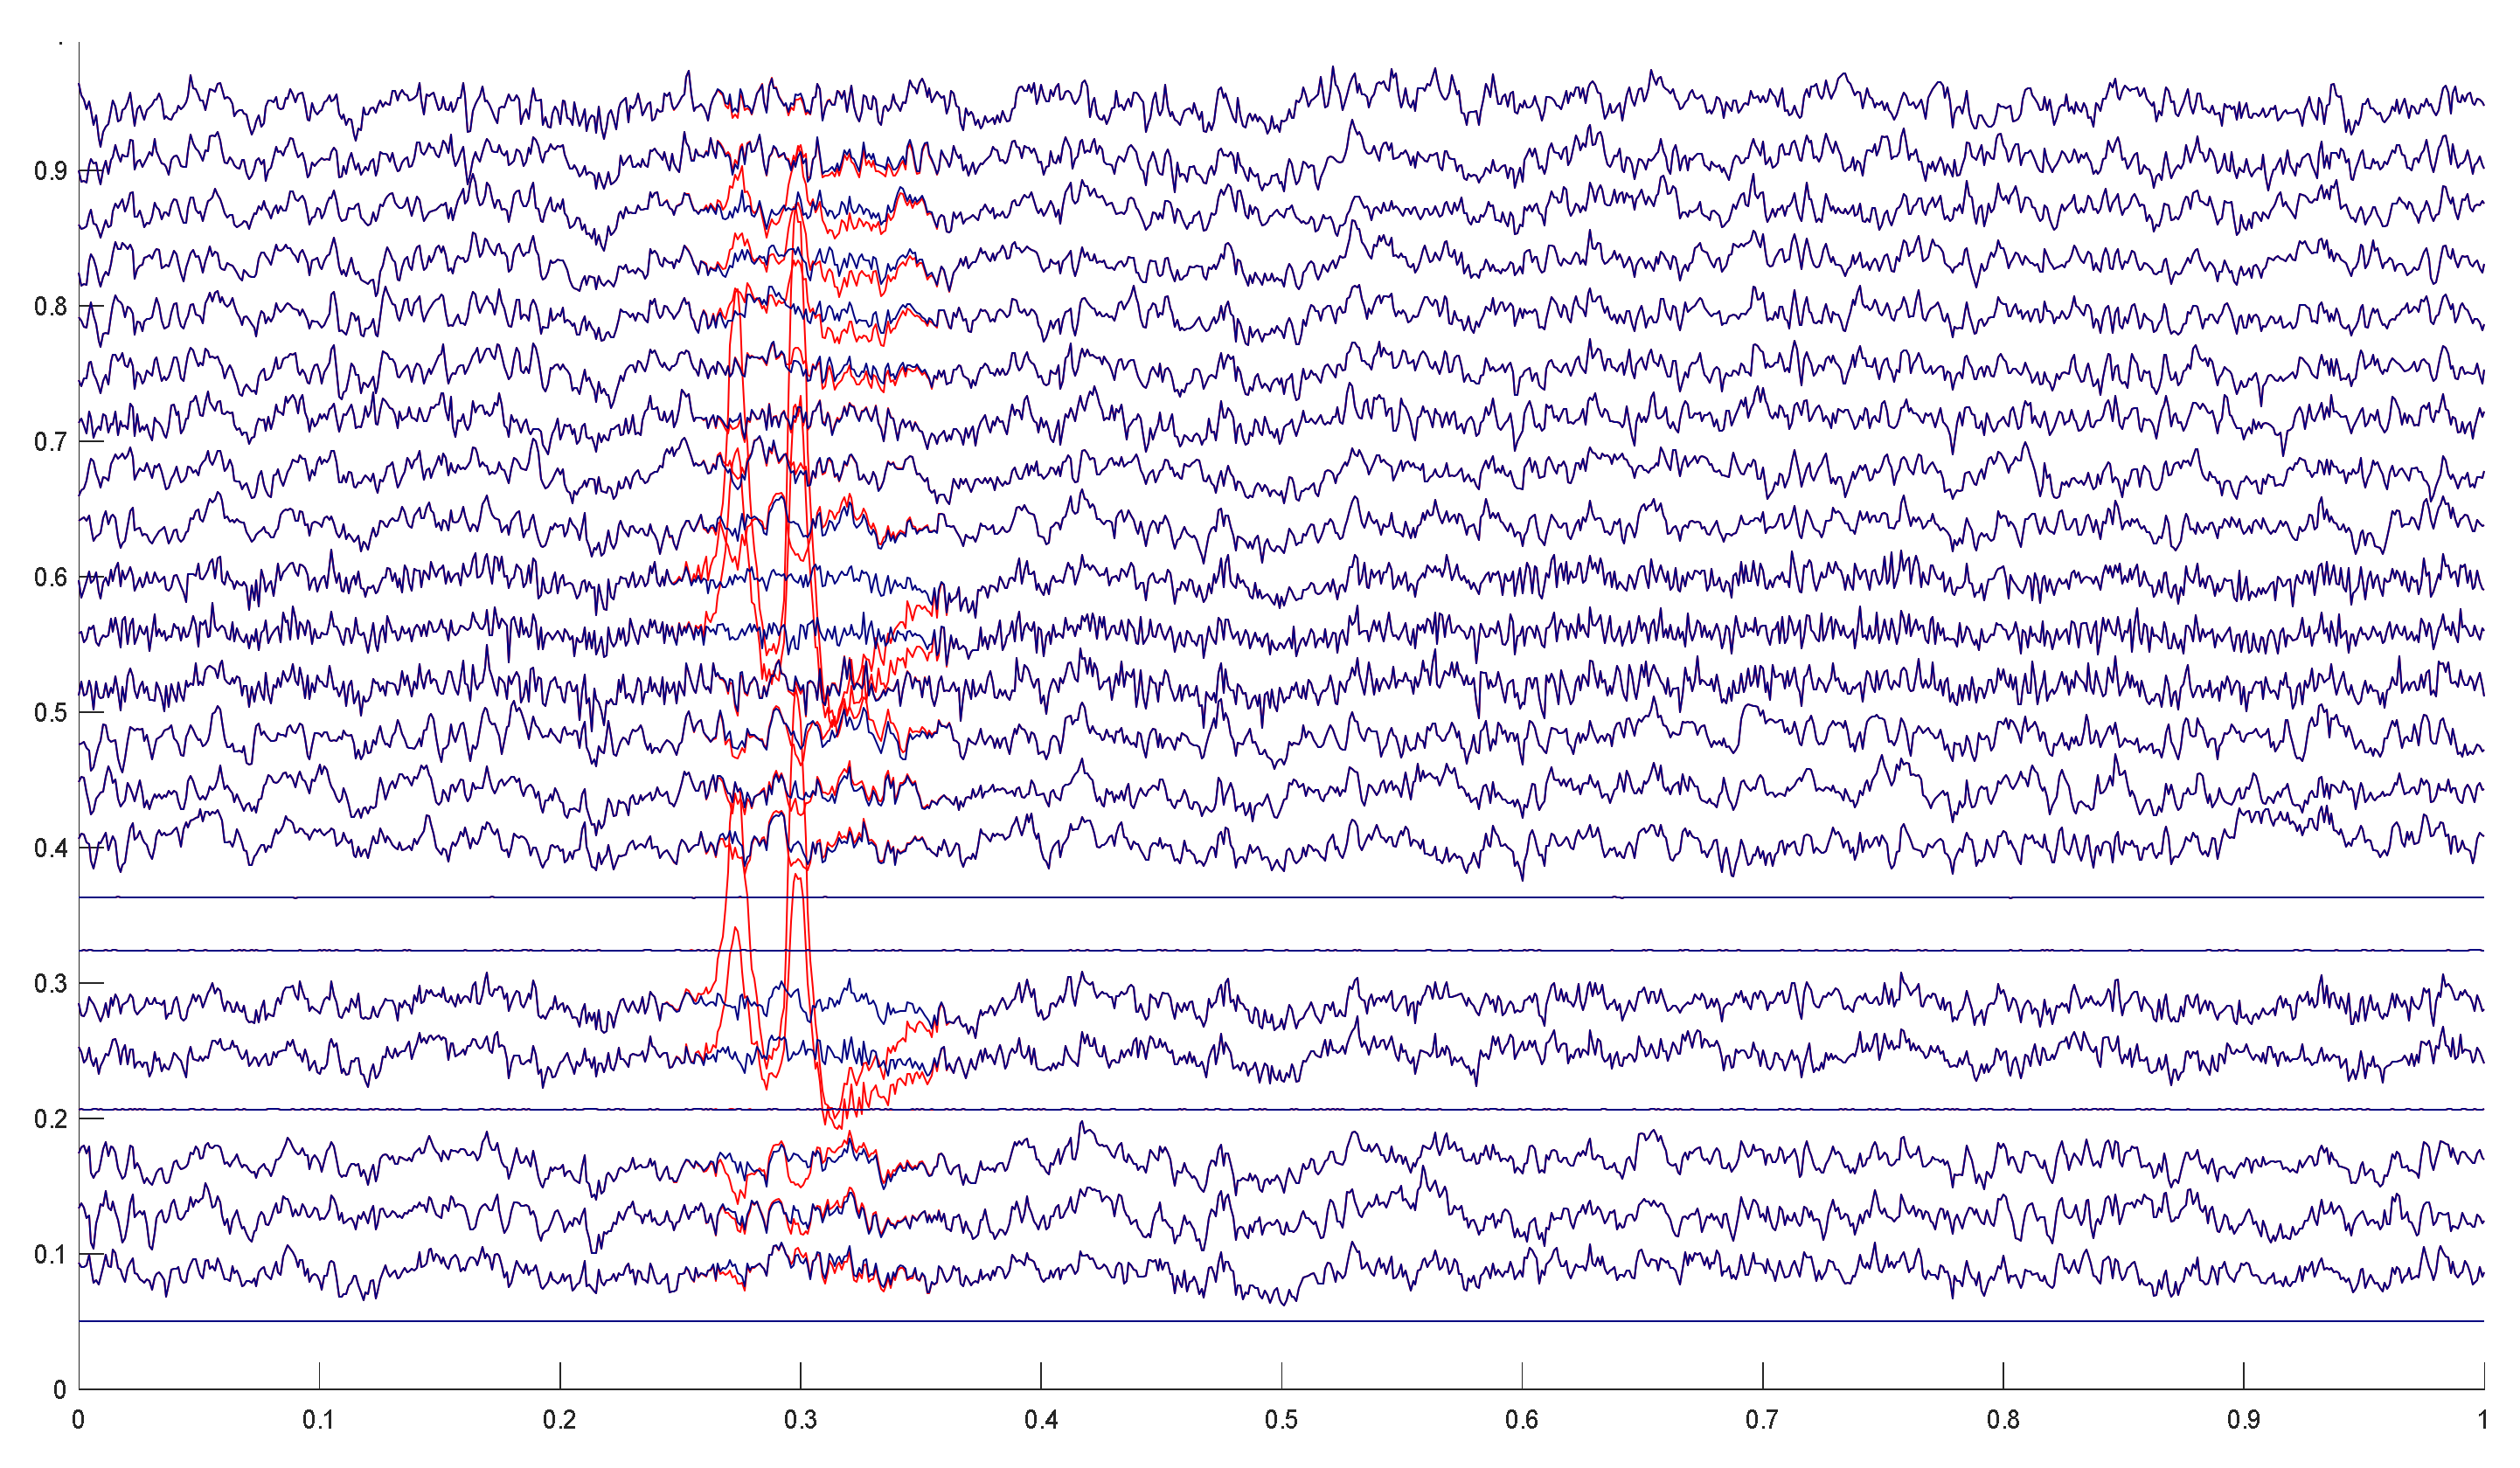
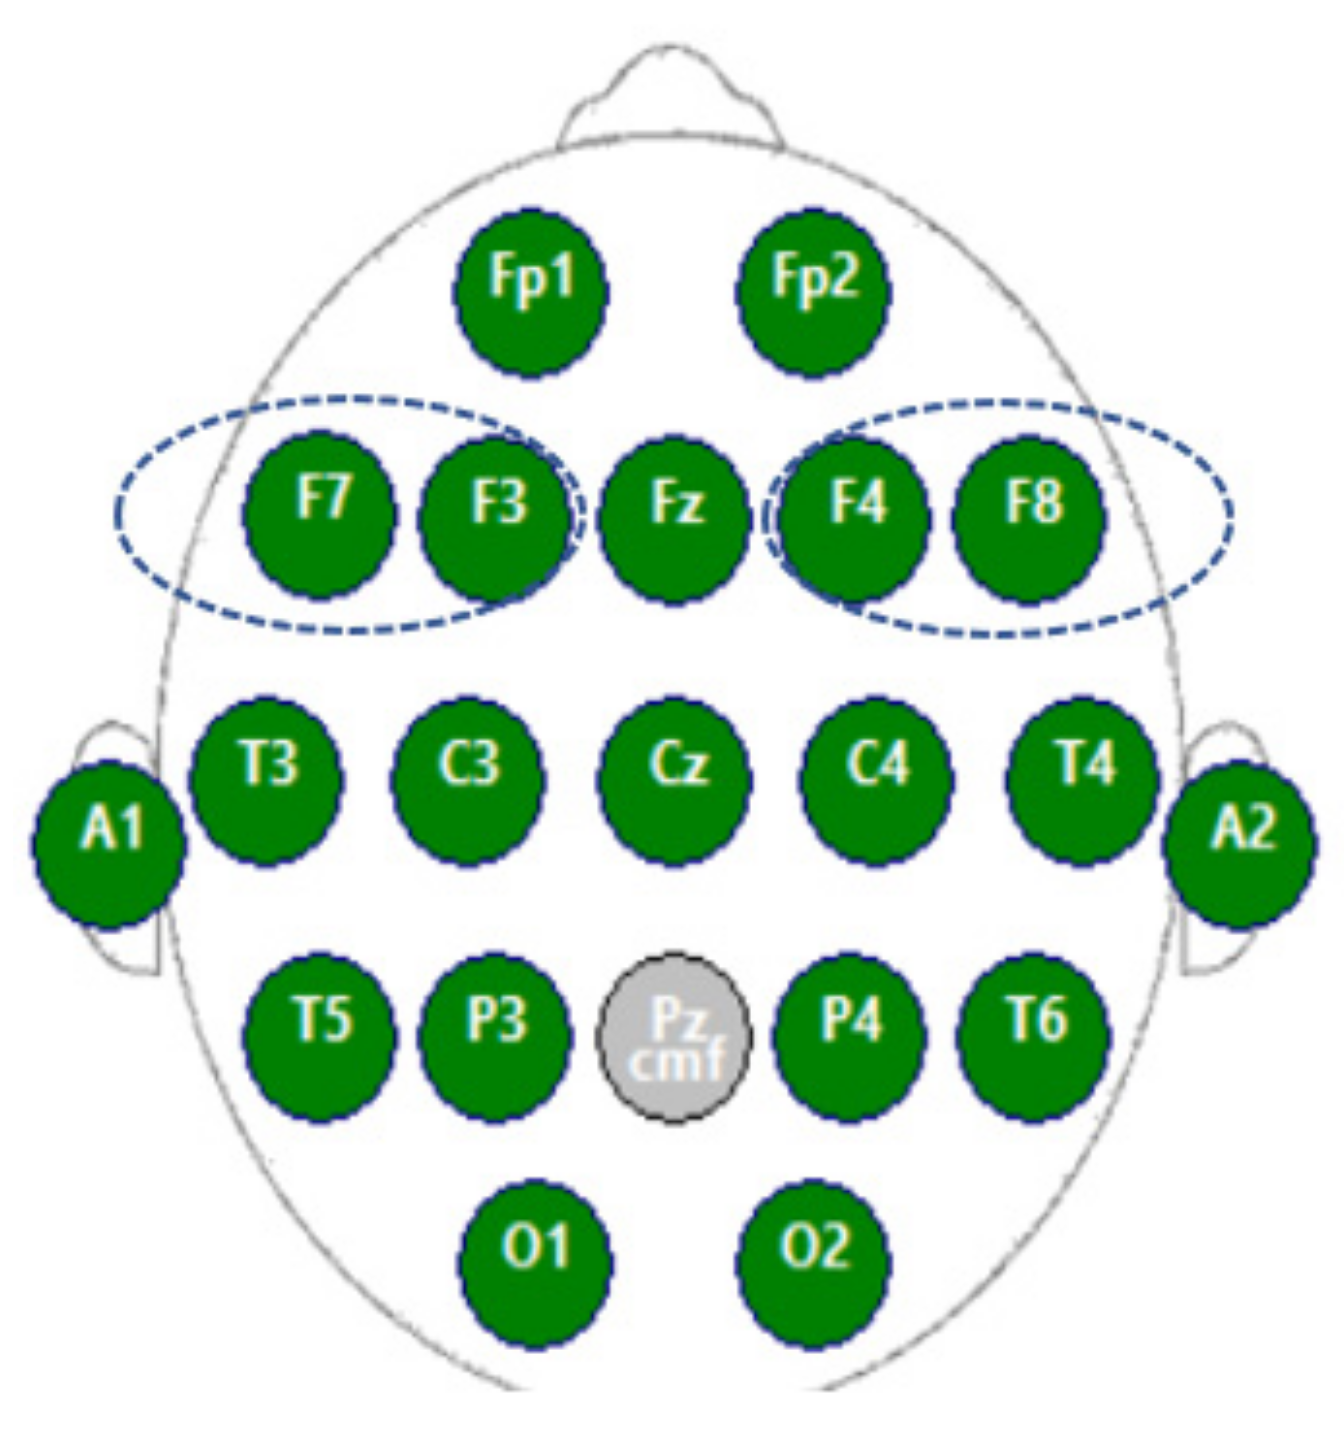
2.3. EEG Data Processing

The most popular EEG data analysis tool, EEGLAB [22], was used for data processing. To obtain independent component analysis (ICA) decompositions of high quality, high-pass filtering of the data at 1 Hz is advised [23]. It is also recommended to filter the data before removing artifacts. The introduction of filtering artifacts at epoch boundaries is minimized when the continuous data is filtered. A finite impulse response (FIR) filter of order two was used for this filtration process. The lower edge and higher edge of the frequency pass band were 0 and 50 Hz, respectively. The sampling rate was 300/Hz. The total number of frames in three minutes for each electrode was 54,000.
The authors used EEGLAB’s built-in automatic bad data rejection system, named “Clean_rawdata”, to correct bad data from the filtered EEG signal. Bad data can be defined as the arbitrary portion of the continuous EEG signal. Head movement and the movement of electrodes and cables are the main sources of this bad data. This built-in system uses the artifact subspace reconstruction (ASR) algorithm to reject bad data. ASR can be used to either correct or remove bad portions of data. We corrected the data instead of totally removing it. So, no data was lost during this artifact removal process. ASR identifies clean data (calibration data) and computes the standard deviation of the PCA-extracted components (ignoring physiological EEG alpha and theta waves by filtering them out). It discards data regions that are more than 20 times (by default) the calibration data’s standard deviation. As the threshold is lowered, the rejection gets stronger. Figure 4 shows the result of bad data correction. The red portion of this figure is the arbitrary portion of the EEG signal. The automatic bad data rejection technique could identify those and correct them using the ARS algorithm. As can be observed in the above figure, red-marked bad data has been corrected and replaced by corrected data.
The signal is then subjected to ICA to remove physiological artifacts like muscle movement, eye blinks, or eye movements. A small percentage of the sample data was lost after all data processing was completed. The authors could easily ignore that because the amount was so small. They worked on four electrodes that collected data from the frontal regions of the left and right sides of the brain (left and right hippocampus) instead of working on 24 electrodes, as the autobiographical memory is stored in that part of the brain. Those four channels are F3, F7, F4, and F8. In addition, those parts are associated with positive and negative emotions in the human brain [24,25]. The positions of those four electrodes are shown in Figure 5.

2.4. EDA Data Processing

A toolkit named “FLIRT” [26] was used for data analysis and feature extraction. It is a Python-based toolkit that is free and open-source and focuses on processing physiological data, particularly from commercial wearable sensors. Two integrated approaches are used in FLIRT for artifact removal and noise filtration: the extended Kalman filter (EKF) and the particle filter (PF). Then a modular approach was used that combines low-pass filtering and artifact detection algorithms. The Kalman filter is a model-based, integrated method of filtering data that estimates the signal’s genuine response by fusing data measurements with a theoretical model of the signal. On the other hand, the filtering algorithm known as the particle filter (PF) is a model-based algorithm. A normal distribution of the state and noise random variables is not assumed by PF, in contrast to the extended Kalman filter (EKF). Because of this, wearable signals and situations with strongly non-Gaussian noise can be more broadly accommodated by the PF algorithm. EDA decomposition was done using two widely used EDA decomposition algorithms, cvxEDA [27] and Ledalab [28], to separate two main components of EDA: skin conductance response (SCR) and skin conductance level (SCL). The sampling rate was 4 Hz during the data collection. So, for each song, 540 samples were collected for EDA signal processing. This value was the same during all the data processing techniques.
Figure 6 shows the decomposition result of the EDA signal.

2.5. Extracted Features

2.5.1. EEG Features

Arithmetic mean: the arithmetic mean of EEG, alpha, beta, theta, and gamma bands can be computed using the formula below.
A = 1 k D i N
where D = values of EEG data and N = number of samples.
Standard deviation: the standard deviation of EEG, alpha, beta, theta, and gamma can be computed using the formula below.
S D = 1 k x i μ 2 N
where μ = arithmetic mean and N = number of samples.
Hjorth activity: the signal strength and variance of a time function are represented by the activity parameter. This may represent the frequency domain power spectrum surface. The following equation serves as an illustration of this:
A c t i v i t y = v a r y t
where y t represents the signal.
Hjorth mobility: the mobility parameter represents the average frequency or the percentage of the power spectrum’s standard deviation. This is determined by the square root of the variance of the first derivative of the signal y t divided by the variance of the signal y t .
M o b i l i t y = v a r d y t d t v a r y t
where y t represents the signal.
Hjorth complexity: the frequency change is represented by the complexity parameter. The parameter measures the signal’s similarity to a pure sine wave; if the signal is more similar, the value converges to 1, and vice versa.
C o m p l e x i t y = M o b i l i t y d y t d t M o b i l i t y y t
where y t represents the signal.
Band power: the average power of the input signal x. It can be calculated by integrating the power spectral density of that band. The wavelet transform can be used to decompose the EEG signal into its different frequency components, and then the band power of each band can also be calculated separately.
Mean energy: it calculates the mean energy of input signal x. The formula is:
M E = 1 N   1 N   X i 2
where X is the EEG signal and N is the number of samples.
Shannon entropy: the entropy of a random variable is the average level of “information”, “surprise”, or “uncertainty” inherent to the variable’s possible outcomes. In EEG, entropy can be defined as the amount of randomness or uncertainty in the EEG pattern [29] Time-domain entropy measurements often divide the signal into segments, which are then compared for similarity either directly or after the signal has undergone some sort of transformation. The formula for Shannon entropy is:
S n = i = 0 m p x i log p x i
where p( x i ) is the probability of event x i .
Power spectral density: power spectral density (PSD) is a popular spectral analysis method that demonstrates the spectrum of EEG data. It indicates how the signal’s frequency components are distributed in terms of power. In other words, it measures the ratio of the signal’s power content to its frequency. There are many ways to calculate the power spectral density. One of the popular ways is the use of the Fourier transform, where the time series signal is decomposed into the summation of a group of sine waves. The formula to compute PSD is:
P S D k = X k 2 F s N
where F s is the sampling rate, N . is the number of samples, and X k is the Fourier transform of the EEG signals.

2.5.2. EDA Features

The EDA features extracted here are listed below.
Tonic and phasic mean: mean of the SCR and SCL.
Tonic and phasic standard deviation: standard deviation of the SCR and SCL.
Tonic and phasic max: maximum of the SCR and SCL.
Tonic and phasic min: minimum of the SCR and SCL.
Tonic and phasic energy: energy of the SCR and SCL.

2.6. Statistical Tools

For all kinds of statistical analysis, the Python3 programming language was used with the Spyder development environment (Python IDE) [30]. First, the researchers performed a paired t-test to find out if there were any significant differences between the “memory recalled” and “memory not-recalled” scenarios for different features of EEG. Here, the paired t-test was used because both groups of data come from a single population. An alpha value of 0.05 is used for this comparison.
Then the Pearson correlation coefficient (PCC) was calculated for the pair of electrodes (F3–F7 and F4–F8). The F3–F7 pair of electrodes is responsible for collecting data from the left hippocampus of the brain. On the other hand, the F4–F8 electrodes are responsible for collecting data from the right hippocampus of the brain. A high correlation between the signals from different electrodes indicates similar brain activity [31]. That is why the researchers found the relationship between those two pairs of electrodes using the extracted EEG features from those channels.
The authors used the Wilcoxon signed-rank test for the EDA data to find the p-value instead of a t-test. The reason is that the dataset needs to be normally distributed to apply the t-test. However, for EDA, the dataset was not normally distributed.

3. Results

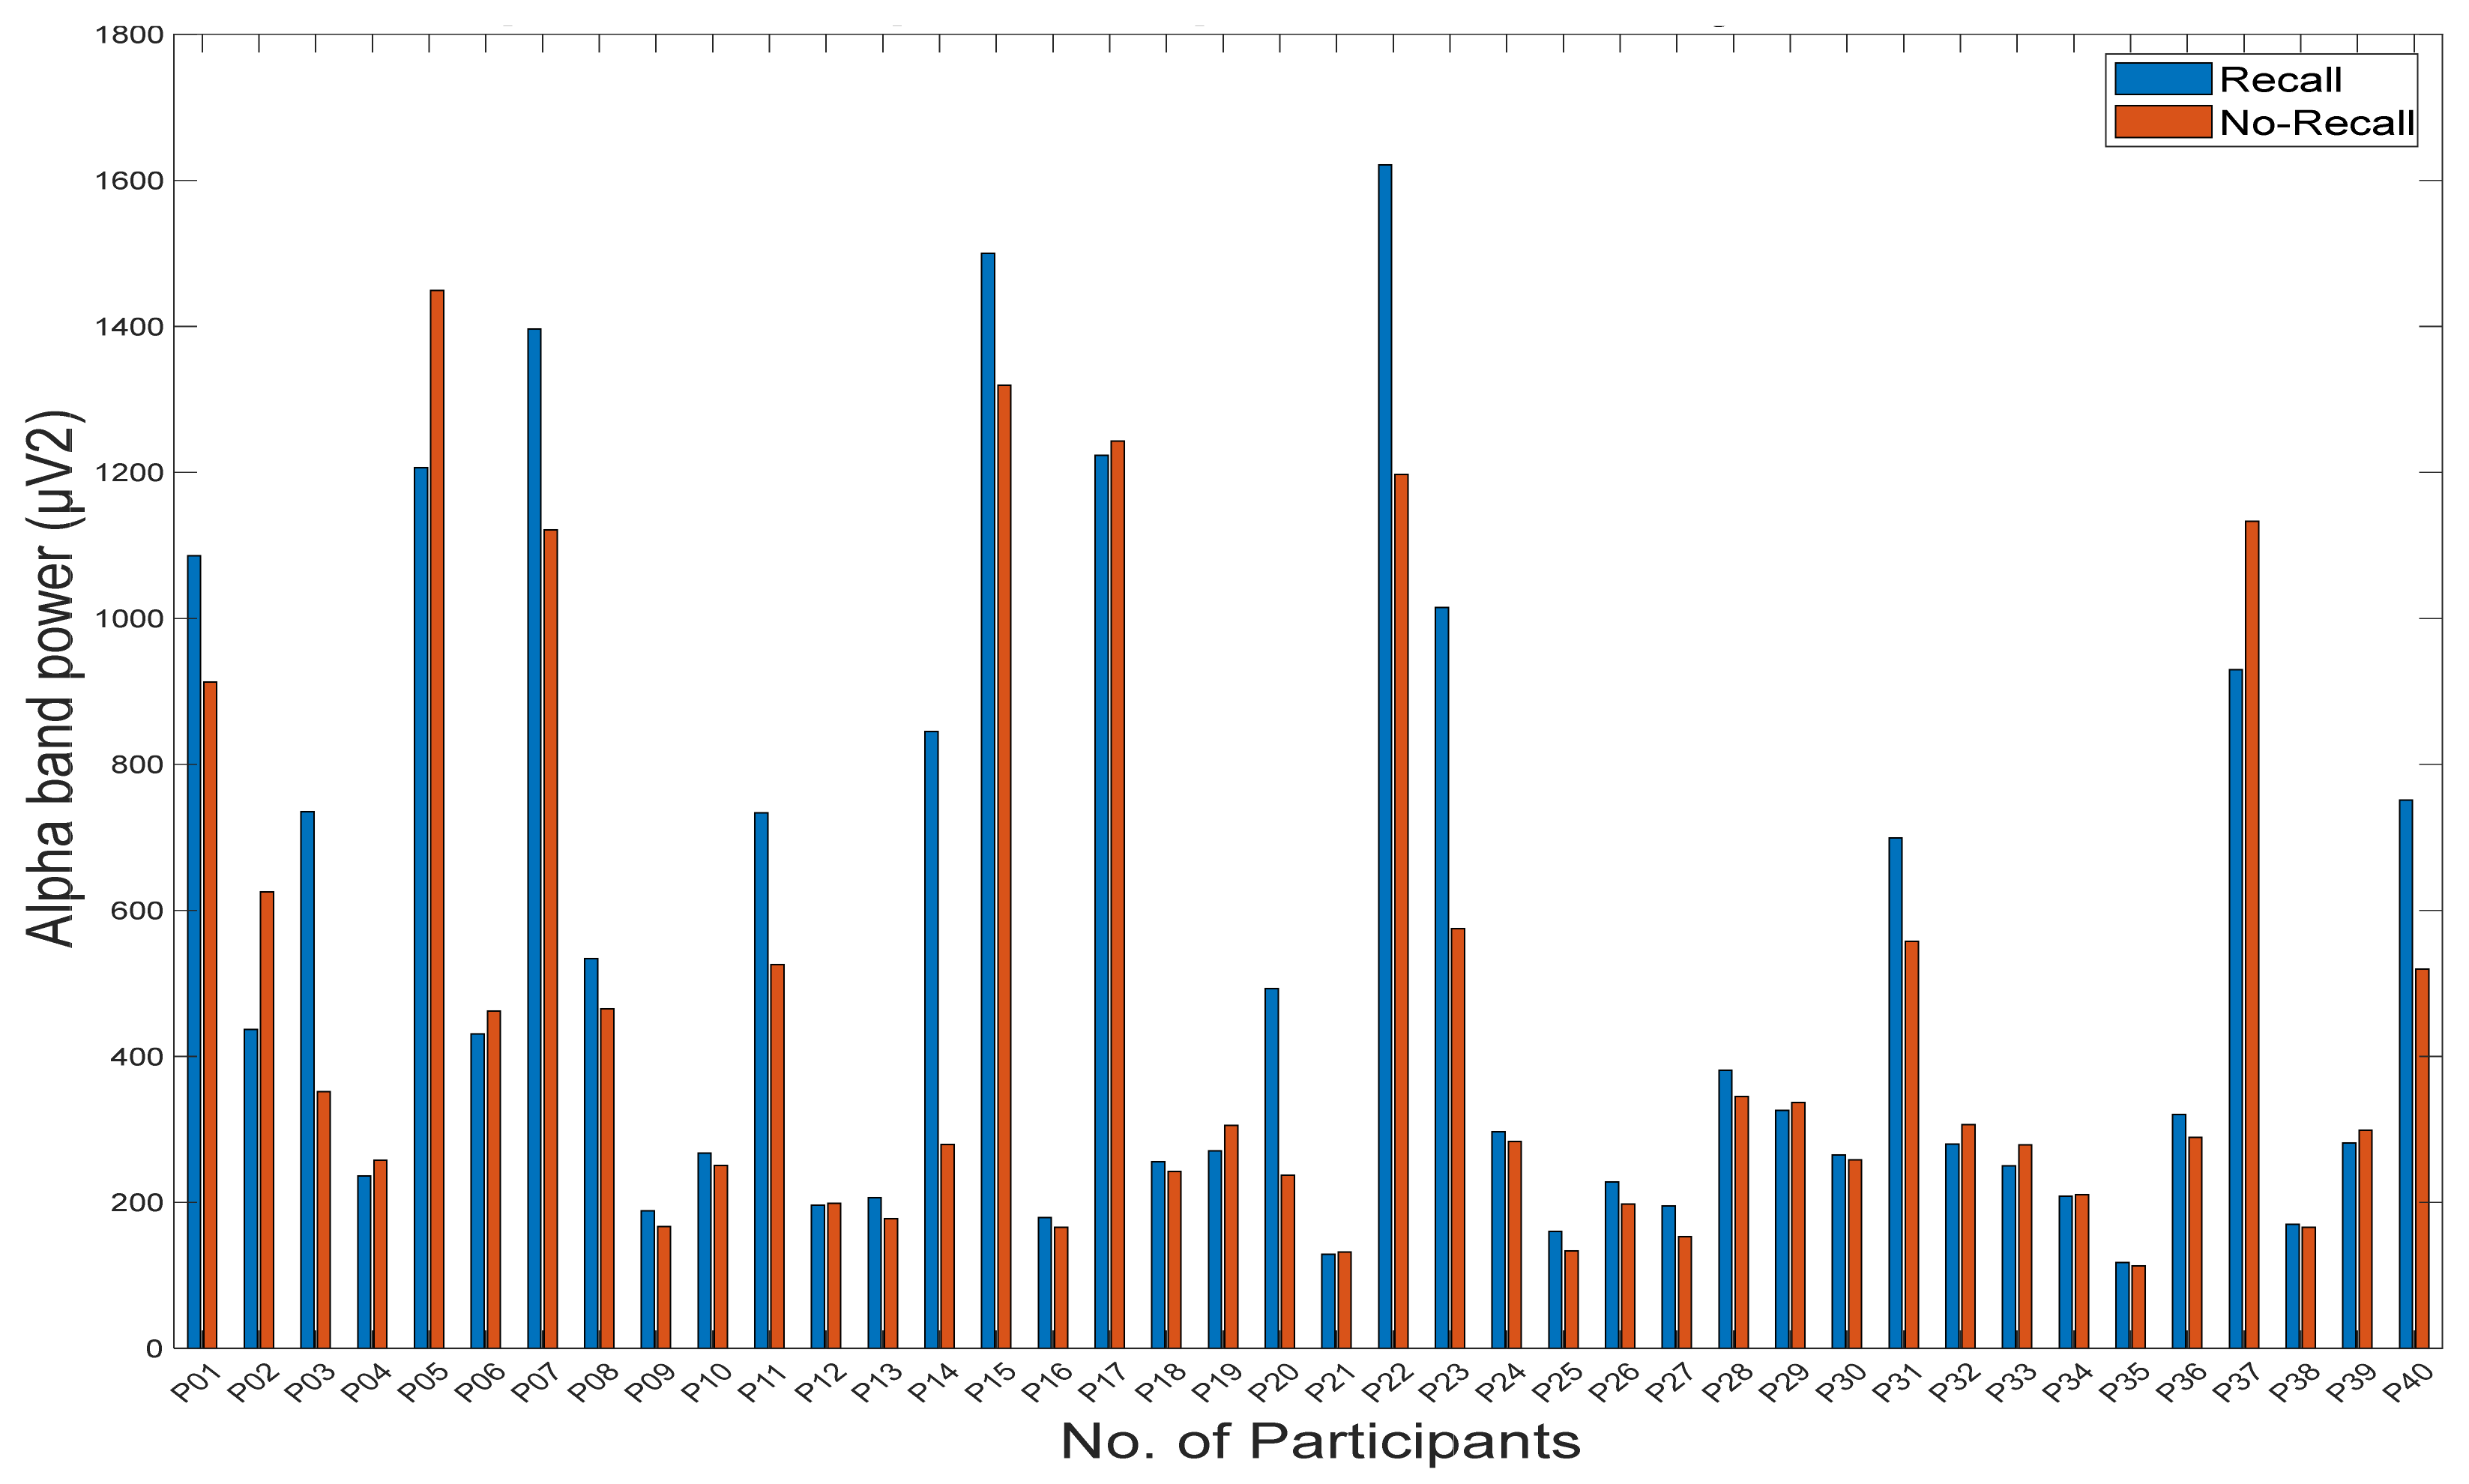
3.1. Statistical Analysis of Memory Recall

A total of 40 participants took part in this study. Each participant listens to nine pieces of music (three happy, three sad, and three neutral). All participants could recall some ABMs by listening to the songs. Some participants could recall ABMs by listening to eight songs out of nine songs. However, one participant could not recall any ABM by listening to seven out of nine songs. In total, participants could recall autobiographical memories by listening to 237 songs. Among those 237 songs, 94 are happy songs, 96 are sad songs, and 47 are neutral songs. However, 123 songs failed to recall any autobiographical memories. Among those 123 songs, 26 are happy songs, 24 are sad songs, and 73 are neutral songs.

3.2. EEG Data Analysis Results

Different EEG features were extracted for memory “recalled” scenarios and memory “no-recalled” scenarios for all participants and for all four channels. The sample of extracted EEG features is shown in Table 3.

3.2.1. The t-Test between Two Scenarios

The results of the t-test are shown in Table 4. There is a clear difference in alpha band power for all the channels (for F3: p = 0.007, F7: p = 0.039, F4: p = 0.002, and F8: p = 0.029) between the memory “recall” and “no-recall” scenarios. For beta power, there is a clear difference for two channels (for F3: p = 0.010 and F4: p = 0.021) but no significant difference between the other two channels (for F7: p = 0.679, and F8: p = 0.081) for the memory “recall” and memory “no-recall” scenarios. No other significant differences have been seen using other EEG features.

3.2.2. Pearson Correlation Coefficient between Paired Electrodes

The PCC for F3–F7 and F4–F8 are shown in Table 5 and Table 6. The F3–F7 pair of electrodes shows a strong correlation for both memory recall (r = 0.968) and no-recall (r = 0.837) scenarios for alpha band power. However, this pair has only a moderate correlation (0.8 < p < 0.5) for beta band power during memory recall (r = 0.748) and no-recall (r = 0.511). On the other hand, the F4–F8 pair of electrodes shows a moderate correlation for both memory recall (r = 0.738) and no-recall (r = 0.696) scenarios for alpha band power. However, this pair shows a low correlation (p < 0.5) for beta band power during the memory recall (r = 0.438) and no-recall (r = 0.313) scenarios.

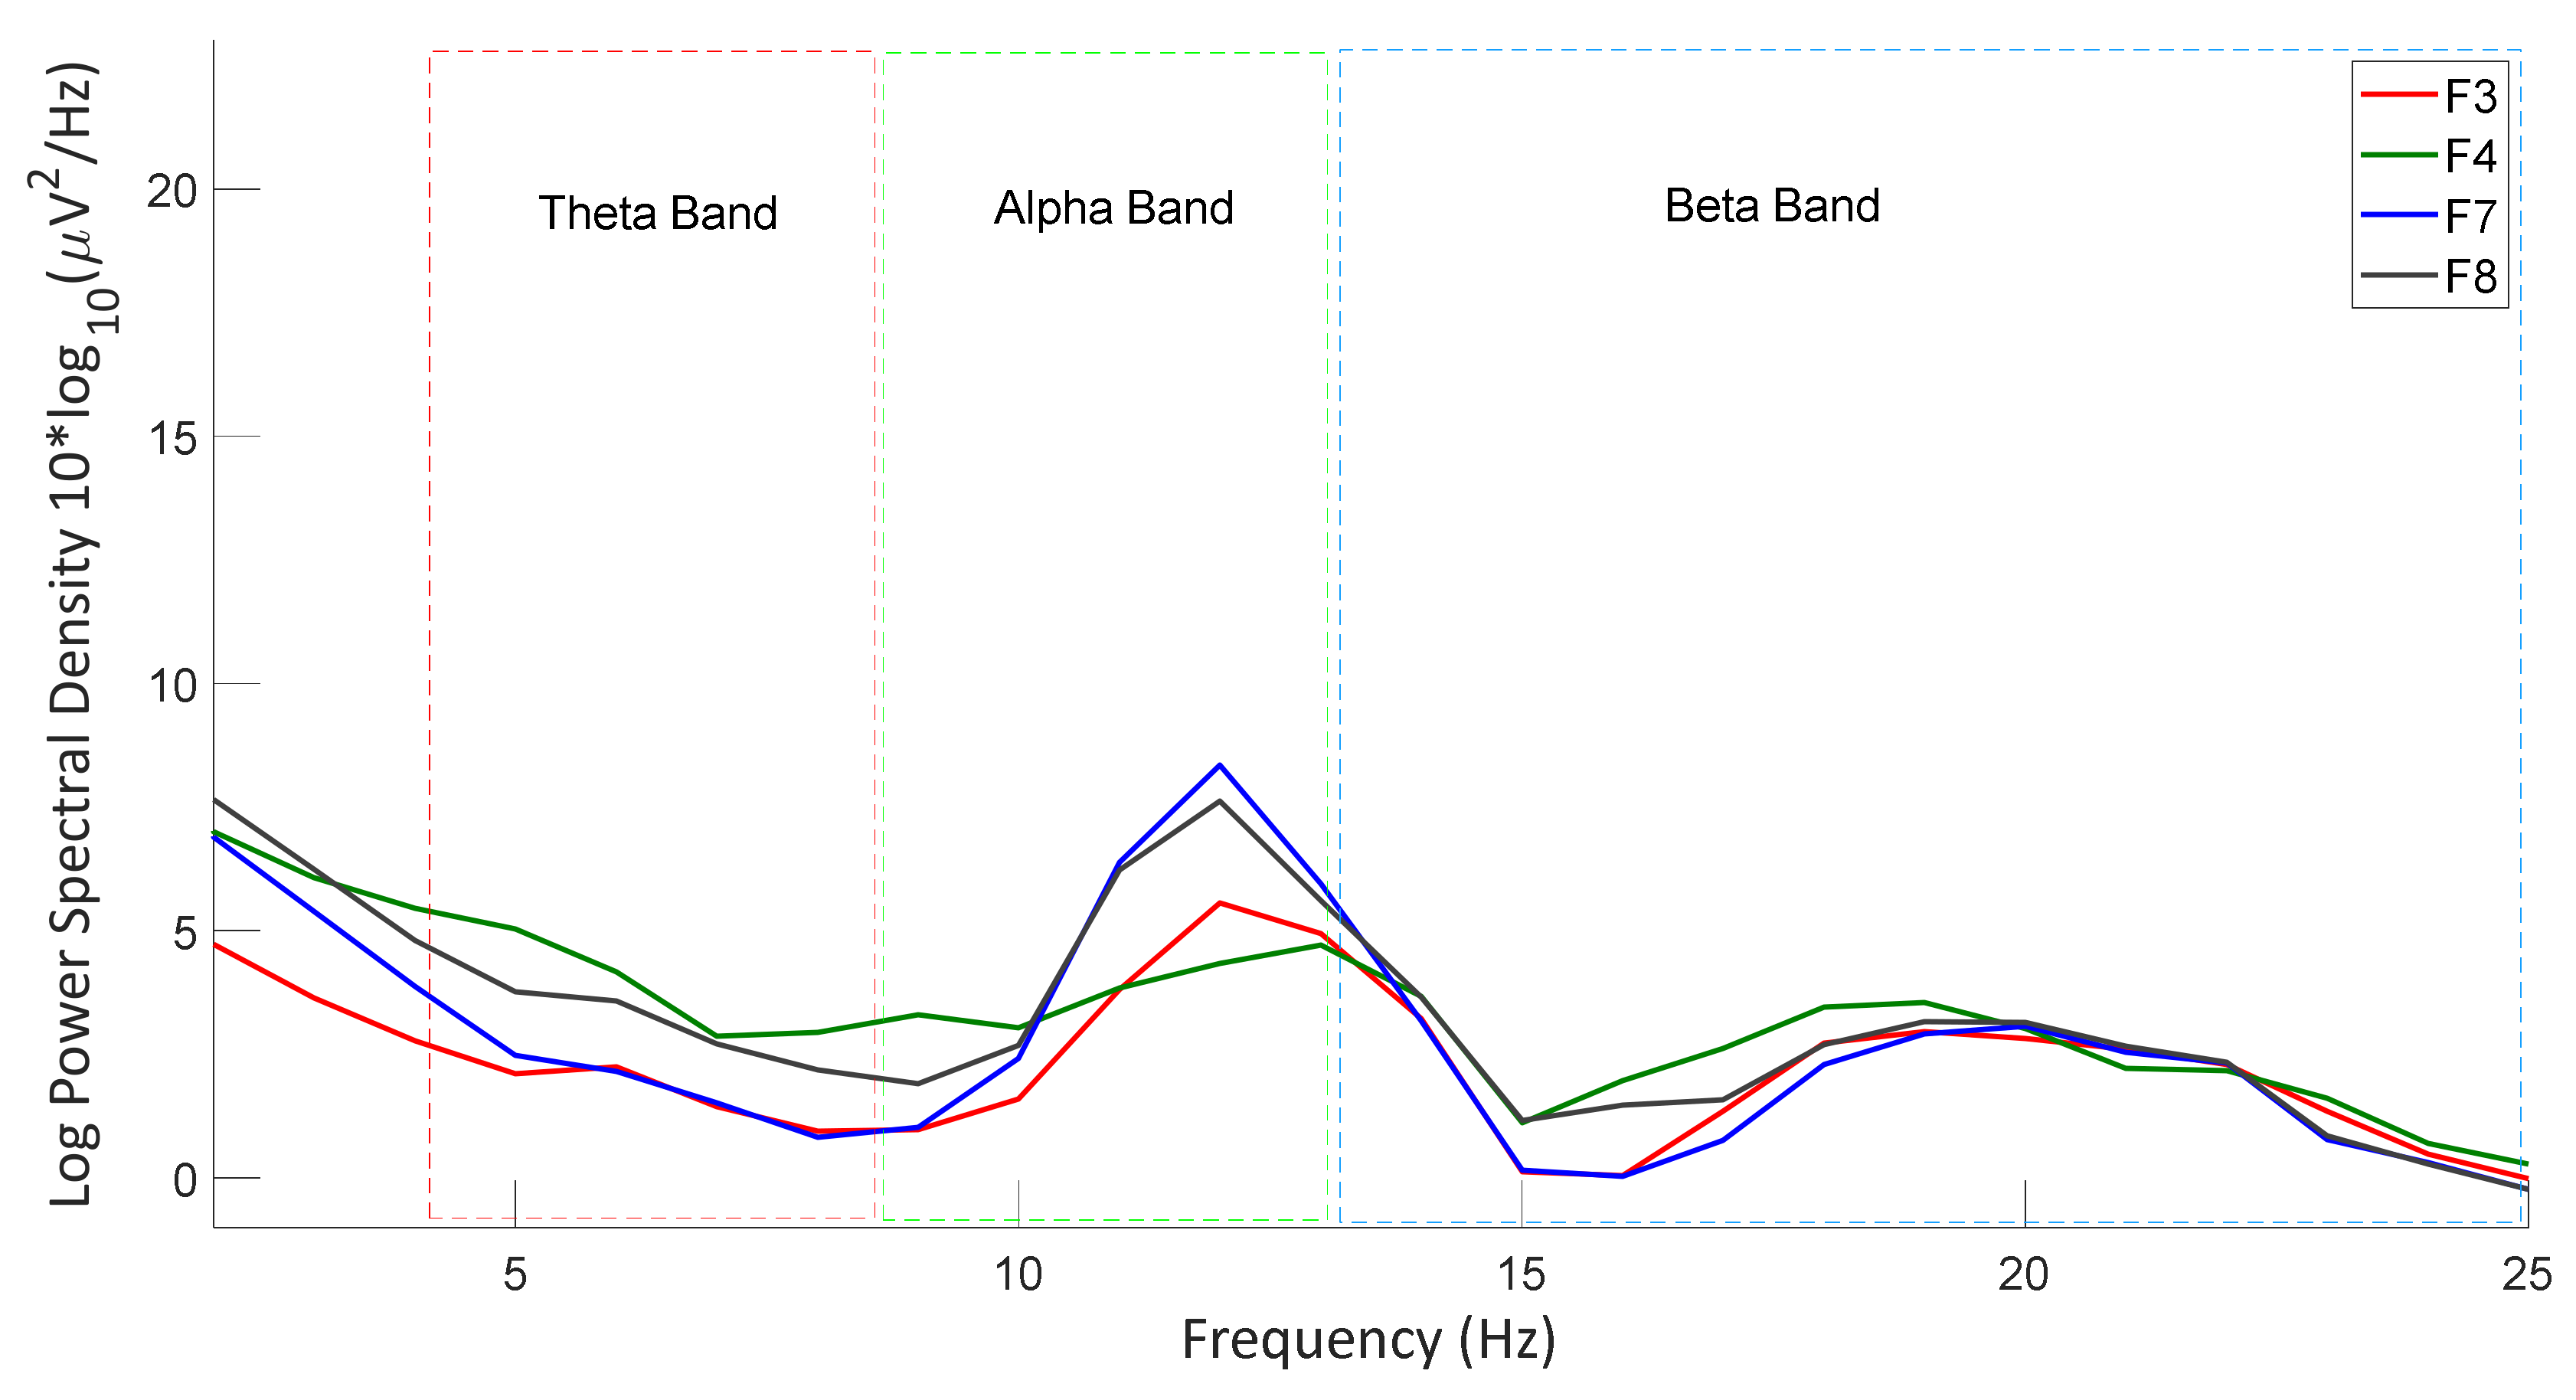
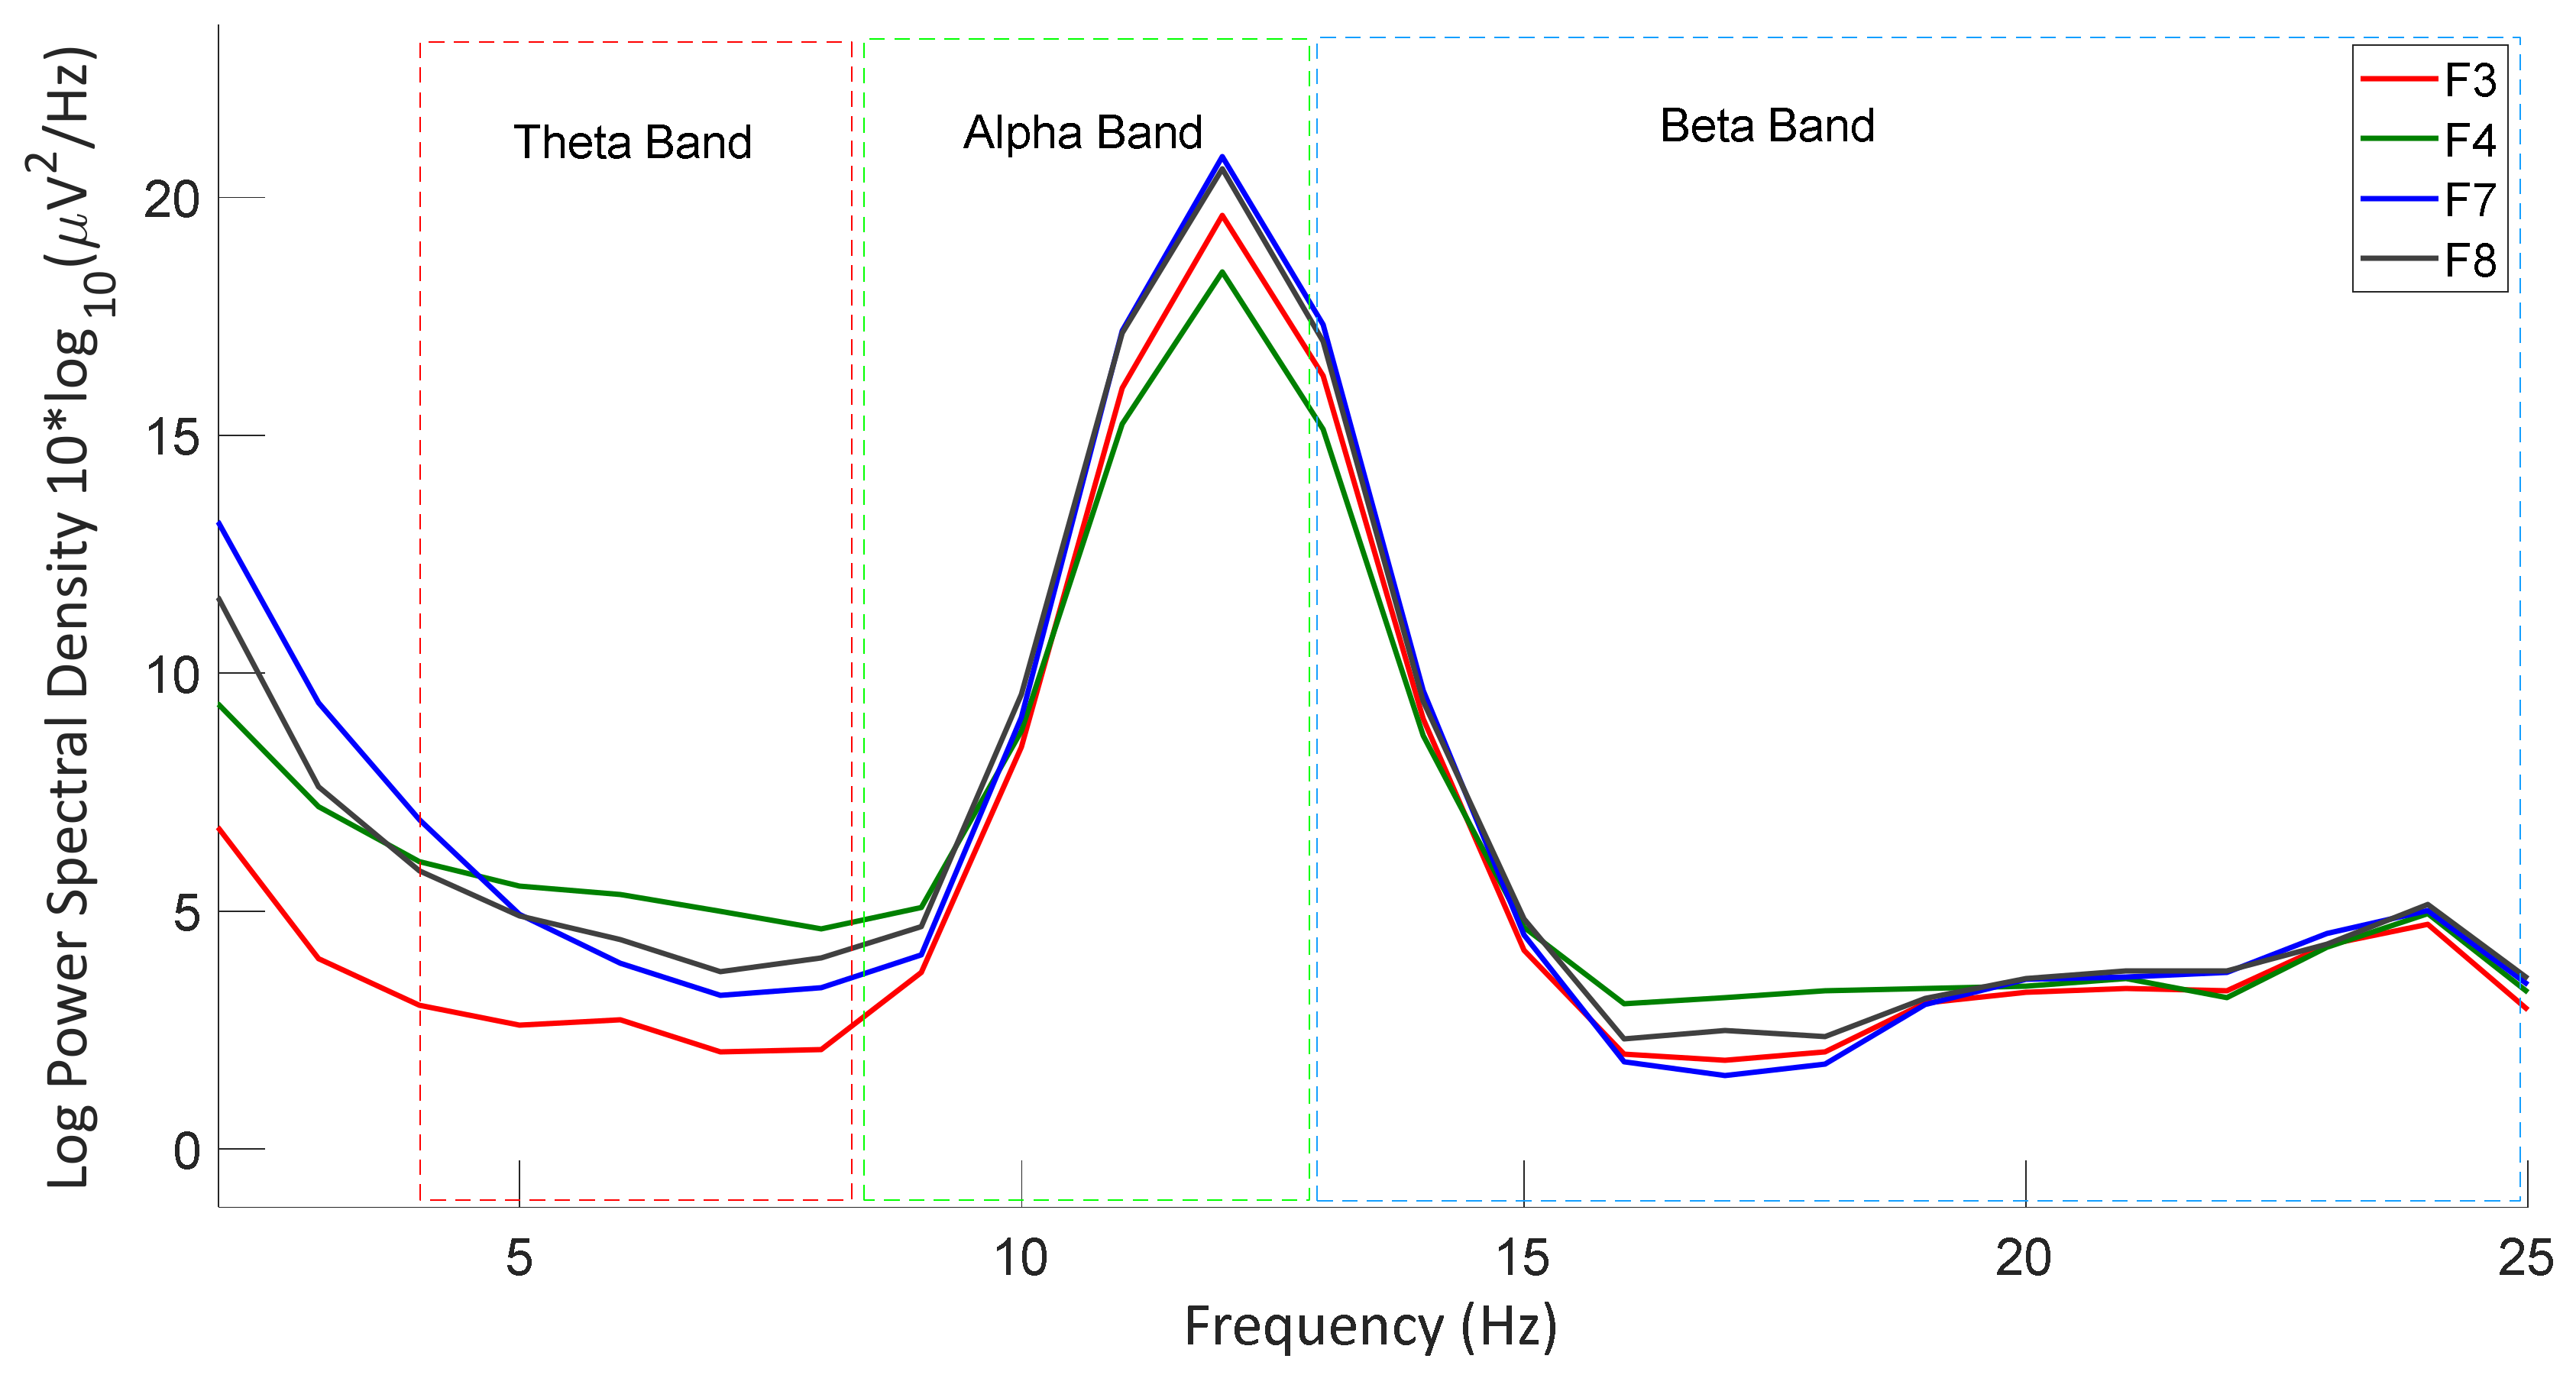
3.2.3. Power Spectral Density Analysis

Finally, the authors analyze the power spectral density of a memory “recall” scenario and a “no-recall” scenario for the same participants (participant No. 14). The analysis provides strong evidence that alpha band power density increases significantly during the memory “recall” scenario more than during the “no-recall” scenario. When the participant does not recall memories, the power spectral density in the alpha band for all four channels is comparatively low (≈8 µV2/Hz max). On the other hand, all four channels exhibit high power spectral density (≈20 µV2/Hz max) in the alpha band during the memory “recall” scenario. For the beta power, the power spectral density is also high, but not significantly, during the memory “recall” scenario. The power spectral density for memory “no-recall” and recall has been shown in Figure 7 and Figure 8.
To find how the alpha power changes during the memory “recall” and “no-recall” scenarios, the authors plot the alpha band power for each participant for channel F3. The comparison is shown in Figure 9. The figure shows that during the memory recall, alpha power increases significantly (on average, 16.2%) more than in the “no-recall” scenario.

3.3. EDA Data Analysis Results

The samples of the extracted EDA features during memory “recall” and “no-recall” scenarios are listed in Table 7.
Table 8 shows the results of the Wilcoxon signed-rank test between the electrodermal activity features acquired from the memory “recall” and “no-recall” scenarios. Based on the test, it was observed that there was a significant difference for the tonic standard deviation (p = 0.017), tonic min (p = 0.009), phasic standard deviation (p = 0.026), phasic max (p = 0.001), and phasic energy (p = 0.048). For the other features, no other significant changes were found.

4. Discussion

4.1. Contribution

In this experiment, the authors find an EEG biomarker that can verify autobiographical memory recall. The t-test results show a significant difference (for F3: p = 0.007, F7: p = 0.039, F4: p = 0.002, and F8: p = 0.029) in alpha band power for all four electrodes during the memory recall scenario compared to the memory no-recall scenario. On the other hand, the beta band power also showed a significant difference, but for only two electrodes (for F3: p = 0.010 and F4: p = 0.021). Then the Pearson correlation coefficient provides more evidence for our claim of alpha power as an EEG biomarker. However, this test does not provide much evidence for beta band power to be considered an EEG biomarker. In the power spectral density analysis, it has been observed that during the memory recall scenario, the power spectral density in the alpha band is much higher (≈20 µV2/Hz max) than in the memory no-recall scenario (≈8 µV2/Hz max). In contrast, the beta band power did not show any significant difference. The plot of alpha band power for all 40 participants shows that the alpha power is significantly greater during the memory recall scenario (on average, 16.2%) for most of the participants. So, this observation supports that alpha band power is an EEG biomarker that can verify memory recall. In [32], the authors find an EEG biomarker for the retrieval of lexical semantic information, which is theta power. In this study, the authors find an EEG biomarker of ABM recall, and that is alpha power. No significant association was found for theta power for ABM recall.
The authors also performed the Wilcoxon signed-rank test, which showed that some EDA features also changed significantly during the memory recall scenario. Those EDA features are phasic and tonic standard deviation, phasic max, tonic min, and phasic energy. This finding supports that the EDA signal has a relationship with memory recall.

4.2. Limitations

It is always challenging to work with human participants. A huge dataset is required to get a good result. At the beginning of the research, the primary goal was to collect data from 60 healthy participants, but during the pandemic it was challenging for the researchers to get participants for this lengthy study. In addition, no undergraduate students were allowed to take part in this study. The IRB approval also took a long time to be approved as they were very strict in ensuring safety during the pandemic. In addition, the researchers planned to collect data from dementia patients, but because of the pandemic, the IRB did not provide them with permission to work on patients with dementia. So, the researchers worked on healthy participants in this phase.
EEG data collection is always very tough because of its sensitive nature. Different types of artifacts always affect the collected data. Some participants were shaking their heads and bodies while listening to music, which is a source of motion and muscular artifacts. Two participants had difficulty wearing the headset for an extended period of time, as the length of the study was long, and the EEG headset had to have firm connectivity with the scalp. Another limitation is that data from only four electrodes (out of 23) have been analyzed.
During the EDA data collection, the authors faced some technical issues. The EDA live streaming software stopped working because the authors used the same laptop for both EDA and EEG data collection. So, for the first two participants, the authors could not collect EDA data.

4.3. Future Work

In the future, the authors plan to conduct a similar experiment on people with dementia and find the differences and/or similarities between those two studies. The authors also have some demographic research plans—for example, into the differences in memory recall for men and women and the differences in memory recall for different age groups. In addition, this study only used data from four electrodes. In the future, data from all electrodes will be used for the experiment. Future researchers can also implement other ways to increase the alpha band power to verify the claim of this study.

5. Conclusions

In this research, the researchers find that the alpha band power increases significantly during autobiographical memory recall. It provides further evidence that alpha band power is related (as a biomarker) to autobiographical memory recall. These findings can be used to design a therapy for dementia patients who frequently forget ABMs. The authors also observed the EDA activity along with the EEG and found a significant change in the phasic and tonic standard deviations and phasic power. Future researchers can take this finding and work more on autobiographical memory recall, not only in healthy participants but also in AD patients.

Author Contributions

Conceptualization, A.K. methodology, A.K.; software, R.K.D.; validation, R.K.D., A.K. and N.Z.I.; formal analysis, R.K.D.; investigation, A.K.; data curation, R.K.D., N.Z.I.; writing—original draft preparation, R.K.D.; writing—review and editing, R.K.D., A.K.; visualization, R.K.D.; supervision, A.K.; project administration, A.K. All authors have read and agreed to the published version of the manuscript.

Funding

This research received no external funding.

Institutional Review Board Statement

The study was conducted in accordance with the Declaration of Helsinki, and approved by the Institutional Review Board (or Ethics Committee) of University of Minnesota (protocol code STUDY00012606; approval date: 22 July 2021).” for studies involving humans participants.

Informed Consent Statement

Written informed consent has been obtained from the patient(s) before the study.

Data Availability Statement

Not applicable.

Acknowledgments

The authors thank Lisa Fitzpatrick from the Viz lab. Without her outstanding assistance, this paper and the research would not have been possible. She helped the authors not only by providing the DSI-24 device but also by arranging online training on how to use that device during the restrictions of the pandemic.

Conflicts of Interest

The authors declare no conflict of interest.

Abbreviations

EEGelectroencephalogram
EDAelectrodermal activity
ABMautobiographical memory
BPSDbehavioral and psychologic symptoms of dementia
qEEGquantitative EEG
mTBmild traumatic brain injury
DARdelta–alpha ratio
DTRdelta–theta ratio
ADAlzheimer’s disease
MEAMmusic-evoked autobiographical memory
IRBInstitutional Review Board
GSRgalvanic skin response
BVPblood volume response
IBIinterbeat interval
HRVheart rate variability
DSIdry sensor interface
ICAindependent component analysis
FIRfinite impulse response
ASRartifact subspace reconstruction
EKFextended Kalman filter
PFparticle filter
SCRskin conductance response
SCLskin conductance level
PSDpower spectral density
PCCPearson correlation coefficient

Appendix A

The happy and sad songs selected by each participant are shown here.
Table A1. The happy and sad songs selected by the participants.
Participant No.Happy 1Happy 2Happy 3Sad 1Sad 2Sad 3
1To Binaziri (by Farshid Amin)Engar Na Engar (by Mansour)Aroosi (by Sattar)Khoob Shod (by Homayoun Shajarian)Monge (by Heydoo Hedayati)Abr Mibarad (by Homayoun Shajarian)
2Love You Zindagi (by Amit Trivedi, Jasleen Royal)Don’t Let Her (by Walker Hayes)Price Tag (by Jessie J)One Light (by Linkin Park)Gravity (by Coldplay)Pal (by Arijit Singh)
3Blue Bird (by Ikimonogakari)Gulabi Aankhen (Sanam Puri)Raabta (Arijit Singh)Main Dhoondne Ko Zamaane Mein (by Arijit Singh)Breathless (by Shayne Ward)Older (by Sasha Sloan)
4Priyathama (by Samantha, Nani, Ilayaraja)A Thousand Years (by Christina Perri)Samjhawan (by Alia Bhatt)Selavanuko (by Nithiin and Adah)Aaja Sanam Madhur Chandni (by Nargis, Raj K)Agar Tum Saath Ho (ALKA YAGNIK, ARIJIT SINGH)
5Come and Get Your Love (by Redbone)I’m Walking on Sunshine (by Katrina and the Waves)Beethoven Symphony No. 7 4th MovementSchubert Sonata No. 18 (by Mitsuko Uchida)Blue Spotted Tail (by Fleet Foxes)Vissi d’arte (by Tosca)
6Glass Animals (by Heat waves)Never Been in Love (by Hailey Campbell)Who Says (by Selena Gomez)Just Go to Hell Dil (by Amit Trivedi)Let Me Down Slowly (by Alec Benjamin)Malupu (by Vinay Shanmukh)
7Tomake (by Shandhi Sovvota)Wavin’ Flag (by K’naan Warsame)Holding Out for a Hero (by Bonnie Tyler)Here Without You (by 3 Doors Down)You and Me (by Lifehouse)Hallelujah (by Leonard Cohen)
8Believer (by Imagine Dragons)Zaalima (by Arijit Singh & Harshdeep Kaur)All of Me (by John Legend)Easy on Me (by Adele)Tere sang yaara (by Atif Aslam)The scientist (by Coldplay)
9Mr. Blue Sky (by Electric Light Orchestra)Killer Queen (by Queen)Static Space Lover (by Foster the People)Royals (by Lorde)Hurt (by Johnny Cash)Something in the Way (by Nirvana)
10Mr. Blue Sky (by Electric Light Orchestra)Let Me Live/Let Me Die (Des Rocs)Rock It for Me (by Caravan Palace)Ai to Shuu (by Toshiro Masuda)Pain (by Three Days Grace)Easy (by Son Lux)
11Understanding in a Car Crash (by Thursday)Live Wire (by Motley Crue)DESTINY (by Chris Klumpp)Diamond Lost (by The Devil Wears Prada)sugar honey ice & tea (by Bring Me the Horizon)Bury Your Head (by Saosin)
12Dil Kya Kare (by Adnan Sami)Dil Ke Dastakk (by Karthik Rao, Shilpa Surroch)Hey Ya! (by Loy Mendonca)Beete Lamhe (by Emraan Hashmi, Geeta Basra)Agar Tum Saath Ho (by ALKA YAGNIK, ARIJIT SINGH)Sach Keh Raha Hai (by Kay (K.K))
13Un Vizhigalil (by Anirudh Ravichander & Shruti Haasan)Pallikoodam (by Sanjith Hegde)Naan Pizhai (by Ravi G & Shashaa Tirupati)Kanave Kanave (by Anirudh)Usure (by Sudharshan Ashok, Jothi Pushpa)Nee Nenacha (by Sid Sriram)
14Highway to Hell (by AC/DC)Faguner Mohonay (by Bhumi)Take Me Home, Country Roads (by John Denver)Soldier of Fortune (by Deep Purple)Aamar Vanga Ghore Vanga Chala (by Sabina Yesmin)Channi posor raite jeno (by S.I. Tutul)
15Golden (by Harry Styles)Levitating (by Dua Lipa)Holding Out for a Hero (by Bonnie Tyler)No Way Out (by Phil Collins)Angel (by Sarah McLachlan)Gavi’s Song (by Lindsey Stirling)
16Yeh Jawaani Hai Deewani (by Pritam)Nightingale (by Yanni)Havana (by Camila Cabello)Dhoro Jodi Hothat Sondhye (by Baundule)Shiddat (by Manan Bhardwaj)Amaro Parano Jaha Chay (by Arijit Singh)
17New South Africa (by Béla Fleck, Abigail Washburn)Alone (by Masayoshi Takanaka)Feather (by Nujabes)Ride To U (by Béla Fleck & Abigail Washburn)1913 Massacre (by Woody Guthrie)Give A Rose (by Nina May)
18Unstoppable (by Sia)Porcupine Tree (by Lazarus)Nightdriver (by EIDA)Heaven (by Nathan Grisdale)Tumi Robe Nirobe (by Esraj and Shubhayu)Abhi Mujh Mein Kahin (by Sonu Nigam)
19Take Me Home, Country Roads (by John Denver)Yellow (by Coldplay)something just like this (by Coldplay)Tum Pe Hum Toh (by Jyotica Tangri)Amake Amar Moto Thakte Dao (by Anupam Roy)Hariye Giyechi (by Arnob)
20Don’t Be Shy (by Tiësto & Karol G)Bad Habits (by Ed Sheeran)Know Me Too Well (by New Hope Club, Danna Paola)No Time to Die (by Billie Eilish)Parga’dan Beri (by Fahir Atakoglu)Dönmek (by Fahir Atakoglu)
21When We Feel Young (by When Chai Met Toast)My Universe (by Coldplay X BTS)CAN’T STOP THE FEELING! (by Justin Timberlake)Fix You (by Coldplay)Creep (by Radiohead)Rivers and Roads (by The Head and the Heart)
22Thunderstruck (by AC/DC)Deutschland (by Rammstein)Without Me (by Eminem)Zombie (by Bad Wolves)Jodi Konodin (by Aurthohin)Dukkho Bilash (by Artcell)
23Wavin’ Flag (by K’naan Warsame)Fireflies (by Owl City)something just like this (Coldplay)Sadness and Sorrow (by MUSASHI)Brothers (by Taylor Davis)Loneliness & What is Brox3n (by Brox3n)
24Zip-A-Dee-Doo-Dah (by James Baskett)Mussorgsky—Pictures at an Exhibition (by Kurt Masur)Vivaldi (by The Four Seasons)Climb Every Mountain (by Peggy Wood)Suzanne (by Elektra Asylum)Madame Butterfly (by Maria Callas))
25Some Kind of Wonderful (by Marvin Gaye)All I Wanna Do (by Sheryl Crow)The Luckiest Guy (by The Magnetic Fields)Color of the Blues (by George Jones)Rainy Night in Georgia (by Brook Bentos)Love Will Tear Us Apart (by Joy Division)
26Hard Rock Hallelujah (by Lordi)Blame It on the Boogie (by The Jacksons)September (by Earth, Wind & Fire)Beautiful Savior (by F. Melius Christiansen)Oh Danny Boy (Irish Traditional)Leaving on a Jet Plane (by Peter, Paul & Mary)
27Rock Me (by Steppenwolf)Hey Pocky A-Way (by The Meters)Back in Black (by AC/DC)Fire and Rain (by James Taylor)Landslide (by Mick Fleetwood)Cats in the Cradle (by Harry Chapin)
28Fxxk It (by BIGBANG)We Like 2 Party (by BIGBANG)I am the Best (by 2NE1)Still Life (by BIGBANG)Let’s Not Fall in Love (by BIGBANG)Untitled, 2014 (by G-Dragon)
29Bad Habits (by Ed Sheeran)Fairytale (by Alexander Rybak)Namehraboon (by Fataneh)From the Northern Country (by Ashkan)Koja Bayad Beram (by Roozbeh Bemani)Sedaye Baroon (by Sattar)
30Walk of Life (by Dire Straits)Aaj Phir Jeene Ki Tamanna Hai (by Lata Mangeshkar)Stayin’ Alive (by Bee Gees)Barber (by Vienna Philharmonic)Streets of Philadelphia (by Bruce Springsteen)Tujhse Naraz Nahi Zindagi (by Lata Mangeshkar)
31Livin’ on a Prayer (by Bon Jovi)Fix You (by Coldplay)Breaking the Habit (by Linkin Park)Tumi rabe nirobe (by Sen Majumdar)Jokhon Nirobe Dure (by Nageeb Hassan)Adagio (by HAUSER)
32Yellow (by Coldplay)Sign of the Times (by Harry Styles)Let Her Go (by Passenger)How to Save a Life (by The Fray)Mockingbird (by Eminem)Shallow (by Lady Gaga, Bradley Cooper)
33Pepas (by Farruko)Party On My Mind (by Honey Singh)Lat Lag Gayee Lyrical (by Benny Dayal, Shalmali)Tu Jaane Na (by Atif Aslam)Agar Tum Saath Ho (by Alka Yagnik, Arijit Singh)Mat Kar Maya Ko Ahankar (by Neeraj Arya’s Kabir Café)
34Love You Zindagi (by Amit Trivedi, Jasleen Royal)Beat It (by Michael Jackson)Levitating (by Dua Lipa)Wolves (by Selena Gomez)Amake Amar Moto Thakte Dao (by Anupam Roy)Kill Em with Kindness (Selena Gomez)
35Hairat Lyrical (by Lucky Ali)DOLLAZ ON MY HEAD (by Gunna)Dus Bahane Karke Le Gaye Dil (by K K, Shaan)I Know (by Polo G)Kaun Hoon Main (by Atif Aslam)Give Me Some Sunshine (by Shantanu Moitra)
36Calma (by Pedro Capó, Farruko)Muy Feliz (by Nicky Jam)Djadja Remix (by Aya Nakamura)Say Something (by Christina Aguilera)Inolvidable (by Beéle & Ovy on the Drums)Thunder and Lightning (by Passenger)
37The Best Time of My Life (by Cloud Cult)Three Little Birds (by Bob Marley & The Wailers)There’s So Much Energy in Us (by Cloud Cult)Love You All (by Cloud Cult)Love You All (by Cloud Cult)Sigh No More (by Mumford & Sons)
38Telephone (by Lady Gaga)Storm (by Antonio Vivaldi)Run Run (by Indila)Vois sur ton chemin (by Les Choristes)La Llorona (by Angela Aguilar)Cancion Mixteca Cuco Sanchez
3910,000 Hours (by Dan + Shay, Justin Bieber)As I Am (by Harry Styles)All that Glitters (by Earl)Easy on Me (by Adele)Shallow (by Lady Gaga)The Night We Met (by Lord Huron)
40Zaalima (by Arijit Singh & Harshdeep Kaur)Love You Zindagi (by Amit Trivedi, Jasleen Royal)Matargasht (by Mohit Chauhan)Maa (by Shankar Mahadevan)Tere sang yaara (by Atif Aslam)Tum Hi Ho (by Arijit Singh)

References

  1. Irish, M.; Cunningham, C.J.; Walsh, J.B.; Coakley, D.; Lawlor, B.A.; Robertson, I.H.; Coen, R.F. Investigating the enhancing effect of music on autobiographical memory in mild Alzheimer’s disease. Dement. Geriatr. Cogn. Disord. 2006, 22, 108–120. [Google Scholar] [CrossRef] [PubMed]
  2. Types of Memory, Queensland Brain Institute, University of Queensland. Available online: https://qbi.uq.edu.au/brain-basics/memory/types-memory (accessed on 23 November 2022).
  3. Where Are Memories Stored in the Brain? Available online: https://qbi.uq.edu.au/brain-basics/memory/where-are-memories-stored (accessed on 2 December 2016).
  4. Jasvinder, S.; Ratnawat, A. Algorithmic Music Generation for the stimulation of Musical Memory in Alzheimer’s. In Proceedings of the 2018 4th International Conference on Computing Communication and Automation (ICCCA), Greater Noida, India, 14–15 December 2018. [Google Scholar]
  5. Thomas, D.W.; Smith, M. The effect of music on caloric consumption among nursing home residents with dementia of the Alzheimer’s type. Act. Adapt. Aging 2009, 33, 1–16. [Google Scholar] [CrossRef]
  6. Aysha, M. Finding memories in the ‘music mirror’. Nurs. Resid. Care 2021, 23, 1–3. [Google Scholar]
  7. Schulkind, M.D.; Hennis, L.K.; Rubin, D.C. Music, emotion, and autobiographical memory: They’re playing your song. Mem. Cogn. 1999, 27, 948–955. [Google Scholar] [CrossRef]
  8. Music Can Boost Memory and Mood. Harvard Health. Available online: https://www.health.harvard.edu/mind-and-mood/music-can-boost-memory-and-mood (accessed on 14 February 2015).
  9. Raglio, A.; Bellelli, G.; Traficante, D.; Gianotti, M.; Ubezio, M.C.; Villani, D.; Trabucchi, M. Efficacy of music therapy in the treatment of behavioral and psychiatric symptoms of dementia. Alzheimer Dis. Assoc. Disord. 2008, 22, 158–162. [Google Scholar] [CrossRef] [Green Version]
  10. Svansdottir, H.B.; Snædal, J. Music therapy in moderate and severe dementia of Alzheimer’s type: A case–control study. Int. Psychogeriatr. 2006, 18, 613–621. [Google Scholar] [CrossRef] [Green Version]
  11. Biomarkers Definitions Working Group; Atkinson, A.J., Jr.; Colburn, W.A.; DeGruttola, V.G.; DeMets, D.L.; Downing, G.J.; Hoth, D.F.; Oates, J.A.; Peck, C.C.; Spilker, B.A.; et al. Biomarkers and surrogate endpoints: Preferred definitions and conceptual framework. Clin. Pharmacol. Ther. 2001, 69, 89–95. [Google Scholar]
  12. Pérez-Elvira, R.; Oltra-Cucarella, J.; Carrobles, J.; Teodoru, M.; Bacila, C.; Neamtu, B. Individual alpha peak frequency, an important biomarker for live z-score training neurofeedback in adolescents with learning disabilities. Brain Sci. 2021, 11, 167. [Google Scholar] [CrossRef]
  13. Lewine, J.D.; Plis, S.; Ulloa-Cerna, A.; Williams, C.; Spitz, M.; Foley, J.; Paulson, K.; Davis, J.; Bangera, N.; Snyder, T.; et al. Quantitative EEG biomarkers for mild traumatic brain injury. J. Clin. Neurophysiol. 2019, 36, 298–305. [Google Scholar] [CrossRef]
  14. Hussain, I.; Hossain, A.; Jany, R.; Bari, A.; Uddin, M.; Kamal, A.R.M.; Ku, Y.; Kim, J.-S. Quantitative Evaluation of EEG-Biomarkers for Prediction of Sleep Stages. Sensors 2022, 22, 3079. [Google Scholar] [CrossRef]
  15. Chan, A.S.; Ho, Y.-C.; Cheung, M.-C. Music training improves verbal memory. Nature 1998, 396, 128. [Google Scholar] [CrossRef] [PubMed]
  16. Ho, Y.-C.; Cheung, M.-C.; Chan, A.S. Music training improves verbal but not visual memory: Cross-sectional and longitudinal explorations in children. Neuropsychology 2003, 17, 439. [Google Scholar] [CrossRef] [PubMed]
  17. El Haj, M.; Postal, V.; Allain, P. Music enhances autobiographical memory in mild Alzheimer’s disease. Educ. Gerontol. 2012, 38, 30–41. [Google Scholar] [CrossRef]
  18. Belfi, A.M.; Karlan, B.; Tranel, D. Music evokes vivid autobiographical memories. Memory 2015, 24, 979–989. [Google Scholar] [CrossRef] [PubMed]
  19. Martin, M.A.; Metha, A. Recall of early childhood memories through musical mood induction. Arts Psychother. 1997, 24, 447–454. [Google Scholar] [CrossRef]
  20. Wallace, W.T. Memory for music: Effect of melody on recall of text. J. Exp. Psychol. Learn. Mem. Cogn. 1994, 20, 1471. [Google Scholar] [CrossRef]
  21. Simmons-Stern, N.R.; Deason, R.G.; Brandler, B.J.; Frustace, B.S.; O’Connor, M.K.; Ally, B.A.; Budson, A.E. Music-based memory enhancement in Alzheimer’s disease: Promise and limitations. Neuropsychologia 2012, 50, 3295–3303. [Google Scholar] [CrossRef] [Green Version]
  22. Delorme, A.; Makeig, S. EEGLAB: An open source toolbox for analysis of single-trial EEG dynamics including independent component analysis. J. Neurosci. Methods 2004, 134, 9–21. [Google Scholar] [CrossRef] [Green Version]
  23. Klug, M.; Gramann, K. Identifying key factors for improving ICA-based decomposition of EEG data in mobile and stationary experiments. Eur. J. Neurosci. 2020, 54, 8406–8420. [Google Scholar] [CrossRef]
  24. Abhang, P.A.; Gawali, B.W.; Mehrotra, S.C. Introduction to EEG-and Speech-Based Emotion Recognition; Academic Press: Cambridge, MA, USA, 2016. [Google Scholar]
  25. Kumar, J.S.; Bhuvaneswari, P. Analysis of Electroencephalography (EEG) signals and its categorization—A study. Procedia Eng. 2012, 38, 2525–2536. [Google Scholar] [CrossRef] [Green Version]
  26. Föll, S.; Maritsch, M.; Spinola, F.; Mishra, V.; Barata, F.; Kowatsch, T.; Fleisch, E.; Wortmann, F. FLIRT: A feature generation toolkit for wearable data. Comput. Methods Programs Biomed. 2021, 212, 106461. [Google Scholar] [CrossRef]
  27. Greco, A.; Valenza, G.; Lanata, A.; Scilingo, E.P.; Citi, L. cvxEDA: A convex optimization approach to electrodermal activity processing. IEEE Trans. Biomed. Eng. 2015, 63, 797–804. [Google Scholar] [CrossRef]
  28. Benedek, M.; Kaernbach, C. Decomposition of skin conductance data by means of nonnegative deconvolution. Psychophysiology 2010, 47, 647–658. [Google Scholar] [CrossRef] [Green Version]
  29. Saeid, S.; Chambers, J.A. EEG Signal Processing; John Wiley & Sons: Hoboken, NJ, USA, 2013. [Google Scholar]
  30. Warren, W.; Bandeali, A. Spyder: Scientific Python Development Environment. 2009. Available online: https://github.com/spyder-ide/spyder (accessed on 15 December 2017).
  31. Bhavsar, R.; Sun, Y.; Helian, N.; Davey, N.; Mayor, D.; Steffert, T. The correlation between EEG signals as measured in different positions on scalp varying with distance. Procedia Comput. Sci. 2018, 123, 92–97. [Google Scholar] [CrossRef]
  32. Bastiaansen, M.C.; Oostenveld, R.; Jensen, O.; Hagoort, P. I see what you mean: Theta power increases are involved in the retrieval of lexical semantic information. Brain Lang. 2008, 106, 15–28. [Google Scholar] [CrossRef]
Figure 1. Experimental procedure.
Ctn 06 00026 g001
Figure 2. Empatica E4 device.
Ctn 06 00026 g002
Figure 3. DSI-24 device.
Ctn 06 00026 g003
Figure 4. Rejection of bad data (red lines) using EEGLAB.
Ctn 06 00026 g004
Figure 5. The positions of the electrodes of the EEG sensor.
Ctn 06 00026 g005
Figure 6. Phasic and tonic components of EDA signal.
Ctn 06 00026 g006
Figure 7. Power spectral density of each band for memory “no-recall” scenario.
Ctn 06 00026 g007
Figure 8. Power spectral density of each band for memory “recall” scenario.
Ctn 06 00026 g008
Figure 9. Comparison of alpha power for memory recall and no-recall.
Ctn 06 00026 g009
Table 1. Demographic information of the participants.
CharacteristicsInformation
Participant number40
Age (mean)31.025
Age (standard deviation)11.53
Age range20–72
GenderM: 20, F:20
Table 2. Experimental protocol.
StepsActivityTime (Minute)
1Fill out the consent form3
2Wear an EEG headset and EDA wristband5
3Baseline data collection3
4Data collection during listening to music27
5Fill-up post-survey54
Total92
Table 3. Sample of extracted EEG features for F3 channel.
Participant NoMemory RecallArithmetic Mean (uV)Standard Deviation (uV)Hjorth ActivityHjorth ComplexityHjorth MobilityMean Energy (uV2)Shannon EntropyBand Power-Gamma (uV2)Band Power-Beta (uV2)Band Power-Alpha (uV2)Band Power-Theta (uV2)Mean-Gamma (uV)Mean-Beta (uV)Mean-Alpha (uV)Mean-Theta (uV)
36Recalled−0.1128.59973.942.1160.26273.9814.659.66671.76320.5534.40.00010.026−0.0700.229
36No-Recall−0.2278.20867.372.0860.26867.4214.559.52169.40289.1462.3−0.0002−0.003−0.059−0.137
37Recalled0.47533.9811543.6460.167115514.2126.81230.4929.619240.0004−0.0210.021−0.363
37No-Recall0.28414.95223.41.9020.269223.714.5428.08262.311331327−0.001−0.017−0.3890.398
38Recalled−0.1948.39770.512.2360.31470.5714.5017.7975.08170.0337.50.0002−0.0060.0780.162
38No-Recall−0.0498.09965.602.1100.33265.6914.5218.5979.47165.9304.80.0000−0.0550.031−0.049
39Recalled−0.44011.18124.92.5020.269125.114.5221.26107.2281.6617.7−0.00070.022−0.075−0.438
39No-Recall−1.88813.09171.42.9430.229174.913.8220.94105.3299.1769.10.0050.032−0.015−0.480
40Recalled−0.14412.54157.32.1070.303157.414.5230.19169.3751.1873.8−0.00010.006−0.0440.033
40No-Recall−0.05011.73137.62.1170.316137.514.5231.46153.8519.5757.80.001−0.1770.063−0.044
Table 4. The t-test results for EEG features between the memory recall and no-recall data.
EEG Featurep-Value
F3F7F4F8
Arithmetic Mean (EEG)p = 0.426 | h = 0p = 0.800 | h = 0p = 0.129 | h = 0p = 0.276 | h = 0
Standard Deviation (EEG)p = 0.063 | h = 0p = 0.296 | h = 0p = 0.017 | h = 1p = 0.146 | h = 0
Hjorth Activityp = 0.133 | h = 0p = 0.627 | h = 0p = 0.052| h = 0p = 0.216 | h = 0
Hjorth Complexityp = 0.188 | h = 0p = 0.708| h = 0p = 0.042 | h = 1p = 0.611 | h = 0
Hjorth Mobilityp = 0.057 | h = 0p = 0.097 | h = 0p = 0.002 | h = 1p = 0.275 | h = 0
Mean Energy (EEG)p = 0.120 | h = 0p = 0.716 | h = 0p = 0.056 | h = 0p = 0.225 | h = 0
Shannon Entropyp = 0.751 | h = 0p = 0.736 | h = 0p = 0.358 | h = 0p = 0.978 | h = 0
Band Power-Gammap = 0.275 | h = 0p = 0.641 | h = 0p = 0.234 | h = 0p = 0.418 | h = 0
Band Power-Betap = 0.010 | h = 1p = 0.679 | h = 0p = 0.021 | h = 1p = 0.081 | h = 0
Band Power-Alphap = 0.007 | h = 1p = 0.039 | h = 1p = 0.002 | h = 1p = 0.029 | h = 1
Band Power-Thetap = 0.062 | h = 0p = 0.709 | h = 0p = 0.022 | h = 1p = 0.362 | h = 0
Mean-Gammap = 0.225 | h = 0p = 0.692 | h = 0p = 0.926 | h = 0p = 0.853 | h = 0
Mean-Betap = 0.409 | h = 0p = 0.850 | h = 0p = 0.643 | h = 0p = 0.576 | h = 0
Mean-Alphap = 0.411 | h = 0p = 0.699 | h = 0p = 0.515 | h = 0p = 0.444 | h = 0
Mean-Thetap = 0.559 | h = 0p = 0.548 | h = 0p = 0.476 | h = 0p = 0.941 | h = 0
Table 5. Pearson correlation coefficient results for F3–F7 paired electrodes.
FeatureElectrodes
F3F7
Alpha band power during recallF31.0000.968
F70.9681.000
Alpha band power during no-recallF31.0000.837
F70.8371.000
Beta band power during recallF31.0000.748
F70.7481.000
Beta band power during no-recallF31.0000.511
F70.5111.000
Table 6. Pearson correlation coefficient results for F4–F8 paired electrodes.
FeatureElectrodes
F4F8
Alpha band power during recallF41.0000.738
F80.7381.000
Alpha band power during no-recallF41.0000.696
F80.6961.000
Beta band power during recallF41.0000.438
F80.4381.000
Beta band power during no-recallF41.0000.313
F80.3131.000
Table 7. Samples of extracted EDA features.
Participant NoMemory RecallTonic Mean (uS)Tonic std
(uS)
Tonic min (uS)Tonic max (uS)Tonic Energy (uS2)Phasic Mean (uS)Phasic Std (uS)Phasic min (uS)Phasic max (uS)Phasic Energy (uS2)
36recall0.4870.0650.2820.792167.30.0090.027−0.0020.3350.574
36no-recall0.3620.0510.2360.73099.790.0080.023−0.0030.2280.416
37recall9.6651.2872.21214.89757920.9851.353−0.3819.8892166
37no-recall5.9460.5074.0247.682271440.5840.575−0.1653.314537.9
38recall0.6630.619−3.8182.158711.10.2110.498−0.0115.322251.2
38no-recall0.4320.1960.0941.397186.40.0320.109−0.1660.88110.31
39recall0.5360.228−1.7631.036289.20.0790.213−0.1943.15743.11
39no-recall0.4320.0920.3020.612148.60.0090.014−0.0050.0610.208
40recall0.1040.0170.0840.2098.6470.0010.002−0.0010.0250.002
40no-recall0.1450.0030.0850.2198.9490.0010.001−0.0010.0090.001
Table 8. Wilcoxon signed-rank test results for EDA.
EDA Featuresp-Value
Tonic Mean0.133
Tonic Standard Deviation0.017
Tonic Min0.009
Tonic Max0.081
Tonic Energy0.185
Phasic Mean0.073
Phasic Standard Deviation0.026
Phasic Max0.001
Phasic Energy0.048
Publisher’s Note: MDPI stays neutral with regard to jurisdictional claims in published maps and institutional affiliations.

