Article

Rapid Removal of Sizing Agent from Carbon Fiber Surface by Liquid-Phase Plasma Electrolysis

1
Department of Materials Science and Engineering, Beijing Institute of Technology, Beijing 100081, China
2
Beijing System Design Institute of Electro-Mechanic Engineering, Beijing 100854, China
*
Author to whom correspondence should be addressed.
Colloids Interfaces 2025, 9(5), 57; https://doi.org/10.3390/colloids9050057
Submission received: 20 June 2025 / Revised: 29 August 2025 / Accepted: 29 August 2025 / Published: 1 September 2025
(This article belongs to the Special Issue State of the Art of Colloid and Interface Science in Asia)

Abstract

In this study, liquid-phase plasma electrolysis (LPE) was successfully employed to remove the sizing agent from T800 carbon fiber surfaces. Through systematic investigation of varying arcing voltages (185–215 V) and electrode spacings (10–20 mm), we determined that an optimal combination of 200 V and 10 mm spacing achieved near-complete sizing removal, as confirmed by SEM, TGA, and XPS analyses. Under this condition, plasma bombardment dominated the removal mechanism, eliminating sizing residues while exposing the underlying fiber grooves. TGA further demonstrated that in samples treated at a 10 mm interval, the weight loss of LPE samples before 300 °C was negligible, indicating that the sizing agent had been thoroughly removed. The results of XPS further confirmed the high efficiency of LPE in the removal of sizing agents (C-O bond content from 41.6% to 26.9%), and the retention of C-O also proved that LPE could maintain the surface activity of carbon fibers, confirming the effectiveness of LPE in decomposing the sizing agent. Meanwhile, based on the above test results, an attempt was made to explain the mechanism of LPE in removing sizing agents from the surface of carbon fibers.

Graphical Abstract

1. Introduction

Carbon fiber reinforced composite materials (CFRP) feature high strength, good thermal conductivity, and high-temperature dimensional stability, which can meet the demands of the aerospace field [1,2,3,4]. They are often used in parts such as the head cone, leading edge, and throat liner of high-speed aircraft [5]. Meanwhile, its ease of modification, high adjustability, and anisotropy in performance make it have broad application prospects in energy and multi-functional surfaces [6,7,8]. PAN-based carbon fibers, as the most representative product among carbon fibers [9], are commonly used as reinforcing materials in CFRP. During the production process of carbon fibers, oxidation treatment is carried out to introduce oxygen-containing groups on the inert graphite surface of the carbon fibers, facilitating the subsequent processing of composite materials [10,11,12]. Then, it still needs to go through the sizing step to ensure that the carbon fibers do not experience partial fiber breakage and pulping or fiber dispersion during transportation, and at the same time, it may be beneficial for the subsequent processing of composite materials [13,14,15,16]. However, in the specific processing, in order to make the surface state of the carbon fiber more in line with the corresponding processing technology [17], or to increase the degree of graphitization on the surface of the carbon fiber [18], or to increase the surface roughness of the carbon fiber [19], the sizing agent on the surface of the carbon fiber needs to be removed. Fang et al. [20] removed the sizing agent on the surface of carbon fibers by soaking them in anhydrous ethanol for 7 h, ensuring that the glucose on the surface of the carbon fibers was subsequently converted into carbon. Niranjan Patra et al. [21] used acetone plus ultrasonic treatment to remove the sizing agent on the surface of carbon fiber fabric, thereby ensuring the quality of the subsequent chemically deposited Ni-Co-Fe-P coating. The common method for removing sizing agents in production is to subject carbon fibers to heat treatment at high temperatures [22], in air or an inert atmosphere, for a period of time. This method is limited by the volume of the heating container, and production is difficult to be carried out continuously. Moreover, high temperatures can easily damage the active groups on the surface of carbon fibers, weaken the interfacial adhesion, and reduce the interfacial strength between carbon fibers and CFRP, thereby affecting the fracture behavior of the composite material [23,24]. Plasma surface modification of carbon fibers can introduce oxygen-containing groups and increase the surface activity of carbon fibers [25,26,27,28,29]. Lee et al. [30] used hydrogen plasma to modify the surface of carbon fibers, enhancing the interfacial adhesion of CFRP. Xiao et al. [31] developed a continuous and rapid atmospheric plasma system with power and successfully introduced oxygen-containing functional groups on the CF surface. Moosburg-Will et al. [32] successfully and continuously modified carbon fibers by using the atmospheric plasma jet method (APPJ). However, some of these methods have high requirements for the airtightness of high-pressure gas containers and too many parameters that need to be regulated, which limits their application in production.
In this paper, liquid-phase plasma electrolysis is used to remove the sizing agent from the surface of carbon fibers. This not only meets the conditions for continuous production but also avoids the risks of high-pressure gas containers. Meanwhile, the liquid environment can reduce the damage to the fiber surface, and the free groups in the liquid can enhance the surface activity of carbon fibers. The existence form and distribution of the sizing agent on the surface of carbon fibers were observed by scanning electron microscopy (SEM). The content of sizing agent on the surface of each carbon fiber sample was characterized by a thermogravimetric analysis test (TG). The types and relative contents of carbon-containing chemical bonds on the surface of carbon fibers were characterized by X-ray photoelectron spectroscopy (XPS). The optimal process for removing the sizing agent from the surface of carbon fibers with LPE was obtained. It was confirmed that LPE can completely remove the sizing agent from the surface of carbon fibers while introducing oxygen-containing groups. It provides more effective methods and means for improving the interface performance and production efficiency of CFRP.

2. Experimental Section

The experimental procedures of this study are illustrated in Figure 1. Carbon fibers with sizing agent (T800, HF40S-12K, Jiangsu Hengshen Co., Ltd., Zhenjiang, China) in their bare form were subjected to liquid-phase plasma electrolysis (LPE) treatment under varying process parameters to obtain samples a–i (Table 1). Subsequently, the surface sizing agent content of both the bare fibers and samples a–i were characterized using scanning electron microscopy (SEM), thermogravimetric analysis (TG), and X-ray photoelectron spectroscopy (XPS).

2.1. LPE Process

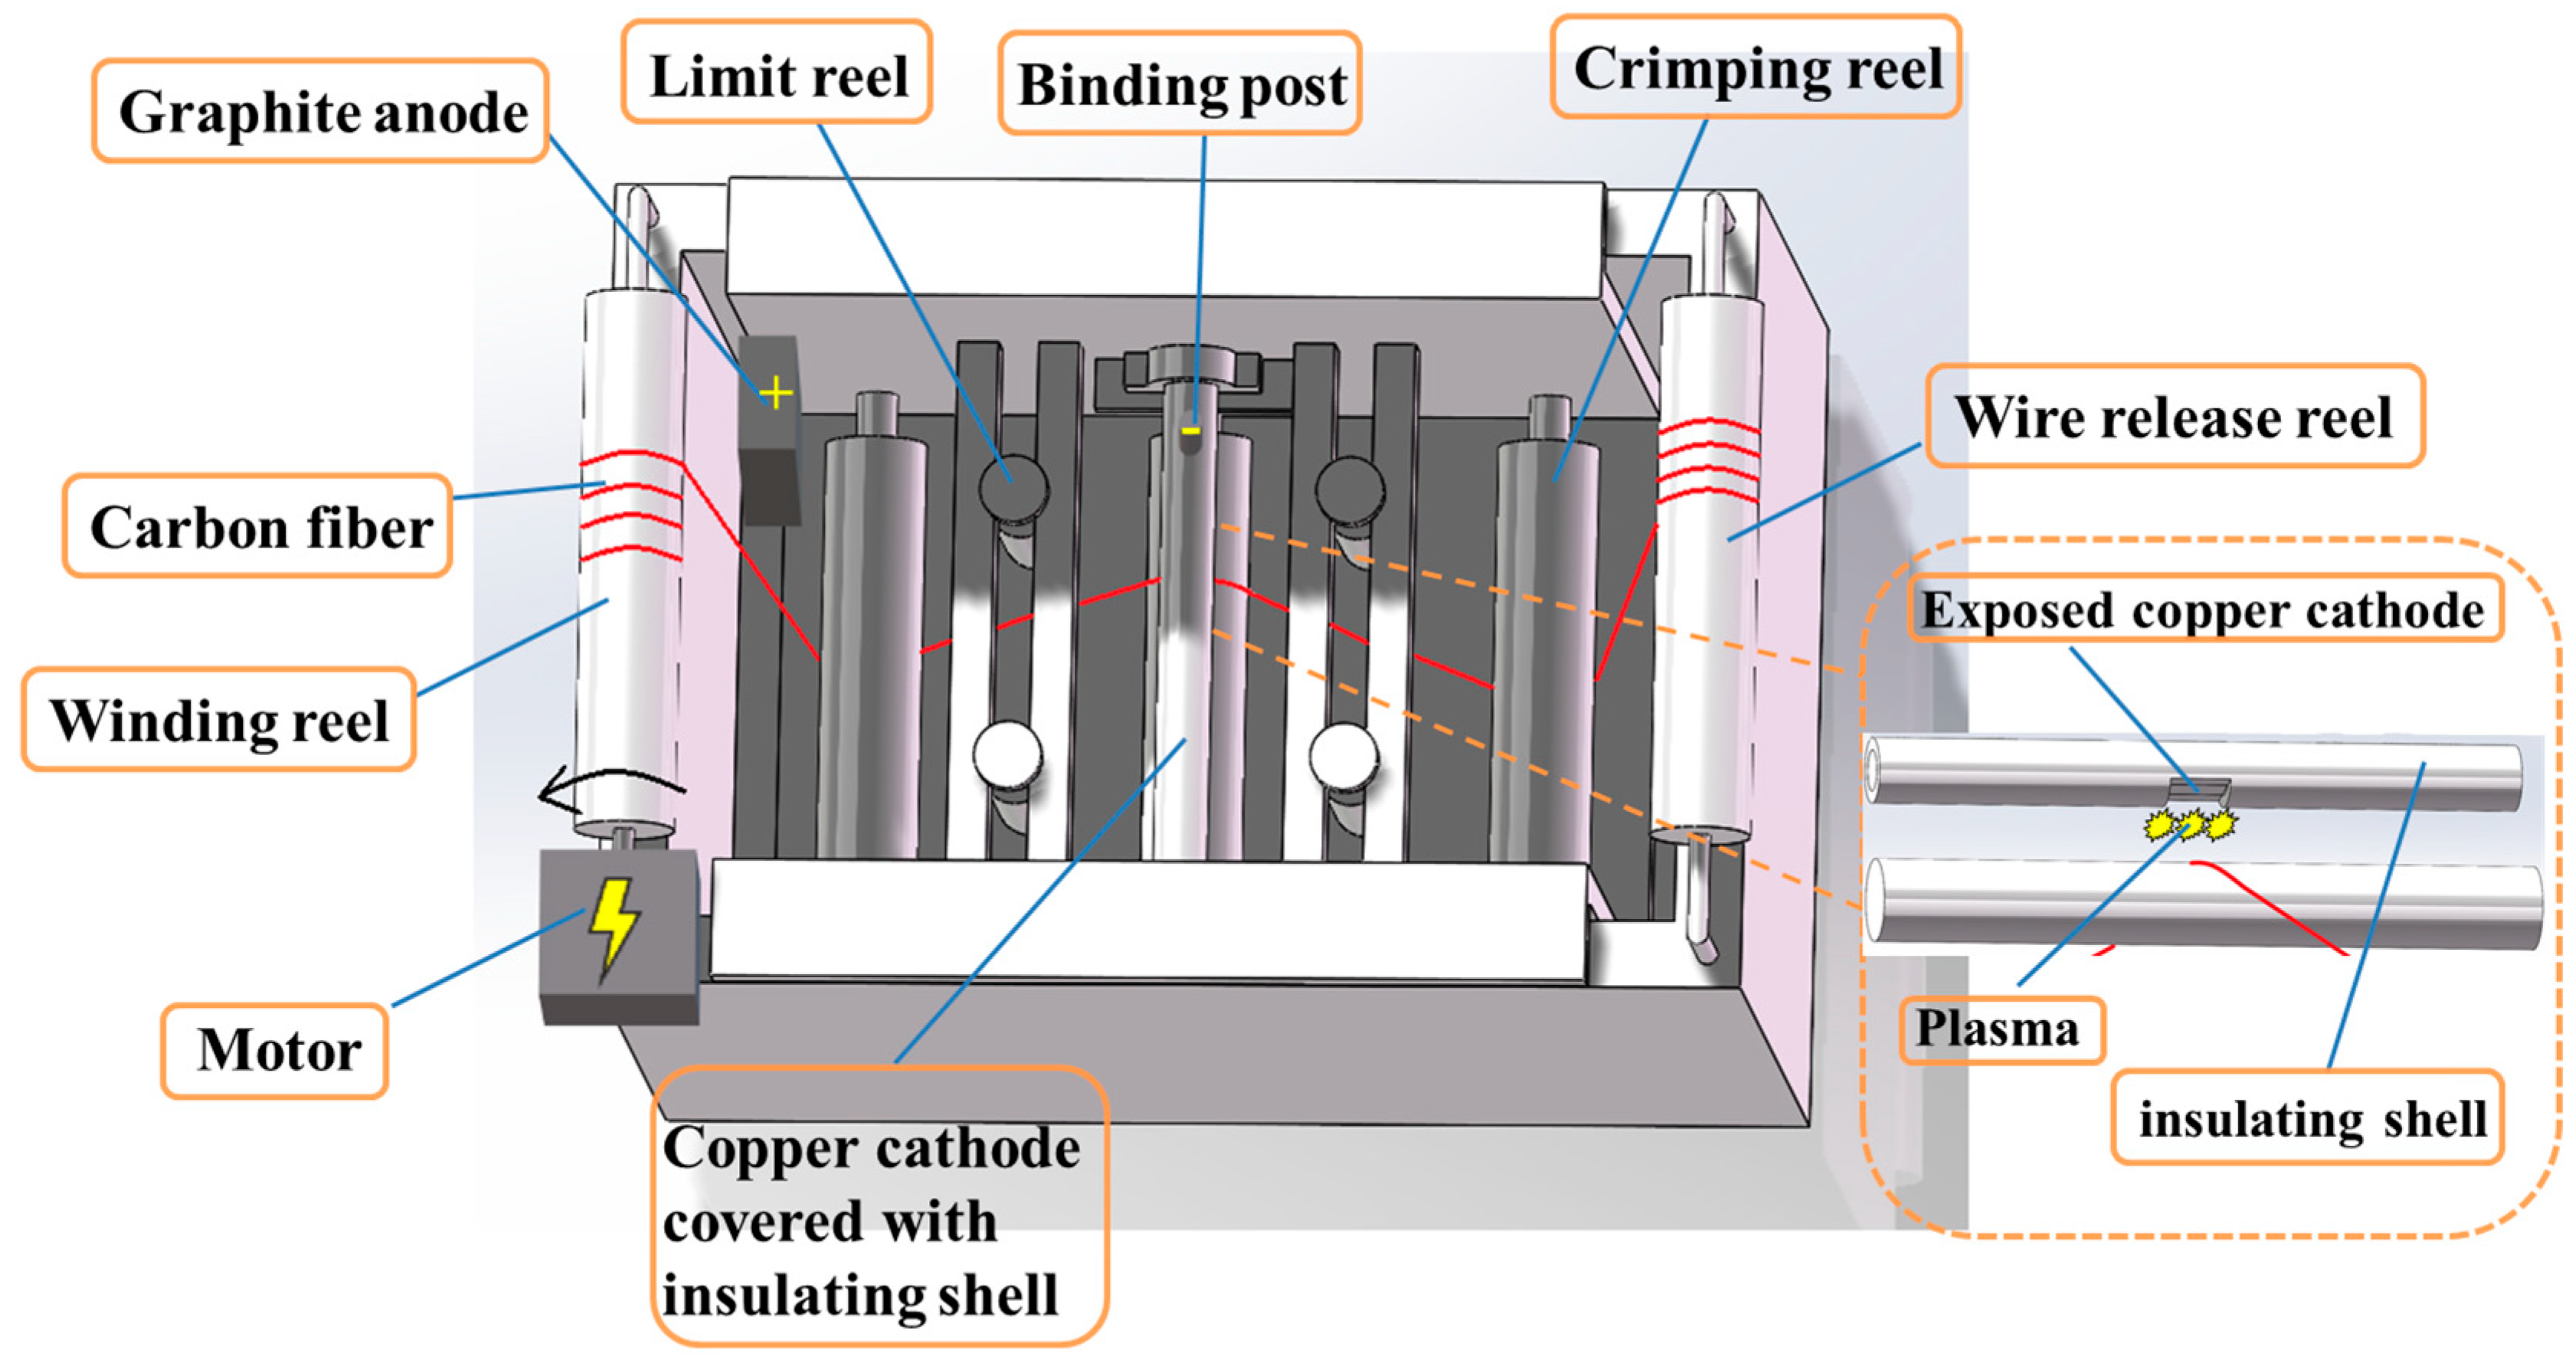
The LPE apparatus employed in this study is illustrated in Figure 2. The system is equipped with a TN-KGZ01 high-frequency switching DC power supply (Guochong Charging Technology Co., Ltd., Yangzhou, China) capable of providing continuously adjustable voltage output ranging from 0 to 1500 V. A stepper motor is incorporated to ensure continuous speed regulation of the carbon fibers between 2.8 and 20 cm/s. The cathode rod assembly features adjustable studs at both ends, enabling precise control of the electrode-to-fiber distance within a range of 10–20 mm.
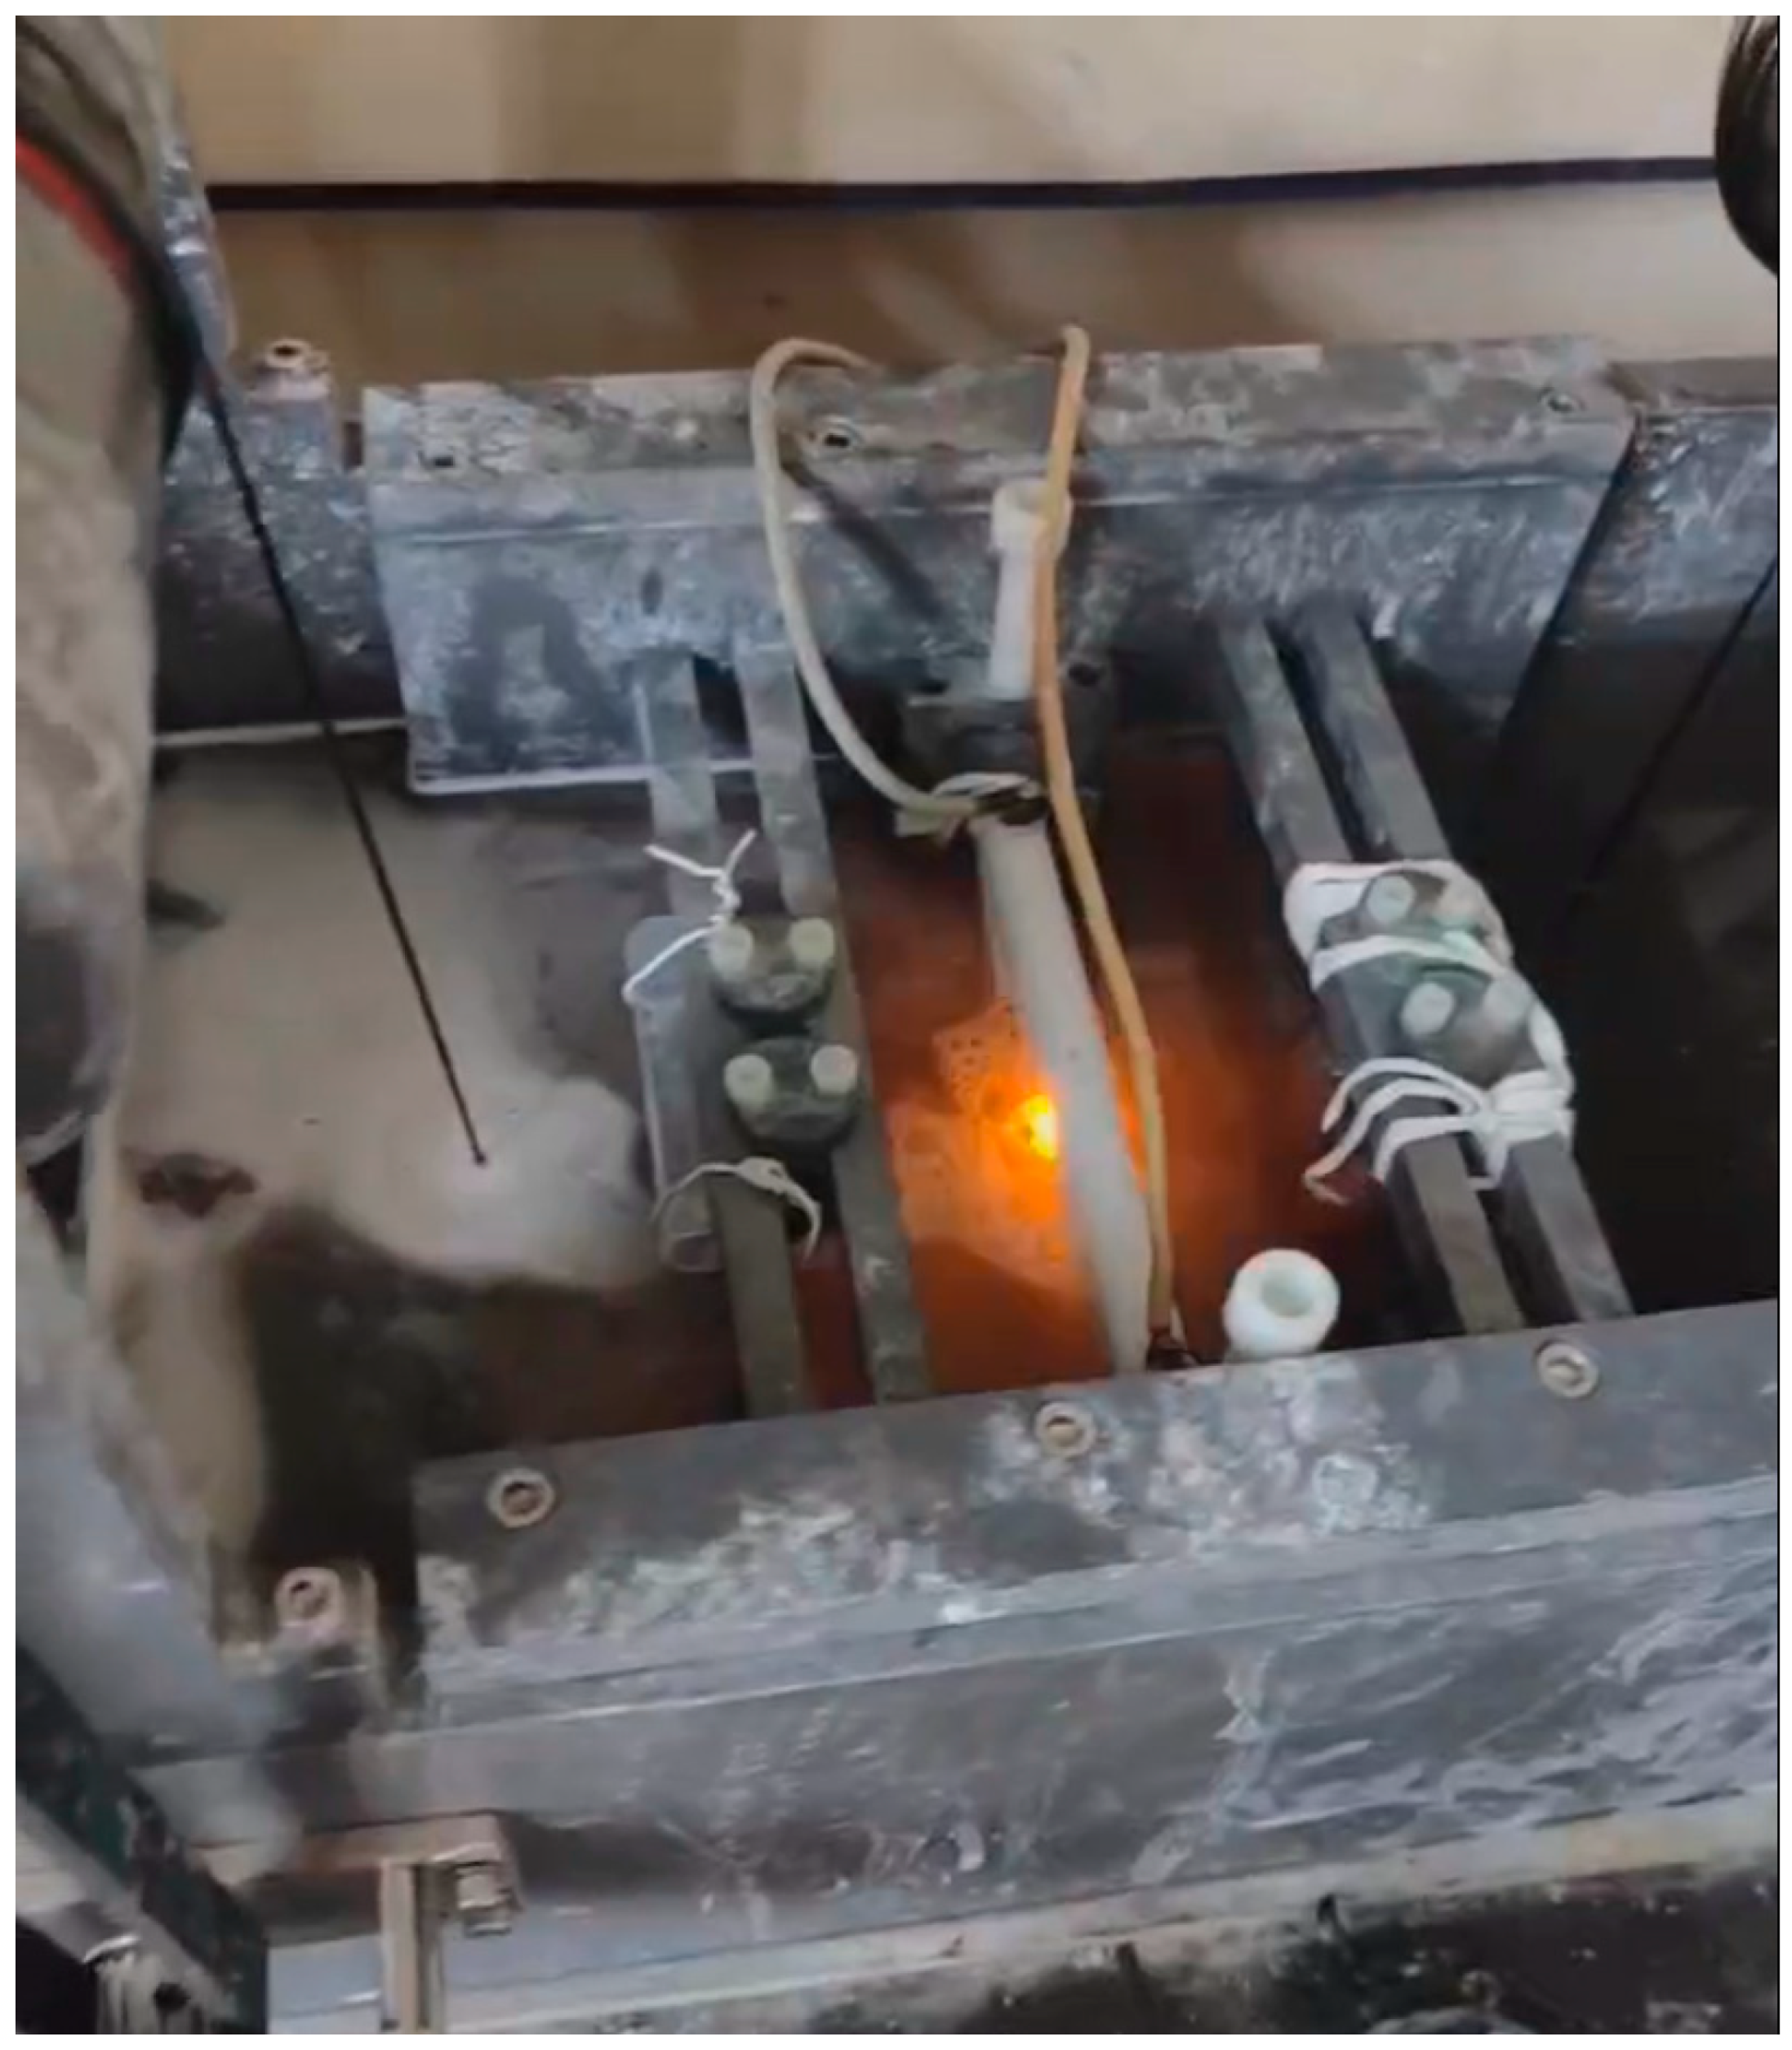
During LPE treatment, a sodium metasilicate solution (50 g/L) serves as the liquid medium to establish an electric field between the cathode and graphite anode, thereby generating plasma beneath the cathode, as shown in Figure 3. The use of 50 g/L sodium metasilicate as the liquid medium is mainly because sodium metasilicate has a high solubility in water, which can provide sufficient cations and anions for electron exchange at the electrode in the solution. Moreover, no by-products will be formed during the electrolysis process, ensuring the continuity of plasma generation. The carbon fibers, maintained at a constant speed of 5 cm/s, are precisely guided through the plasma zone directly below the cathode via the combined action of tensioning rollers and positioning guides. During the experiment, the electric field force caused the free hydrogen ions in the water to approach the cathode, continuously generating hydrogen bubbles near the cathode. When the voltage reaches the breakdown voltage of the hydrogen bubble, the hydrogen bubble breaks down, forming plasma. Because carbon fibers also have electrical conductivity, hydrogen bubbles are precipitated from the surface of the carbon fibers when they are close to the cathode. These hydrogen bubbles will also turn into plasma due to high voltage. Therefore, plasma exists between the cathode and the carbon fiber. When the carbon fiber continuously passed through the solution, we considered that the plasma was continuously treating the surface of the carbon fiber.

2.2. Characterization

The surface morphology of carbon fibers, along with the morphology and the form of the sizing agent, was characterized using field-emission scanning electron microscopy (EHT = 15.00 K, WD = 9.4 mm, FE-SEM, GeminiSEM 300 ZEISS, Oberkohen, Germany). Thermogravimetric analysis (TGA) was conducted using the thermal analysis system TGA/DSC 3 (air 20 mL/min, heating rate 10 k/min, temperature from 25 °C to 400 °C, METTLER Toledo, Zurich, Switzerland) in an air atmosphere to screen out the optimal LPE samples based on weight loss at 300 °C. Then, the selected samples were heated to 450 °C using the same equipment and kept at this temperature for 20 min to obtain the curve of their weight varying with time. Furthermore, X-ray photoelectron spectroscopy (XPS, QUANTERA-II SXM, PHI, Ulvac-Phi Inc., Chigasaki, Japan) was employed to analyze the relative contents of carbon chemical bonds and the C/O ratio on the surfaces of both sized and desized carbon fiber samples. The tensile strength and retention rate of LPE fibers were tested using a universal mechanical testing machine (Instron5966, Boston, MA, USA).

3. Results and Discussion

3.1. Morphology and Sizing Agent Content Estimation

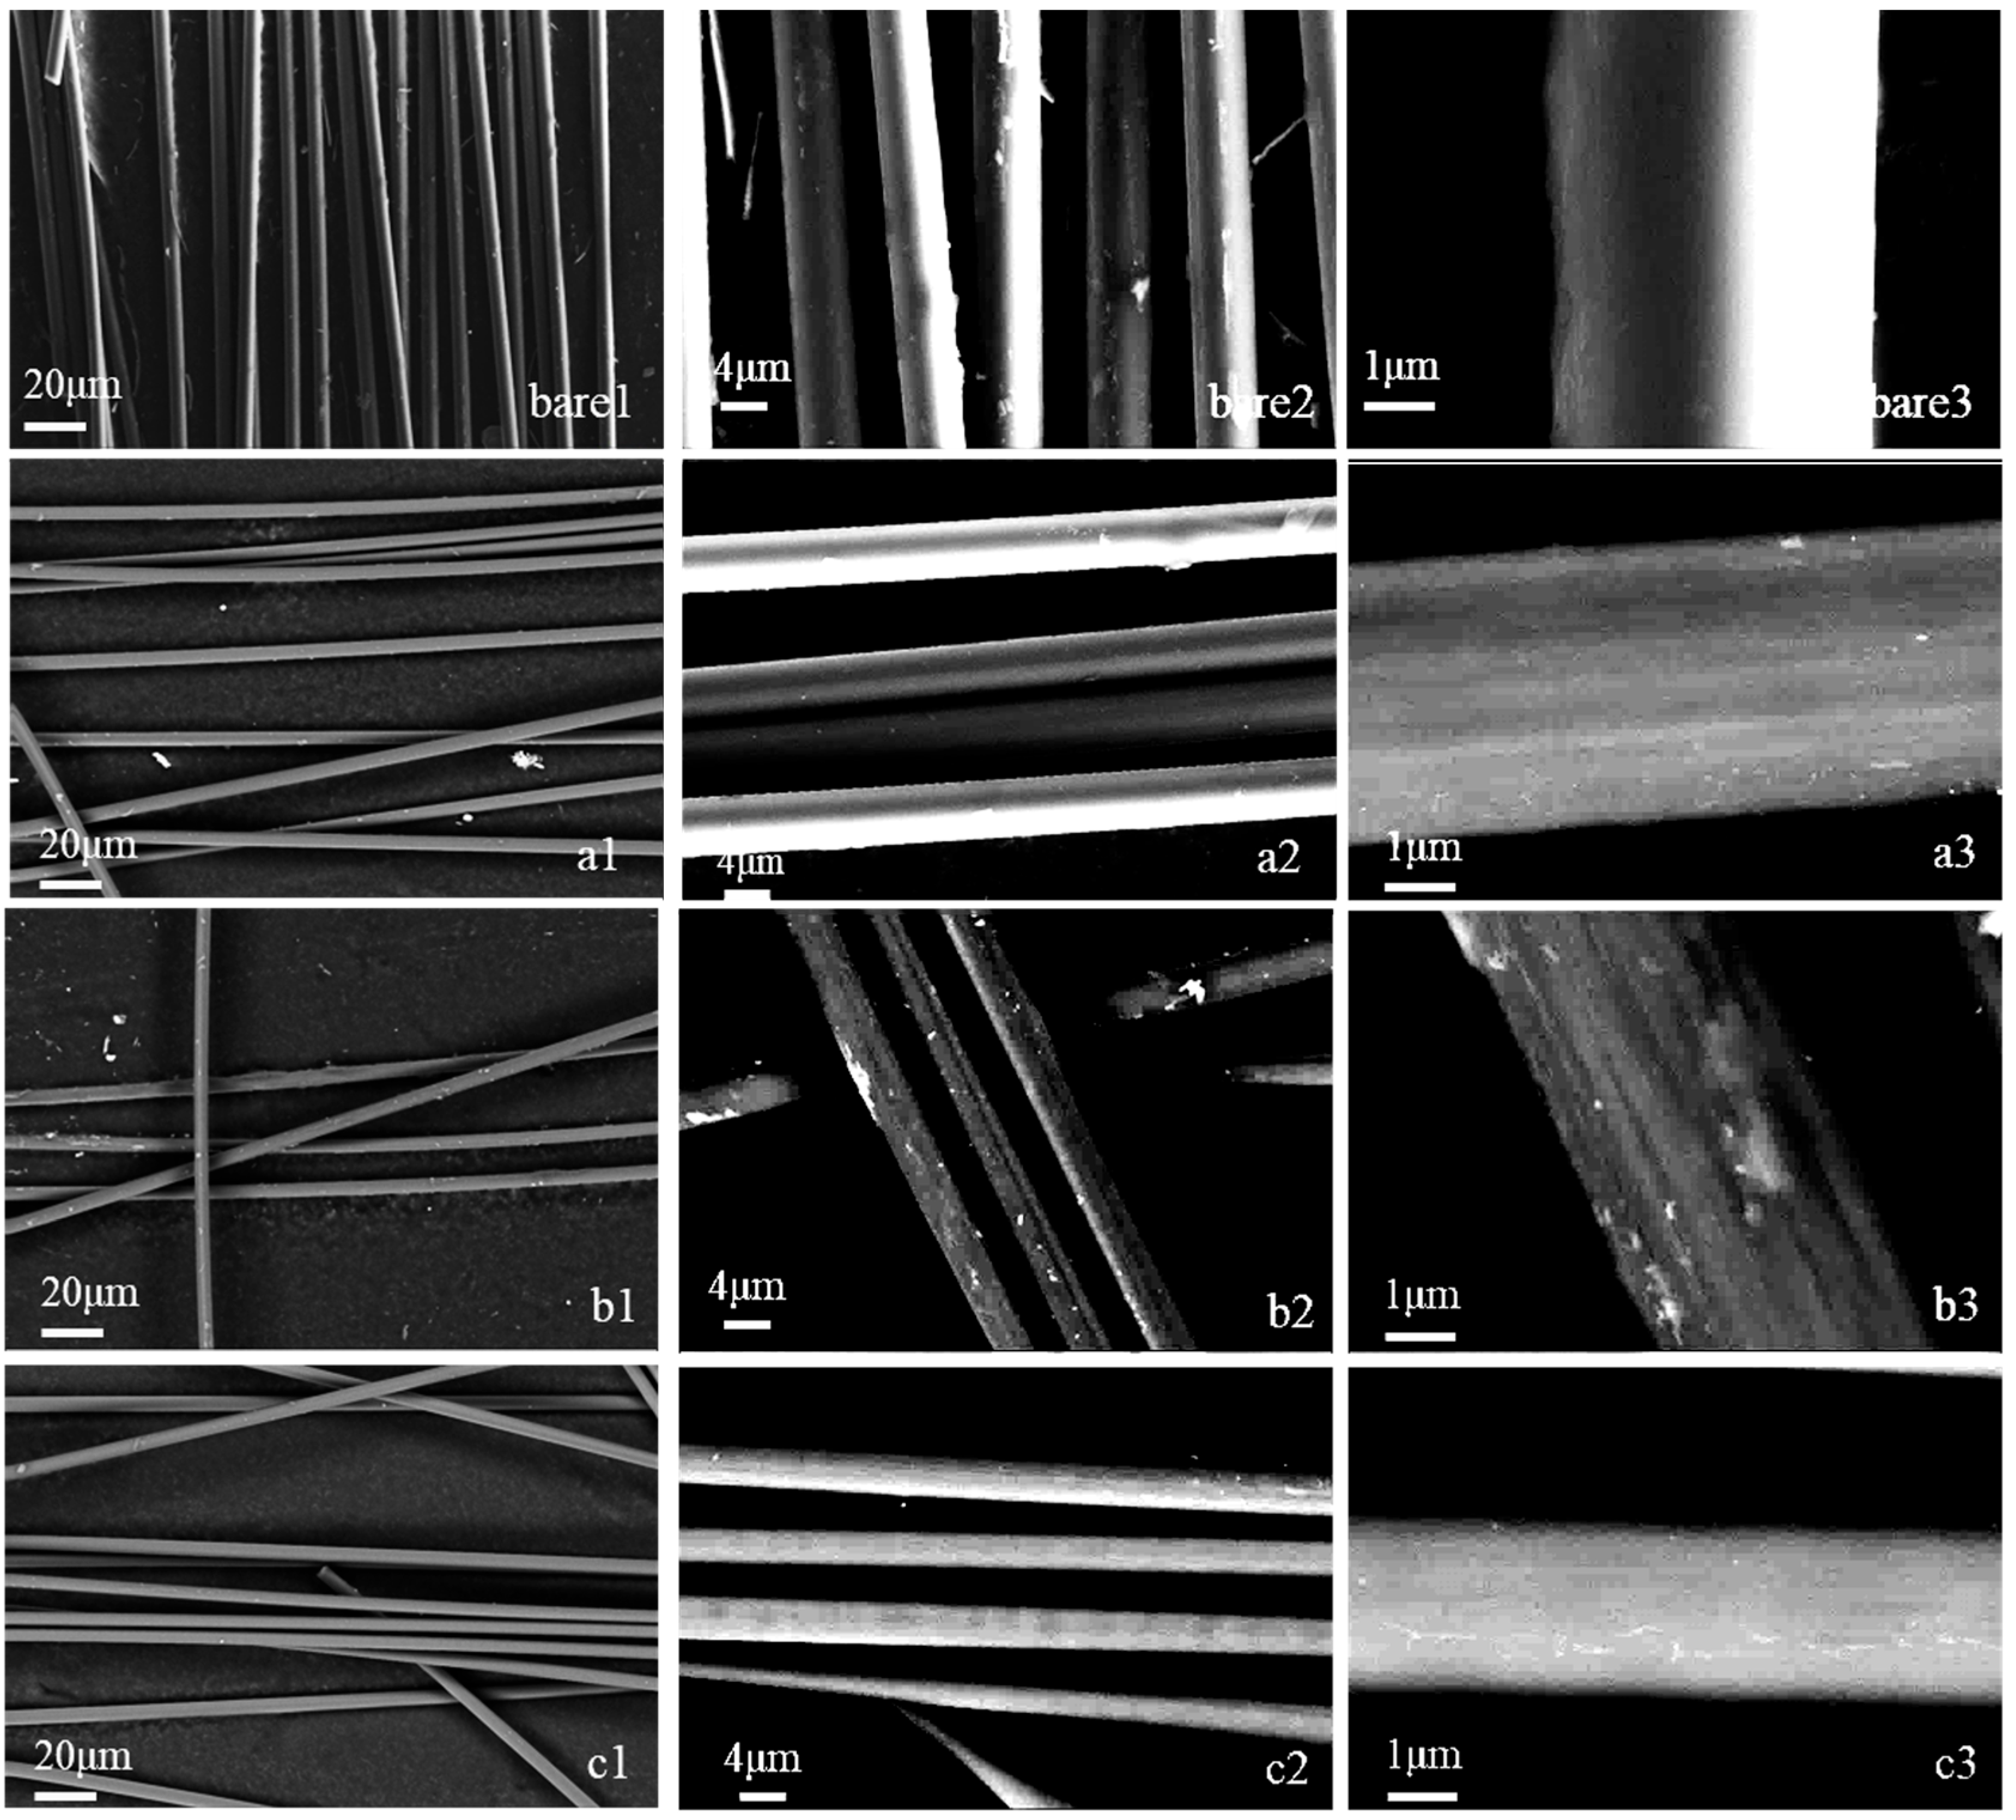
The numbers 1 to 3 marked in the lower left corner of the picture correspond to the 500×, 2000×, and 10,000× scanning electron microscope images of the sample, respectively. HF40S filament is prepared by a wet spinning process. The spinning solution directly enters the coagulation bath. At this time, the elastic gel surface formed on the surface of the solidified filament will elongate along the axial direction and contract along the radial direction under the action of axial tensile force, causing the solidified filament to become fine and denier, and the cross-sectional area to continuously decrease, thus forming folds and wrinkles on the surface. Meanwhile, the solvent inside the solidified filaments is gradually replaced by the coagulant, namely water, which leads to collapse and increases the driving force for the formation of wrinkles. Grooves on the fiber surface are formed during the solidification process and are oriented and arranged along the fiber axis under the action of uniaxial stretching force, and eventually remain on the surface of the carbon fiber.
By comparing the bare sample with samples a–i, it can be seen that after LPE treatment, there are residues of varying degrees on the surface, and the grooves on the surface of the carbon fiber monofilament are exposed. In the 2000× photo of the bare sample, some fine filament fragments scattered on the surface of the fibers can be observed. These fragments might be due to the fact that the sizing agent solidified during the sizing process and did not penetrate into the gap between the two closely attached filaments. Instead, it solidified on the surface of the two closely attached filaments due to surface tension. After the long fiber bundles were cut, the sizing agent at the bonding area was scattered, maintaining a part of the straight shape. The formation of these patterns may be attributed to the residue of the sizing agent. By comparing the 10,000× photos of the exposed sample and a–i, it can be found that the monofilament surface of the exposed sample has no pattern along the length direction, and the edge of the image is not a straight line either, indicating that there is something wrapped around the cylindrical surface. We believe that this is the sizing agent. The carbon fiber monofilament surface of the a–i sample shows grooves along the length direction, and the diameter is relatively uniform. This is because there is a coating of sizing agent on the surface of bare, which fills the grooves and patterns on its surface and makes it appear relatively smooth. At the same time, due to the dispersion of carbon fiber monofilaments, the sizing agent between the monofilaments is difficult to be evenly separated, resulting in uneven diameters of the monofilaments. Additionally, after the LPE treatment of samples a–i, the sizing agent layer on the surface is removed to varying degrees. This exposes the grooves on the surface of the a–i carbon fiber monofilaments in the sample, and the diameters are relatively uniform.
Samples a–c are the samples with voltages of 185 V, 200 V, and 215 V, respectively, when they are 20 mm away from the electrode (Figure 4). By observing samples a to c, it can be seen that from sample a to sample c, the residue on the surface of the carbon fiber is getting less and less. This is because when the distance from the electrode is 20 mm, the plasma arc region cannot completely affect the carbon fiber. At this point, the main influences on the fibers are the temperature field of the electrode and the mechanical vibrations during the bubble generation process. Therefore, when the voltage rises, the temperature of the electrode increases accordingly, and the generation rate of bubbles accelerates, thereby speeding up the melting and decomposition of the sizing agent.
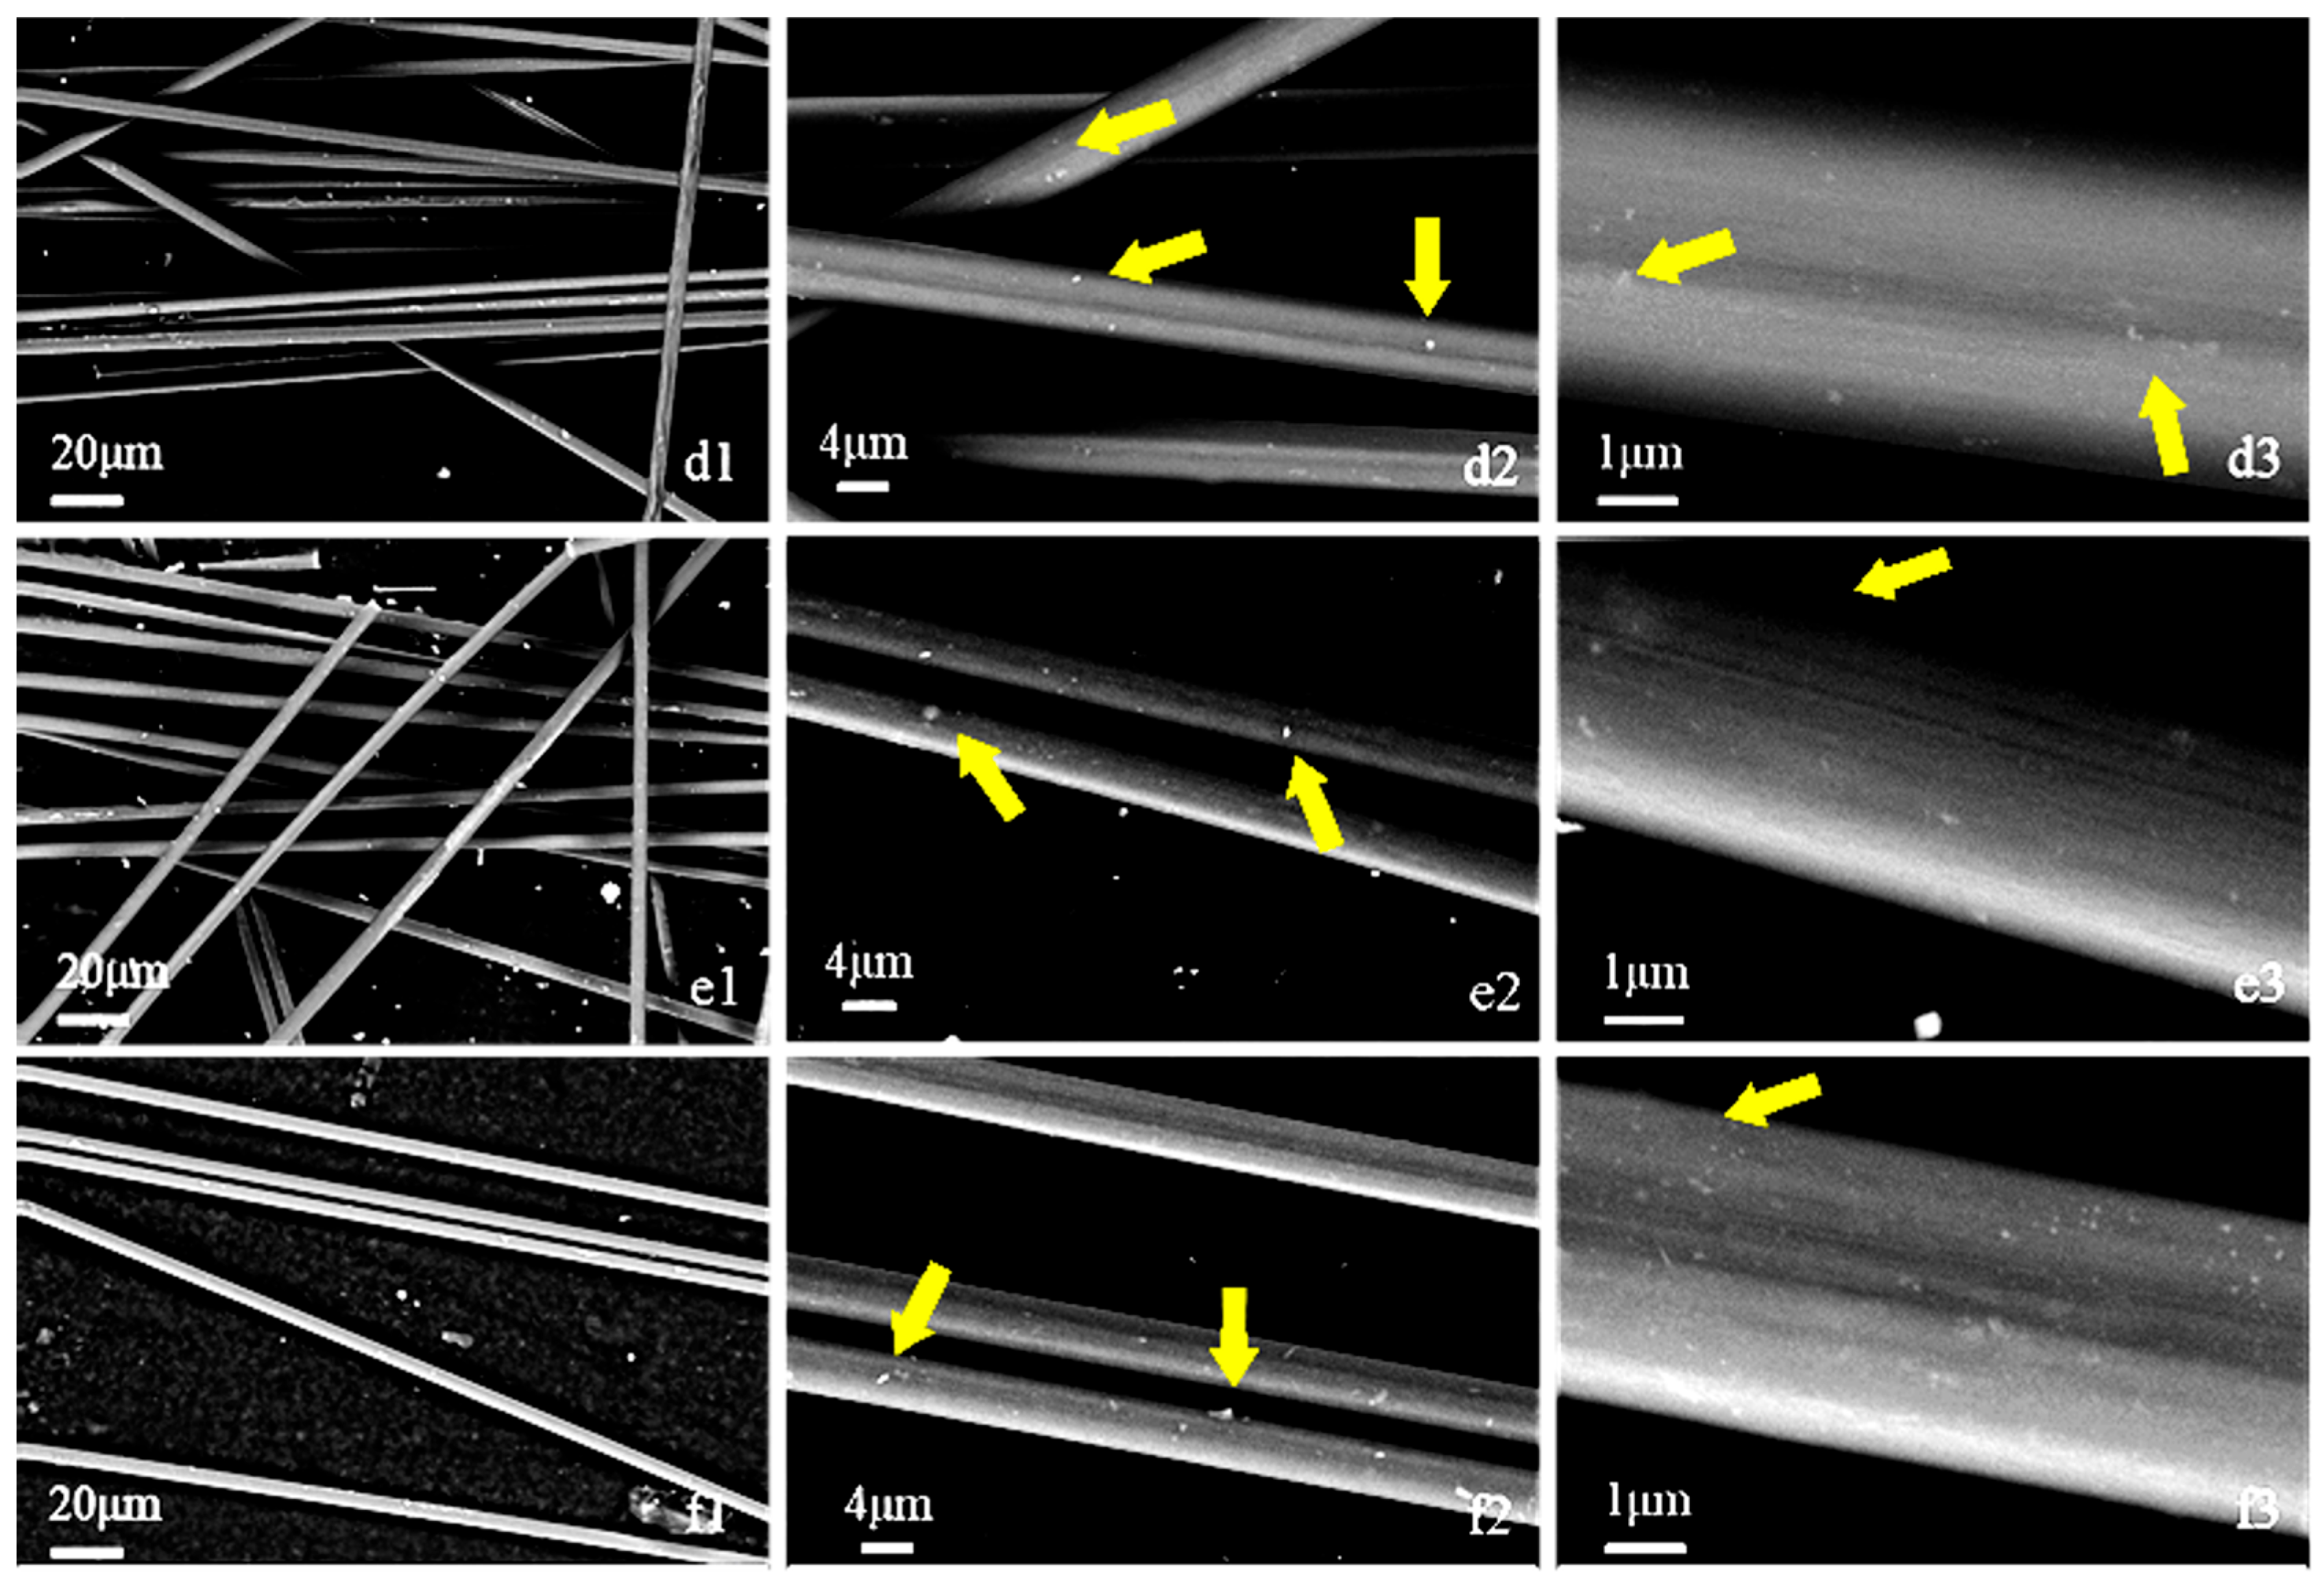
Samples d–f are the samples with voltages of 185 V, 200 V, and 215 V, respectively, when they are 15 mm away from the electrode (Figure 5). From photos d2–f2, point-like sizing agents with relatively high contrast on the surface of the fiber monofilaments can still be observed. When observing the fiber monofilaments at a magnification of 10,000×, it was found that the axial grooves on the fiber surface were relatively obvious, but there was still a small amount of residue remaining in the form of thin layers or spots. By comparing the surface morphology of samples d–f, it can be inferred that the change in the current voltage has no obvious effect on the surface morphology of carbon fibers. This might be because when the distance between the fiber and the electrode is 15 mm, the fiber is not only affected by the temperature field of the electrode and the mechanical vibration generated by the bubble, but also directly bombarded by the plasma arc. Under the influence of temperature, the surface sizing agent melts. Under the influence of mechanical vibration, the sizing agent layer splits. Under the direct bombardment of plasma, the sizing agent vaporizes and disintegrates. At this point, the influence of direct plasma bombardment begins to dominate. However, due to the relatively long distance between the fibers and the electrode, the effect of direct plasma bombardment remains weak, which results in a small amount of sizing agent remaining on the fiber surface.
Samples g–i are the samples with voltages of 185 V, 200 V, and 215 V, respectively, when they are 15 mm away from the electrode (Figure 6). From the photos of samples g–i, we can see that from 500× to 10,000×, the surfaces of carbon fibers are all very smooth, and the shapes are all straight cylinders. At 10,000×, the grooves on the surface of the fibers are very clear. Although there are still some residues in samples g and i, they are much less than those in d–f. This indicates that reducing the distance from 15 mm to 10 mm is effective for the removal of the sizing agent. This is because when the fiber is 10 mm away from the electrode, the intensity and energy of the plasma are the greatest, and the sizing agent on the surface of the carbon fiber disintegrates and vaporizes after being directly bombarded by the plasma. By comparing samples a–i, it is concluded that for removing the sizing agent, 10 mm or 15 mm might be the more suitable distance between the carbon fiber and the electrode.

3.2. Thermogravimetric Analysis

The TGA curves of all samples were obtained under an air atmosphere with a heating rate of 10 °C/min up to 400 °C, as shown in Figure 7. Common commercial sizing agents may include one or more of PEEK, diazogen-containing diamine, dodecamine-modified epoxy resin, PUR, PA, PI, PHE, PVP, PES, E-MA-GMA, PPhEK, and NSM, which are dissolved in one or more of EP, CYC, THF, Toluene, DMC, and NMP; they may be in the form of an emulsion or an aqueous solution. It was found that when heated to 300 °C in the air, the volatile components of the sizing agent surrounding the carbon fiber completely evaporated.
When the temperature rises from 25 °C to 300 °C, the evaporation of the sizing agent on the surface of carbon fibers is the main cause of weight loss. When the temperature exceeds 300 °C, the oxidation of carbon fibers becomes the main cause of weight loss. This is why the bare sample is constantly losing weight. Because there is a considerable amount of the sizing agent remaining on the surface of the bare sample, which causes it to show weight loss in both stages. Samples a–c are the samples with voltages of 185 V, 200 V, and 215 V, respectively, when they are 20 mm away from the electrode. It can be seen from the weight loss curves of samples a–c that when the spacing is 20 mm, as the voltage increases from 185 V to 215 V, the weight loss rate of the samples becomes smaller and smaller. This might be because when the spacing is 20 mm, the carbon fibers in LPE are mainly affected by the mechanical vibration caused by the electrode temperature field and bubble generation, while the effect of plasma bombardment is not significant.
Samples d–f are the samples with voltages of 185 V, 200 V, and 215 V, respectively, when they are 15 mm away from the electrode. By comparing the weight loss curves of samples d–f, it can be seen that the weight loss rate of sample d is significantly greater than that of samples e and f, which is very straight between 25 and 300 °C, indicating that the sizing agent of samples g–i has been removed completely, and the weight loss rates of samples e and f are similar. This evidence shows that when the spacing is 15 mm and the voltage is 185 V, the plasma still cannot fully affect the carbon fiber. Possibly, when the voltage increases to 200 V and 215 V, plasma bombardment begins to become the main factor affecting the removal efficiency of the sizing agent.
Samples g–i are the samples with voltages of 185 V, 200 V, and 215 V, respectively, when they are 10 mm away from the electrode. It can be seen from the weight loss curve of samples g–i that the curve of samples g–i is very straight between 25 and 300 °C, which indicates that the sizing agent of samples g–i has been removed completely. This indicates that when the distance between the carbon fiber and the electrode is 10 mm, the carbon fiber can be fully affected by the plasma. Maybe at this time, plasma bombardment is the main factor affecting the removal efficiency of the sizing agent. By comparing the weight loss curves of samples g–i and e and f, it can be seen that their weight loss curves have the same shape. It can be concluded that samples e–i are related to the weight loss curve of pure carbon fiber without the sizing agent. By comparing the weight loss curves of the bare sample, it can be seen that only the weight loss rate of sample a is greater than that of the bare sample, while the weight loss rates of the remaining samples are all less than that of the bare sample. This might be because under the conditions of a spacing of 20 mm and a voltage of 185 V, the plasma not only failed to bombard the sizing agent but also scratched the sizing agent layer, increasing the contact area with the air and causing the weight loss rate of sample a to be greater than that of the bare sample.
Since the weight loss curves of samples e–i are very similar, in order to obtain the optimal parameters for removing the sizing agent, it is necessary to compare the remaining weights of each sample at 300 °C (Figure 8). As shown in the figure, the remaining weight of each sample at 300 °C clearly indicates that the optimal parameter range for removing the sizing agent is an electrode spacing of 10 mm and an applied voltage of 185–200 V.
To determine the ability of the LPE method and the high-temperature method to remove the sizing agent, sample h, the bare sample, and CF that had undergone 1 h heat treatment in a 700 °C nitrogen atmosphere were tested. The temperature was increased from 30 °C to 450 °C at 10 K/min in a nitrogen atmosphere and then held at 450 °C for 20 min [33]. The curve of weight varying with time is shown in Figure 9.
As can be seen from Figure 9, during the heating stage 1 (0 < t < 1500 s), the weights of the three samples hardly changed, and the temperature at this time was 280 °C. During the heating stage 2 (1500 < t < 2520 s), the bare sample began to lose weight continuously, while the thermal decomposition method sample and sample h maintained their weight. During the holding stage (t > 2520 s), the bare sample continued to lose weight, and the weights of the thermal decomposition method sample and sample h remained almost unchanged. In a nitrogen atmosphere below 450 °C, the continuous weight loss of the bare sample is due to the decomposition and volatilization of the sizing agent, which indicates that the effect of LPE in removing the sizing agent is the same as that of the thermal decomposition method.

3.3. XPS

XPS analysis was performed on sample h, the bare sample, and CF after 700 °C/N2/1 h (Al target, 1486.6 eV, line width < 0.48 eV), as shown in Figure 10 and Table 2. It can be seen from the XPS results that the carbon-containing chemical bonds on the surface of carbon fibers mainly exist in the form of C-C and C-O. However, on the CF surface where the sizing agent is removed at high temperature, there is no presence of C-O. The relative content ratio of C-C/C-O on the bare carbon fiber surface was 58.4/41.6. The relative content ratio of C-C/C-O on the surface of carbon fibers after the sizing agent was removed was 77.4/22.6. It can be seen that after LPE treatment, the content of C-O on the surface of carbon fibers decreased. This is because the C-O on the surface of carbon fibers mainly exists in the sizing agent. After LPE, the relative content of C-O decreased significantly as the sizing agent was completely removed. However, due to the etching effect of plasma on the surface of carbon fibers and the protection of the liquid, some oxygen-containing groups were retained on the surface of carbon fibers. Thus, some C-O were retained. This is conducive to the combination of carbon fibers and the subsequent production of composite materials.
As shown in Table 2, the FWHM of the two peaks of sample h does not quite match. This is because, considering that the C-C on the surface of carbon fibers mostly exist in the form of SP2 hybridization, and due to the π-π excitation effect, most of the peaks of carbon fibers have a long tail. Therefore, a nonlinear fitting method was chosen during the fitting process. This led to the FWHM of the two peaks of sample h not matching well.

3.4. The Tensile Strength of Fibers

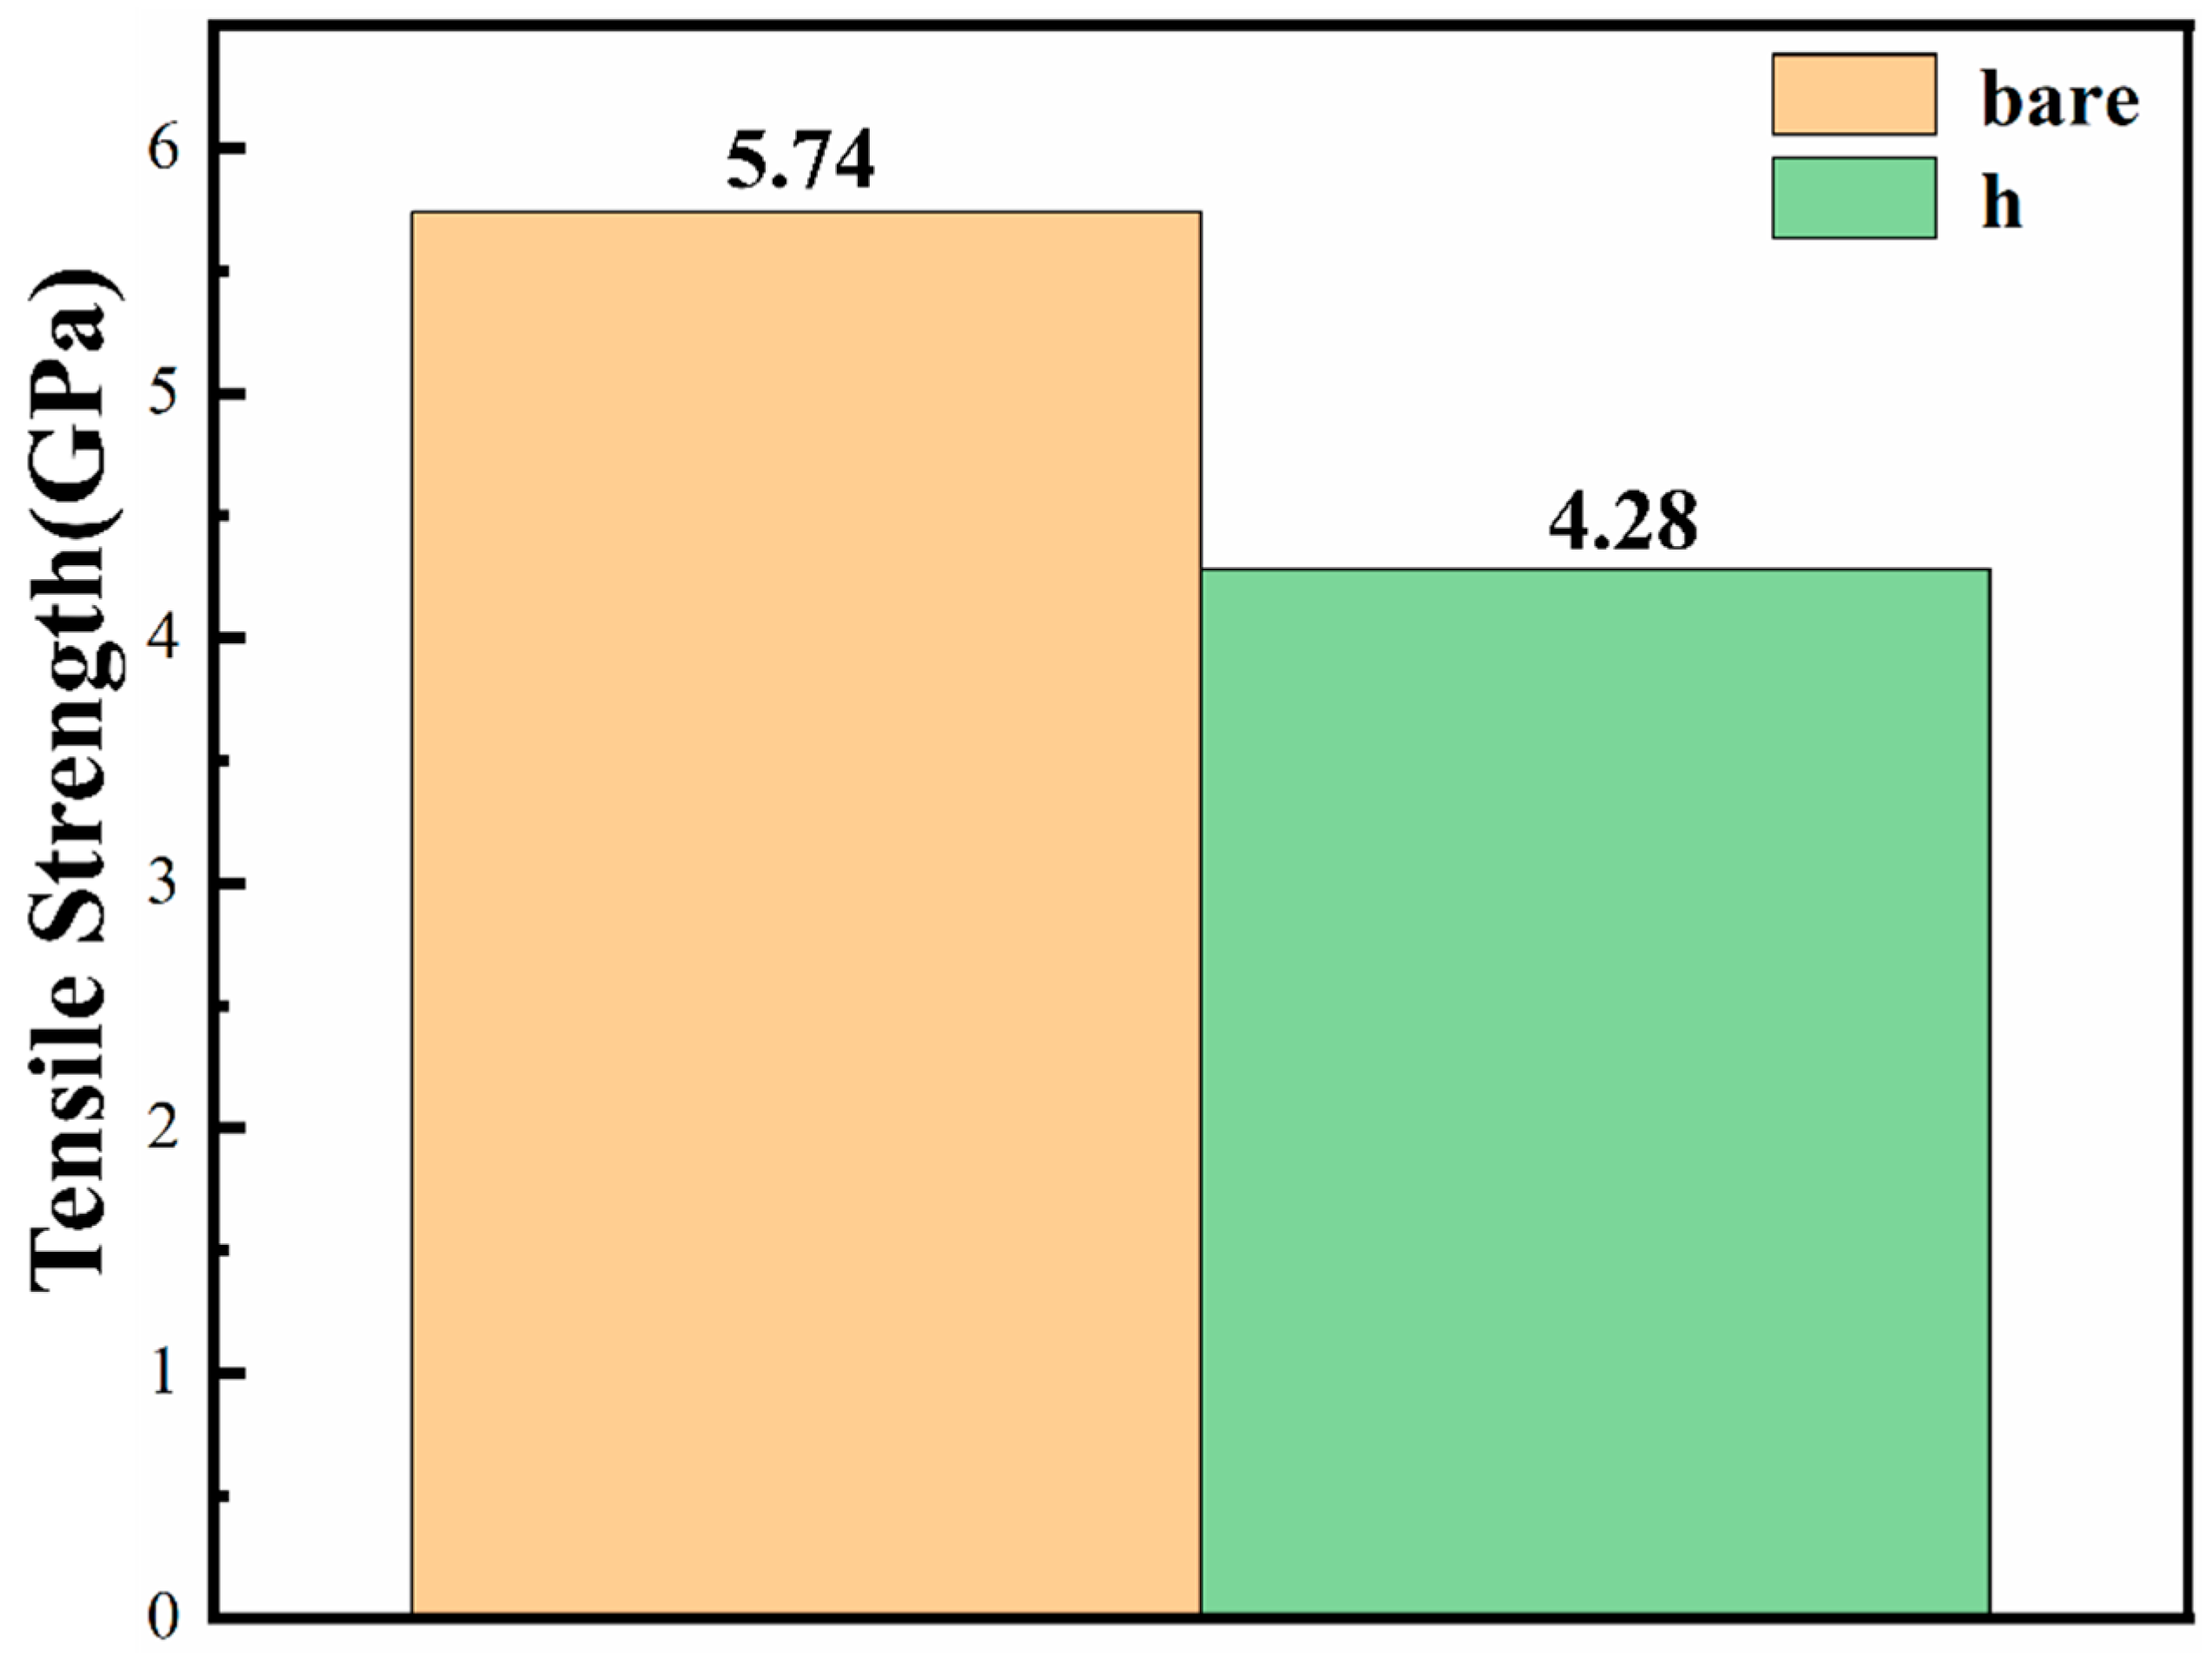
Six specimens of each sample were tested using a universal material testing machine (INSTRON 5966) at a loading rate of 5 mm/min, and the average tensile strengths of the exposed and sample h were obtained, as shown in Figure 11 The tensile strength of the blank sample was 5.74 GPa, and the standard deviation was 0.257 GPa, which is in line with the tensile strength of T800 grade carbon fiber multifilament given by the manufacturer. After LPE, the tensile strength of the LPE Sample was 4.28 GPa, and the standard deviation was 0.292 GPa. After LPE treatment, the tensile strength of the fibers was retained by 75%. This might be due to the bombardment effect and surface etching effect of the liquid-phase plasma, which locally damaged the surface of the carbon fiber, resulting in the obstruction of load transfer and ultimately leading to the decrease in the tensile strength of the carbon fiber.

3.5. Mechanism of LPE in Removing Sizing Agents from the Surface of Carbon Fibers

The main components of the sizing agent on the surface of carbon fibers include water-soluble and non-water-soluble epoxy resins, dimethyl resin, polyimide resin, polyvinyl alcohol resin, vinyl acetate resin, acrylic resin, etc. The water-soluble sizing agent components dissolve when passing through the aqueous solution, while the non-water-soluble sizing agent has a melting point between 100 °C and 180 °C and a flash point between 225 °C and 235 °C.
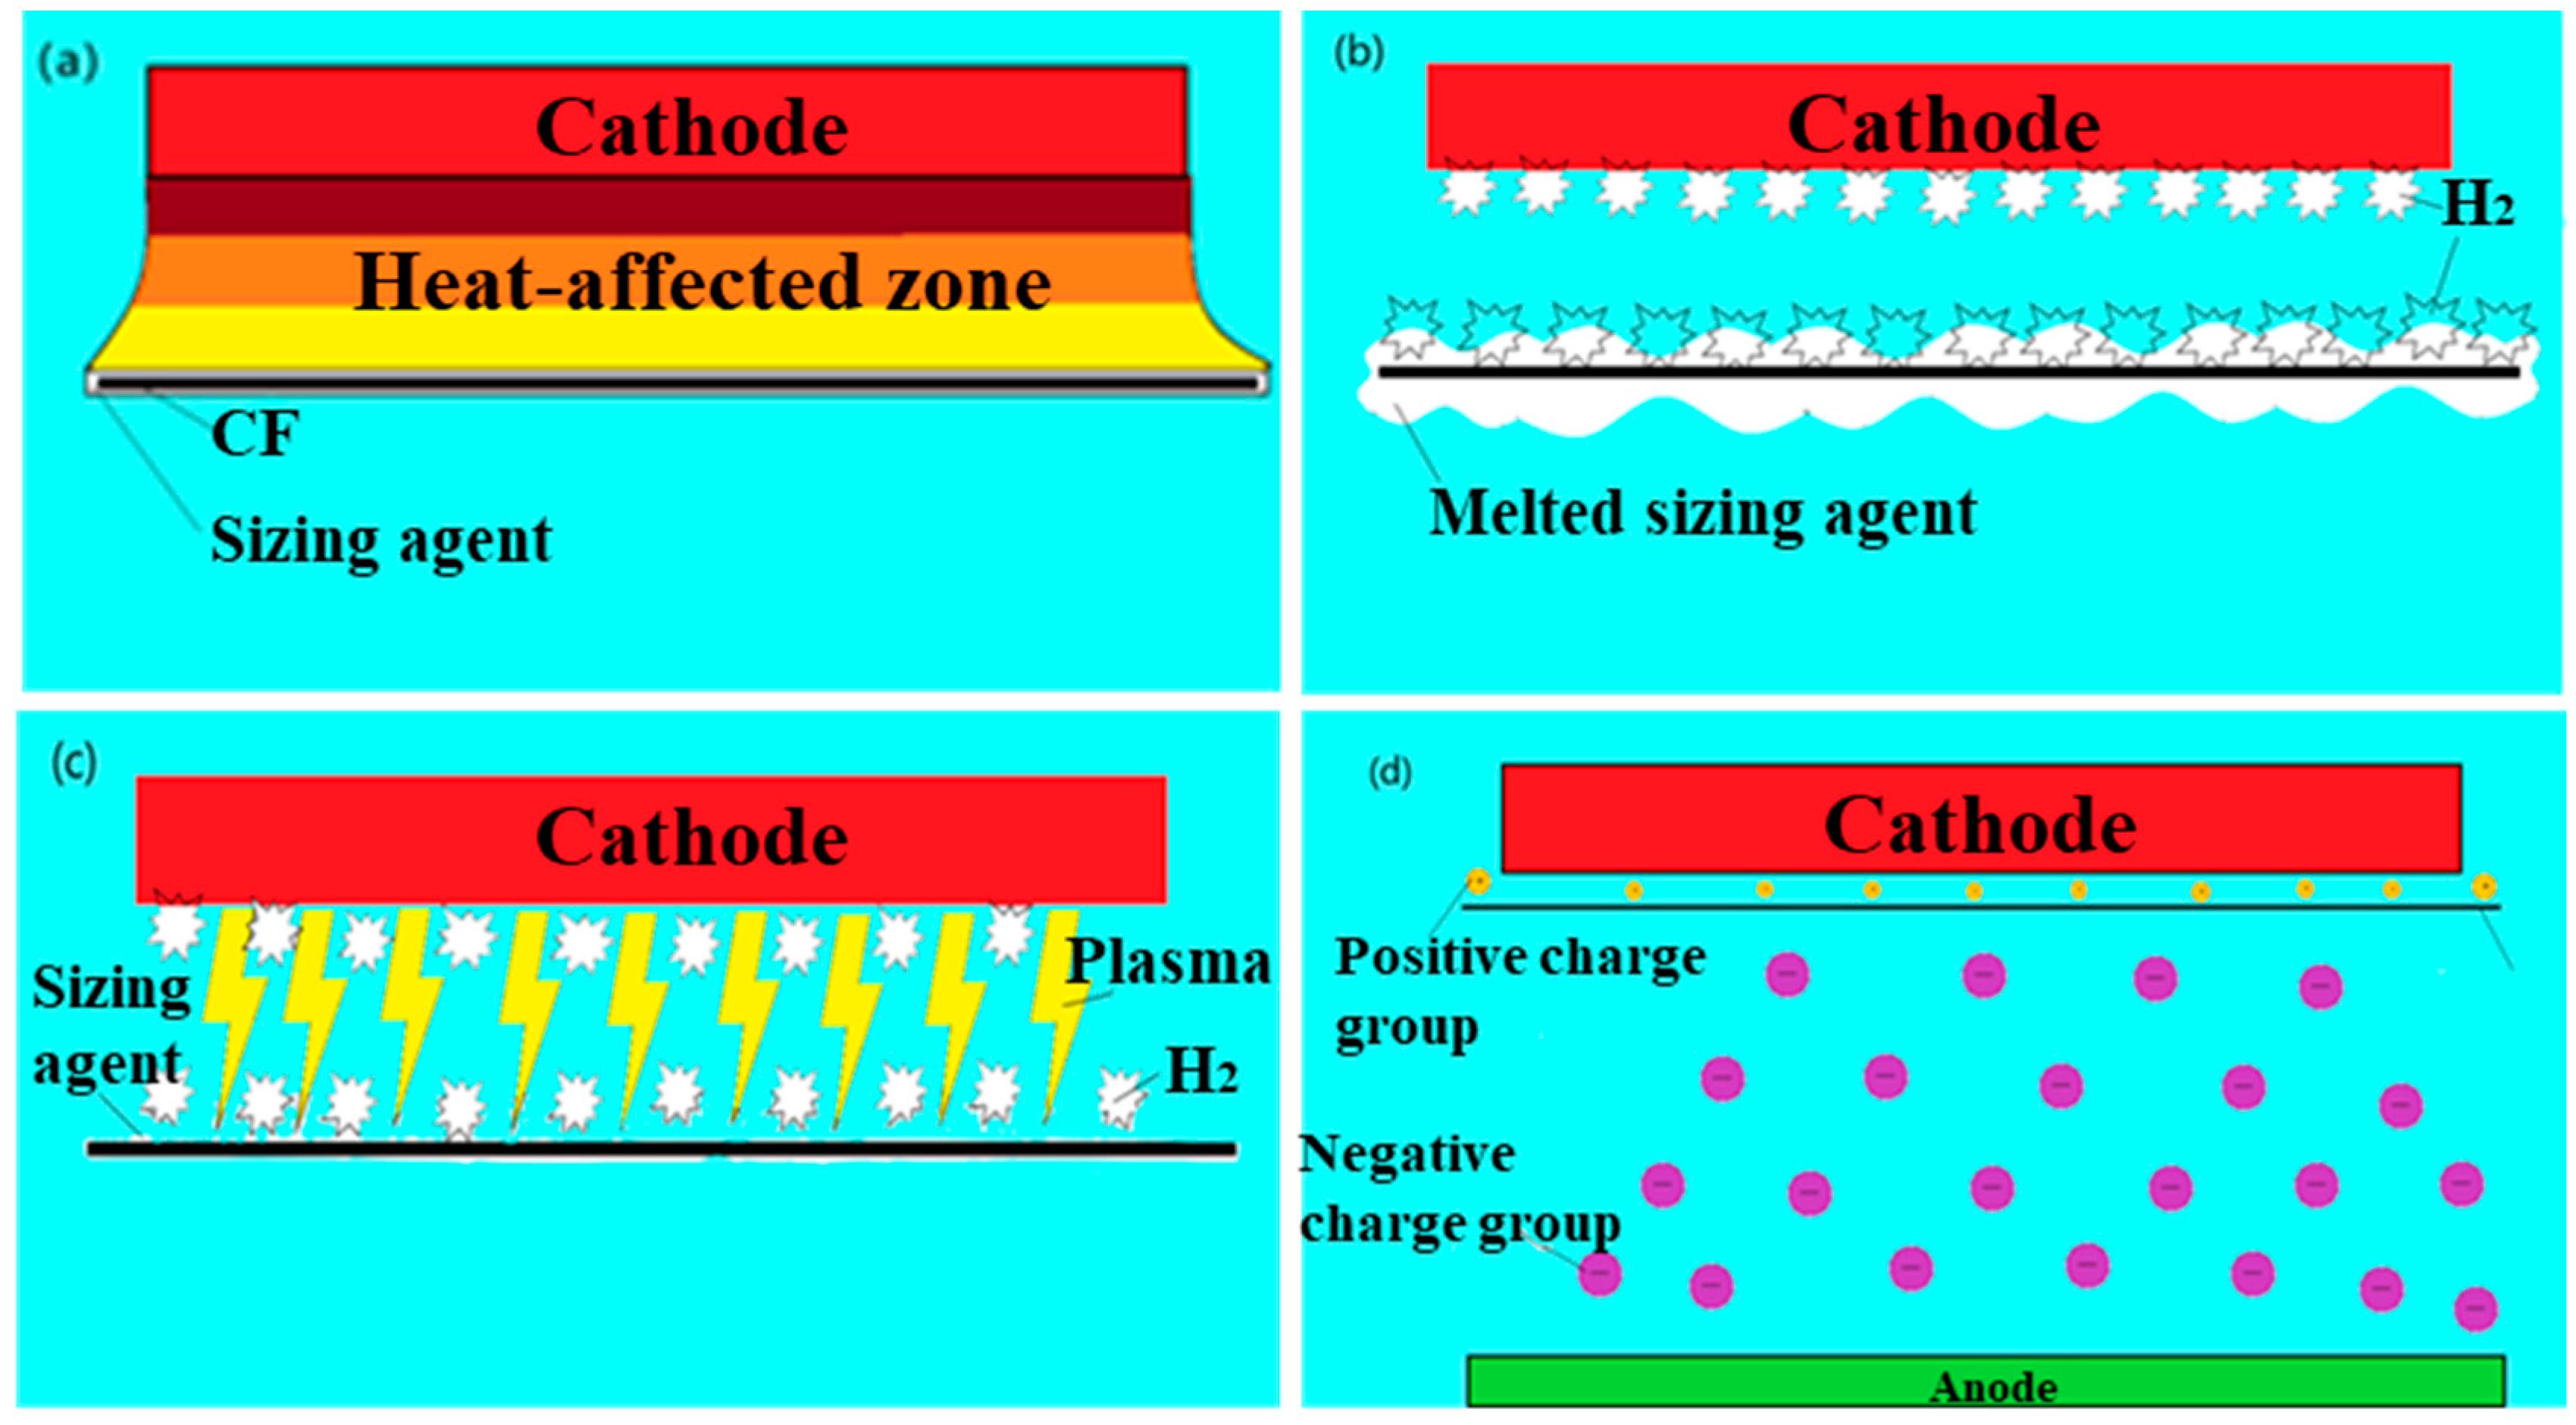
Figure 12 reveals the mechanism of removing sizing agents by liquid-phase plasma. When the carbon fiber passes beneath the cathode, the resin on it may first melt under the influence of the high-temperature heat-affected zone of the electrode itself and the plasma. Furthermore, due to its insolubility in water and its density being lower than that of water, the molten sizing agent may separate from the carbon fiber due to the force generated during the high-speed movement of the fiber in the solution and the bursting of bubbles, rise to the plasma arc zone, and be ignited and vaporized. The process is shown in Figure 12a. Meanwhile, as the carbon fiber is relatively close to the cathode, the potential of the carbon fiber remains low enough throughout the electric field from the cathode to the anode to act as a false cathode. So, during the electrification process, high-voltage bubbles are constantly generated and burst on the cathode and the carbon fiber, and the surface of the carbon fiber is subjected to mechanical vibration disturbed by the bubbles in the solution. The work of Zhang et al. [34] also demonstrated the fact that carbon fibers are polarized as conductors in an electric field. This is conducive to the separation of sizing agents with fluid properties. The process is shown in Figure 12b. According to the bubble discharge theory, as high-voltage bubbles grow and burst, the internal pressure of the bubbles decreases, inducing gas discharge within the bubbles. This leads to the destruction of liquid insulation, the breakdown of the bubbles, and the generation of plasma. The generated plasma exerts a more intense mechanical bombardment and stripping effect on the surface of carbon fibers. This promotes the separation of sizing agents. The research of Gupta et al. [35] is the origin of this theory that triggers liquid-phase plasma. The process is shown in Figure 12c. Some components in the sizing agent are water-soluble. After dissolving in water, the ionized cations and anions will be affected by the strong electric field in the plasma arc region and separate towards the anode and cathode. This promotes the decomposition of the sizing agent components. The process is shown in Figure 12d.

4. Conclusions

In this study, the sizing agent on the surface of T800 carbon fiber was successfully removed by liquid-phase plasma electrolysis (LPE). By changing parameters such as different arc voltages (185–215 V) and electrode spacings (10–20 mm). We obtained a series of samples. The possible range of the sample with the optimal parameters was estimated through the SEM images. The TGA and XPS analyses and the comparison of samples with the high-temperature removal of sizing agent confirmed that the combination of 200 V and 10 mm spacing could almost completely remove the sizing agent. Under this condition, plasma bombardment dominated the removal mechanism, eliminating sizing residues while exposing the underlying fiber grooves. TGA further demonstrated that samples treated at 10 mm spacing exhibited negligible weight loss, indicating complete sizing removal. The results of XPS further confirmed the high efficiency of LPE in the removal of sizing agents (C-O content from 41.6% to 22.4%), and the retention of C-O also proved that LPE could maintain the surface activity of carbon fibers, confirming the effectiveness of LPE in decomposing the sizing agent. Meanwhile, based on the above test results, an attempt was made to explain the mechanism of LPE in removing sizing agents from the surface of carbon fibers. This method offers a rapid and solvent-free alternative that can replace traditional de-gumming techniques, as well as the pretreatment steps before large-scale fiber surface modification treatment or the cleaning of fiber surfaces during the production process. It has potential advantages in the manufacturing of carbon fiber composite materials. Future work should explore the possibility of simultaneous sizing agent removal and coating deposition on the fiber surface of LPE and its influence on adhesion at the fiber–matrix interface in composite materials.

Author Contributions

Conceptualization, C.H.; methodology, C.H.; validation, X.H., D.L. and Q.Z.; investigation, W.C.; resources, M.L.; data curation, X.W.; writing—original draft preparation, C.H.; writing—review and editing, Q.Z.; visualization, C.H.; supervision, W.C.; project administration, W.C.; funding acquisition, M.L. All authors have read and agreed to the published version of the manuscript.

Funding

This work was supported by the National Natural Science Foundation of China [grant numbers: U2341262].

Data Availability Statement

The data that support the findings of this study are available from the corresponding author, W.C., upon reasonable request.

Conflicts of Interest

The authors declare no conflict of interest.

References

  1. Savino, R.; Criscuolo, L.; Di Martino, G.D.; Mungiguerra, S. Aero-thermo-chemical characterization of ultra-high-temperature ceramics for aerospace applications. J. Eur. Ceram. Soc. 2018, 38, 2937–2953. [Google Scholar] [CrossRef]
  2. Tiwary, A.; Kumar, R.; Chohan, J.S. A review on characteristics of composite and advanced materials used for aerospace applications. Mater. Today Proc. 2022, 51, 865–870. [Google Scholar] [CrossRef]
  3. Wang, X.; Gao, X.; Zhang, Z.; Cheng, L.; Ma, H.; Yang, W. Advances in modifications and high-temperature applications of silicon carbide ceramic matrix composites in aerospace: A focused review. J. Eur. Ceram. Soc. 2021, 41, 4671–4688. [Google Scholar] [CrossRef]
  4. Voronina, S.Y.; Shalygina, T.A.; Voronchikhin, V.D.; Vlasov, A.Y.; Ovchinnikov, A.N.; Grotskaya, N.N. Data for determining the surface properties of carbon fiber in contact interaction with polymeric binders. Data Brief 2021, 35, 106847. [Google Scholar] [CrossRef]
  5. Albano, M.; Alifanov, O.M.; Budnik, S.A.; Morzhukhina, A.V.; Nenarokomov, A.V.; Titov, D.M.; Gabrielli, A.; Ianelli, S.; Marchetti, M. Carbon/carbon high thickness shell for advanced space vehicles. Int. J. Heat Mass Transf. 2019, 128, 613–622. [Google Scholar] [CrossRef]
  6. Du, C.; Zhang, X.; Zhou, R.; Sang, Z.; Jiang, Y. Multi-scale modeling and performance study of carbon fiber heterogeneous electrode batteries based on electrochemical-mechanical coupling. J. Power Sources 2025, 648, 237404. [Google Scholar] [CrossRef]
  7. Salimkhani, H.; Palmeh, P.; Khiabani, A.B.; Hashemi, E.; Matinpour, S.; Salimkhani, H.; Asl, M.S. Electrophoretic deposition of spherical carbonyl iron particles on carbon fibers as a microwave absorbent composite. Surf. Interfaces 2016, 5, 1–7. [Google Scholar] [CrossRef]
  8. Movassagh-Alanagh, F.; Bordbar-Khiabani, A.; Ahangari-Asl, A. Fabrication of a ternary PANI@Fe3O4@CFs nanocomposite as a high performance electrode for solid-state supercapacitors. Int. J. Hydrogen Energy 2019, 44, 26794–26806. [Google Scholar] [CrossRef]
  9. Shin, S.; Jang, J.; Yoon, S.H.; Mochida, I. A study on the effect of heat treatment on functional groups of pitch based activated carbon fiber using FTIR. Carbon 1997, 35, 1739–1743. [Google Scholar] [CrossRef]
  10. Fanning, P.E.; Vannice, M.A. A DRIFTS study of the formation of surface groups on carbon by oxidation. Carbon 1993, 31, 721–730. [Google Scholar] [CrossRef]
  11. Lee, S.; Ham, S.; Youn, S.J.; Chung, Y.S.; Lee, S. Effect of Textile PAN-Based Carbon Fibers with Rough Surface on Interfacial Adhesion in PA6 Composites. Ind. Eng. Chem. Res. 2021, 60, 9088–9097. [Google Scholar] [CrossRef]
  12. Wang, H.; Jin, K.; Tao, J. Improving the interfacial shear strength of carbon fibre and epoxy via mechanical interlocking effect. Compos. Sci. Technol. 2020, 200, 108423. [Google Scholar] [CrossRef]
  13. Zhu, P.; Shi, J.; Bao, L. Effect of polyetherimide nanoparticle coating on the interfacial shear strength between carbon fiber and thermoplastic resins. Appl. Surf. Sci. 2020, 509, 145395. [Google Scholar] [CrossRef]
  14. Fukunaga, A.; Ueda, S. Anodic surface oxidation for pitch-based carbon fibers and the interfacial bond strengths in epoxy matrices. Compos. Sci. Technol. 2000, 60, 249–254. [Google Scholar] [CrossRef]
  15. Tran, M.Q.; Ho, K.K.C.; Kalinka, G.; Shaffer, M.S.P.; Bismarck, A. Carbon fibre reinforced poly(vinylidene fluoride): Impact of matrix modification on fibre/polymer adhesion. Compos. Sci. Technol. 2008, 68, 1766–1776. [Google Scholar] [CrossRef]
  16. Zhang, Y.; Xu, F.; Zhang, C.; Wang, J.; Jia, Z.; Hui, D.; Qiu, Y. Tensile and interfacial properties of polyacrylonitrile-based carbon fiber after different cryogenic treated condition. Compos. Part B Eng. 2016, 99, 358–365. [Google Scholar] [CrossRef]
  17. Sharma, M.; Gao, S.; Mäder, E.; Sharma, H.; Wei, L.Y.; Bijwe, J. Carbon fiber surfaces and composite interphases. Compos. Sci. Technol. 2014, 102, 35–50. [Google Scholar] [CrossRef]
  18. Lee, S.; Hoang, Q.N.; Lee, H.; Chung, Y.S.; Park, H.; Lee, S. Effect of plasma modification on the anisotropic surface structure of PAN-based graphitic carbon fiber. Carbon 2025, 242, 120429. [Google Scholar] [CrossRef]
  19. Lee, S.-C.; White, S.; Grzesik, J.A. Effective radiative properties of fibrous composites containing spherical particles. J. Thermophys. Heat Transf. 1994, 8, 400–405. [Google Scholar] [CrossRef]
  20. Fang, H.; Sheng, Z.; Wang, W.; Wei, C.; Li, S.; Geng, X.; Li, X.; Zhu, N.; Wen, G.; Dong, S.; et al. Formation and mechanism of carbon coating on carbon fibers through glucose-to-carbon conversion and its effect on the mechanical properties of Cf/ZrB2-SiC composites. J. Eur. Ceram. Soc. 2025, 45, 117569. [Google Scholar] [CrossRef]
  21. Patra, N.; Ramesh, P.; Ravi, G.; Țălu, Ș. Electroless deposition of nanoscale Ni-Co-Fe-P coatings on carbon fibers for multifunctional applications. Diam. Relat. Mater. 2025, 158, 112602. [Google Scholar] [CrossRef]
  22. Shao, Y.; Xu, F.; Liu, W.; Zhou, M.; Li, W.; Hui, D.; Qiu, Y. Influence of cryogenic treatment on mechanical and interfacial properties of carbon nanotube fiber/bisphenol-F epoxy composite. Compos. Part B Eng. 2017, 125, 195–202. [Google Scholar] [CrossRef]
  23. Zafeiropoulos, N.E.; Baillie, C.A.; Hodgkinson, J.M. Engineering and characterisation of the interface in flax fibre/polypropylene composite materials. Part II. The effect of surface treatments on the interface. Compos. Part A Appl. Sci. Manuf. 2002, 33, 1185–1190. [Google Scholar] [CrossRef]
  24. Kwon, D.W.; Nam, K.B.; Hong, S.C. Influence of tungsten on the activity of a Mn/Ce/W/Ti catalyst for the selective catalytic reduction of NO with NH3 at low temperatures. Appl. Catal. A Gen. 2015, 497, 160–166. [Google Scholar] [CrossRef]
  25. Li, H. Efficient reduction of L-infinity geometry problems. In Proceedings of the 2009 IEEE Conference on Computer Vision and Pattern Recognition, CVPR 2009, Miami, FL, USA, 20–25 June 2009; pp. 2695–2702. [Google Scholar]
  26. Donnet, J.B.; Brendle, M.; Dhami, T.L.; Bahl, O.P. Plasma treatment effect on the surface energy of carbon and carbon fibers. Carbon 1986, 24, 757–770. [Google Scholar] [CrossRef]
  27. Shi, D.; Lian, J.; He, P.; Wang, L.M.; Xiao, F.; Yang, L.; Schulz, M.J.; Mast, D.B. Plasma coating of carbon nanofibers for enhanced dispersion and interfacial bonding in polymer composites. Appl. Phys. Lett. 2003, 83, 5301–5303. [Google Scholar] [CrossRef]
  28. Lu, P.; Zhang, Z.; Yang, M.; Wu, J.; Chen, L.; Xue, W. Efficient synthesis and lithium storage performance of SiO2/TiO2 composite film anode by plasma electrolytic oxidation. Mater. Lett. 2024, 371, 136902. [Google Scholar] [CrossRef]
  29. Bokhari, S.W.; Wei, S.; Gao, W. Synthesis of bimetallic MoS2/VS2 nano-urchins-reduced graphene oxide hybrid nanocomposite for high performance supercapacitor application. Electrochim. Acta 2021, 398, 139300. [Google Scholar] [CrossRef]
  30. Lee, E.-s.; Lee, C.-h.; Chun, Y.-S.; Han, C.-j.; Lim, D.-S. Effect of hydrogen plasma-mediated surface modification of carbon fibers on the mechanical properties of carbon-fiber-reinforced polyetherimide composites. Compos. Part B Eng. 2017, 116, 451–458. [Google Scholar] [CrossRef]
  31. Xiao, J.; Zhang, X.; Zhao, Z.; Liu, J.; Chen, Q.; Wang, X. Rapid and Continuous Atmospheric Plasma Surface Modification of PAN-Based Carbon Fibers. ACS Omega 2022, 7, 10963–10969. [Google Scholar] [CrossRef] [PubMed]
  32. Moosburger-Will, J.; Bauer, M.; Schubert, F.; Kunzmann, C.; Lachner, E.; Zeininger, H.; Maleika, M.; Hönisch, B.; Küpfer, J.; Zschoerper, N.; et al. Methyltrimethoxysilane plasma polymerization coating of carbon fiber surfaces. Surf. Coat. Technol. 2017, 311, 223–230. [Google Scholar] [CrossRef]
  33. GB/T 29761-2022; Carbon Fibre—Determination of Sizing Content. 7.2 Method B: High-Temperature Decomposition Method. National Standardization Administration Committee, State Administration for Market Regulation: Beijing, China, 2022.
  34. Zhang, Y.; Chen, C.; Chen, W.; Cheng, H.; Wang, L. A novel aqueous plasma electrolysis for carbon fiber. Chem. Eng. J. 2016, 304, 426–430. [Google Scholar] [CrossRef]
  35. Gupta, P.; Tenhundfeld, G.; Daigle, E.O.; Ryabkov, D. Electrolytic plasma technology: Science and engineering—An overview. Surf. Coat. Technol. 2007, 201, 8746–8760. [Google Scholar] [CrossRef]
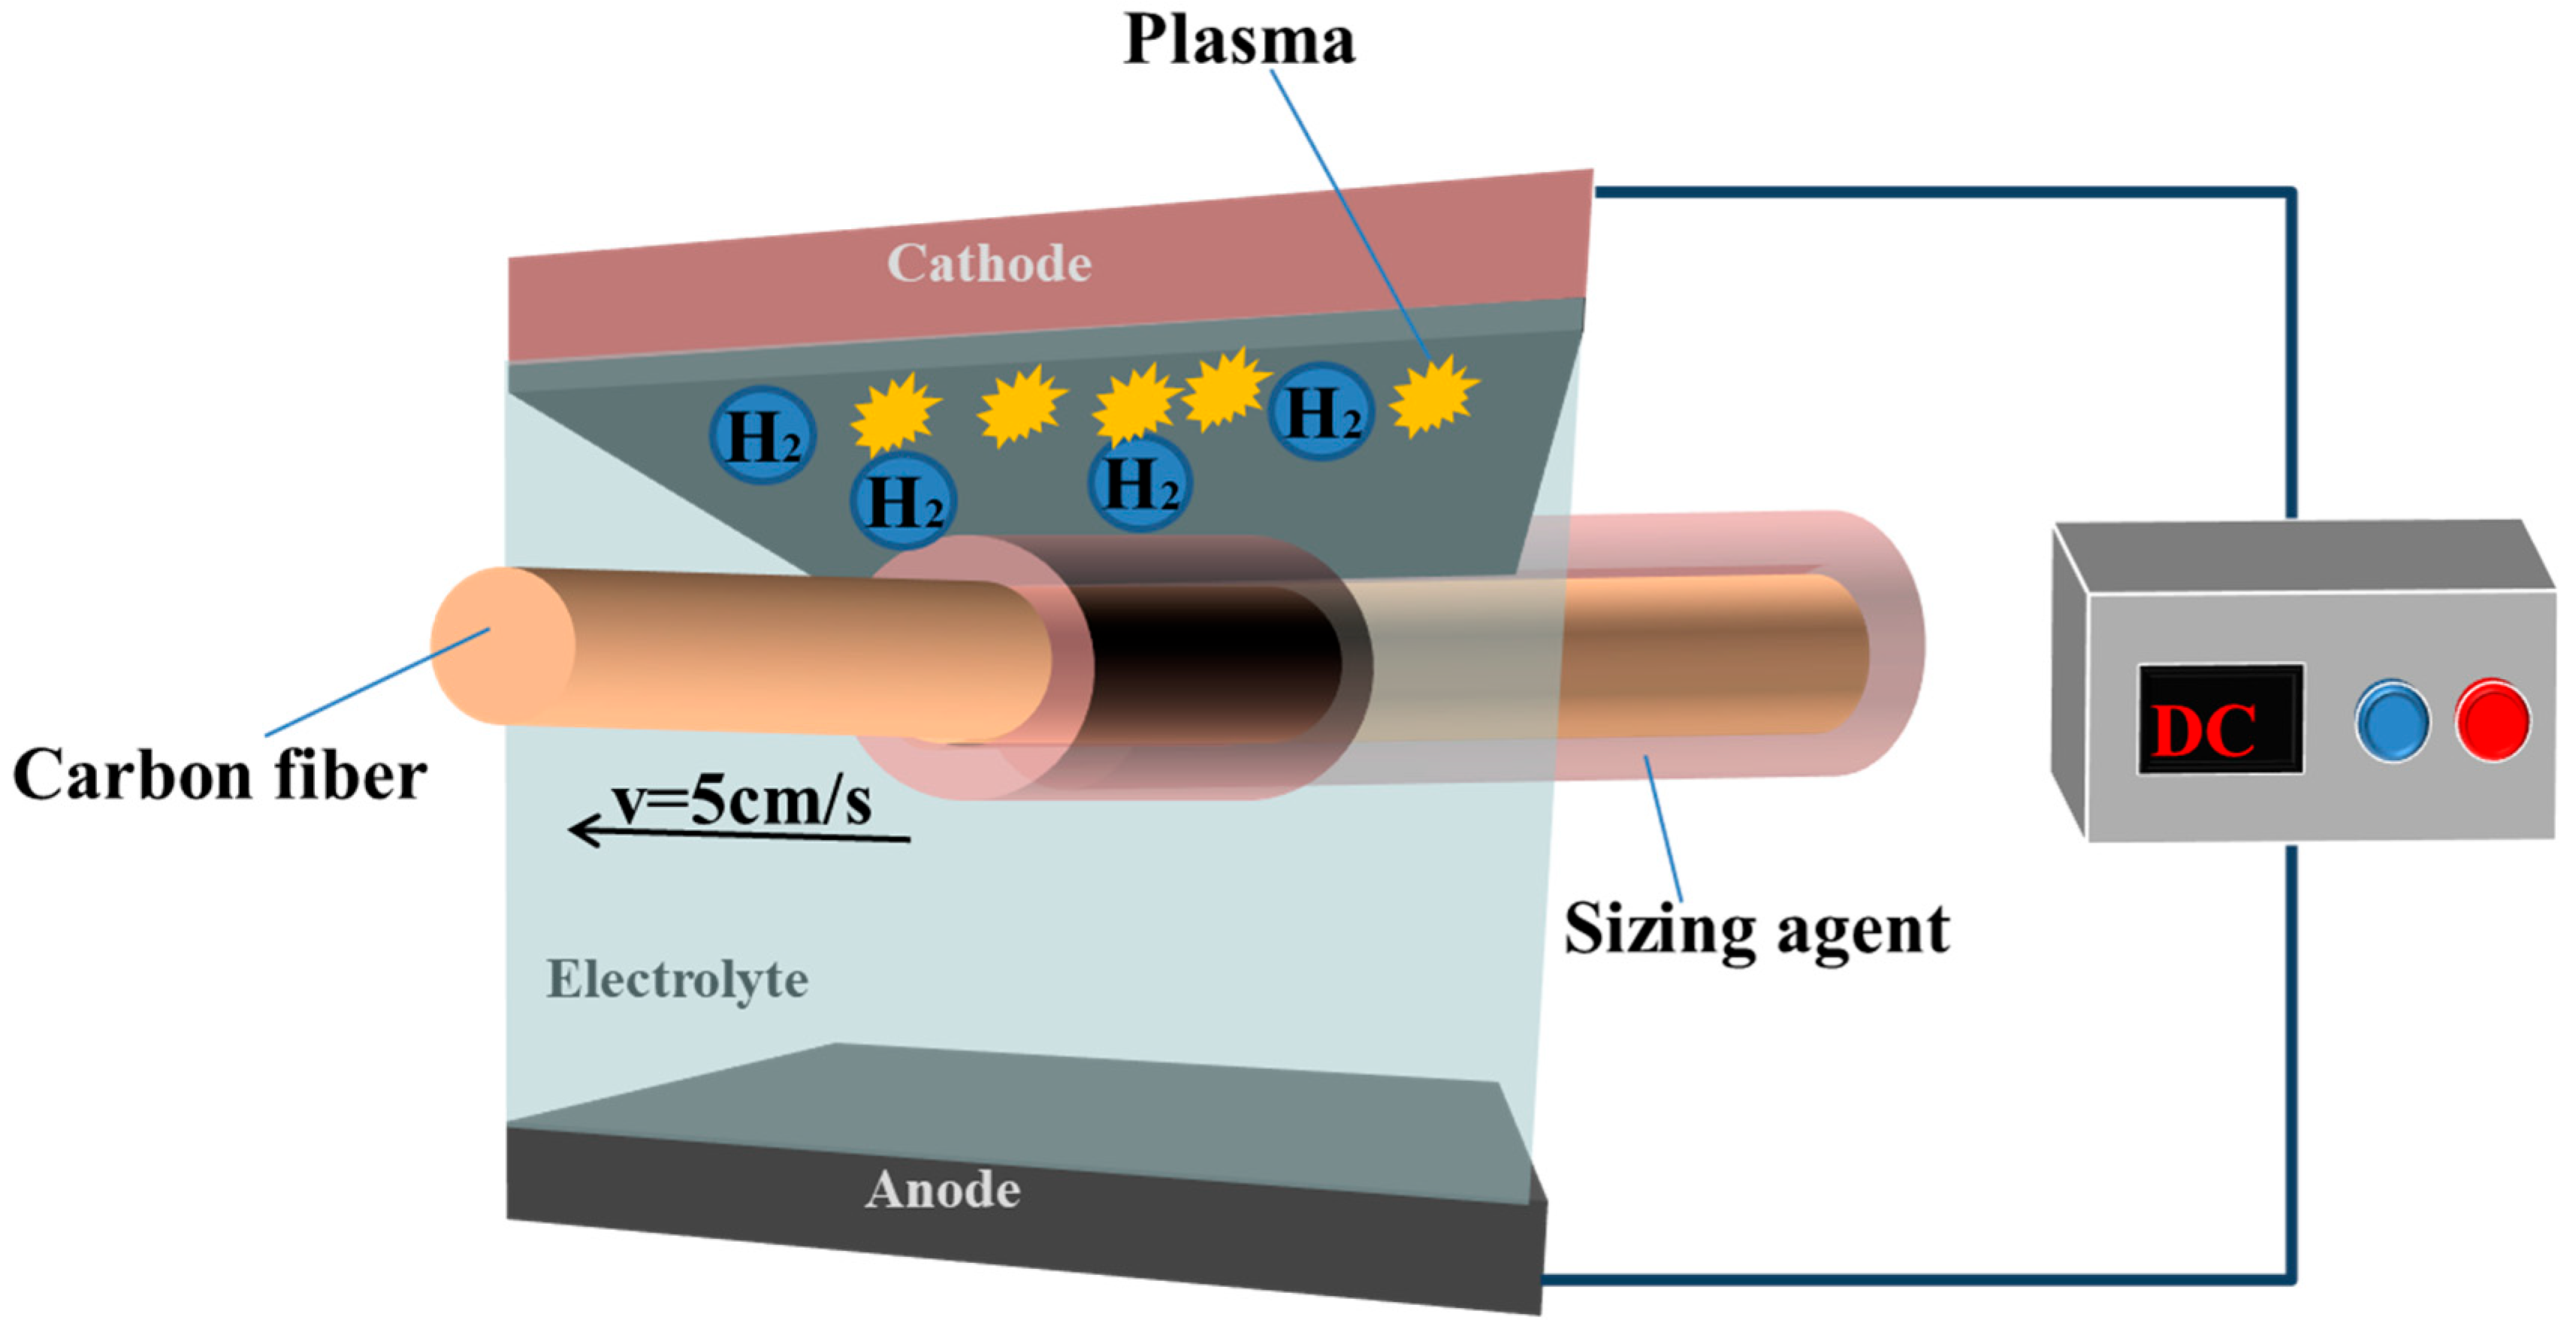
Figure 1. Schematic diagram of the process of removing sizing agent from the surface of carbon fibers by LPE.
Colloids 09 00057 g001
Figure 2. Equipment structure diagram.
Colloids 09 00057 g002
Figure 3. Equipment: real figure at work.
Colloids 09 00057 g003
Figure 4. Scanning electron microscope images of the bare sample and samples a–c; 1, 2, and 3 are images at 500×, 2000×, and 10,000× respectively.
Colloids 09 00057 g004
Figure 5. Scanning electron microscope images of samples d–f, 1, 2, and 3 are images at 500×, 2000×, and 10,000× respectively, some of the residues are marked by yellow arrows.
Colloids 09 00057 g005
Figure 6. Scanning electron microscope images of samples g–i, 1, 2, and 3 are images at 500×, 2000×, and 10,000× respectively, some of the residues are marked by yellow arrows.
Colloids 09 00057 g006
Figure 7. TG of the bare sample and samples a–i.
Colloids 09 00057 g007
Figure 8. The remaining weight of each sample at 300 °C.
Colloids 09 00057 g008
Figure 9. Weight-time curves of sample h, the bare sample, and CF after 700 °C/N2/1 h.
Colloids 09 00057 g009
Figure 10. The peak fitting results: (a) bare sample; (b) CF after 700 °C/N2/1 h; (c) sample h.
Colloids 09 00057 g010
Figure 11. The tensile strength of the bare sample and sample h.
Colloids 09 00057 g011
Figure 12. Schematic diagram of the mechanism of LPE in removing the sizing agent, (a) The thermal field effect during LPE, (b) The mechanical force acting on the generation and rupture of bubbles in LPE, (c) The direct bombardment effect of plasma in LPE, (d) The water-soluble components in the sizing agent during LPE are affected by the fluid field and the electric field.
Colloids 09 00057 g012
Table 1. Labels of samples to their parameters.
Arcing Voltage185 V200 V215 V
Electrode
Spacing
20 mmabc
15 mmdef
10 mmghi
Table 2. The relevant peak surface parameters of the bare sample and sample h.
SampleBinding Energy/eVPeak HeightFull Width at Half Maximum (FWHM)Peak AreaPercentage of Peak Area
h284.0 (C-Csp2)
285.64 (C-O)
6490
2630
1.71
1.76
13,057
4811
77.4
22.6
CF after 700 °C
/N2/1 h
284.0 (C-Csp2)13,9281.2825,678100
bare284.0 (C-Csp2)
285.73 (C-O)
6513
4691
1.33
1.40
10,441
7432
58.4
41.6
Disclaimer/Publisher’s Note: The statements, opinions and data contained in all publications are solely those of the individual author(s) and contributor(s) and not of MDPI and/or the editor(s). MDPI and/or the editor(s) disclaim responsibility for any injury to people or property resulting from any ideas, methods, instructions or products referred to in the content.