Article

Polyvinylpyrrolidone-Capped CuInS2 Colloidal Quantum Dots: Synthesis, Optical and Structural Assessment

1
Micro- and Nanoelectronics Department, Saint Petersburg Electrotechnical University “LETI”, 197022 Saint Petersburg, Russia
2
Infochemistry Scientific Center, ITMO University, 197101 Saint Petersburg, Russia
3
Institute of Physics and Mathematics, Kabardino-Balkarian State University, n.a. Kh.M. Berbekov, 360004 Nalchik, Russia
4
Institute of Computer Science and Problems of Regional Management, Kabardino-Balkar Scientific Center, Russian Academy of Science, 360004 Nalchik, Russia
5
Ioffe Institute, 194021 Saint Petersburg, Russia
6
Petersburg Nuclear Physics Institute Named by B.P. Konstantinov of NRC «Kurchatov Institute», 188300 Gatchina, Russia
7
Institute of Chemistry, Saint Petersburg State University, 199034 Saint Petersburg, Russia
8
Research Institute of Chemistry, Peoples’ Friendship University of Russia (RUDN University), 117198 Moscow, Russia
*
Author to whom correspondence should be addressed.
Colloids Interfaces 2025, 9(3), 33; https://doi.org/10.3390/colloids9030033
Submission received: 10 April 2025 / Revised: 16 May 2025 / Accepted: 18 May 2025 / Published: 20 May 2025

Abstract

Ternary metal chalcogenide quantum dots (QDs), such as CuInS2, have attracted significant attention due to their lower toxicity compared to binary counterparts containing cadmium or lead, making them promising candidates for biomedical imaging and solar energy applications. The surfactant choice is critical for controlling nanocrystal nucleation, growth kinetics, and functionalization. This directly affects the toxicity and applications of QDs. In this work, we report a synthesis protocol for PVP-capped CuInS2 QDs in an aqueous solution. Using density functional theory (DFT) calculations, we predicted the coordination patterns of PVP on the CuInS2 QDs surface, providing insights into the stabilization mechanism. The synthesized QDs were characterized using TEM, XRD, XPS, and FTIR to assess their morphology, chemical composition, and surface chemistry. The QDs exhibited dual photoluminescence (PL) maxima at 550 nm and 680 nm, attributed to defect-related emissions, making them suitable for cell imaging applications. Cytotoxicity studies and cell imaging experiments demonstrate the excellent biocompatibility and effective staining capabilities of the PVP-capped CuInS2 QDs, highlighting their potential as fluorescent probes for long-term, multicolor cell imaging including two-photon microscopy.

1. Introduction

Colloidal quantum dots (QDs) of I–III–VI compounds are considered to be an alternative to the binary II–VI QDs such as CdS(Se) and PbS(Se) due to their relatively low toxicity owing to the absence of cadmium and lead in their composition. The large Stokes shift (200–800 meV) that reduces the reabsorption effect makes these materials superior to organic dyes and perovskite nanocrystals for some applications [1,2,3,4,5]. By controlling technological parameters, it is possible to change the photoluminescence (PL) peak position of I–III–VI QDs in the range from visible to near-infrared (450–1200 nm) both by varying the synthesis time and adjusting the molar ratio of the constituent I and III cations [6,7,8,9].
Compared to simpler and less toxic nanocrystal systems such as InP, CuInS2 QDs offer several unique advantages, particularly their high tolerance to stoichiometric deviations and the ability to form various types of intrinsic point defects. These structural features allow for fine-tuning of the material’s optical properties through controlled defect engineering. The photoluminescence in CuInS2 QDs is largely governed by emission from defect-related states, which can be modulated by adjusting the synthesis conditions and elemental composition within a broad homogeneity range. This flexibility enables precise control over emission wavelength, spectral width, and quantum yield—features that are more difficult to achieve in more stoichiometrically rigid systems like InP [10,11].
Colloidal QDs as functional materials find application in flexible electronics and solar energy [12,13,14,15,16]. Colloidal I–III–VI QDs are also attracting attention for biomedical research [17,18,19]. One of the promising areas is the use of QDs for the visualization of cells and tissues [20,21,22,23]. Usually, QDs must be conjugated with biomolecules to label specific cell proteins. Bioconjugation provides binding specificity and can be implemented in several ways. One of the perspectives for conjugating is to cap the QDs with a polymer surface.
Obtaining QDs in aqueous solutions using hydrophilic ligands such as mercaptopropionic acid, mercaptoacetic acid, L-glutathione, etc., [10,11] is an established direction in QDs synthesis. In [24], a synthesis protocol for polyvinylpyrrolidone-capped AgInS2 QDs in aqueous solution was reported. Polyvinylpyrrolidone (PVP) is a synthetic polymer with valuable properties, including biocompatibility, non-toxicity, high chemical stability, and excellent solubility in water and most organic solvents. Due to these characteristics, PVP is widely used in various fields, such as pharmaceuticals, biomedicine, and environmental applications [25,26]. Coating the QDs with a non-toxic, water-soluble linear polymer composed of 1-vinyl-2-pyrrolidone monomers provides a promising opportunity to expand the use of QDs in biomedicine and biosensors.
There are two potential chemisorbing sites on PVP related to the amide group in the heterocyclic ring: carbonyl oxygen and nitrogen. Up to this point, the direct nanoparticle coordination with PVP was demonstrated predominately in the case of noble metal nanocrystals [27,28]. Different models of the interaction between PVP and metal and semiconductor nanoparticle surfaces were proposed, but definite understanding of the stabilization mechanism is lacking.
In this regard, the aim of our research is to develop an aqueous synthesis method for PVP-capped CuInS2 QDs and investigate their stabilization mechanism using DFT. While similar synthetic approaches have been reported, the novelty of our work lies in combining experimental characterization with DFT modeling to elucidate the coordination chemistry between PVP and the QD surface. This theoretical insight provides a foundation for understanding the role of PVP in stabilizing CuInS2 QDs, which could guide future optimization of synthesis protocols.

2. Materials and Methods

2.1. Chemicals

Indium(III) chloride (InCl3, 99.9%) was purchased from Sigma Aldrich (St. Louis, MO, USA). Copper(II) acetate (Cu(CH3COO)2, 99%), sodium sulfide (Na2S∙9H2O, 98%), and Poly(N-vinyl-2-pyrrolidone) (av. Mw 12,600) were provided by Vekton (St. Petersburg, Russia). All chemicals were used without additional purification.

2.2. PVP-Capped CuInS2 QDs Synthesis

PVP-capped CuInS2 QDs were synthesized in aqueous solution as follows. Cationic precursor solution with molar ratio [Cu]:[In] = 1:4 was prepared by dissolving 2.0 mg (0.01 mmol) of copper(II) acetate and 8.0 mg of PVP in 5 mL of deionized water followed by addition of 8.8 mg (0.04 mmol) of indium (III) chloride. Quick injection of aqueous solution containing 48 mg (0.2 mmol) of sodium sulfide resulted in instantaneous nucleation and the obtained mixture of QD cores was heated at 95 °C for 1 h.

2.3. Methods

X-ray diffraction (XRD) and transmission electron microscopy (TEM) techniques were used for structural characterization. TEM images were obtained using a JEOL JEM-2100F microscope, JEOL, Akishima, Japan (accelerating voltage 200 kV, point resolution 0.19 nm). XRD patterns were taken on a Rigaku SmartLab diffractometer (Rigaku Corp., Tokyo, Japan) with a CuKα, 45 kW, 200 mA in the 2θ range from 10 to 60°. The surface chemical electronic state and composition of the PVP-capped CuInS2 QDs were measured using a “K-Alpha” Thermo Scientific system (Waltham, MA, USA) X-ray photoelectron spectroscopy (XPS) instrument equipped with an Al-Kα (1486.6 eV) X-ray source. Infrared spectra of PVP-capped CuInS2 QDs samples are taken using a Vertex 80 Fourier-transform infrared (FTIR) spectrometer (Bruker Optics, Ettlingen, Germany). A PL measurement setup based on the same FTIR was employed to obtain PL spectra. A 405 nm semiconductor laser diode was used as an excitation source. The UV–vis absorption spectra were recorded with a PE-5400UV UV–vis spectrophotometer (“Ekohim” LLC, St. Petersburg, Russia) in the 350–850 nm range and 1 nm resolution.

2.4. Computational Details

The possible coordination patterns between the PVP and CuInS2 QDs’ surface were predicted by means of quantum mechanical modelling at the DFT level of theory. The geometry optimization procedure for all model structures was carried out at the B3LYP-D4/def2-TZVP level of theory by using the Orca 5.0.4 program package [29]. The following convergence tolerance criteria were used: energy change 5.0 × 10⁻⁶ Eh, maximum gradient 3.0 × 10⁻⁴ Eh/Bohr, RMS gradient 1.0 × 10⁻⁴ Eh/Bohr, maximum displacement 4.0 × 10⁻³ Bohr, and RMS displacement 2.0 × 10⁻³ Bohr. The RIJCOSX approximation [30,31] utilizing the appropriate auxiliary basis sets was used to reduce the computational costs. The couple perturbed self-consistent field equations were solved using the conjugated gradient method. The Hessian matrix was calculated for fully optimized model structure of PVP to confirm the location of a minima on the potential energy surface (no imaginary frequencies were found). The CuInS2 crystal elementary cell in the chalcopyrite phase was utilized as model for the CuInS2 QDs’ surface. Structural constraints were used for all atoms of CuInS2 moieties in model structures to eliminate geometry distortion during the optimization process. The difference between the binding energies of the individual molecules of PVP and CuInS2 in various associates of PVP–CuInS2, in terms of total electronic energy values change (∆E), was used to assess the energetical favorability of the PVP and CuInS2 interaction via different possible binding sites. The ChemCraft 1.8 program was used for the visualization of model structures of monomers and associates. Cartesian atomic coordinates of all model structures are given in the Supporting Information as xyz-files.

2.5. Cell Culture and Processing

Mouse C2C12 myoblasts (ATCC CRL-1772) were purchased from Sigma Aldrich (St. Louis, MO, USA). The cells were cultured in growth medium, consisting of Dulbecco’s modified Eagle’s medium enhanced with 10% fetal bovine serum (BioloT, St. Petersburg, Russia), and 1% penicillin/streptomycin (BioloT, St. Petersburg, Russia) at 37 °C and 5% CO2.
The PVP-capped CuInS2 QDs at a concentration of 1 ÷ 70 nmol/L were added in 12-well plates (BioloT, St. Petersburg, Russia) with growing C2C12 cells for 2–3 days. The number and morphology of cells in each well were monitored using bright field microscopy with a LEICA DMI8 microscope (Leica Microsystems GmbH, Wetzlar, Germany). The difference between cells was determined by visual analysis. Total cell numbers were calculated by manual counting of cells per image section. Approximately 10 image sections were analyzed for every sample in each experiment.
The viability of cells was determined by MTT-assay. The cells were primary incubated with PVP-capped CuInS2 particles added at a concentration of 1 ÷ 70 nmol/L for 3 days. Then the medium was removed, the cells were washed up three times and 10 µL of MTT solution (1 mg/mL) was placed in each well plate. The MTT solution was prepared in phosphate-buffered saline at a pH of 7.4. The cells were incubated for 4–6 h at 37 °C in a CO2 incubator at a constant shaking. The formazan crystals were dissolved in 300 µL of dimethyl sulfoxide). The optical density was assessed at 540 nm. The optical density at 720 nm was recorded to correct a background noise. The optical density ratio between the samples’ values and the optical density of the control cells was used to determine the viability of the cells.

2.6. Imaging and Signal Analysis

For microscopy, the cells were fixed with 70% ethanol for 15 min at 4 °C. Then, cells were washed in phosphate-buffered saline 3 times. Slides with fixed cells were put at inverted position on a cover glass. The samples were examined via multiphoton microscopy (Bergamo II multiphoton microscope, Thorlabs, Newton, MA, USA) [32]. A tunable femtosecond Ti:Sapphire laser (Tiberius, Thorlabs, Newton, MA, USA) was used with the following pulse parameters: duration of 140 fs, a repetition rate of 77 MHz, a wavelength of 780 nm, and an average laser power of 75 mW. Photoluminescence was collected with a photomultiplier tube in the wavelength range of 300 to 705 nm.

3. Results and Discussion

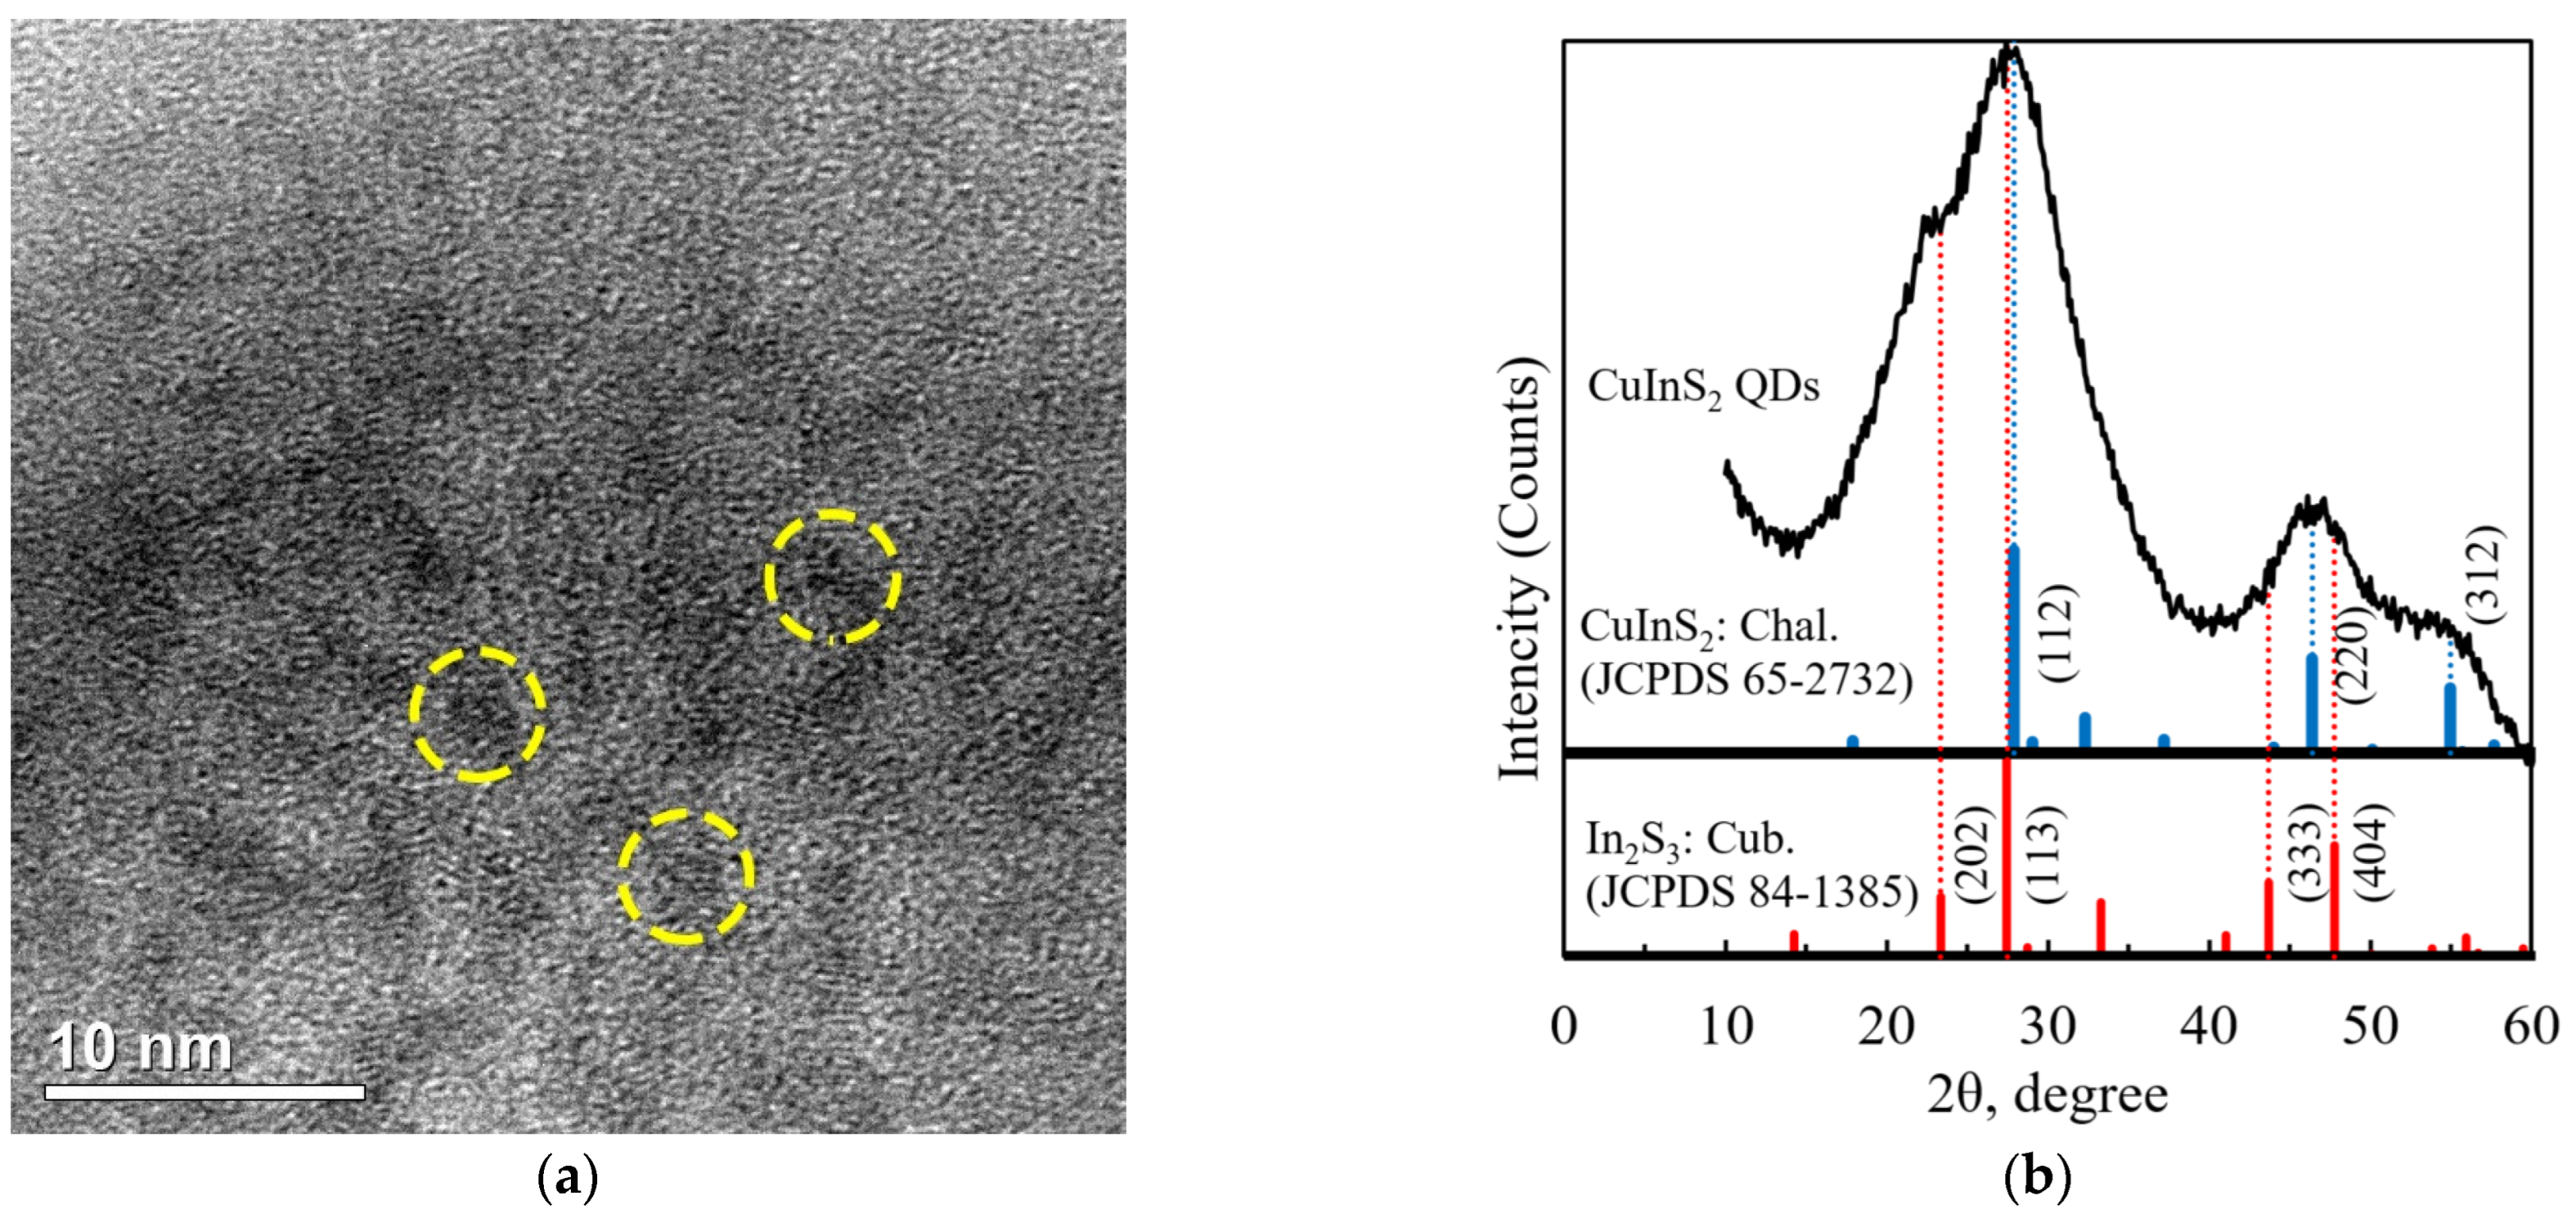
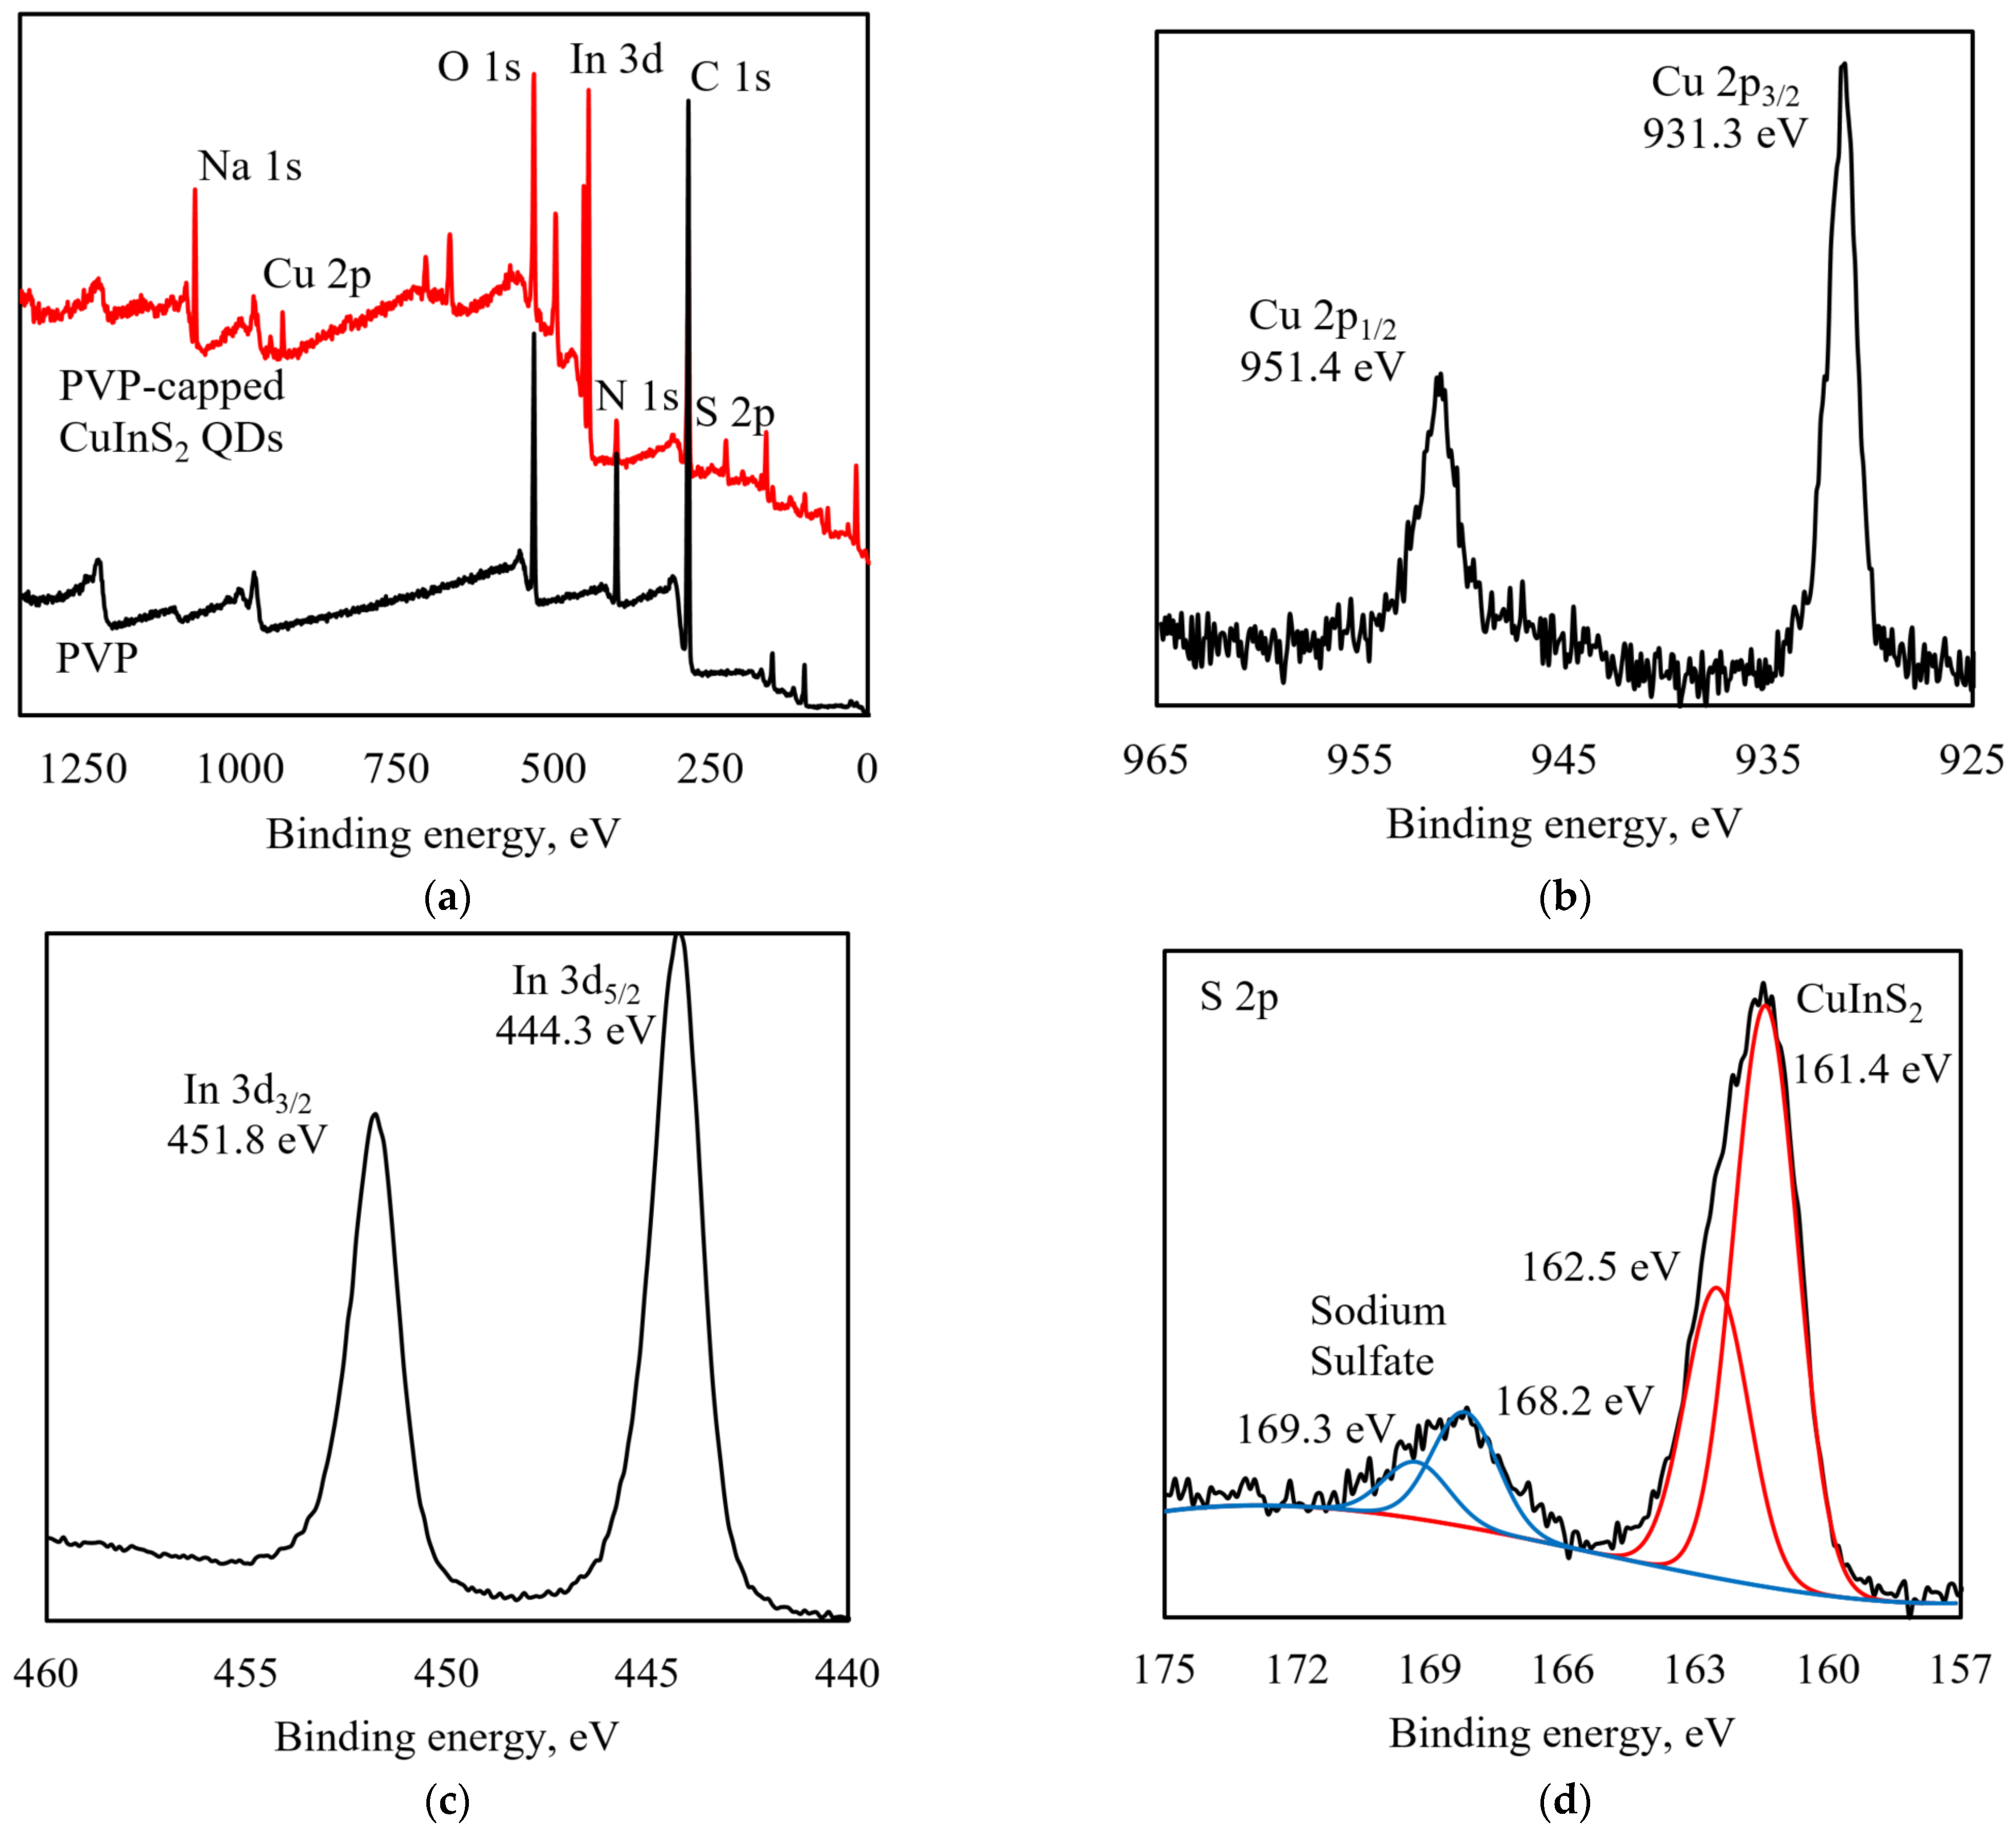
3.1. Structure Characterization

In order to establish morphology and structure of the PVP-capped CuInS2 QDs, TEM and XRD studies were performed.
TEM measurements (Figure 1a) reveal an average particle diameter of approximately 2 nm, smaller than the exciton Bohr radius in CuInS2, confirming strong quantum confinement. The XRD pattern (Figure 1b) had a complicated form with broadening of XRD peaks characteristic of nano-sized crystalline materials. It pointed to the presence of a CuInS2 phase (patterns at 2θ values of 27.9, 46.4, and 55.0°). The observed Bragg peaks agreed well with (112), (220), and (312) planes of chalcopyrite CuInS2 (JCPDS 65-2732) indicating that obtained nanoparticles were nuclei of a tetragonal crystalline phase of CuInS2.
Figure 2 shows the XPS spectra of PVP-capped CuInS2 QDs.
From Figure 2b, it can be seen that Cu 2p peaks were found at 931.3 eV (Cu 2p3/2) and 951.1 eV (Cu 2p1/2), In 3d peaks were found at 444.3 eV (In 3d5/2) and 451.8 eV (In 3d3/2), and S 2p peaks were found at 168.4 eV and 161.4 eV. The sulfur spectrum is represented by a superposition of two chemical states with various binding energy shifts of the S 2p doublet. The main peaks of the survey spectrum belonged to Cu, In, S, C, N, Na, and O elements.
The chemical composition is complex in the obtained sample. According to deconvolution presented in Figure 2d, 83.3 at.% of sulfur is in the three-component CuInS2 system (S 2p3/2 peak at 161.4 eV) [33]. Another chemical state of sulfur was ascribed to sodium sulphate [34].
In Figure 3, FTIR spectra of PVP and PVP-capped CuInS2 QDs are presented.
The FTIR spectrum of PVP-capped CuInS2 QDs reveal characteristic absorption bands related to PVP heterocycle (1291, 1319, 1374, 1423, 1438, 1463, and 1495 cm−1) [35], C–N stretching vibration (1074 [36] and 1018 cm−1), the out-of-plane C–H bending, rocking, and OH wagging (845, 736, and 650 cm−1). The absorption bands at 2955 and 2922 cm−1 are due to C–H bond symmetric and asymmetric stretching, respectively, and the broad line at around 3500–3400 cm−1 is characteristic for the –OH group of H2O [35].
The results of FTIR spectroscopy did not allow us to experimentally determine the coordination mechanism in PVP-capped CuInS2 QDs in this work.

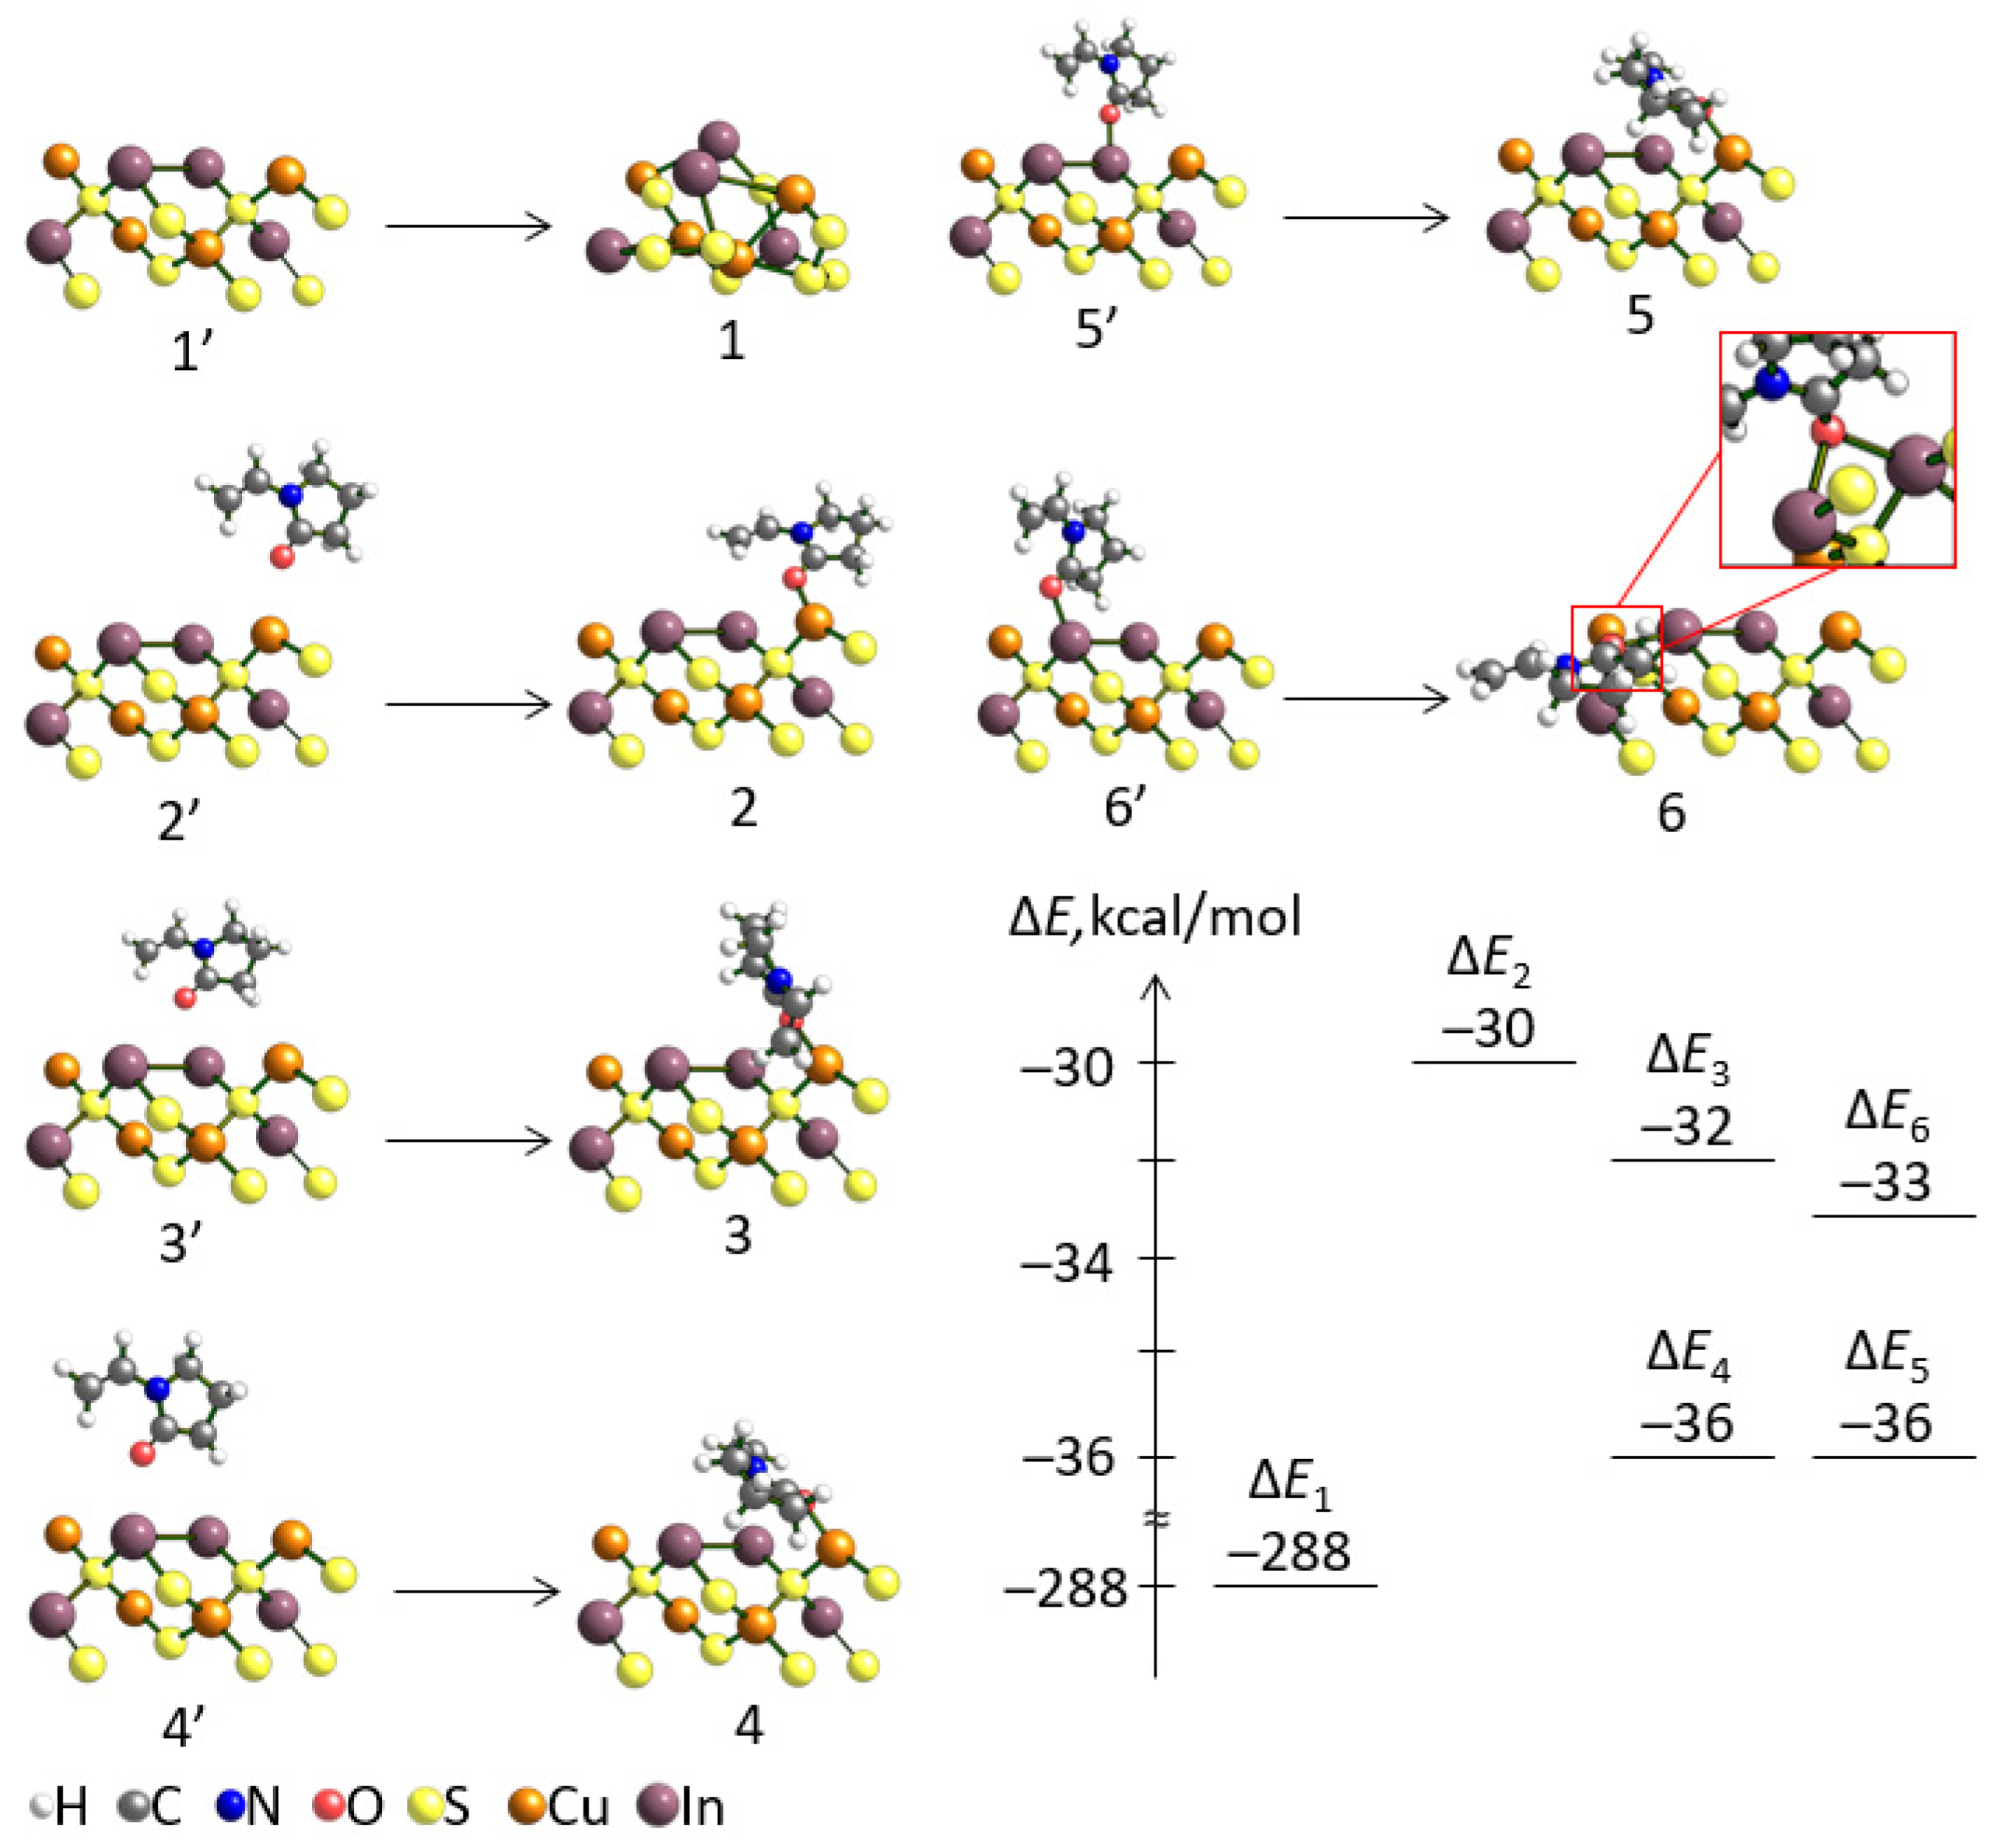
3.2. Theoretical Calculations

Bulk-scale DFT modeling of nanocrystals [37] demands substantial computational resources, rendering such calculations costly. To theoretically study the association of PVP with CuInS2 on the molecular level and quantitatively estimate the relative energetical favorability of hypothetically formed associates, we carried out quantum mechanical calculations at the B3LYP-D4/def2-TZVP level of theory for model structures. To calculate the binding energy between PVP and CuInS2, we used the unit cell of CuInS2 as model. As noted previously [38], the cluster approach combined with hybrid functionals effectively reduces computational costs while maintaining accuracy in electronic property descriptions. This method was widely employed in catalytic reaction studies, where DFT errors arising from model size constraints often have minimal impact on relative energy comparisons. Thus, our approach focuses on elucidating fundamental electronic interactions between PVP and the CuInS2 QDs surface, circumventing the need to explicitly model the entire QD. The full geometry optimization of model CuInS2 QDs resulted in a significant distortion of the initial unit cell structure (Figure 4, process 1′–1). Therefore, we used structural constraints for model CuInS2 QDs to preserve the correct crystal geometry. Positional constraints on the unit cell prevent relaxation artifacts that could distort critical parameters such as adsorption energy. This strategy aligns with established practices in nanomaterial simulations, where constraints are routinely used to maintain structural representativeness, as demonstrated in electrocatalyst modeling studies [39]. We considered different initial locations of the PVP relative to CuInS2 QDs near the copper and indium atoms (Figure 4). It was shown that the Cu–O binding energy could be up to –36 kcal/mol depending on the conformation of the associate (Figure 4, 2–5). The location of PVP near the indium atom results in the migration of PVP to the copper atom (Figure 4, processes 3′–3, 4′–4, and 5′–5). The binding In–O is only possible with the participation of two lone electron pairs of the PVP oxygen and the two closely spaced indium atoms (Figure 4, process 6′–6) with binding energy equal to –33 kcal/mol. Thus, dominant coordination of PVP to CuInS2 via the formation of Cu–O bonds was collaterally confirmed by DFT calculations and highly expected in real samples of QDs. While these findings have not affected current synthesis protocol directly, they may provide a theoretical foundation for future optimization of PVP-capped QDs by elucidating the coordination interactions between the oxygen atom of the PVP fragments and the Cu(I) and In(III) ions at the molecular level.

3.3. Optical Properties of PVP-Capped CuInS2 QDs

The amount of surfactant was chosen according to previous work [24], where we showed that the maximization of PL intensity of AgInS2 QDs was achieved at an amount of PVP equal to 8 mg per 0.004 mmol [In3+]. PL spectra of all luminescent CuInS2 samples exhibit two maxima, with peaks at approximately 550 nm and 680 nm (Figure 5).
Figure 5 shows the absorption and PL spectra of CuInS2 QDs in aqueous solution. A broad and featureless absorption curve with a long absorption tail in the low-energy area without clearly defined excitonic maxima was observed. The excitation of Cu1+-related states forming sub-bandgap levels is manifested by an absorption feature around 550–650 nm, which results in a broad, featureless absorption shoulder that stretches into the visible region [40,41].
Unlike other QDs of this type, the PL spectra display two bands with maxima at approximately 550 nm and 680 nm. In the work [42], AgInS2 QDs were synthesized with PL curves similarly featuring two maxima. The authors proposed the formation of In2S3 and AgInS2 phases. Their explanation of PL spectra was presented in terms of reverse Type I core/shell structure. The PL mechanism was introduced as two parallel processes: direct radiative recombination in the In2S3 core and further trapping of a fraction of excitons by the narrower bandgap Ag-In-S shell phase, followed by their recombination. This model does not appear applicable to our experimental results due to the small average size of the QDs (approximately 2 nm). Size distribution effects may cause observation of similar multiple band PL spectra [43]. Although TEM (Figure 1a) analysis indicates a relatively narrow size distribution (2.0 ± 0.5 nm), the resolution limits of our measurements prevent definitive exclusion of minor subpopulations that could contribute to the observed PL.
CuInS2 QDs are known to exhibit a high tolerance for off-stoichiometry, leading to the formation of intrinsic point defects that can significantly influence their optical properties [44]. In this regard, various types of intragap point defect states were proposed to participate in emission process. Structurally, the point defects could take the form of an ordered neutral defect complexes of the two I group element vacancies and one antisite defect, which is the element of the III group in a position of the element of the I group (2VCu + InCu) [34,45]. Typically, PL characteristics of I–III–VI are explained either in terms of donor–acceptor pair (DAP) recombination mechanism or recombination of localized hole and delocalized electron. As was demonstrated in [46], defect-mediated recombination via DAP mechanism may account for the broad PL spectrum, predominantly resulting from heterogeneity in defect positioning rather than intrinsic line broadening. The transition energy varies depending on the radial coordinate of Cu-related defects (e.g., Cu2+ or VCu), and the higher-energy emission (550 nm in our case) likely corresponds to surface-proximal defects with weaker electron–hole Coulomb coupling, while the lower-energy peak (680 nm) reflects deeper defects with stronger localization effects. The similar observation of two distinct PL peaks in the visible region (around 650 nm) and in the near-infrared region (around 900 nm) was observed in CuInS2 QDs obtained through partial cation exchange in Cu2−xS nanocrystals [47].
As was demonstrated in [48], for CuInS2 QDs, the observation of two distinct defect-mediated recombination pathways involving copper-related centers is possible. In this case, the higher-energy emission originates from Cu2+ defects, where the inherent 3d9 configuration facilitates direct radiative recombination with conduction band electrons, while the lower-energy emission arises from Cu+ defects (CuIn antisites) that require prior hole trapping for activation. These defect states create characteristic intragap energy levels, with Cu+ centers contributing to sub-bandgap absorption feature around 550–650 nm and influencing the broad absorption tail. The relative intensities of these emission bands reflect the complex interplay between stoichiometry (Cu/In ratio) and defect formation during synthesis, and the trapped-hole PL pathway itself was shown to be consistent with results of transient absorption spectroscopy measurements [49]. Nevertheless, in our case the energy gap between PL bands is probably too wide to be explained exclusively by this mechanism. While the defect-mediated mechanism provides the most consistent interpretation of our optical and structural data, future time-resolved studies could further elucidate the relative contributions of different recombination pathways.

3.4. Live Cell Imaging Using PVP-Capped CuInS2 QDs

Most conventional fluorophores have an excitation spectrum in the 400–500 nm range, whereas the excitation laser operates in the 700–1000 nm range [50]. Thus, the search for suitable fluorophores for this application is of interest. QDs have the potential to become a new class of fluorescent probes for many biological and biomedical applications [22,51,52,53], especially cellular imaging. It should be noted that QDs can be promising for two-photon fluorescence microscopy due to their unique properties such as photostability, and the ability to penetrate biological tissues with reduced photodamage [54]. Size-controlled QDs allow for the customization of two-photon fluorescence wavelengths, facilitating applications in multicolor imaging and optoelectronics. In addition, QDs can also provide information about temperature in tissues [55].
There are several approaches for QDs staining. Usually, the main approach for cell or tissue labelling employs either secondary antibody (Ab)-conjugated QDs to target primary Ab, or direct conjugation between primary Ab and QDs [22,51]. Direct QD conjugation methods may suffer from several major problems, which limit their application in cancer molecular profiling.
The QDs are found to be stable in aqueous solutions and could be used for cell staining. The toxicity of CuInS2 QDs in C2C12 cells has been determined by MTT assays. With a wide concentration range of 6.7−333.3 nmol mL−1, CuInS2 QDs were incubated with C2C12 cells for 24–48 h at 37 °C. As illustrated in Figure 6d, the cell viabilities are 2.3, 32.5, 54.9, 57.5, and 81.8% for QDs in ethylene glycol and 3.1, 34.7, 55.7, 67.7, and 84.6% for QDs in water. The results show that CuInS2 QDs possess low toxicity and excellent biocompatibility.
As seen in Figure 6a, purple formazan crystals are observed in the cells’ cytoplasm and around the cell nucleus of the control samples. It should be noted that the color is very intense, which correlates to high cell viability (almost 95%) in the control. Increasing the concentration of QDs to 6.7 leads to a subsequent cell decrease of up to 75%. It should be noted that cell viability is higher with QDs obtained in water. Using QDs at a concentration of 33 nmol/L results in a reduction in cellular life capacity by up to 54–57%. Further increase in QDs’ concentration leads to gradual cell lysis, and we can see the destroyed cells in optical microscope images.
Additional proof of less mitochondrial activity in cells could be the smaller amount of formed formazan crystals in cells (Figure 6b). At the concentration of QDs higher than 33 nmol/L, C2C12 cells are dying. In Figure 6c, we can see transparent cells without formazan crystals, which proves viability inhibition. The use of high concentrations of QDs (above 50 nmol/L) leads to the formation of cellular conglomerates that detach from the surface (Supplementary Materials, Figure S1i,h).
To further evaluate the availability of CuInS2 QDs in cell imaging, C2C12 cells were used. After being incubated with CuInS2 for 24 h, C2C12 cells show a strong fluorescence emission. The CuInS2 QDs were found to enter the cells (Figure 6e,h). It should be noted that the nuclei of viable cells generally do not fluoresce (Figure 6h) (Supplementary Materials, Figure S1a). This may serve as an additional marker for cell viability. Strong fluorescence was achieved at relatively low concentrations of QDs (up to 6.7 nmol/L), which is notably lower than the concentrations required in existing methods [54,56]. As the concentration of toxic QDs increases, cellular viability decreases, and the destruction of cell membranes results in uniform cell fluorescence. Thus, CuInS2 QDs can be used not only for staining cells, but also for assessing their viability. These advancements highlight the potential of QDs in biomedical research, diagnostics, and nanoscale optoelectronics.

4. Conclusions

In this study, we developed a method for synthesizing PVP-capped CuInS2 QDs in aqueous solution, highlighting their potential for biomedical imaging and optical applications. DFT calculations provided valuable insights into the coordination mechanism of PVP with CuInS2 nanocrystals, revealing that PVP predominantly binds via Cu–O bonds. While our experimental synthesis was empirically optimized, the DFT modeling offers valuable insights for rational design of polymer-capped QDs in subsequent studies. This understanding offers insights into the synthesis optimization process and could potentially guide the development of other polymer-capped QDs with customized optical and surface properties. The QDs exhibited dual photoluminescence peaks at 550 nm and 680 nm, attributed to emissions consistent with defect-associated recombination pathways, making them highly suitable for cell imaging and other applications requiring tunable optical properties. Furthermore, the PVP-capped CuInS2 QDs demonstrated excellent biocompatibility and effective cell staining capabilities, highlighting their potential as fluorescent probes for long-term cell imaging assessment using two-photon microscopy. The unique combination of favorable optical properties and polymer protection makes these QDs promising candidates for a wide range of applications, including biomedical imaging, solar energy conversion, and environmental sensing. The successful synthesis and characterization of PVP-capped CuInS2 QDs pave the way for their use as versatile fluorescent probes in biomedical research and beyond.

Supplementary Materials

The following supporting information can be downloaded at: https://www.mdpi.com/article/10.3390/colloids9030033/s1, Figure S1: Optical microscopy images (a,c,e,h) and fluorescence multiphoton microscopy images (b,d,f,h) of CuInS2 QDs penetrated into C2C12. Images of cell conglomerates formed after large concentration of QDs (above 50 mmol/L) was used: (i,j) optical microscopy; (k) multiphoton microscopy; XYZ Cartesian coordinates.

Author Contributions

Conceptualization, O.K.; methodology, O.K. and O.A.; software, A.B. and A.N.; validation, O.K., O.A., and D.M.; formal analysis, O.K., I.M., and D.M.; investigation, O.K., D.F., Z.K., D.K., P.L., V.M. (Vasilii Matveev), and S.U.; resources, I.M. and V.M. (Vyacheslav Moshnikov); data curation, O.K., A.B., Z.K., and A.N.; writing—original draft preparation, O.K.; writing—review and editing, O.K., O.A., and D.M.; visualization, A.B. and P.L.; supervision, O.K. and V.M. (Vyacheslav Moshnikov); project administration, O.K.; funding acquisition, I.M. All authors have read and agreed to the published version of the manuscript.

Funding

This research received no external funding.

Data Availability Statement

The data that support the findings of this study are available from the corresponding author upon reasonable request.

Acknowledgments

TEM tests were performed using equipment of the Federal Joint Research Center “Material science and characterization in advanced technology” supported by the Ministry of Science and Higher Education of the Russian Federation. Alexander S. Novikov is grateful to the RUDN University Strategic Academic Leadership Program. This work has been carried out using computing resources of the federal collective usage center Complex for Simulation and Data Processing for Mega-science Facilities at NRC “Kurchatov Institute”, http://ckp.nrcki.ru/.

Conflicts of Interest

The authors declare no conflicts of interest.

Abbreviations

The following abbreviations are used in this manuscript:
DFTDensity functional theory
FTIRFourier-transform infrared
PLPhotoluminescence
PVPPolyvinylpyrrolidone
QDsQuantum dots
TEMTransmission electron microscopy
XPSX-ray photoelectron spectroscopy
XRDX-ray diffraction

References

  1. Castro, S.L.; Bailey, S.G.; Raffaelle, R.P.; Banger, K.K.; Hepp, A.F. Synthesis and Characterization of Colloidal CuInS2 Nanoparticles from a Molecular Single-Source Precursor. J. Phys. Chem. B 2004, 108, 12429–12435. [Google Scholar] [CrossRef]
  2. Kino, T.; Kuzuya, T.; Itoh, K.; Sumiyama, K.; Wakamatsu, T.; Ichidate, M. Synthesis of Chalcopyrite Nanoparticles via Thermal Decomposition of Metal-Thiolate. Mater. Trans. 2008, 49, 435–438. [Google Scholar] [CrossRef]
  3. Zhong, H.; Zhou, Y.; Ye, M.; He, Y.; Ye, J.; He, C.; Yang, C.; Li, Y. Controlled Synthesis and Optical Properties of Colloidal Ternary Chalcogenide CuInS 2Nanocrystals. Chem. Mater. 2008, 20, 6434–6443. [Google Scholar] [CrossRef]
  4. Uehara, M.; Watanabe, K.; Tajiri, Y.; Nakamura, H.; Maeda, H. Synthesis of CuInS2 Fluorescent Nanocrystals and Enhancement of Fluorescence by Controlling Crystal Defect. J. Chem. Phys. 2008, 129, 134709. [Google Scholar] [CrossRef]
  5. Nose, K.; Omata, T.; Otsuka-Yao-Matsuo, S. Colloidal Synthesis of Ternary Copper Indium Diselenide Quantum Dots and Their Optical Properties. J. Phys. Chem. C 2009, 113, 3455–3460. [Google Scholar] [CrossRef]
  6. Korepanov, O.A.; Mazing, D.S.; Aleksandrova, O.A.; Moshnikov, V.A. Synthesis and Study of Colloidal Nanocrystals Based on Ternary Chalcogenides for Active Media of Heavy Metal Ions Sensors. In Proceedings of the 2019 IEEE Conference of Russian Young Researchers in Electrical and Electronic Engineering (EIConRus), Saint Petersburg and Moscow, Russia, 28–31 January 2019; pp. 771–773. [Google Scholar]
  7. Chen, B.; Zhong, H.; Zhang, W.; Tan, Z.; Li, Y.; Yu, C.; Zhai, T.; Bando, Y.; Yang, S.; Zou, B. Highly Emissive and Color-Tunable CuInS2-Based Colloidal Semiconductor Nanocrystals: Off-Stoichiometry Effects and Improved Electroluminescence Performance. Adv. Funct. Mater. 2012, 22, 2081–2088. [Google Scholar] [CrossRef]
  8. Aldakov, D.; Lefrançois, A.; Reiss, P. Ternary and Quaternary Metal Chalcogenide Nanocrystals: Synthesis, Properties and Applications. J. Mater. Chem. C 2013, 1, 3756. [Google Scholar] [CrossRef]
  9. Korepanov, O.A.; Mazing, D.S.; Aleksandrova, O.A.; Moshnikov, V.A.; Komolov, A.S.; Lazneva, E.F.; Kirilenko, D.A. Formation of AgInS2/ZnS Colloidal Nanocrystals and Their Photoluminescence Properties. Phys. Solid State 2019, 61, 2325–2328. [Google Scholar] [CrossRef]
  10. Jain, S.; Bharti, S.; Bhullar, G.K.; Tripathi, S.K. I-III-VI Core/Shell QDs: Synthesis, Characterizations and Applications. J. Lumin. 2020, 219, 116912. [Google Scholar] [CrossRef]
  11. Moodelly, D.; Kowalik, P.; Bujak, P.; Pron, A.; Reiss, P. Synthesis, Photophysical Properties and Surface Chemistry of Chalcopyrite-Type Semiconductor Nanocrystals. J. Mater. Chem. C 2019, 7, 11665–11709. [Google Scholar] [CrossRef]
  12. García de Arquer, F.P.; Armin, A.; Meredith, P.; Sargent, E.H. Solution-Processed Semiconductors for next-Generation Photodetectors. Nat. Rev. Mater. 2017, 2, 16100. [Google Scholar] [CrossRef]
  13. Kagan, C.R.; Lifshitz, E.; Sargent, E.H.; Talapin, D.V. Building Devices from Colloidal Quantum Dots. Science 2016, 353, aac5523. [Google Scholar] [CrossRef] [PubMed]
  14. Choi, M.K.; Yang, J.; Hyeon, T.; Kim, D.-H. Flexible Quantum Dot Light-Emitting Diodes for next-Generation Displays. npj Flex. Electron. 2018, 2, 10. [Google Scholar] [CrossRef]
  15. Xu, J.; Voznyy, O.; Liu, M.; Kirmani, A.R.; Walters, G.; Munir, R.; Abdelsamie, M.; Proppe, A.H.; Sarkar, A.; García de Arquer, F.P.; et al. 2D Matrix Engineering for Homogeneous Quantum Dot Coupling in Photovoltaic Solids. Nat. Nanotechnol. 2018, 13, 456–462. [Google Scholar] [CrossRef]
  16. Zhang, H.; Fang, W.; Wang, W.; Qian, N.; Ji, X. Highly Efficient Zn–Cu–In–Se Quantum Dot-Sensitized Solar Cells through Surface Capping with Ascorbic Acid. ACS Appl. Mater. Interfaces 2019, 11, 6927–6936. [Google Scholar] [CrossRef]
  17. Pelaz, B.; Alexiou, C.; Alvarez-Puebla, R.A.; Alves, F.; Andrews, A.M.; Ashraf, S.; Balogh, L.P.; Ballerini, L.; Bestetti, A.; Brendel, C.; et al. Diverse Applications of Nanomedicine. ACS Nano 2017, 11, 2313–2381. [Google Scholar] [CrossRef]
  18. Matea, C.; Mocan, T.; Tabaran, F.; Pop, T.; Mosteanu, O.; Puia, C.; Iancu, C.; Mocan, L. Quantum Dots in Imaging, Drug Delivery and Sensor Applications. Int. J. Nanomed. 2017, 12, 5421–5431. [Google Scholar] [CrossRef]
  19. Girma, W.M.; Fahmi, M.Z.; Permadi, A.; Abate, M.A.; Chang, J.-Y. Synthetic Strategies and Biomedical Applications of I–III–VI Ternary Quantum Dots. J. Mater. Chem. B 2017, 5, 6193–6216. [Google Scholar] [CrossRef]
  20. Zrazhevskiy, P.; Gao, X. Quantum Dot Imaging Platform for Single-Cell Molecular Profiling. Nat. Commun. 2013, 4, 1619. [Google Scholar] [CrossRef]
  21. Benninger, R.K.P.; Piston, D.W. Two-Photon Excitation Microscopy for the Study of Living Cells and Tissues. Curr. Protoc. Cell Biol. 2013, 59, 4–11. [Google Scholar] [CrossRef]
  22. Xu, H.; Xu, J.; Wang, X.; Wu, D.; Chen, Z.G.; Wang, A.Y. Quantum Dot-Based, Quantitative, and Multiplexed Assay for Tissue Staining. ACS Appl. Mater. Interfaces 2013, 5, 2901–2907. [Google Scholar] [CrossRef] [PubMed]
  23. Wu, X.; Liu, H.; Liu, J.; Haley, K.N.; Treadway, J.A.; Larson, J.P.; Ge, N.; Peale, F.; Bruchez, M.P. Immunofluorescent Labeling of Cancer Marker Her2 and Other Cellular Targets with Semiconductor Quantum Dots. Nat. Biotechnol. 2003, 21, 41–46. [Google Scholar] [CrossRef]
  24. Korepanov, O.; Aleksandrova, O.; Firsov, D.; Kalazhokov, Z.; Kirilenko, D.; Kozodaev, D.; Matveev, V.; Mazing, D.; Moshnikov, V. Polyvinylpyrrolidone as a Stabilizer in Synthesis of AgInS2 Quantum Dots. Nanomaterials 2022, 12, 2357. [Google Scholar] [CrossRef]
  25. Franco, P.; De Marco, I. The Use of Poly(N-Vinyl Pyrrolidone) in the Delivery of Drugs: A Review. Polymers 2020, 12, 1114. [Google Scholar] [CrossRef]
  26. Teodorescu, M.; Bercea, M. Poly(Vinylpyrrolidone)—A Versatile Polymer for Biomedical and Beyond Medical Applications. Polym.-Plast. Technol. Eng. 2015, 54, 923–943. [Google Scholar] [CrossRef]
  27. Xian, J.; Hua, Q.; Jiang, Z.; Ma, Y.; Huang, W. Size-Dependent Interaction of the Poly(N-Vinyl-2-Pyrrolidone) Capping Ligand with Pd Nanocrystals. Langmuir 2012, 28, 6736–6741. [Google Scholar] [CrossRef]
  28. Mdluli, P.S.; Sosibo, N.M.; Revaprasadu, N.; Karamanis, P.; Leszczynski, J. Surface Enhanced Raman Spectroscopy (SERS) and Density Functional Theory (DFT) Study for Understanding the Regioselective Adsorption of Pyrrolidinone on the Surface of Silver and Gold Colloids. J. Mol. Struct. 2009, 935, 32–38. [Google Scholar] [CrossRef]
  29. Neese, F. The ORCA Program System. WIREs Comput. Mol. Sci. 2012, 2, 73–78. [Google Scholar] [CrossRef]
  30. Bursch, M.; Mewes, J.; Hansen, A.; Grimme, S. Best-Practice DFT Protocols for Basic Molecular Computational Chemistry. Angew. Chem. Int. Ed. 2022, 61, e202205735. [Google Scholar] [CrossRef]
  31. Neese, F.; Wennmohs, F.; Hansen, A.; Becker, U. Efficient, Approximate and Parallel Hartree–Fock and Hybrid DFT Calculations. A ‘Chain-of-Spheres’ Algorithm for the Hartree–Fock Exchange. Chem. Phys. 2009, 356, 98–109. [Google Scholar] [CrossRef]
  32. Lemeshko, P.; Korepanov, O.; Podkovyrina, E.; Spivak, Y.; Moshnikov, V.; Kozodaev, D. Porous Silicon Photoluminescence Enhancement by Silver Dendrites Registered with Multiphoton Microscopy. Opt. Laser Technol. 2025, 181, 111825. [Google Scholar] [CrossRef]
  33. Katerski, A.; Danilson, M.; Mere, A.; Krunks, M. Effect of the Growth Temperature on Chemical Composition of Spray-Deposited CuInS2 Thin Films. Energy Procedia 2010, 2, 103–107. [Google Scholar] [CrossRef]
  34. Yarema, O.; Yarema, M.; Bozyigit, D.; Lin, W.M.M.; Wood, V. Independent Composition and Size Control for Highly Luminescent Indium-Rich Silver Indium Selenide Nanocrystals. ACS Nano 2015, 9, 11134–11142. [Google Scholar] [CrossRef]
  35. Seoudi, R.; Fouda, A.A.; Elmenshawy, D.A. Synthesis, Characterization and Vibrational Spectroscopic Studies of Different Particle Size of Gold Nanoparticle Capped with Polyvinylpyrrolidone. Phys. B Condens. Matter 2010, 405, 906–911. [Google Scholar] [CrossRef]
  36. Wang, H.; Qiao, X.; Chen, J.; Wang, X.; Ding, S. Mechanisms of PVP in the Preparation of Silver Nanoparticles. Mater. Chem. Phys. 2005, 94, 449–453. [Google Scholar] [CrossRef]
  37. Snee, P.T. DFT Calculations of InP Quantum Dots: Model Chemistries, Surface Passivation, and Open-Shell Singlet Ground States. J. Phys. Chem. C 2021, 125, 11765–11772. [Google Scholar] [CrossRef]
  38. Butera, V. Density Functional Theory Methods Applied to Homogeneous and Heterogeneous Catalysis: A Short Review and a Practical User Guide. Phys. Chem. Chem. Phys. 2024, 26, 7950–7970. [Google Scholar] [CrossRef]
  39. Zaveri, J.; Dhanushkodi, S.R.; Fowler, M.W.; Peppley, B.A.; Taler, D.; Sobota, T.; Taler, J. Development of Deep Learning Simulation and Density Functional Theory Framework for Electrocatalyst Layers for PEM Electrolyzers. Energies 2025, 18, 1022. [Google Scholar] [CrossRef]
  40. van der Stam, W.; de Graaf, M.; Gudjonsdottir, S.; Geuchies, J.J.; Dijkema, J.J.; Kirkwood, N.; Evers, W.H.; Longo, A.; Houtepen, A.J. Tuning and Probing the Distribution of Cu+ and Cu2+ Trap States Responsible for Broad-Band Photoluminescence in CuInS2 Nanocrystals. ACS Nano 2018, 12, 11244–11253. [Google Scholar] [CrossRef]
  41. Li, Z.; Wu, S.; Zhang, B.; Fu, L.; Zou, G. Promising Mercaptobenzoic Acid-Bridged Charge Transfer for Electrochemiluminescence from CuInS2@ZnS Nanocrystals via Internal Cu+/Cu2+ Couple Cycling. J. Phys. Chem. Lett. 2019, 10, 5408–5413. [Google Scholar] [CrossRef]
  42. Kowalik, P.; Mucha, S.G.; Matczyszyn, K.; Bujak, P.; Mazur, L.M.; Ostrowski, A.; Kmita, A.; Gajewska, M.; Pron, A. Heterogeneity Induced Dual Luminescence Properties of AgInS2 and AgInS2–ZnS Alloyed Nanocrystals. Inorg. Chem. Front. 2021, 8, 3450–3462. [Google Scholar] [CrossRef]
  43. Arshad, A.; Akram, R.; Iqbal, S.; Batool, F.; Iqbal, B.; Khalid, B.; Khan, A.U. Aqueous Synthesis of Tunable Fluorescent, Semiconductor CuInS2 Quantum Dots for Bioimaging. Arab. J. Chem. 2019, 12, 4840–4847. [Google Scholar] [CrossRef]
  44. Fuhr, A.S.; Yun, H.J.; Makarov, N.S.; Li, H.; McDaniel, H.; Klimov, V.I. Light Emission Mechanisms in CuInS2 Quantum Dots Evaluated by Spectral Electrochemistry. ACS Photonics 2017, 4, 2425–2435. [Google Scholar] [CrossRef]
  45. Zhang, S.B.; Wei, S.-H.; Zunger, A.; Katayama-Yoshida, H. Defect Physics of the CuInSe 2 Chalcopyrite Semiconductor. Phys. Rev. B 1998, 57, 9642–9656. [Google Scholar] [CrossRef]
  46. Zang, H.; Li, H.; Makarov, N.S.; Velizhanin, K.A.; Wu, K.; Park, Y.-S.; Klimov, V.I. Thick-Shell CuInS2/ZnS Quantum Dots with Suppressed ″Blinking″ and Narrow Single-Particle Emission Line Widths. Nano Lett. 2017, 17, 1787–1795. [Google Scholar] [CrossRef]
  47. Van Der Stam, W.; Berends, A.C.; Rabouw, F.T.; Willhammar, T.; Ke, X.; Meeldijk, J.D.; Bals, S.; De Mello Donega, C. Luminescent CuInS2 Quantum Dots by Partial Cation Exchange in Cu2–xS Nanocrystals. Chem. Mater. 2015, 27, 621–628. [Google Scholar] [CrossRef]
  48. Fuhr, A.; Yun, H.J.; Crooker, S.A.; Klimov, V.I. Spectroscopic and Magneto-Optical Signatures of Cu1+ and Cu2+ Defects in Copper Indium Sulfide Quantum Dots. ACS Nano 2020, 14, 2212–2223. [Google Scholar] [CrossRef]
  49. Berends, A.C.; Rabouw, F.T.; Spoor, F.C.M.; Bladt, E.; Grozema, F.C.; Houtepen, A.J.; Siebbeles, L.D.A.; De Mello Donegá, C. Radiative and Nonradiative Recombination in CuInS 2 Nanocrystals and CuInS2-Based Core/Shell Nanocrystals. J. Phys. Chem. Lett. 2016, 7, 3503–3509. [Google Scholar] [CrossRef]
  50. Piston, D. Imaging Living Cells and Tissues by Two-Photon Excitation Microscopy. Trends Cell Biol. 1999, 9, 66–69. [Google Scholar] [CrossRef]
  51. Jaiswal, J.K.; Goldman, E.R.; Mattoussi, H.; Simon, S.M. Use of Quantum Dots for Live Cell Imaging. Nat. Methods 2004, 1, 73–78. [Google Scholar] [CrossRef]
  52. Liu, J.; Zhao, X.; Xu, H.; Wang, Z.; Dai, Z. Amino Acid-Capped Water-Soluble Near-Infrared Region CuInS2/ZnS Quantum Dots for Selective Cadmium Ion Determination and Multicolor Cell Imaging. Anal. Chem. 2019, 91, 8987–8993. [Google Scholar] [CrossRef]
  53. An, X.; Zhang, Y.; Wang, J.; Kong, D.; He, X.; Chen, L.; Zhang, Y. The Preparation of CuInS2-ZnS-Glutathione Quantum Dots and Their Application on the Sensitive Determination of Cytochrome c and Imaging of HeLa Cells. ACS Omega 2021, 6, 17501–17509. [Google Scholar] [CrossRef] [PubMed]
  54. Yang, J.; Peng, S.; Zhao, Y.; Tang, T.; Guo, J.; Cui, R.; Sun, T.; Zhang, M. Improving Three-Photon Fluorescence of Near-Infrared Quantum Dots for Deep Brain Imaging by Suppressing Biexciton Decay. Nano Lett. 2024, 24, 6706–6713. [Google Scholar] [CrossRef] [PubMed]
  55. Maestro, L.M.; Rodríguez, E.M.; Rodríguez, F.S.; La Cruz, M.C.I.; Juarranz, A.; Naccache, R.; Vetrone, F.; Jaque, D.; Capobianco, J.A.; Solé, J.G. CdSe Quantum Dots for Two-Photon Fluorescence Thermal Imaging. Nano Lett. 2010, 10, 5109–5115. [Google Scholar] [CrossRef]
  56. Wang, S.; Fan, Y.; Li, D.; Sun, C.; Lei, Z.; Lu, L.; Wang, T.; Zhang, F. Anti-Quenching NIR-II Molecular Fluorophores for in Vivo High-Contrast Imaging and pH Sensing. Nat. Commun. 2019, 10, 1058. [Google Scholar] [CrossRef]
Figure 1. (a) TEM image and (b) XRD patterns of obtained samples. In (a), several QDs are encircled in yellow.
Colloids 09 00033 g001
Figure 2. XPS spectra of PVP and PVP-capped CuInS2 QDs: survey (a), Cu 2p (b), In 3d (c), S 2p (d).
Colloids 09 00033 g002
Figure 3. FTIR spectra of PVP and PVP-capped CuInS2 QDs.
Colloids 09 00033 g003
Figure 4. Initial (1′–6′) and optimized at the B3LYP-D4/def2-TZVP level of theory (1–6) geometries of model associates PVP–CuInS2 and its total electronic energy ΔE profile. The ΔE is difference between the total electronic energies of associates PVP–CuInS2 and individual molecules PVP and CuInS2.
Colloids 09 00033 g004
Figure 5. Absorption (dash line) and PL (solid line) spectra of CuInS2 QDs.
Colloids 09 00033 g005
Figure 6. Optical microscopy images (panoramic views) (ac) of C2C12 cells after treatment with MTT for 4 h, showing the heterogeneous distribution of formazan crystals in the cytoplasm (bright blue–violet granules). Images of C2C12 cells show MTT formazan granules, nucleoli (dark blue dots in a nucleus, Golgi region (around the nucleus), and mitochondria (M). Cell viability assessed by MTT assay using PVP-capped CuInS2 QDs of different concentration (d) of PVP-capped CuInS2 QDs. Data shown are representative of 3 separate experiments and values are given as mean ± SD. Statistical analysis was performed by ANOVA analysis. *, p < 0.05 **, p < 0.01. Optical microscopy images (f,g) and multiphoton microscopy images (e,h) of CuInS2 QDs penetrated into C2C12.
Colloids 09 00033 g006
Disclaimer/Publisher’s Note: The statements, opinions and data contained in all publications are solely those of the individual author(s) and contributor(s) and not of MDPI and/or the editor(s). MDPI and/or the editor(s) disclaim responsibility for any injury to people or property resulting from any ideas, methods, instructions or products referred to in the content.

