

Formulating Graphite-Filled PU Dispersions with Extended Shelf Life Using the Capillary Suspension Concept


Abstract

1. Introduction
2. Materials and Methods
2.1. Materials
2.2. Interfacial Properties
2.3. Sample Preparation
2.4. Rheological Characterization
2.5. Electrical Characterization
2.6. Mechanical Characterization
3. Results and Discussion
3.1. Graphite Particles Suspended in a PU Dispersion
3.1.1. Effect of Octanol Below Percolation Threshold
3.1.2. Effect of Octanol Above Percolation Threshold
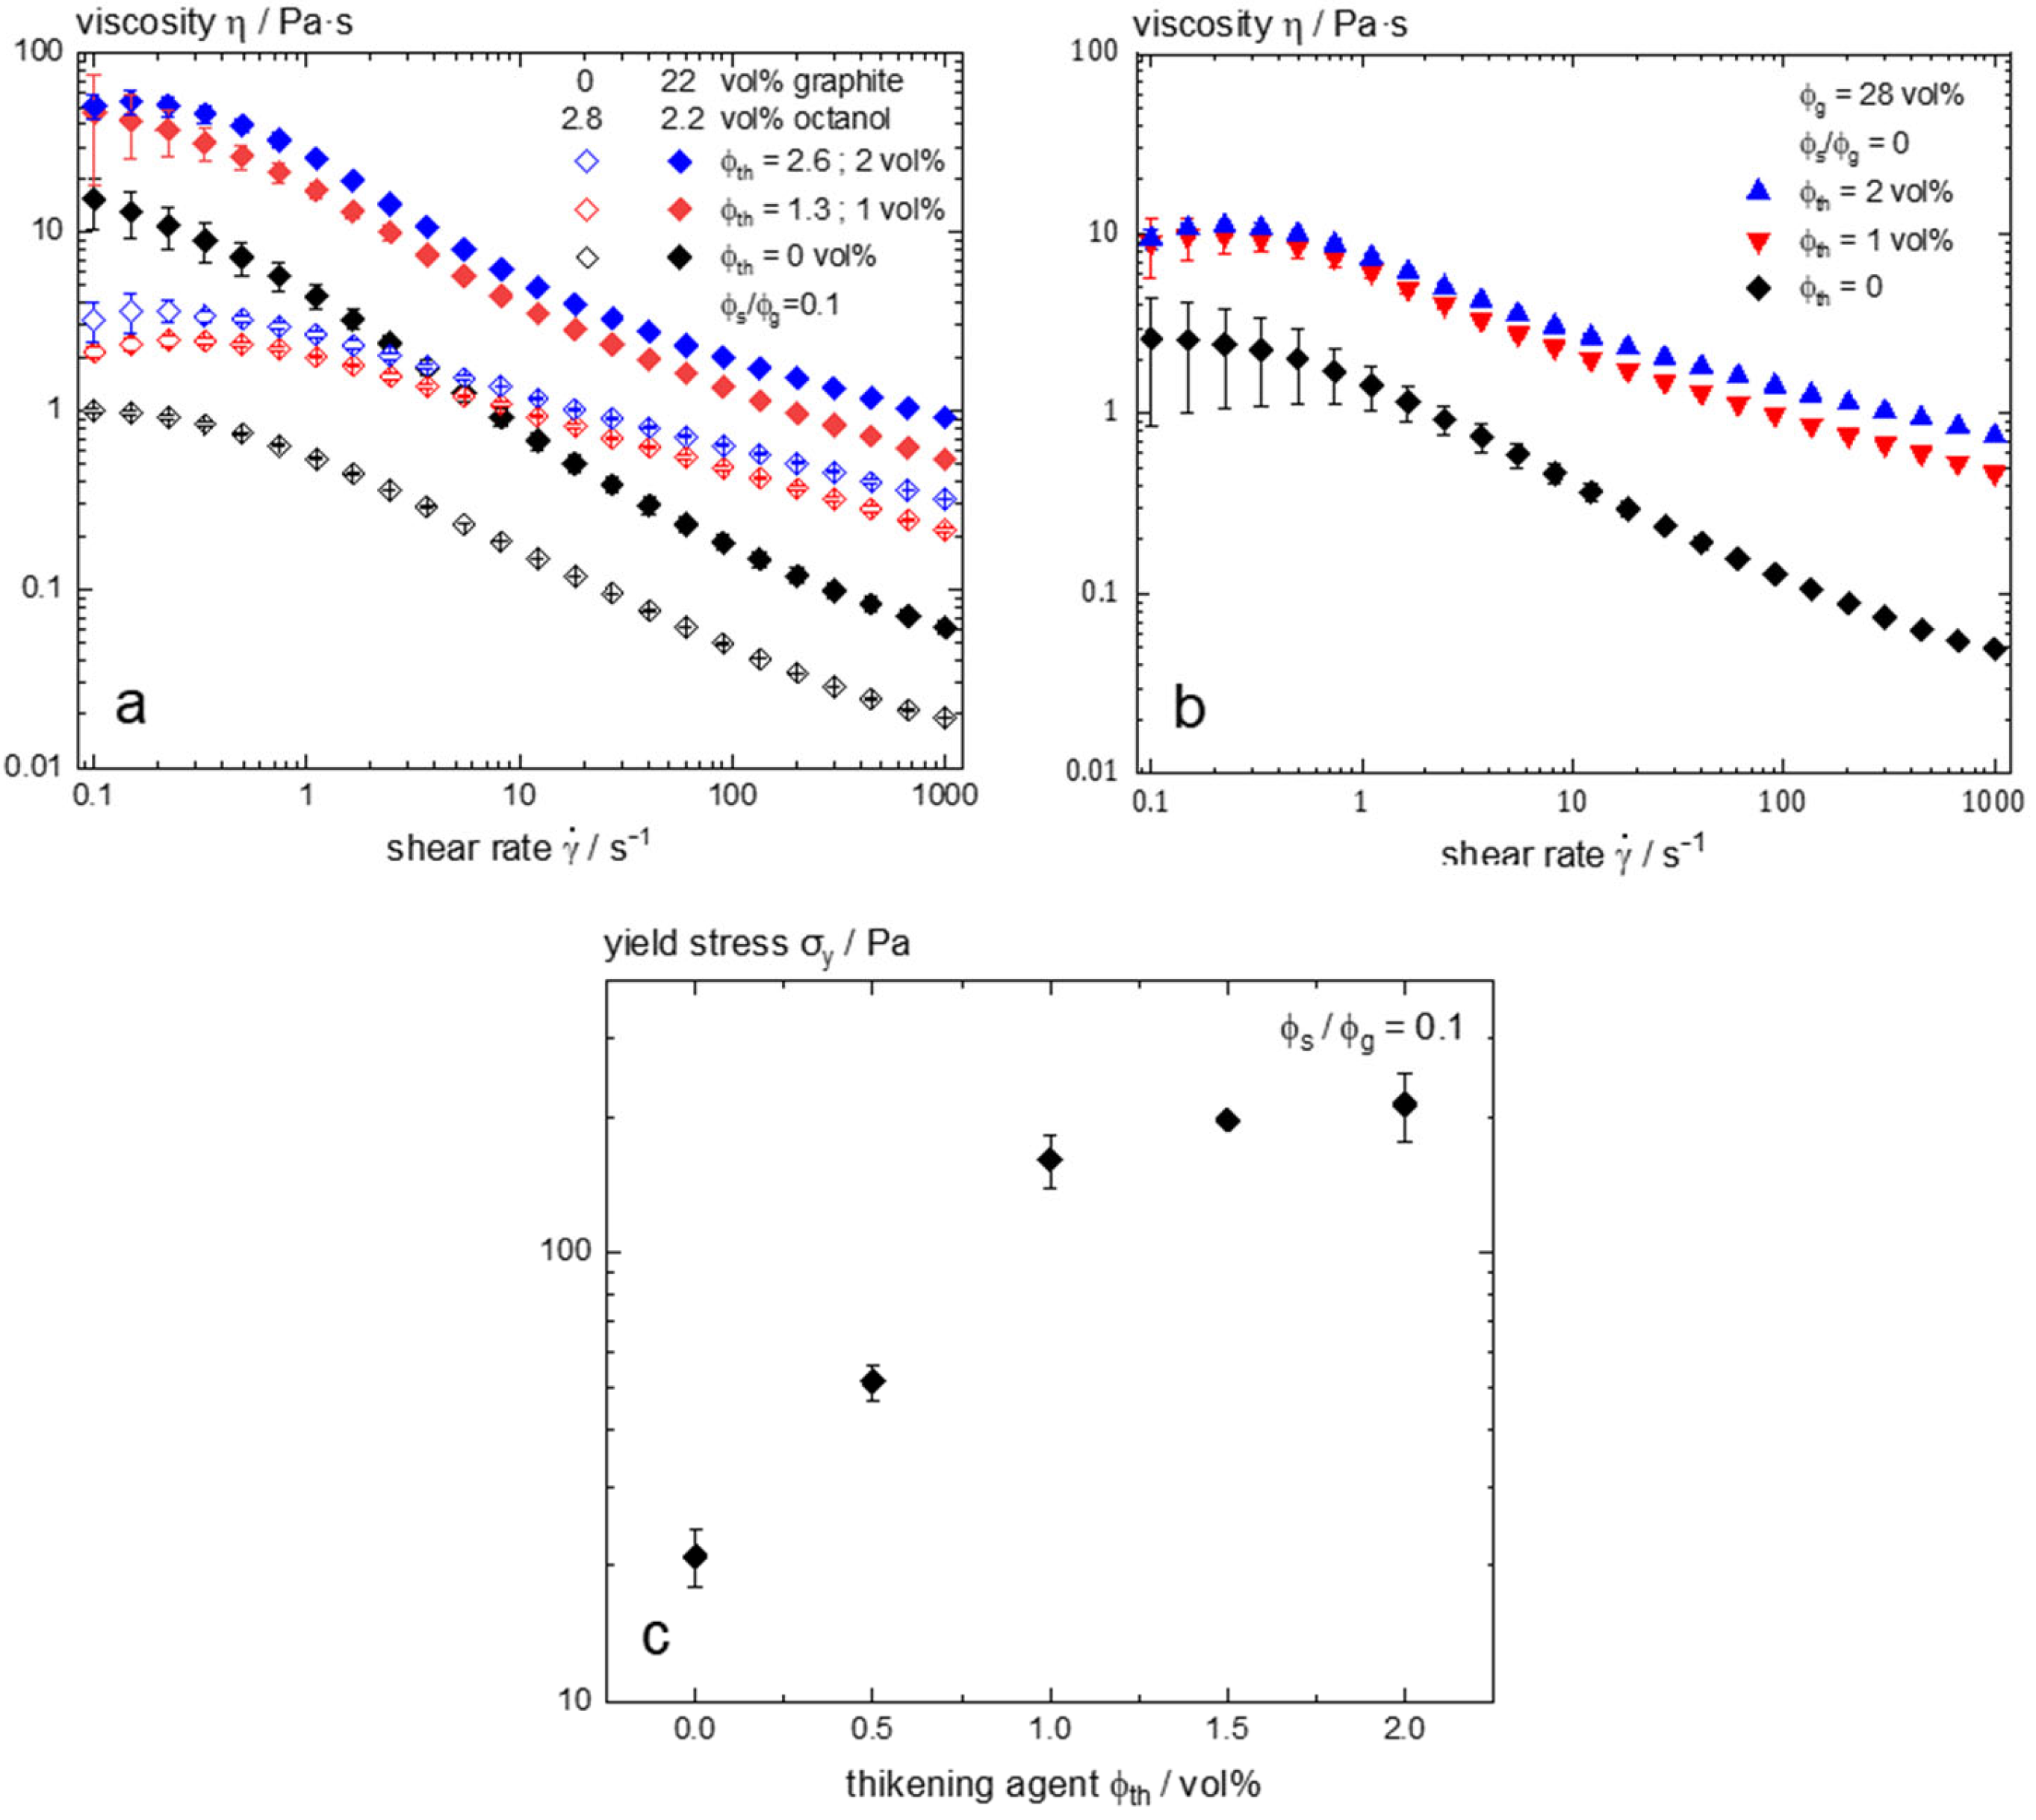
3.1.3. Effect of Hydrophobically Modified Polyether—HMPE Thickener
3.2. Graphite-Filled PU Films—Effect of Second Liquid on Film Properties
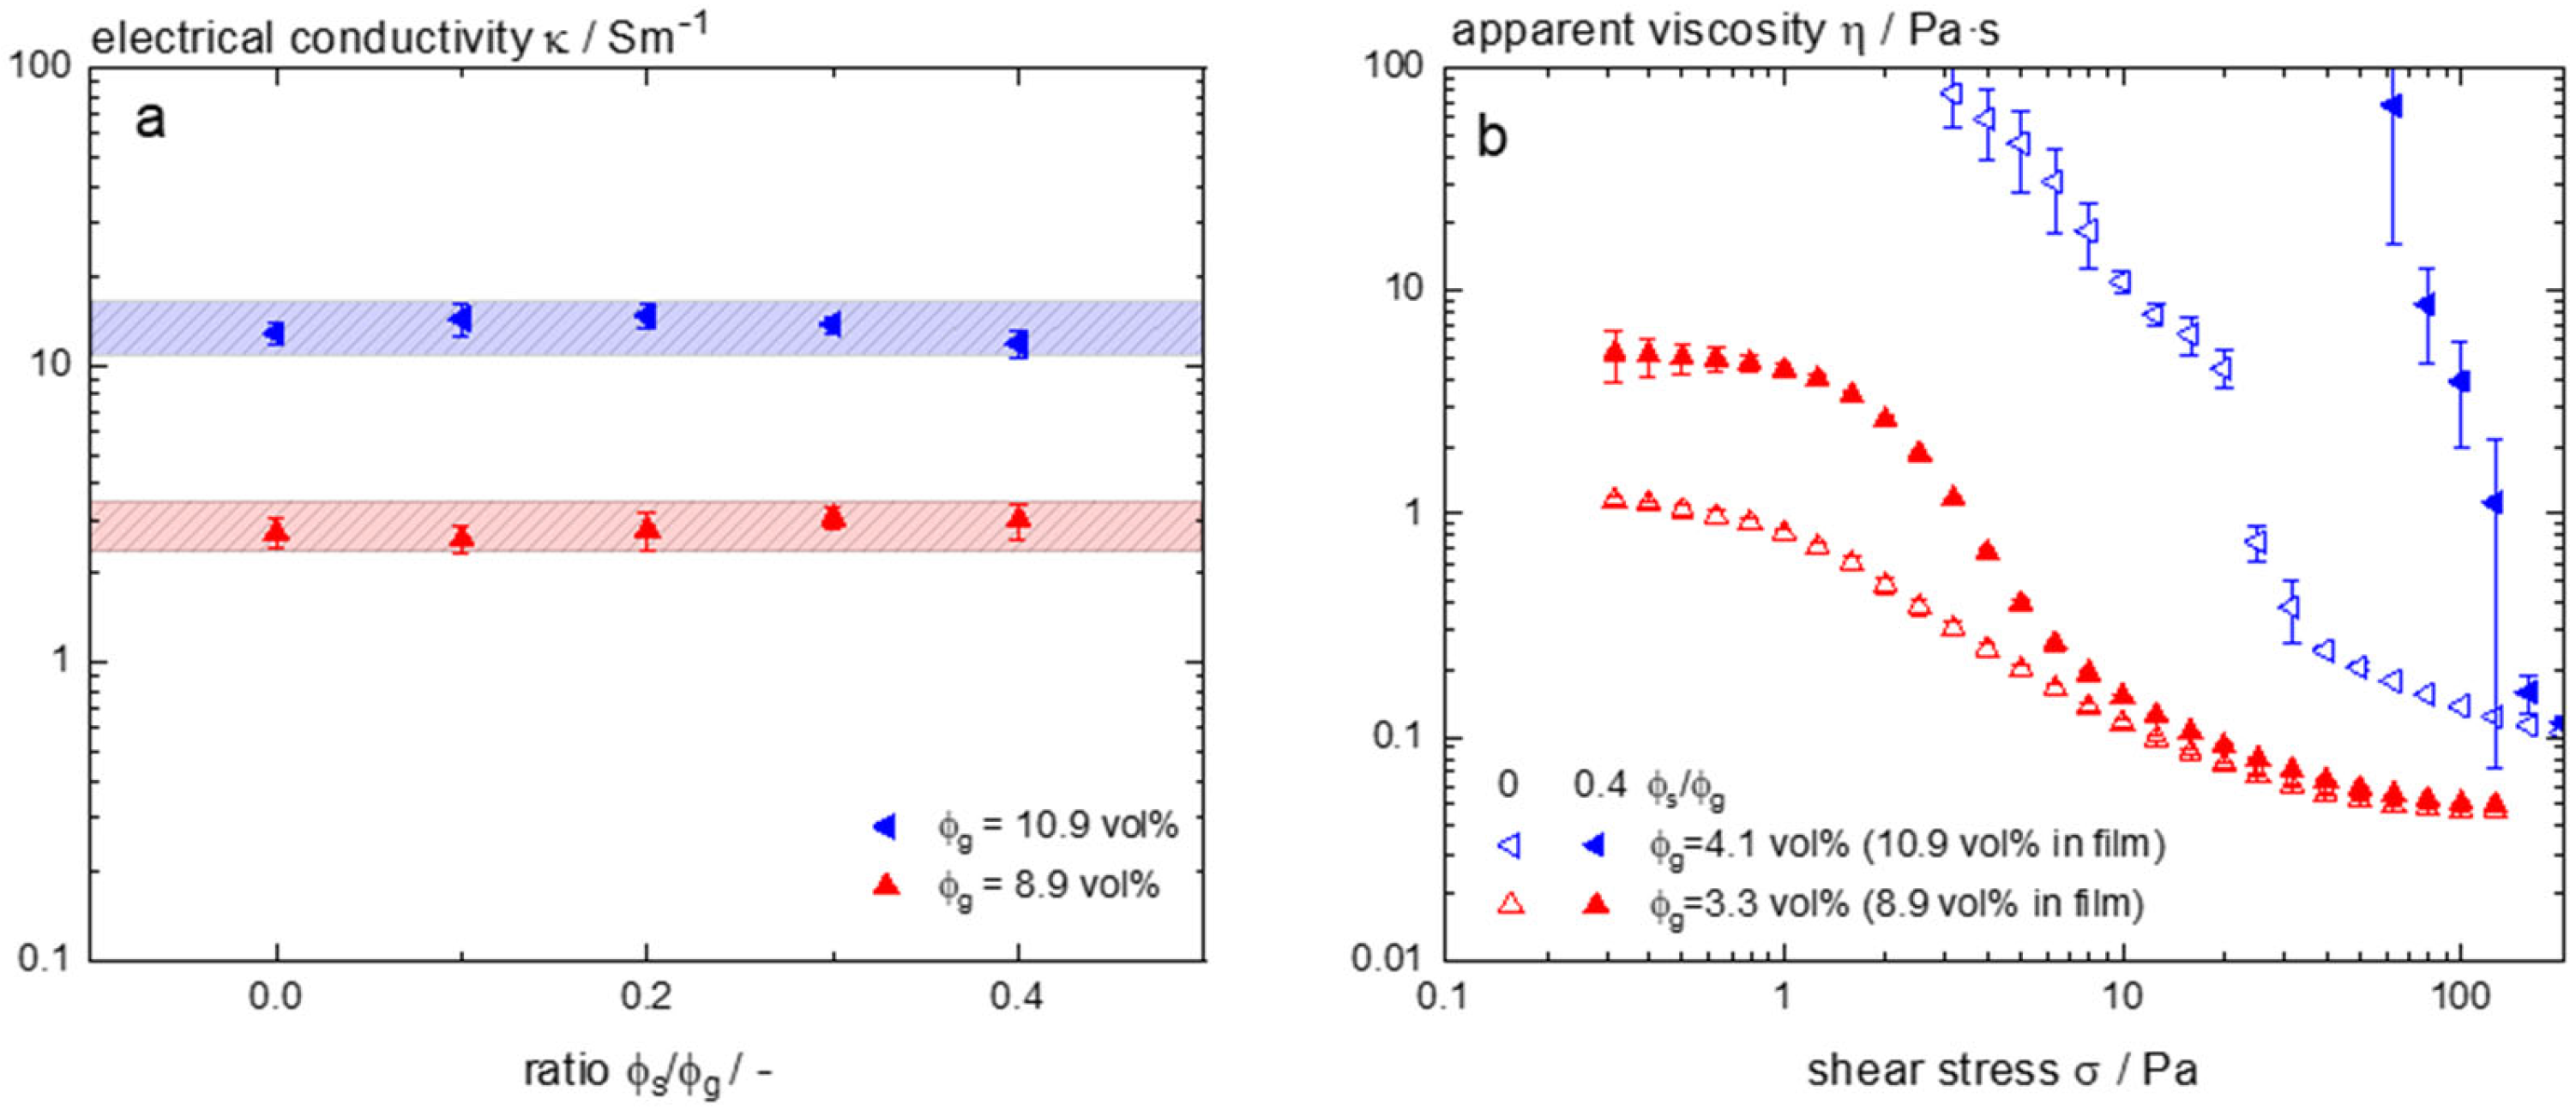
3.2.1. Electrical Conductivity
3.2.2. Mechanical Properties
4. Conclusions
Supplementary Materials
Author Contributions
Funding
Data Availability Statement
Acknowledgments
Conflicts of Interest
Abbreviations
| PU | polyurethane |
| VOC | volatile organic compounds |
| HEUR | hydrophobically modified polyurethane |
| HMPE | hydrophobically modified polyether |
| LVE | linear viscoelastic range |
References
- Kim, B.K. Aqueous polyurethane dispersions. Colloid Polym. Sci. 1996, 274, 599–611. [Google Scholar] [CrossRef]
- Tielemans, M.; Roose, P. Study of the rheology of aqueous radiation curable polyurethane dispersions modified with associative thickeners. Prog. Org. Coat. 2008, 63, 182–188. [Google Scholar] [CrossRef]
- Chinwanitcharoen, C.; Kanoh, S.; Yamada, T.; Hayashi, S.; Sugano, S. Preparation of aqueous dispersible polyurethane: Effect of acetone on the particle size and storage stability of polyurethane emulsion. J. Appl. Polym. Sci. 2004, 91, 3455–3461. [Google Scholar] [CrossRef]
- Sardon, H.; Irusta, L.; Fernández-Berridi, M.J.; Luna, J.; Lansalot, M.; Bourgeat-Lami, E. Waterborne polyurethane dispersions obtained by the acetone process: A study of colloidal features. J. Appl. Polym. Sci. 2011, 120, 2054–2062. [Google Scholar] [CrossRef]
- Nobel, M.; Picken, S.; Mendes, E. Waterborne nanocomposite resins for automotive coating applications. Prog. Org. Coat. 2007, 58, 96–104. [Google Scholar] [CrossRef]
- Pieters, K.; Mekonnen, T.H. Progress in waterborne polymer dispersions for coating applications: Commercialized systems and new trends. RSC Sustain. 2024, 2, 3704–3729. [Google Scholar] [CrossRef]
- Afridi, M.; Ohama, Y.; Demura, K.; Iqbal, M. Development of polymer films by the coalescence of polymer particles in powdered and aqueous polymer-modified mortars. Cem. Concr. Res. 2003, 33, 1715–1721. [Google Scholar] [CrossRef]
- Yang, C.; Lin, W.; Li, Z.; Zhang, R.; Wen, H.; Gao, B.; Chen, G.; Gao, P.; Yuen, M.M.F.; Wong, C.P. Water-Based Isotropically Conductive Adhesives: Towards Green and Low-Cost Flexible Electronics. Adv. Funct. Mater. 2011, 21, 4582–4588. [Google Scholar] [CrossRef]
- Urban, D.; Takamura, K. Polymer Dispersions and Their Industrial Applications; John Wiley & Sons Inc.: Weinheim, Germany, 2002. [Google Scholar] [CrossRef]
- Li, Z.; Zhang, R.; Moon, K.; Liu, Y.; Hansen, K.; Le, T.; Wong, C.P. Highly Conductive, Flexible, Polyurethane-Based Adhesives for Flexible and Printed Electronics. Adv. Funct. Mater. 2013, 23, 1459–1465. [Google Scholar] [CrossRef]
- Mehvari, S.; Goodhew, B.; González, S.; Lafdi, K.; Sanchez-Vicente, Y. Effect of processing methods on the electrical conductivity properties of silver-polyurethane composite films (Experimental and numerical studies). J. Compos. Mater. 2023, 57, 4409–4422. [Google Scholar] [CrossRef]
- Wikaramasinghe, G.C.; Manamendra, R.M.; Manuda, K.R.J.; Nissanka, B.; Weerawarne, D.L.; Jayasundara, D.R. Binder-free conductive graphite coatings on polyimide substrates for applications in flexible electronics. J. Coat. Technol. Res. 2025, 22, 825–838. [Google Scholar] [CrossRef]
- Zulfiqar, M.H.; Hassan, M.U.; Maqbool, K.Q.; Mehmood, M.Q.; Riaz, K.; Massoud, Y. Customizable Graphite-On-Paper-Based Keypads: Toward Disposable and Recyclable Wireless Human–Machine Interfaces. IEEE J. Flex. Electron. 2023, 2, 25–33. [Google Scholar] [CrossRef]
- Novák, I.; Krupa, I.; Chodák, I. Investigation of the correlation between electrical conductivity and elongation at break in polyurethane-based adhesives. Synth. Met. 2002, 131, 93–98. [Google Scholar] [CrossRef]
- Bhavsar, R.A.; Nehete, K.M. Rheological approach to select most suitable associative thickener for water-based polymer dispersions and paints. J. Coat. Technol. Res. 2019, 16, 1089–1098. [Google Scholar] [CrossRef]
- Orgilés-Calpena, E.; Arán-Aís, F.; Torró-Palau, A.M.; Orgilés-Barceló, C.; Martín-Martínez, J.M. Influence of the Chemical Structure of Urethane-Based Thickeners on the Properties of Waterborne Polyurethane Adhesives. J. Adhes. 2009, 85, 665–689. [Google Scholar] [CrossRef]
- Balmforth, N.J.; Frigaard, I.A.; Ovarlez, G. Yielding to Stress: Recent Developments in Viscoplastic Fluid Mechanics. Annu. Rev. Fluid Mech. 2014, 46, 121–146. [Google Scholar] [CrossRef]
- Beris, A.N.; Tsamopoulos, J.A.; Armstrong, R.C.; Brown, R.A. Creeping motion of a sphere through a Bingham plastic. J. Fluid Mech. 1985, 158, 219–244. [Google Scholar] [CrossRef]
- Tabuteau, H.; Coussot, P.; de Bruyn, J.R. Drag force on a sphere in steady motion through a yield-stress fluid. J. Rheol. 2007, 51, 125–137. [Google Scholar] [CrossRef]
- Koos, E.; Willenbacher, N. Capillary Forces in Suspension Rheology. Science 2011, 331, 897–900. [Google Scholar] [CrossRef]
- Velankar, S.S. A non-equilibrium state diagram for liquid/fluid/particle mixtures. Soft Matter 2015, 11, 8393–8403. [Google Scholar] [CrossRef]
- Domenech, T.; Velankar, S. Capillary-driven percolating networks in ternary blends of immiscible polymers and silica particles. Rheol. Acta 2014, 53, 593–605. [Google Scholar] [CrossRef]
- Maurath, J.; Bitsch, B.; Schwegler, Y.; Willenbacher, N. Influence of particle shape on the rheological behavior of three-phase non-brownian suspensions. Colloids Surfaces A Physicochem. Eng. Asp. 2016, 497, 316–326. [Google Scholar] [CrossRef]
- Yüce, C.; Okamoto, K.; Karpowich, L.; Adrian, A.; Willenbacher, N. Non-volatile free silver paste formulation for front-side metallization of silicon solar cells. Sol. Energy Mater. Sol. Cells 2019, 200, 110040. [Google Scholar] [CrossRef]
- Aal, K.A.; Willenbacher, N. Front side metallization of silicon solar cells—A high-speed video imaging analysis of the screen printing process. Sol. Energy Mater. Sol. Cells 2020, 217, 110721. [Google Scholar] [CrossRef]
- Roh, S.; Parekh, D.P.; Bharti, B.; Stoyanov, S.D.; Velev, O.D. 3D Printing by Multiphase Silicone/Water Capillary Inks. Adv. Mater. 2017, 29, 1701554. [Google Scholar] [CrossRef]
- Ding, H.; Barg, S.; Derby, B. Direct 3D printing of graphene using capillary suspensions. Nanoscale 2020, 12, 11440–11447. [Google Scholar] [CrossRef]
- Nider, S.; De Ceulaer, F.; Göksel, B.; Braem, A.; Koos, E. Tricalcium phosphate-based capillary suspensions as inks for 3D printing of porous scaffolds. Open Ceram. 2025, 21, 100744. [Google Scholar] [CrossRef]
- Tyowua, A.T.; Harbottle, D.; Binks, B.P. 3D printing of Pickering emulsions, Pickering foams and capillary suspensions—A review of stabilization, rheology and applications. Adv. Colloid Interface Sci. 2024, 332, 103274. [Google Scholar] [CrossRef]
- Bitsch, B.; Dittmann, J.; Schmitt, M.; Scharfer, P.; Schabel, W.; Willenbacher, N. A novel slurry concept for the fabrication of lithium-ion battery electrodes with beneficial properties. J. Power Sources 2014, 265, 81–90. [Google Scholar] [CrossRef]
- Park, J.; Ahn, K.H. Controlling Drying Stress and Mechanical Properties of Battery Electrodes Using a Capillary Force-Induced Suspension System. Ind. Eng. Chem. Res. 2021, 60, 4873–4882. [Google Scholar] [CrossRef]
- Feichtinger, A.; Jarray, A.; Bouwman, W.G.; Duif, C.P.; Valverde-Ayllon, M.C.; Heerkens, K.; Rooijakkers, R.; Landman, J.; Scholten, E. Biopolymer-based capillary suspensions: Influence of particle properties on network formation. Food Hydrocoll. 2025, 163, 111061. [Google Scholar] [CrossRef]
- Han, C.; Wang, G.; Feng, G.; Wang, J.; Guo, J.; Yang, X. Capillary force-driven formation of native starch granule oleogels for 3D printing. Food Hydrocoll. 2023, 150, 109725. [Google Scholar] [CrossRef]
- Menne, D.; da Silva, L.L.; Rotan, M.; Glaum, J.; Hinterstein, M.; Willenbacher, N. Giant Functional Properties in Porous Electroceramics through Additive Manufacturing of Capillary Suspensions. ACS Appl. Mater. Interfaces 2022, 14, 3027–3037. [Google Scholar] [CrossRef] [PubMed]
- Tedjokusuma, K.; Lauth, W.; Willenbacher, N. Manufacture and filtration performance of glass filters made from capillary suspensions. Sep. Purif. Technol. 2024, 329, 125097. [Google Scholar] [CrossRef]
- Sun, H.; Zhang, X.; Yuen, M.M. Enhanced conductivity induced by attractive capillary force in ternary conductive adhesive. Compos. Sci. Technol. 2016, 137, 109–117. [Google Scholar] [CrossRef]
- Zhang, Y.; Allen, M.C.; Zhao, R.; Deheyn, D.D.; Behrens, S.H.; Meredith, J.C. Capillary Foams: Stabilization and Functionalization of Porous Liquids and Solids. Langmuir 2015, 31, 2669–2676. [Google Scholar] [CrossRef]
- Mezger, T.G. Das Rheologie-Handbuch: Für Anwender von Rotations- und Oszillations-Rheometern, 3rd ed.; Vincentz Network: Hannover, Germany, 2010; ISBN 978-3-86630-863-3. [Google Scholar]
- Brenner, H. Rheology of a dilute suspension of axisymmetric Brownian particles. Int. J. Multiph. Flow 1974, 1, 195–341. [Google Scholar] [CrossRef]
- Winter, H.H.; Mours, M. Rheology of Polymers Near Liquid-Solid Transitions. In Neutron Spin Echo Spectroscopy Viscoelasticity Rheology; Springer: Berlin/Heidelberg, Germany, 1997; pp. 165–234. [Google Scholar] [CrossRef]
- Koos, E. Capillary suspensions: Particle networks formed through the capillary force. Curr. Opin. Colloid Interface Sci. 2014, 19, 575–584. [Google Scholar] [CrossRef]
- Koos, E.; Johannsmeier, J.; Schwebler, L.; Willenbacher, N. Tuning suspension rheology using capillary forces. Soft Matter 2012, 8, 6620–6628. [Google Scholar] [CrossRef]
- Emady, H.; Caggioni, M.; Spicer, P. Colloidal microstructure effects on particle sedimentation in yield stress fluids. J. Rheol. 2013, 57, 1761–1772. [Google Scholar] [CrossRef]
- Luo, Y.; Le Fer, G.; Dean, D.; Becker, M.L. 3D Printing of Poly(propylene fumarate) Oligomers: Evaluation of Resin Viscosity, Printing Characteristics and Mechanical Properties. Biomacromolecules 2019, 20, 1699–1708. [Google Scholar] [CrossRef] [PubMed]
- Teng, W.D.; Edirisinghe, M.J.; Evans, J.R.G. Optimization of Dispersion and Viscosity of a Ceramic Jet Printing Ink. J. Am. Ceram. Soc. 1997, 80, 486–494. [Google Scholar] [CrossRef]
- Cisneros-Zevallos, L.; Krochta, J. Dependence of Coating Thickness on Viscosity of Coating Solution Applied to Fruits and Vegetables by Dipping Method. J. Food Sci. 2003, 68, 503–510. [Google Scholar] [CrossRef]
- Bitsch, B.; Braunschweig, B.; Willenbacher, N. Interaction between Polymeric Additives and Secondary Fluids in Capillary Suspensions. Langmuir 2016, 32, 1440–1449. [Google Scholar] [CrossRef]
- BASF SE. Formulation Challenges and Product Recommendations. Available online: https://www.basf.com/dam/jcr:fa3b3f34-94a5-3340-a992-680219cd5c90/basf/www/global/segments/industrial-solution/BASF%20Rheology%20Modifiers%20Product%20Recomendation(AP).pdf (accessed on 13 February 2025).
- Sun, H.; Han, Z.; Willenbacher, N. Ultrastretchable Conductive Elastomers with a Low Percolation Threshold for Printed Soft Electronics. ACS Appl. Mater. Interfaces 2019, 11, 38092–38102. [Google Scholar] [CrossRef]
- Zou, J.; Yu, Z.; Pan, Y.; Fang, X.; Ou, Y. Conductive mechanism of polymer/graphite conducting composites with low percolation threshold. J. Polym. Sci. Part B Polym. Phys. 2002, 40, 954–963. [Google Scholar] [CrossRef]
- Eichner, E.; Heinrich, S.; Schneider, G. Influence of particle shape and size on mechanical properties in copper-polymer composites. Powder Technol. 2018, 339, 39–45. [Google Scholar] [CrossRef]

| Spherical | Flakes | |
|---|---|---|
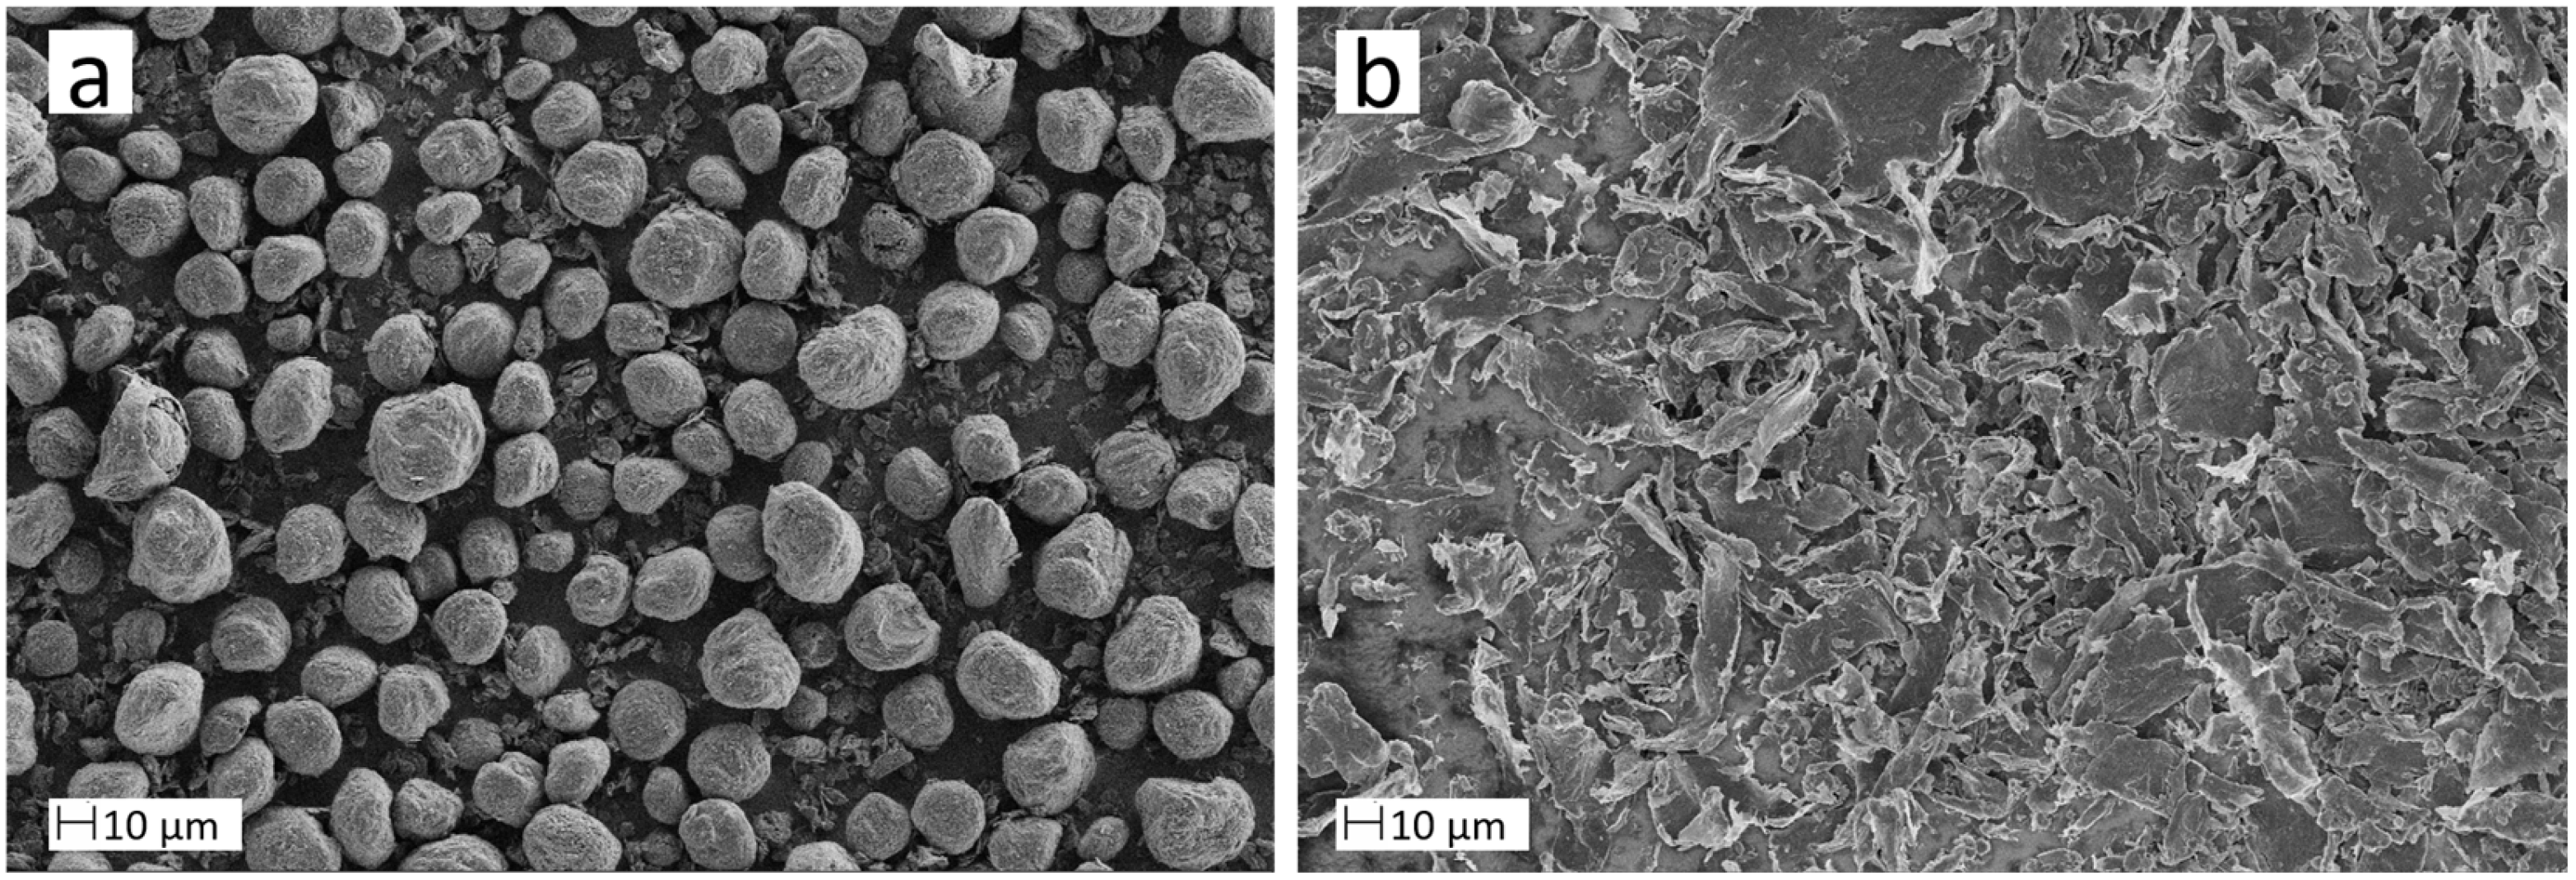
| x10,3/µm | 5.3 | 5.1 |
| x50,3/µm | 21.1 | 20 |
| x90,3/µm | 30.2 | 56.3 |
| ρ/g/cm3 | 2.22 ± 0.01 | 2.27 ± 0.07 |
| Young’s Modulus [N/mm2] | Tensile Strength [N/mm2] | |||||
|---|---|---|---|---|---|---|
| ratio φs/φg | 0 | 0.1 | 0.2 | 0 | 0.1 | 0.2 |
| spherical, 54 vol% graphite | 270 ± 52 | 270 ± 45 | 352 ± 9 | 5.1 ± 0.3 | 6.5 ± 1 | 5.8 ± 1.4 |
| flakes, 11.9 vol% graphite | 280 ± 36 | 245 ± 18 | 330 ± 24 | 10.3 ± 0.4 | 9.8 ± 0.5 | 9.4 ± 0.3 |
Disclaimer/Publisher’s Note: The statements, opinions and data contained in all publications are solely those of the individual author(s) and contributor(s) and not of MDPI and/or the editor(s). MDPI and/or the editor(s) disclaim responsibility for any injury to people or property resulting from any ideas, methods, instructions or products referred to in the content. |
© 2025 by the authors. Licensee MDPI, Basel, Switzerland. This article is an open access article distributed under the terms and conditions of the Creative Commons Attribution (CC BY) license (https://creativecommons.org/licenses/by/4.0/).
Share and Cite
Dyhr, K.; Willenbacher, N. Formulating Graphite-Filled PU Dispersions with Extended Shelf Life Using the Capillary Suspension Concept. Colloids Interfaces 2025, 9, 26. https://doi.org/10.3390/colloids9030026
Dyhr K, Willenbacher N. Formulating Graphite-Filled PU Dispersions with Extended Shelf Life Using the Capillary Suspension Concept. Colloids and Interfaces. 2025; 9(3):26. https://doi.org/10.3390/colloids9030026
Chicago/Turabian StyleDyhr, Katrin, and Norbert Willenbacher. 2025. "Formulating Graphite-Filled PU Dispersions with Extended Shelf Life Using the Capillary Suspension Concept" Colloids and Interfaces 9, no. 3: 26. https://doi.org/10.3390/colloids9030026
APA StyleDyhr, K., & Willenbacher, N. (2025). Formulating Graphite-Filled PU Dispersions with Extended Shelf Life Using the Capillary Suspension Concept. Colloids and Interfaces, 9(3), 26. https://doi.org/10.3390/colloids9030026