Article

An Investigation of the Effect of pH on Micelle Formation by a Glutamic Acid-Based Biosurfactant

1
Department of Chemistry, Carthage College, 2001 Alford Park Drive, Kenosha, WI 53140, USA
2
Department of Physical and Environmental Sciences, Texas A&M University-Corpus Christi, 6300 Ocean Drive, Corpus Christi, TX 78412, USA
3
Department of Biochemistry and Molecular Biology, Howard University College of Medicine, 520 W Street NW, Washington, DC 20059, USA
*
Author to whom correspondence should be addressed.
Colloids Interfaces 2024, 8(3), 38; https://doi.org/10.3390/colloids8030038
Submission received: 10 May 2024 / Revised: 31 May 2024 / Accepted: 6 June 2024 / Published: 11 June 2024

Abstract

:
NMR spectroscopy, molecular modeling, and conductivity experiments were used to investigate micelle formation by the amino acid-based surfactant tridecanoic L-glutamic acid. Amino acid-based biosurfactants are green alternatives to surfactants derived from petroleum. NMR titrations were used to measure the monomeric surfactant’s primary and gamma (γ) carboxylic acid pKa values. Intramolecular hydrogen bonding within the surfactant’s headgroup caused the primary carboxylic acid to be less acidic than the corresponding functional group in free L-glutamic acid. Likewise, intermolecular hydrogen bonding caused the micellar surfactant’s γ carboxylic functional group to be less acidic than the corresponding monomer value. The binding of four positive counterions to the anionic micelles was also investigated. At pH levels below 7.0 when the surfactant headgroup charge was −1, the micelle hydrodynamic radii were larger (~30 Å) and the mole fraction of micelle-bound counterions was in the 0.4–0.7 range. In the pH range of 7.0–10.5, the micelle radii decreased with increasing pH and the mole fraction of micelle bound counterions increased. These observations were attributed to changes in the surfactant headgroup charge with pH. Above pH 10.5, the counterions deprotonated and the mole fraction of micelle-bound counterions decreased further. Finally, critical micelle concentration measurements showed that the micelles formed at lower concentrations at pH 6 when the headgroup charge was predominately −1 and at higher concentrations at pH 7 where headgroups had a mixture of −1 and −2 charges in solution.

Graphical Abstract

1. Introduction

Surfactants are amphiphilic molecules that reduce the interfacial tension between liquids and thus facilitate the mixing of oil and aqueous phases. Surfactant formulations are used throughout the food, detergent, cosmetic, and agricultural industries [1,2]. Surfactants are also used pharmaceutically in drug delivery and for secondary oil recovery in petroleum production [3,4,5,6,7]. Above a critical concentration, surfactant monomers self-aggregate into supramolecular structures. One example is a micelle, which contains a hydrophobic core and a charged or hydrophilic surface. In detergency and other applications, the micelle core solubilizes hydrophobic substances like oils or poorly soluble drugs, allowing them to be dispersed in aqueous solution. Many surfactants are also charged, so oppositely charged counterions are associated with the micelle surface [2]. Understanding how surfactant and counterion structure, concentration, and pH affect micelle formation is necessary to design optimal surfactant-based formulations [8].
Commercial surfactants are often derived from non-renewable sources like petrochemical feedstocks. It is necessary though to transition to a more sustainable approach where surfactants are synthesized from renewable building blocks, biomass, or microorganisms. This transition will reduce both petrochemical consumption and the carbon footprint of surfactant production [1,2,9]. In addition, green or bio-based surfactants are often suitable alternatives to synthetic surfactants, while at the same time being more biocompatible, biodegradable, and less toxic than their synthetic counterparts [9,10]. Examples of bio-based surfactants include molecules where a hydrophilic sugar, polysaccharide, amino acid, or peptide headgroup is bound to one or more hydrocarbon chains. Examples of sugar-based surfactants include sorbitan esters, sucrose esters, and alkyl polyglucosides [1,2,9]. The relationship between sugar headgroup structure and the surfactants’ physiochemical properties has been reviewed by Gaudin, et al. [11].
Other bio-based surfactants contain amino acid building blocks. For example, in linear amino acid-based surfactants, a single hydrocarbon chain is connected to an amino acid or peptide headgroup through an amide or other linkage. The linear amino acid-based surfactant tridecanoic-Glutamic acid (tridecanoic-Glu) was investigated here. In gemini surfactants, two amino acids are connected by a spacer and each amino acid is in turn connected to a hydrocarbon chain. In contrast, in amino acid-based glycerolipid surfactants, the amino acid headgroup and hydrocarbon chain are both attached to a glyceride, polyglyceride, or phospholipid skeleton [2]. Along with their applications as detergents, amino acid-based surfactants are also used for drug delivery and as both antimicrobial and antiviral agents [3,11]. They also have high biodegradability and low toxicity. Advances in the synthesis, characterization, and applications of amino acid-based surfactants have been reviewed by Tripathy, et al. [12] and Guo, et al. [13].
The physical properties of linear amino acid-based surfactants are determined by the length of the hydrocarbon chain and the amino acid or peptide making up the hydrophilic headgroup. In general, longer alkyl chains lead to more hydrophobic surfactants with lower critical micelle concentrations (CMC) [12,13]. For example, Bustelo, et al. investigated the aggregation of histidine-containing linear amino acid-based surfactants. In this study, the CMCs of surfactants containing ten, twelve, fourteen, and sixteen carbon atoms were 15.5, 6.2, 1.5, and 0.4 mM, respectively [14]. There are also twenty natural amino acids that can comprise a linear amino acid-based surfactant’s headgroup. These are generally classified as polar, non-polar, acidic, or basic based on the makeup of the amino acid side chain. The work presented here is part of a long-term effort to investigate the physical properties of amino acid-based surfactants containing different alkyl chain lengths and amino acid headgroups. The goal of this effort is to identify the fundamental factors responsible for the self-assembly, structure, and function of micelles and other supramolecular structures formed by these compounds. To date, work has focused on surfactants containing non-polar amino acids like L-Leucine, L-Phenylalanine, and L-Isoleucine [15,16,17]. In this study, however, a linear amino acid-based surfactant containing the acidic amino acid Glutamic acid was investigated. This surfactant was chosen to illustrate how the hydrophilicity and charge of the amino acid headgroup affect the surfactant’s aggregation into micelles.
The structure of the tridecanoic-Glu surfactant investigated here is shown in Figure 1a. The molecule has a thirteen-carbon alkyl chain connected to a Glutamic acid headgroup through an amide bond. Studies of other, similar Glutamic acid-based surfactants have been reported. For example, Glutamic acid-containing surfactants have been shown to interact with the surface of imogolite clays and facilitate the binding of a model drug molecule to the nanostructure [18]. They have also been used to form hydrogels [19], shown to partition into phospholipid membranes [20], and used as additives in personal cleansing products [21]. Ali, et al. modified a C18 liquid chromatography column with a Glutamic acid-based surfactant and were able to separate ten short-chain aliphatic carboxylic acids [22]. Finally, the Glutamic acid-containing headgroup can be further functionalized by connecting other amino acids to the surfactant’s carboxylate functional groups to produce surfactant molecules with branched amino acid headgroups.
In general, connecting Glutamic or Aspartic acid to a hydrocarbon chain at the amino acid’s N-terminus results in a dicarboxylate surfactant. Similar dicarboxylate compounds have been used in commercial personal care products [21,23,24]. In these surfactants, the adjustment of solution pH allows the headgroup charge to be tuned from neutral to –1 to –2. In micellar solutions where the dicarboxylate headgroups have a −2 charge, surfactant monomers would be expected to repel when they are close together at the micelle surface. Divalent cations, however, can balance the surfactant’s negative charge and reduce this repulsion. Arkhipov, et al. used 1H NMR to show that the addition of divalent calcium ions to solutions containing Glutamic acid-based surfactants leads to the formation of premicellar aggregates [25]. These structures dissociated when the solution temperatu re was increased above 315 K [25].
In this study, the association of organic diamine counterions with tridecanoic-Glu micelles was investigated. Micelle–counterion interactions are of interest because counterions mediate the repulsion of the charged surfactant headgroups at the micelle surface and thus affect the physical properties of the micellar aggregates [26,27,28,29,30]. Commercial surfactant formulations containing diamine additives have also been reported [31,32]. Organic diamines offer an effective model system to elucidate the fundamental factors governing cation binding to amino acid-based micelles. For example, in linear diamines, the length of the alkyl chain connecting the amine functional groups can be varied. The behavior of linear and cyclic diamine counterions can also be compared. In order to study both of these structural factors, four diamine counterions were chosen. 1,4-diaminobutane and 1,6-diaminohexane are linear diamines with different spacer lengths between the amine functional groups. Trans-1,4-cyclohexanediamine and trans-1,2-cyclohexandiamine are, in contrast, cyclic diamines, but like linear diamines, they have a different number of carbon atoms connecting the amine functional groups. The structures of the diamine counterion investigated are shown in Figure 1b–e.
Conductivity measurements were used to investigate the effects of pH and micelle-bound counterions on the critical micelle concentration (CMC) of tridecanoic-Glu [33]. NMR spectroscopy was also used to measure pKa values for the surfactant’s carboxylic acid functional groups. The later experiments monitored changes in the chemical shifts of the surfactant headgroup Hα and Hγ resonances as a function of pH. It is well known that the chemical shifts of protons adjacent to ionizable carboxylic acids can be used to extract acids’ pKa values [34]. NMR experiments also investigated how solution pH affected the micelle radii and the mole fraction of diamine counterions bound to the micelle surface. These experiments use pulsed-field gradient NMR techniques to measure the self-diffusion coefficients, D, of the micelles and diamine counterions. The Stokes–Einstein equation was used to convert micelle D values into hydrodynamic radii, Rh [35]. Since NMR diffusion experiments report D values for all components in a mixture, the counterion D values were used to measure the mole fraction of cationic counterions bound to the anionic micelle surface [35]. These measurements are based on the inherent difference between the diffusion coefficients of the smaller counterions and larger micelles and the observation that when micelle-bound, the counterions take on the diffusional properties of the micelles [36]. The calculation of mole fraction values from diffusion coefficients is discussed in more detail below.

2. Materials and Methods

2.1. Materials

Trans-1,4-cyclohexanediamine was purchased from CHEM-IMPEX International, Inc. (Wood Dale, IL, USA) Millipore Sigma (Milwaukee, WI, USA) provided deuterium oxide (99.9 atom %D), 1,6-diaminohexane (99%), 1,4-diaminobutane (99%), trans-1,2-cyclohexanediamine, tetramethyl silane (>99.9%), NaOH (97%), and DCl (35 wt% solutions in D2O, >99.9% atom %D).

2.2. Surfactant Synthesis

The synthesis of tridecanoic L-glutamic acid has been previously described [37]. In the first step, an N-hydroxysuccinimide ester was prepared by reacting tridecanoic acid with N, N′-diisopropylcarbodiimid and N-hydroxysuccinimide (NHS) in tetrahydrofuran (THF) for 16 h. The solution was then filtered, THF was evaporated, the product was recrystallized with isopropyl alcohol and freeze-dried, and purity was confirmed with 1H NMR. In the second step of the synthesis, sodium bicarbonate, glutamic acid, and the above NHS ester of tridecanoic acid were reacted in a 50% THF: 50% water mixture for 24 h. Completion of the reaction was confirmed with 1H NMR. The organic solvent was evaporated and then a 5 mM solution of hydrochloric acid was added to lower the pH and precipitate the surfactant. The precipitate was separated by vacuum filtration and Milli-Q (Milwaukee, WI, USA) water was used to rinse the product and remove any water-soluble contaminants. The surfactant was then freeze-dried for at least twenty-four hours. An NMR spectrum of a mixture containing 50.0 mM tridecanoic-Glu and 50.0 mM 1,4-diaminobutane at pH 7.0 is shown in Figure S1 of the Supplemental Information. Figure S2 of the Supplemental Information shows a reaction scheme describing the above synthesis.

2.3. NMR Titrations

Solutions used in the NMR titration analyses contained sub-micellar concentrations of the surfactant and 50.0 mM NaHCO3 in 90% H2O/10% D2O. Solution pH was adjusted by adding either small amounts of solid NaOH or 37 wt% DCl. When the desired pH was reached, the WATERGATE (water suppression by gradient tailored excitation) water suppression pulse sequence was used to collect a 1H NMR spectrum of the mixture [38]. A Bruker (Billerica, MA, USA) 400 MHz spectrometer was used for all NMR studies. Each WATERGATE spectrum contained 64 k data points and the spectral width was 8012 Hz. The temperature was set at 25.0 °C and three trials were performed. The WATERGATE pulse sequence uses both radiofrequency and magnetic field gradient pulses to suppress the solvent signal in NMR spectra of aqueous solutions. Unlike pre-saturation techniques, WATERGATE suppresses the solvent signal without affecting solvent-exchangeable protons such as those in amide functional groups [38]. The WATERGATE pulse sequence used in this study and the pulse sequence parameters are given in the Supplemental Information.
The chemical shifts of the tridecanoic-Glu headgroup’s Hα and Hγ resonances were recorded and plotted as a function of pH. The data were then fit to Equation (1) where δ o b s is the observed chemical shift of either Hα or Hγ, and δ m i n is the minimum chemical shift or the shift of the conjugate base form of the surfactant. δ m a x is the maximum chemical shift or the chemical shift of the surfactant’s weak acid form. δ m i n , δ m a x , and p K a were the free parameters in the fit [34].
δ o b s = δ m i n + δ m a x δ m i n 1 + 10 p H p K a

2.4. NMR Diffusion Experiments

NMR diffusion experiments were used to measure the hydrodynamic radii of the tridecanoic-Glu micelles and the mole fraction of cationic diamine counterions bound to the anionic micelle surface. Solutions in these experiments contained 50.0 mM of both the tridecanoic-Glu surfactant and diamine counterion. The solution pH was adjusted as described above. Solutions at the desired pH were transferred into NMR tubes and were then spiked with a small amount of tetramethylsilane (99.9%) (TMS). The very hydrophobic TMS molecules solubilized inside the micelle’s hydrophobic core. The decay of the TMS signal with increasing magnetic field gradient strength was used to measure the diffusion coefficient of the micelles [39,40]. All diffusion experiments were performed at 25.0 °C.
NMR diffusion experiments were performed with the stimulated echo bipolar pulse pair encode–decode pulse sequence [41]. In this pulse sequence, nuclei are excited with a 90° radiofrequency pulse followed by bipolar gradients that encode the spatial positions of the molecules. Bipolar gradients are used to reduce interference from eddy currents. The molecules then undergo free diffusion for 250.0 ms before bipolar decoding gradients are applied and the NMR signal is detected [41]. The pulse sequence used in this study and values for all pulse sequence parameters are included in the Supplemental Information.
In each NMR diffusion experiment, eighteen spectra were collected with magnetic field gradient strengths, G, increasing from 2.0 to 40.0 G·cm−1. The duration of the gradient pulses, δ, was 4.0 ms, the diffusion delay time, Δ, was 250.0 ms, and the short delay between the bipolar gradients, τ, was 0.2 ms. NMR spectra were then apodized with 0.3 Hz line broadening, Fourier transformed, phased, and baseline corrected. The intensities of the TMS and diamine methylene resonances were recorded and plots were prepared of the natural log of peak intensity versus the quantity (γ·G·δ)(Δ − δ/3 − τ/2), where γ is the proton magnetogyric ratio and the other terms are defined above [41]. The slopes of the resulting plots were -D, where D is the diffusion coefficient. A representative plot of the diffusion data for a mixture containing 50.0 mM tridecanoic-Glu and 50.0 mM 1,4-diaminobutane at pH 8.0 is shown in Figure S3 of the Supplemental Information. Plots of the ln of TMS peak intensity versus (γ·G·δ)(Δ − δ/3 − τ/2) were used to determine the micelle diffusion coefficient, Dmicelle. Plots of the ln of the diamine peak intensity versus (γ·G·δ)(Δ − δ/3 − τ/2) were used to determine the diffusion coefficient of the diamine counterions. Each experiment was performed in triplicate. Average diffusion coefficients were calculated and used for the calculations described below.
D m i c e l l e values and the Stokes–Einstein equation (Equation (2)) were used to calculate the hydrodynamic radii, R h , of the micelles.
D m i c e l l e = k B · T 6 · π · η · R h
R h is the radius of the sphere with the same diffusion coefficient as the micelle [42]. In Equation (2), k B is Boltzmann’s constant, T is the temperature, and η is the solution viscosity. Viscosity measurements for aqueous solutions of amino acid-based surfactants have been reported. The viscosity of 1.06 ± 0.02 cp measured in those studies was used here [15]. The TMS diffusion coefficient was used to calculate the hydrodynamic radii of the micelles. The surfactant monomers undergo fast exchange on the NMR timescale between the free solution and micelle-bound states. Therefore, D values measured by monitoring the surfactant resonances in an NMR diffusion experiment report the weighted average of the micelle and free solution surfactant values [39]. The hydrophobic TMS molecules, though, remain solubilized in the hydrophobic core and report the diffusion coefficient of the micellar aggregate [39,40]. It should be noted that other techniques such as dynamic light scattering are also used to measure the hydrodynamic radii of surfactant aggregates [3,12]. Lewis, et al. compared dynamic light scattering and NMR-derived hydrodynamic radii for micelles formed by the amino acid-based surfactant L-Undecyl Leucinate [15]. The techniques reported very similar results with both methods yielding micelle radii in the 10 Å range [15]. The micelles in this study are also amino acid-based and of comparable size to those studied by Lewis, et al. [15].
Diffusion coefficients were also used to calculate the mole fraction of diamine counterion molecules bound to the micelles, f b , c o u n t e r i o n . The diamine counterions also undergo fast exchange on the NMR timescale between free solution and micelle-bound states. Therefore, the counterion diffusion coefficient in the presence of the tridecanoic-Glu micelles, D c o u n t e r i o n , is given by Equation (3) [35,39,40].
D c o u n t e r i o n = f b , c o u n t e r i o n · D m i c e l l e + 1 f b , c o u n t e r i o n · D f r e e , c o u n t e r i o n
D f r e e , c o u n t e r i o n is the free solution counterion diffusion coefficient, which was measured by performing NMR diffusion experiments with solutions containing the diamine counterions but no micelles. D f r e e , c o u n t e r i o n values were (10.0 ± 0.3) × 10−10, (8.96 ± 0.01) × 10−10, (9.64 ± 0.06) × 10−10, and (9.55 ± 0.06) × 10−10 m2·s−1 for 1,4-diaminobutane, 1.6-diaminohexane, trans-1,4-cyclohexanediamine, and trans-1,2-cyclohexanediamine, respectively.

2.5. Conductivity Experiments

Conductivity experiments were used to determine surfactant critical micelle concentrations for each surfactant–counterion mixture. In these experiments, a series of solutions with concentrations below and above the CMC were prepared and the conductivity of each solution was recorded. Below the CMC, the solutions’ conductivities increase linearly with increasing surfactant concentration. Above the CMC, conductivity still increases linearly with increasing concentration; however, the slope of the increase is reduced because surfactant aggregation reduces the number of charged species in the solution. Plots of conductivity versus concentration were then prepared and the CMC was taken as the inflection point of the plot or the point where the linear fits at high and low concentrations intersect [33]. Conductivity measurements were made at an ambient room temperature of 23–24 °C.
In each conductivity experiment, a stock solution of the tridecanoic-Glu-counterion mixtures was prepared and pH was adjusted as described above. Ten milliliters of this solution were then placed in a centrifuge tube and a previously calibrated Vernier probe was used to record conductivity. One milliliter of the surfactant solution was removed, 1.0 mL of deionized water was added, and the diluted solution’s conductivity was recorded. The process was repeated until the surfactant’s concentration was well below the CMC. Conductivity was then plotted versus surfactant concentration. A representative plot for a tridecanoic-Glu and 1,4-diaminobutane mixture is shown in Figure S4 of the Supplemental Information. The CMC is labeled on the plot. Standard deviations were calculated from three replicate measurements.

2.6. Molecular Modeling and Simulations

The MOE (version 2020, Montreal, QC, Canada) software package (Chemical Computing Group, Inc., www.chemcomp.com, URL accessed on 10 June 2024) was used to carry out the tridecanoic-Glu conformational analysis. The LowModelMD method was employed. The conformational limit and iteration limit were both 10,000. The MM iteration limit was 500 and the rejection limit was 100. The RMS gradient was set to 0.005 and the RMSD limit was 0.25. Low-energy structures from the conformational analysis were examined in MOE.
In the molecular dynamics (MD) simulation experiments, the surfactant was first built with MOE. Figure S5 in the Supplemental Information shows the initial surfactant structure used for the MD simulations. The hydrocarbon chain was built in an extended conformation and then attached to a Glutamic acid headgroup. The headgroup structure was chosen from MOE’s amino acid library and default bond distances, angles, and dihedrals were used. Both the primary and γ surfactant carboxylic acids were also protonated. The Supplemental Figure S5 structure also shows the initial distances between the amide oxygen atom and the two hydroxyl oxygen atoms in the Glutamic acid headgroup. Hydrogen bond formation between atoms in these functional groups is discussed below. All MD simulations were performed with the Amber16 (version 2016) software package (ambermd.org, URL accessed on 10 June 2024) [43]. The surfactant was solvated with approximately 2000 water molecules. The MD simulations began with a minimization step followed by a 20 ps MD simulation to warm the system to 300 K. Another 20 ps MD simulation was used to equilibrate the pressure to 1 atm. A 100 ns production run employing cubic periodic boundary conditions was then carried out. In the production run, the time step was two fs, and structures were stored every 0.2 ps. The cpptraj utility in Amber16 was used to perform the hydrogen bond analyses [38]. The heavy atom distance and angle cutoffs in the H-bond analyses were, respectively, 3.5 Å and ±30°. The H-bond percent occupancies were calculated from the ratio of the frames in which an H-bond was present over the total frames in the MD simulation.

3. Results and Discussion

3.1. Headgroup pKa Measurements

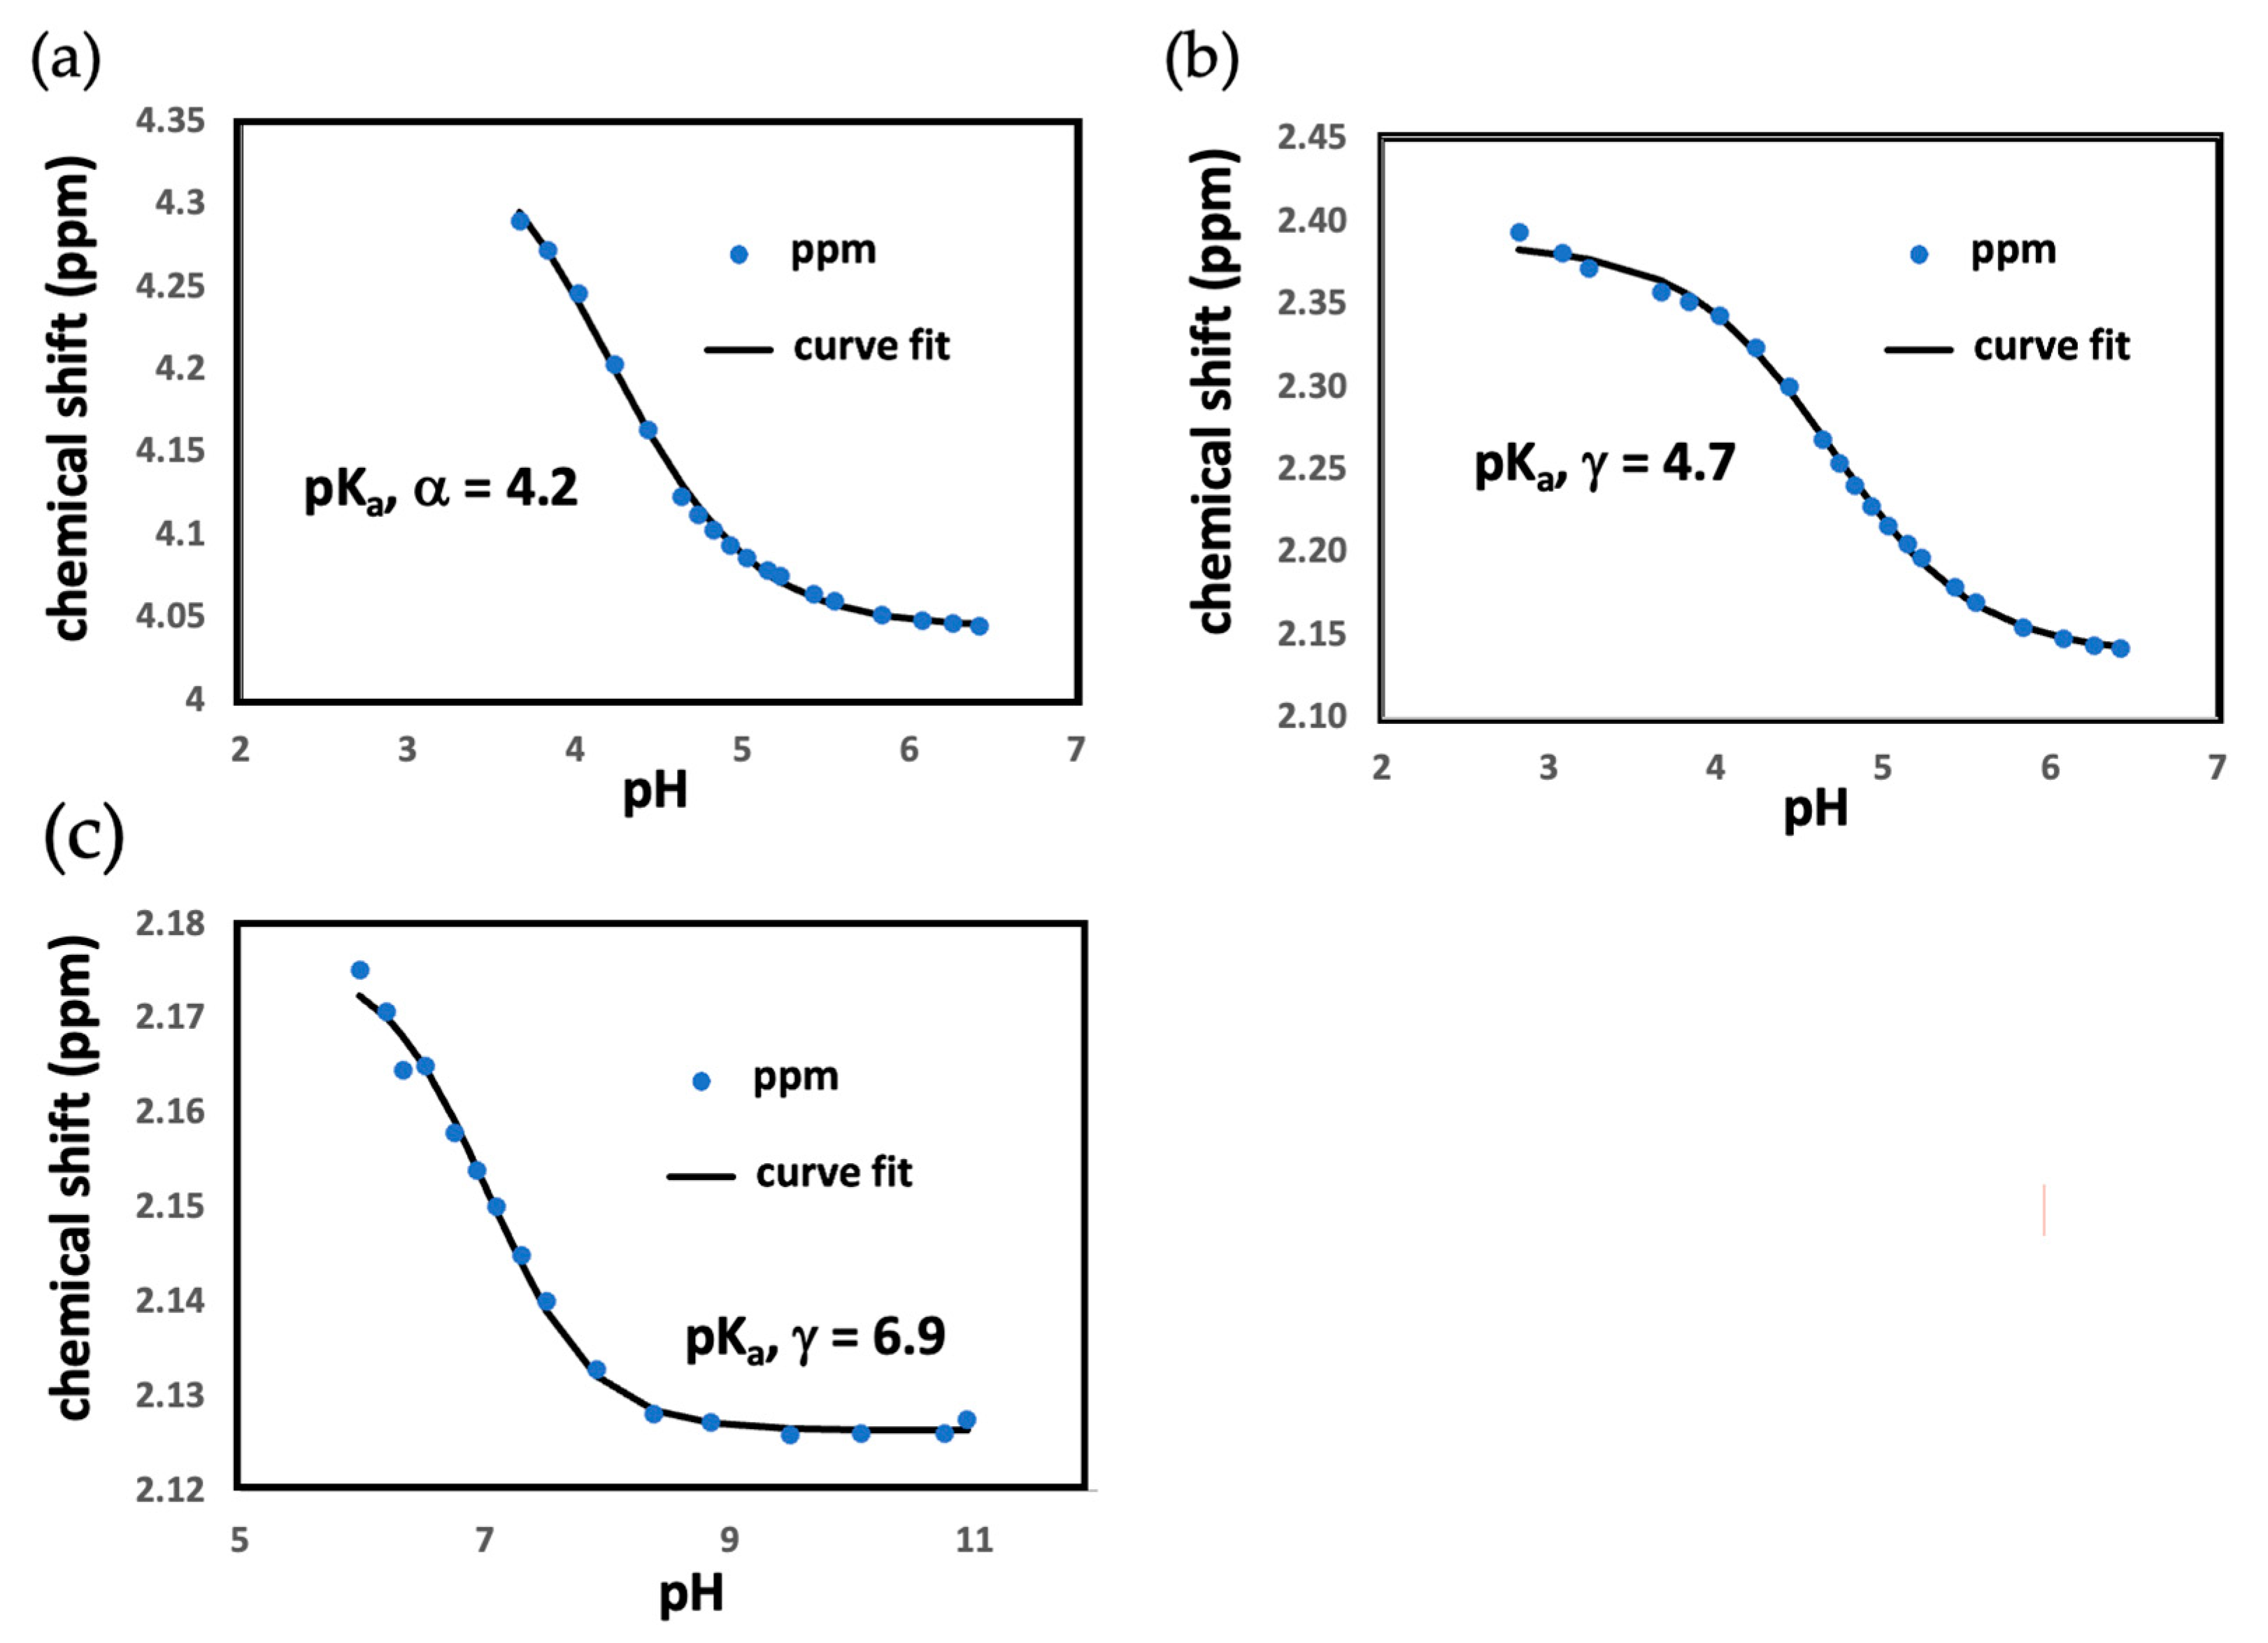
NMR titration analyses were performed to measure pKa values for tridecanoic-Glu’s primary and γ carboxylic acid functional groups. Figure 2a,b shows NMR titration curves for the monomeric surfactant. A titration curve for the surfactant’s γ carboxylic acid in micellar form is shown in Figure 2c. Table 1 summarizes all pKa values. The Table 1 entries labeled L-Glutamic Acid were taken from the literature [44]. Uncertainties are not reported for the literature values but are included for the experimental pKa measurements. L-Glutamic Acid pKas from the literature were included to allow comparison of the free solution carboxylic acid acidities to corresponding values for the tridecanoic-Glu surfactant.
The pKa analyses show that in monomeric form, the surfactant γ pKa value of 4.7 is similar to the corresponding L-Glutamic acid value of 4.3. In contrast, the pKa of the free amino acid’s primary-CO2H functional group (2.2) is considerably lower than the corresponding value for the tridecanoic-Glu monomeric surfactant (4.2). In other words, the primary carboxylic acid is more acidic in free L-Glutamic acid and less acidic when the amino acid is connected to the surfactant’s hydrocarbon chain through an amide bond.
The above observation is likely attributable to the formation of an intramolecular hydrogen bond between the primary-CO2H hydrogen atom and the carbonyl oxygen of the surfactant’s amide bond. This H-bond decreases the acidity of the primary carboxylic acid because deprotonation of the hydrogen-bound carboxylic acid hydrogen atom places two negative oxygen atoms close to one another. Deprotonation thus destabilizes the conjugate base and, therefore, reduces the acidity of the primary-CO2H [45,46]. Intramolecular hydrogen bond formation involving the γ-CO2H functional group may affect its pKa in a similar manner; however, the γ carboxylic acid is farther from other H-bond donor and acceptor atoms in the surfactant’s headgroup making intramolecular H-bond formation less likely. This observation may explain why the surfactant’s γ-CO2H pKa is more similar to the free amino acid value.
Molecular modeling and molecular dynamics simulation experiments were used to test these hypotheses and determine if the monomer’s structure allowed intramolecular hydrogen bond formation. The tridecanoic-Glu surfactant was built with the MOE (Chemical Computing Group, https://www.chemcomp.com/, URL accessed on 10 June 2024) software package and a conformational search was carried out. The two lowest energy structures from this search are shown in Figure 3a,b. Note that in each structure, a hydrogen bond is observed between the primary CO2H hydrogen atom and the carbonyl oxygen of the surfactant’s amide functional group. These structures also show an H-bond between the headgroup’s γ-CO2H oxygen atom and the amide NH. However, no H-bond involving the γ carboxylic acid hydrogen atom was observed in these two structures. There was a higher energy structure from the conformational search (Figure 3c), however, in which an H-bond was formed between the γ-CO2H proton and the amide carbonyl oxygen. These results show that the structure of the tridecanoic-Glu surfactant’s amino acid headgroup allows for H-bond formation between the primary-CO2H hydrogen atom and the amide functional group. Formation of this H-bond would be expected to reduce the primary carboxylic acid’s pKa as observed in the NMR titrations [45,46]. In addition, if the surfactant also spends time in the higher energy conformation shown in Figure 3c, the γ-CO2H would be expected to be slightly less acidic than the free amino acid as was observed in Table 1.
A molecular dynamics (MD) simulation was also performed to further investigate intramolecular hydrogen bond formation in the tridecanoic-Glu surfactant headgroup. In this experiment, a 100 ns MD simulation was performed with a system containing the tridecanoic-Glu monomer and approximately 2000 water molecules. A hydrogen bond analysis was then performed on the MD simulation trajectory. These experiments showed that an H-bond between the primary-CO2H proton and the carbonyl oxygen of the amide functional group was present for 19.8% of the MD simulation. This is the same H-bond that was observed in the conformational search (Figure 3a). Figure S6a of the Supplemental Information plots the distance between the heavy atoms involved in the H-bond between the primary-CO2H proton and the carbonyl oxygen of the amide functional group versus simulation time. The figure shows that the distance varies between approximately 3 and 4 Å and remains relatively constant throughout the MD simulation. Since the H-bond cutoff distance in the H-bond analysis was 3.5 Å, the percent occupancy of this H-bond is as high as 19.8%. Furthermore, an H-bond between the γ-CO2H proton and amide oxygen was also observed in the MD simulation, but the percent occupancy was only 7.5%. This H-bond is shown in Figure 3c. Figure S6b of the Supplemental Information plots the distance between the heavy atoms involved in the H-bond between the γ-CO2H proton and amide oxygen versus simulation time. Here, the change in distance varied over a relatively broad range of 3 to 7 Å and the distance is much more variable than for the H-bond with the 19.8% occupancy. This plot, therefore, is consistent with a lower H-bond percent occupancy. Finally, the MD simulation also yielded an H-bond between the γ-CO2H proton and primary-CO2H oxygen with a percent occupancy of 5.0%.
Therefore, like the conformational analysis, the MD simulation showed that the surfactant headgroup structure allowed multiple opportunities for intramolecular hydrogen bond formation. The H-bond formed most often though was between the primary-CO2H proton and the amide carbonyl oxygen. NMR titration analyses showed that this proton’s pKa was significantly different than the corresponding proton in free L-Glutamic acid where H-bond formation of this type is not possible. H-bonds involving the γ-CO2H proton were also observed in the MD simulation, although these H-bonds formed less often than the H-bond shown in Figure 3a.
Table 1 also presents NMR titration pKa values for the tridecanoic-Glu surfactant in micellar form. In these experiments, the surfactant concentration was 50.0 mM, which is well above the CMC values given in Table 2. These CMC data will be discussed in more detail below. In NMR titrations with the surfactant micelles, only the γ pKa value could be measured. pKa experiments were performed by lowering the solution pH and observing the change in chemical shift of the headgroup Hα and Hγ protons. However, in micellar form, the surfactant precipitated from the solution before a significant change in the Hα chemical shift was observed. Therefore, only the γ pKa value is reported. Precipitation likely occurred in the micellar solutions because the Glutamic acid headgroup’s primary carboxylate began to protonate below pH 6. The monomer’s charge then changed from predominantly −1 to neutral, making the surfactant both less hydrophilic and less water-soluble. In the micellar solutions, the surfactant concentration was also relatively high (50.0 mM), causing the less hydrophilic, protonated surfactant to precipitate from the solution. At the lower sub-micellar concentrations used in the monomer NMR titrations, the surfactant likely remained water-soluble even after protonation of the primary carboxylate began to occur. Table 1 shows that the surfactant’s γ pKa value was larger when the surfactant was in micellar form (pKa = 6.9) than when the surfactant was monomeric (pKa = 4.2). In other words, the γ-CO2H proton is less acidic when the surfactant is in micellar form and more acidic in monomeric form. This increase in pKa and decrease in acidity is likely caused by intermolecular H-bond formation between different surfactant unimers when they are close to one another at the surface of the micelle.
The Table 1 pKa values can also be used to predict how the charges of the micellar surfactant molecules change with solution pH. Since the pKa of the micellar γ-CO2H is 6.9, if the pH is in the 7.0 range, the solution will contain populations of both protonated and deprotonated side chains. At pH 7, however, the primary carboxylic acid will be ionized since its pKa would be expected to be lower than the γ-CO2H. Therefore, at neutral pH, the solution will contain a mixture of −1 and −2 headgroup charges. At pH 6.0, however, the γ carboxylic acid is predominately protonated and the surfactant charge is −1. At pH values well above 7.0, the γ carboxylic acid is predominantly deprotonated and the surfactant charge is −2. The effect of headgroup charge on the tridecanoic-Glu surfactants’ CMC will now be presented. The binding of cationic counterions to the anionic micelle surface as a function of pH will also be examined.

3.2. Critical Micelle Concentration Measurements

CMC measurements were performed in solutions with the diamine counterions 1,4-diaminobutane, 1,6-diaminohexane, trans-1,4-cylcohexanediamine, and trans-1,2-cyclohexanediamine. As described above, CMC values were measured by progressively diluting tridecanoic-Glu-diamine mixtures with deionized water and recording the solution’s conductivity after each dilution. Initial surfactant concentrations in the conductivity experiments were typically 20.0 mM and final concentrations were 3.0 mM. Solution pH measurements were performed at these concentrations to confirm that the pH did not change significantly during the conductivity experiments. In a tridecanoic-Glu-1,4-diaminobutane mixture, the pH was 7.07 at a surfactant concentration of 20.0 mM. The pH was 6.82 after the 20.0 mM solution was diluted to 3.0 mM with deionized water. In three trials of this experiment, pH decreases of 1.4% to 3.6% were observed. The pH of the solutions likely remained relatively constant during the conductivity experiments because of buffering provided by the mixture of the acidic surfactant and basic diamine.
The critical micelle concentrations of tridecanoic-Glu at pH 6.0 and 7.0 are shown in Table 2. The CMC values show that at pH 6.0, the 1,4-diaminobutane, 1,6-diaminohexane, and trans-1,4-cylcohexanediamine CMC values were similar to one another, ranging from 3.1 to 3.4 mM. As discussed above, at this pH, the surfactant headgroup charge is predominantly −1. When the pH increased from 6.0 to 7.0 and the tridecanoic-Glu headgroups had populations of both −1 and −2 charges, the surfactant’s CMC with 1,4-diaminobutane, 1,6-diaminohexane, and trans-1,4-cylcohexanediamine counterions all roughly double from 3.1 to 3.4 mM to 6.2 to 6.8 mM. These CMC trends can be rationalized based on changes in surfactant headgroup charge with pH. At pH 6.0, when the headgroup charge is −1, there is less repulsion between the surfactant headgroups and micelles form at a lower concentration. As pH is increased to 7.0, the population of −2 surfactant unimers increases. The larger headgroup charge increases the repulsion between surfactant monomers and thus raises the CMC [47].
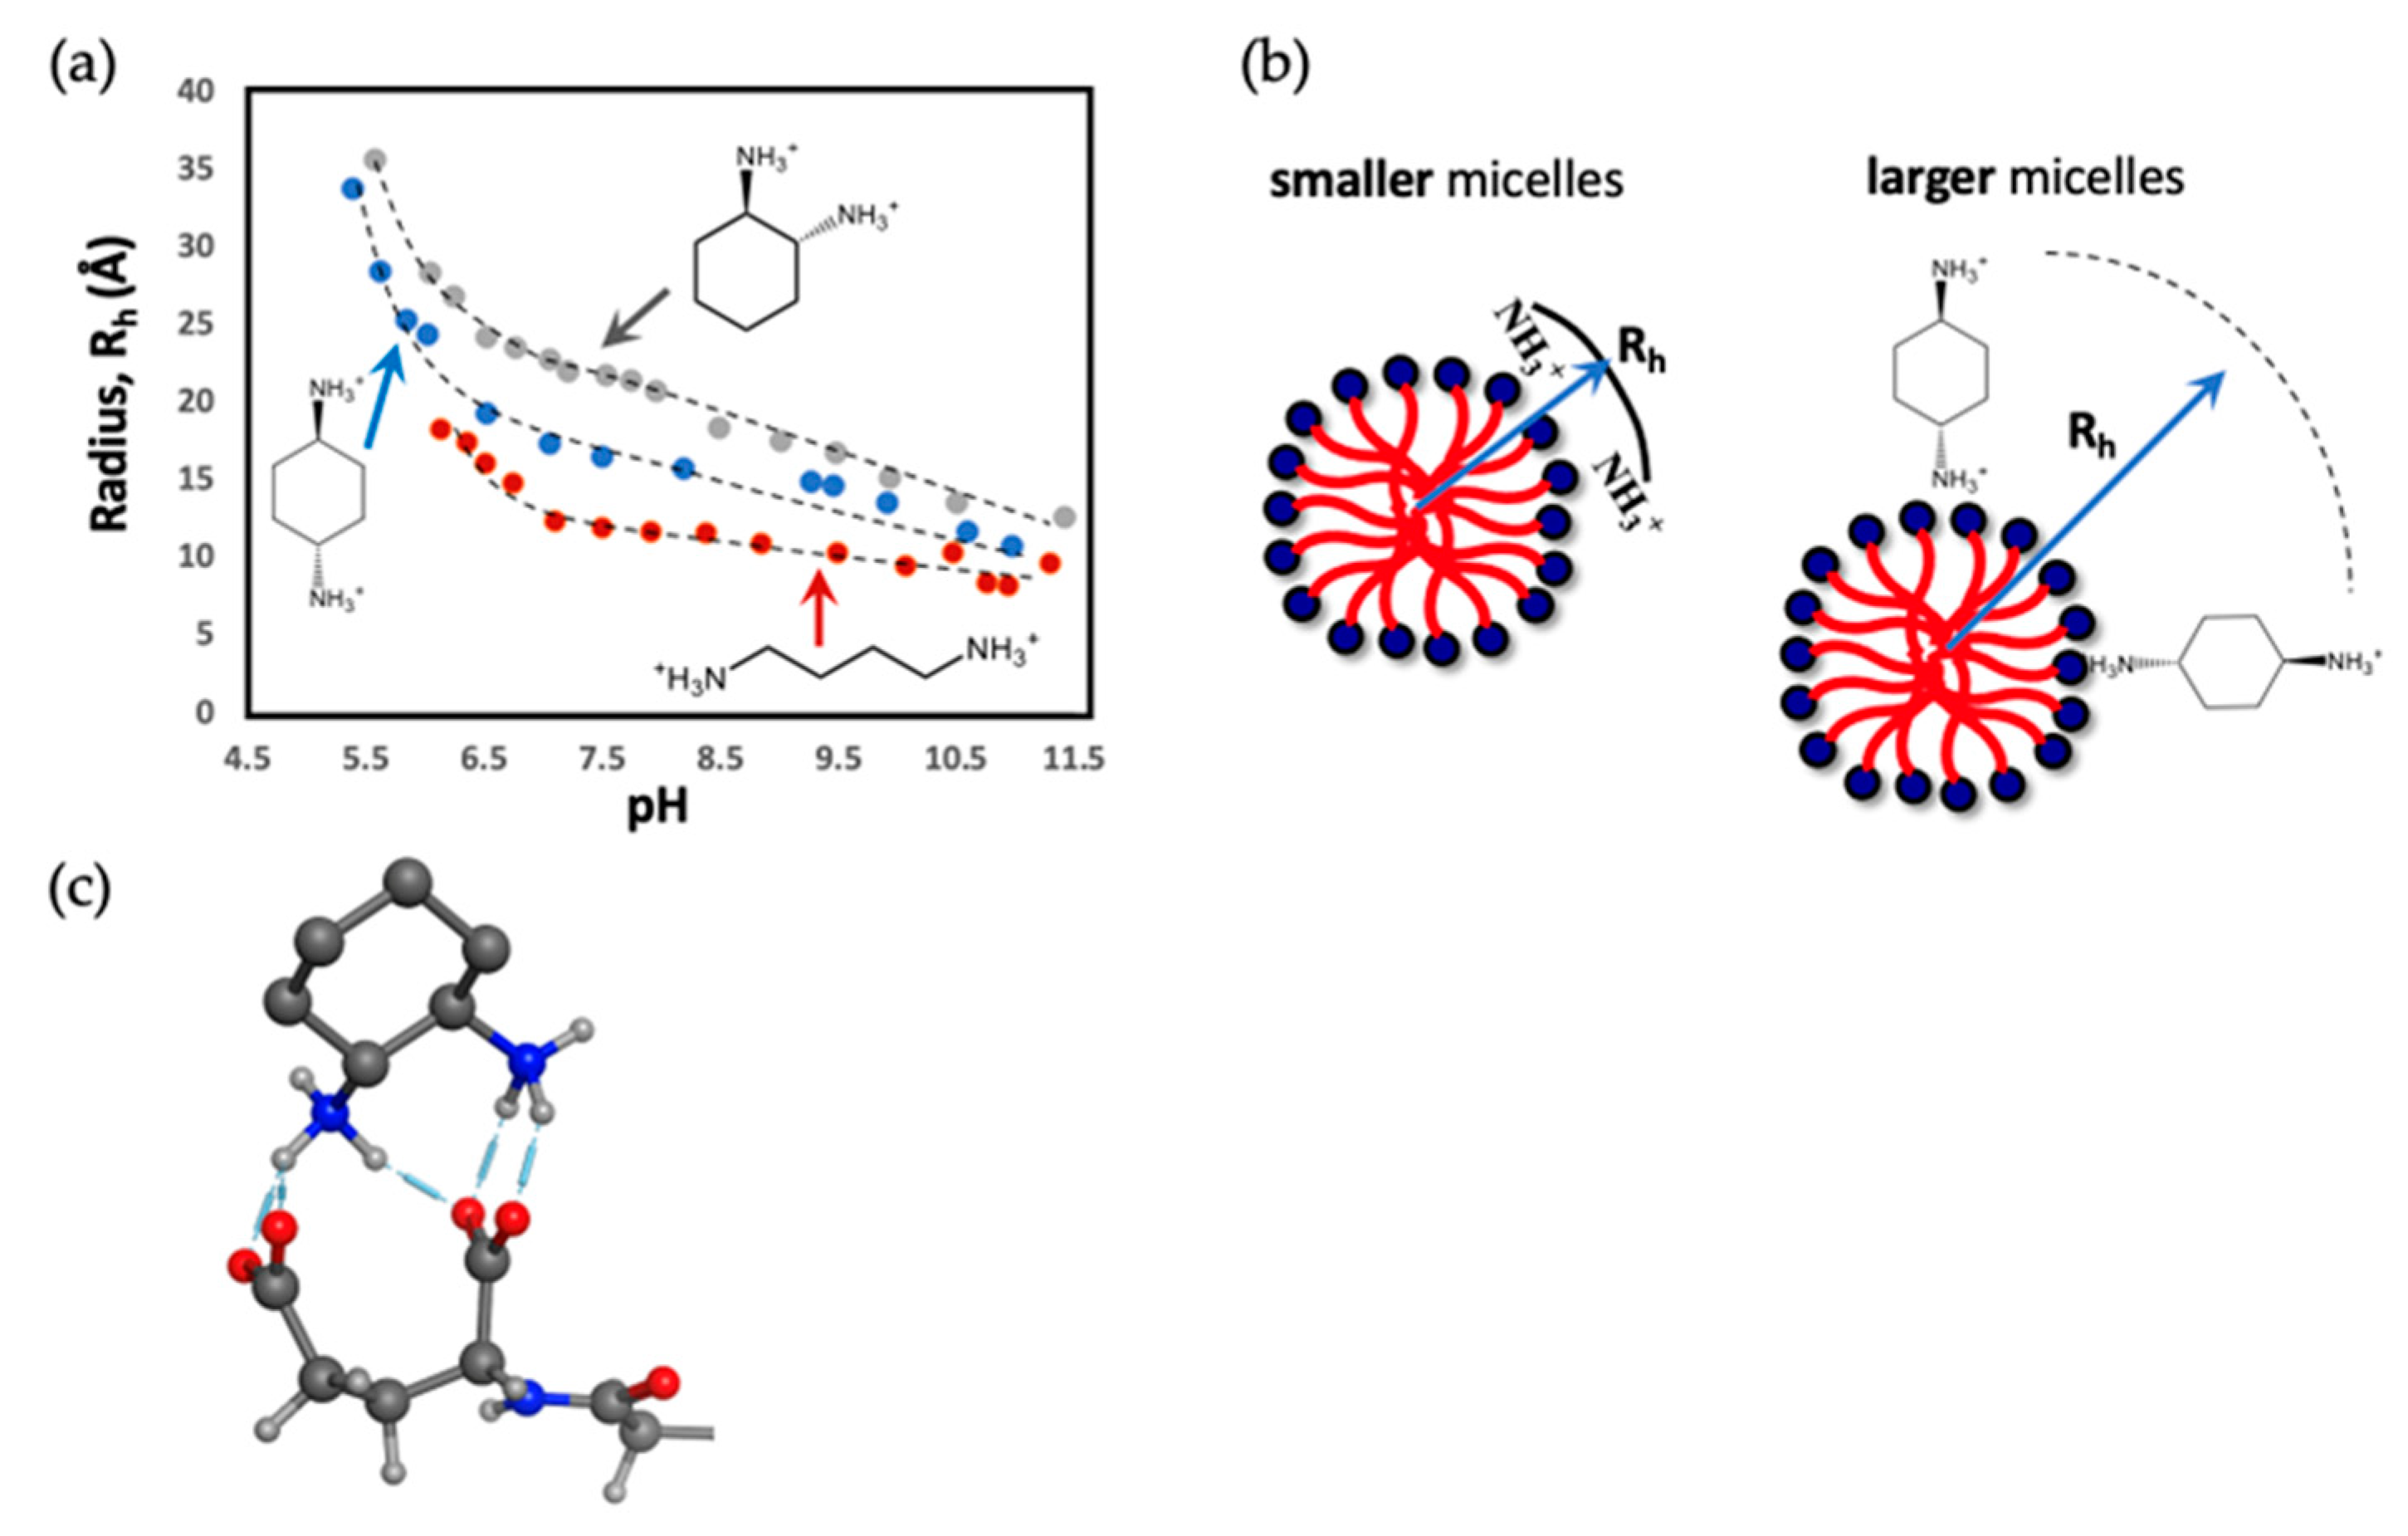
At each pH investigated, the tridecanoic-Glu CMC was lowest in solutions containing trans-1,2-cyclohexanediamine counterions. For example, CMC values in solutions containing trans-1,2-cyclohexanediamine were 1.3 mM and 2.1 mM at pH 6 and 7, respectively. These values were lower than the CMCs for all other counterions in the study at both of the pH values. One difference between trans-1,2-cyclohexanediamine and the other three counterions is that in the former, the amine functional groups are on adjacent carbon atoms. This arrangement may allow the trans-1,2-cyclohexanediamine counterion to bind simultaneously to both carboxylic acid functional groups in the tridecanoic-Glu headgroup. An energy-minimized structure from MOE showing this mode of binding is shown in Figure 4c. With the other counterions in Table 1, the amine functional groups are farther apart, making simultaneous binding to both headgroup carboxylic acids less likely. If the trans-1,2-cyclohexanediamine counterion binds to the surfactant headgroup in this manner, the counterion may more effectively reduce headgroup repulsion at the micelle surface, thus leading to lower surfactant CMC values [47]. This mode of trans-1,2-cyclohexanediamine binding to the micelles is revisited below when micelle radii are discussed.
Finally, it is well known that a surfactant’s CMC is affected by the length of its hydrocarbon chain, with longer chains generally leading to lower CMC values [14,47,48,49]. In order to investigate whether tridecanoic-Glu behaved in this manner, CMC measurements were made with the surfactant undecanoic-Glutamic Acid (undecanoic-Glu) in solutions containing the four counterions listed above. This surfactant also contains a Glutamic acid headgroup, but its hydrocarbon chain has eleven carbon atoms, compared to the thirteen-atom hydrocarbon chain in tridecanoic-Glu. CMC values for undecanoic-Glu with each diamine counterion at pH 6.0 and 7.0 are shown in Table 2. As expected, the CMC values are higher for the undecanoic-Glu surfactant. For example, while tridecanoic-Glu at pH 6.0 had CMC values in the 3.1 to 3.4 mM range, CMC values for und-Glu ranged from 17.5 to 22.1 mM at this pH. As observed for tridecanoic-Glu, the undecanoic-Glu CMC values were also generally smaller at pH 6.0 and larger at pH 7.0. This effect can be attributed to changes in the surfactant headgroup charge with pH as discussed above.
Differences between the tridecanoic-Glu and undecanoic-Glu CMC values can be rationalized as follows. The molecules have the same headgroup, therefore favorable hydrogen-bonding interactions and unfavorable headgroup repulsions should be similar in both surfactants. The longer alkyl chain in tridecanoic-Glu, however, increases the overall hydrophobicity of the surfactant. Tridecanoic-Glu molecules therefore experience enhanced hydrophobic effects in solution compared to undecanoic-Glu, causing micelles to form at lower concentrations. An analogous effect was observed by Brycki, et al. in an investigation of divalent, dimeric alkylammonium surfactants. In this study, the CMC was 158.5 mM when the surfactant hydrocarbon chain contained four carbon atoms. The CMC decreased steadily to 0.033 mM when the length of the hydrocarbon chain was increased to eighteen carbon atoms [48]. A similar change in CMC with increasing alkyl chain length was also observed by Bustelo, et al. in a study of histidine-containing amino acid-based surfactants [14].

3.3. Micelle Radii and Counterion Binding

NMR diffusion experiments were used to investigate how solution pH affected the hydrodynamic radii of the tridecanoic-Glu micelles and the mole fraction of cationic counterions bound to the anionic micelle surface. The counterions in the diffusion experiments were the same as those used for the CMC studies (Table 2). Before discussing these results, it should be noted that the hydrodynamic radius, Rh, measured with NMR diffusion experiments is the radius of the particle diffusing in solution. Rh, therefore, includes both the micelle and micelle-bound counterions. NMR diffusion experiments do not directly probe the radius of only the micelle. MD simulation experiments with the entire micelle would directly measure this radius and provide the micelle’s aggregation number. These MD simulations are underway. Finally, since Rh includes both the micelle and counterions, comparing Rh values at pHs where the mole fraction of bound counterions is high to pHs where these values are low provides insight into the structure of the micelle–counterion complex [15,16,17,26]. This method will be employed below to interpret the results shown in Figure 5.
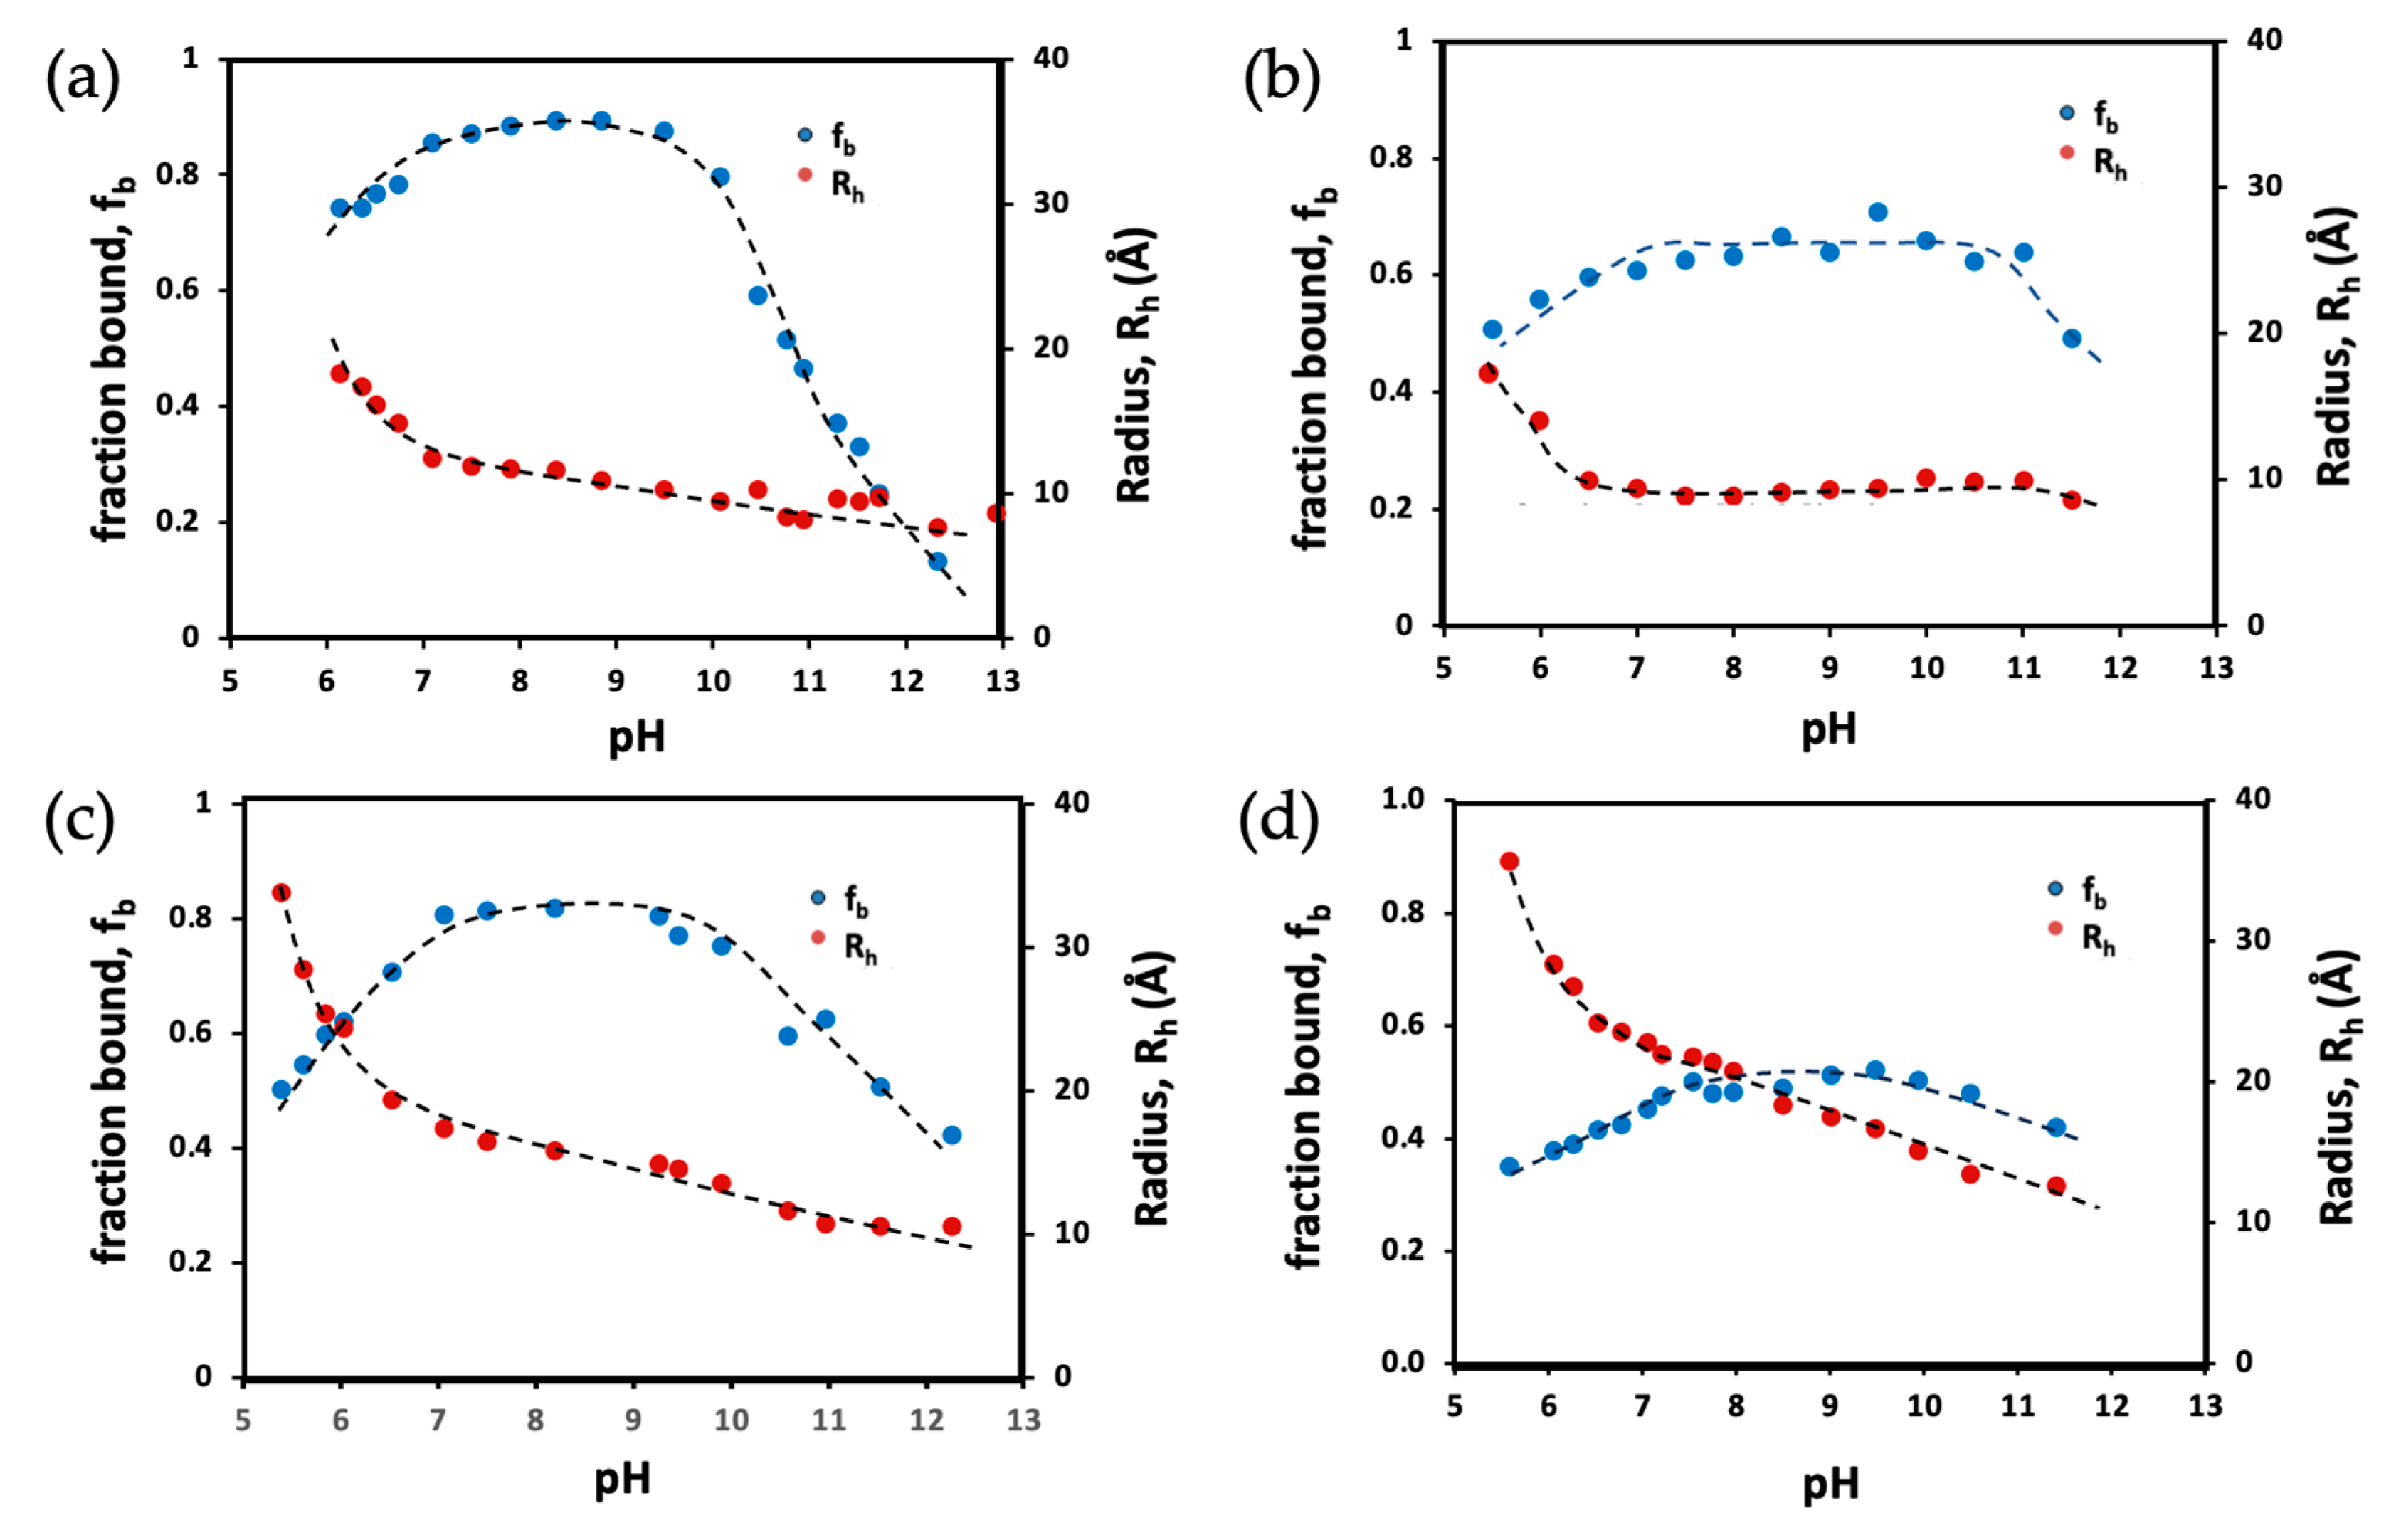
Figure 5a plots the hydrodynamic radii of the tridecanoic-Glu micelles and the mole fraction of 1,4-diaminobutane counterions bound to the micelle surface versus solution pH. Figure 5a shows that at pH 6, the micelle radius is ≈20 Å and the fb,counterion value is 0.72. As pH is increased, the micelle radius decreases from 20 Å at pH 6 to 12 Å at pH 7. In the same pH range, the fb,counterion value increases from 0.72 to 0.85. As pH is further increased from 7.0 to 13.0, the micelle radius decreases further from 12 Å to 8 Å. In the same pH range, the fb,counterion values remain relatively constant until pH 9.7 and then fb,counterion decreases sharply from 0.80 at pH 9.7 to only 0.10 at pH 13.0. These changes can be rationalized by changes in the surfactant headgroup and counterion charges with solution pH.
Below pH 7, the tridecanoic-Glu surfactants predominantly have a −1 charge because the primary carboxylic acid is deprotonated but the γ-CO2H is not. Since repulsion between the headgroups at the micelle surface is less when the monomers are −1 (compared to −2 at higher pH), more monomers pack into the micelles below pH 7.0, making the micelle radii larger. pKa values for all the counterions investigated are given in Supplemental Information Table S1. For 1,4-diaminobutane, these are pKa1 = 9.63 and pKa2 = 10.8 [44]. Therefore, below pH 7.0, the 1,4-diaminobutane counterion charge is +2. The +2 counterions are strongly attracted to the micelle surface below pH 7.0, leading to the relatively high fb,counterion value observed in Figure 5a.
From pH 7.0 to 9.7, the γ carboxylic acid in the tridecanoic-Glu headgroup deprotonates and the monomer charge changes to predominantly −2. Repulsion between these −2 headgroups is now greater than when the monomer charge was −1. Increased headgroup repulsion at the micelle surface likely leads to fewer monomers aggregating into micelles. Therefore, as observed in Figure 5a, the micelle radius decreases when the headgroup charge changes from −1 to −2. In addition, in the pH range 7.0 to 9.7 when the headgroup charge is −2, the +2 1,4-diaminobutane counterions are more strongly attracted to the micelle surface than at lower pH when the headgroup charge was −1. Therefore, the mole fraction of micelle-bound counterions increases to 0.9 and reaches its maximum value in this pH range. pKa1 of the 1,4-diaminobutane counterion is 9.63, so above pH 9.7, the amine deprotonates and the counterion has a +1 charge. The +1 diamine is now less attracted to the −2 headgroups at the micelle surface, causing the mole fraction of micelle-bound counterions to decrease sharply as the pH is raised above pH 9.7. Finally, pKa2 for 1,4-diaminobutane is 10.8, so above pH 11, the counterion is predominately neutral and the mole fraction of micelle-bound counterions is relatively low. A model of changes in the 1,4-diaminobutane binding to the tridecanoic micelles with solution pH is shown in Figure 6a.
Changes in the micelle radii and mole fraction of micelle-bound 1,6-diaminohexane counterions are plotted versus solution pH in Figure 5b. Many of the trends discussed above for 1,4-diaminobutane are also seen with 1,6-diaminohexane. At pH 6.0, the micelle radius is 17 Å and the mole fraction of micelle-bound counterions is 0.5. In the pH range of 6.0 to 7.0, the radii decrease to 9.0 Å and the fb,counterion values increase to 0.6. From pH 7.0 to 11.0 the micelle radii and fb,counterion values remain relatively constant. Finally, above pH 11.0, fb,counterion decreases to 0.4.
The change in micelle radius in Figure 5b from pH 6.0 to 7.0 likely occurs, as in the 1,4-diaminobutane solutions, because the surfactant headgroup charge changes from −1 to −2 in this pH range. The fb,counterion value also increases from pH 6.0 to 7.0 because the +2 counterions are strongly attracted to the −2 surfactant headgroups. However, unlike in the 1,4-diaminobutane solutions, the fb,counterion values do not decrease at pH 9.7 but rather remain constant until pH 11.0. This behavior can be attributed to the two counterions having different ionization constants. The pKas for 1,6-diaminohexane are pKa1 = 10.76 and pKa2 = 11.86 [44]. Therefore, the counterion’s charge remains predominately +2 up to pH 11.0. In Figure 5b, the 1,6-diaminohexane fb,counterion values remain constant up to pH 11.0 as well. When the counterion deprotonates above pH 11, the counterion charge is reduced and the fb,counterion values are reduced as well. In other words, the reduction in the counterion’s fb,counterion values occur at a higher pH for 1,6-diaminohexane and a lower pH for 1,4-diaminobutane because of the former counterion’s charge remains +2 over a larger pH range. A model of 1,6-diaminohexane binding to the tridecanoic-Glu micelles is shown in Figure 6b.
Another notable difference between the binding of 1,4-diaminobutane and 1,6-diaminohexane counterions to the tridecanoic-Glu micelles is that the maximum fb,counterion value for 1,4-diaminobutane was 0.9, while the maximum fb,counterion for 1,6-diaminohexane was 0.6. A similar result was reported by Maynard-Benson, et al. in a study of linear diamine counterions binding to undecanoic L-norleucine micelles [17]. Previous studies have shown that these linear diamine counterions bind parallel to the surface of amino acid-based micelles, allowing the two amine function groups to interact with multiple surfactant unimers. Maynard-Benson, et al. suggested that fb,counterion values were larger for 1,4-diaminobutane and smaller for 1,6-diaminohexane because the spacing between the amine functional groups in the former counterion was optimal for the counterion to bridge between two surfactant monomers [17]. A similar effect likely explains why the maximum fb,counterion values were also larger for 1,4-diaminobutane counterions than for 1,6-diaminohexane when these two diamines bound to the tridecanoic-Glu micelles.
Finally, in Figure 6, 1,4-diaminobutane and 1,6-diaminohexane are shown to bind parallel to the micelle surface with both amine functional groups interacting with different surfactant monomers. These counterions have been shown to bind to micelles formed by other amino acid-based surfactants in an analogous manner [17,26]. The results plotted in Figure 5a suggest that 1,4-diaminobutane also binds to tridecanoic-Glu micelles in a parallel fashion. As previously discussed, above pH 9.7, the 1,4-diaminobutane counterion deprotonates, its charge decreases, and the counterion is less attracted to the anionic micelle surface. However, above pH 9.7, as the 1,4-diaminobutane fb,counterion values decrease, the micelle hydrodynamic radii remain relatively constant. This result suggests that 1,4-diaminobutane binds parallel to the tridecanoic-Glu micelle surface because the micelle Rh values are similar when fb,counterion is both high and low. Comparing the Rh values in Figure 5a,b when, 1,4-diaminobutane and 1,6-diaminohexane are micelle-bound, respectively, shows that above pH 7, the Rh values for micelles with both counterions are very similar. In other words, the Rh values are not appreciably larger when 1,6-diaminohexane counterions with a longer alkyl chain are micelle-bound compared to when 1,4-diaminobutane counterions with a shorter alkyl chain are bound to the tridecanoic-Glu micelles. This result suggests that 1,6-diaminohexane, like 1,4-diaminobutane, binds parallel to the micelle surface as shown in Figure 6.
Figure 5c plots micelle radii and fb,counterion values for trans-1,4-cyclohexanediamine counterions binding to tridecanoic-Glu micelles. These data closely resemble the corresponding plot in Figure 5a for 1,4-diaminobutane. For example, with both counterions, the micelle radii decrease and fb,counterion values increase when the surfactant monomer charge changes from −1 to −2. The mole fraction of micelle-bound counterions is also constant in the pH range of 7.0 to 9.4 when the counterion charge is +2. When the counterion deprotonates, fb,counterion values then decrease. This decrease in fb,counterion occurs at a slightly lower pH with trans-1,4-cyclohexanediamine because the counterion’s pKa1 of 9.4 is lower than the corresponding 1,4-diaminobutane value of 9.63 [44].
One notable difference, however, between the behavior of the trans-1,4-cyclohexanediamine and 1,4-diaminobutane-containing solutions is that in the former the micelle radii are larger throughout the pH range investigated. This difference is illustrated in Figure 4a where the micelle hydrodynamic radii for solutions containing both counterions are plotted on the same graph. As discussed above, the results in Figure 5a suggest that 1,4-diaminobutane counterions bind parallel to the tridecanoic-Glu micelle surface. Fletcher, et al. investigated the binding of trans-1,4-cyclohexanediamine to amino acid-based undecyl-LL-Leucinevalanate micelles. This study showed that trans-1,4-cyclohexanediamine bound to the micelles in a perpendicular fashion with one amine functional group interacting with the anionic micelle surface and the rest of the molecule extending out into free solution [26]. This binding model is shown in Figure 4b. It is likely that the trans-1,4-cyclohexanediamine counterion interacts with the tridecanoic-Glu micelles in a similar manner given the larger micelle hydrodynamic radii measured for this counterion.
Figure 5d plots fb,counterion values and micelle radii versus pH for solutions containing trans-1,2-cyclohexanediamine. The decrease in micelle radii with increasing pH observed for solutions containing trans-1,2-cyclohexanediamine is comparable to that observed with the other counterions. This decrease is likely caused by changes in headgroup charge that occur when the headgroup’s γ-carboxylic acid functional groups deprotonate. One notable difference, though, between trans-1,2-cylcohexanediamine and trans-1,4-cyclohexanediamine binding to the micelles is that the maximum fb,counterion values are 0.52 and 0.80, respectively. In other words, the trans-1,2-cyclohexanediamine counterion’s maximum fb,counterion value is smaller than the corresponding 1,4 isomer. This difference is likely attributable to the amine functional groups in the two isomers having different pKa values. The ionization constants for trans-1,2-cyclohexanediamine are pKa1 = 6.47 and pKa2 = 9.94 [50]. Corresponding values for trans-1,4-cylcohexanediamine are 9.94 and 10.8, respectively. The pKa1 value for the 1,2 isomer is smaller than the 1,4 isomer because in the former, the amine functional groups are on adjacent carbon atoms and thus deprotonation allows an intramolecular hydrogen bond to form. Therefore, in the pH range of 7.0 to 10.0, the charge of the trans-1,2-cyclohexanediamine counterions are predominately +1 compared to +2 for trans-1,4-cyclohexanediamine. The +1 trans-1,2-cyclohexanediamine counterions are thus less attracted to the anionic micelle surface than the +2 counterions of the 1,4 isomer and as a result, the fb,counterion values for the 1,2 isomer are smaller than the 1,4 isomer in the pH range shown in Figure 5.
Figure 4a compares the radii of the tridecanoic-Glu micelles in solutions containing trans-1,2-cyclohexanediamine and trans-1,4-cyclohexanediamine counterions. Throughout the pH range investigated, the micelles were larger in solutions containing the 1,2 isomer. Recall from above, tridecanoic-Glu CMC values were also lower in solutions containing trans-1,2-cyclohexanediamine and larger in solutions containing the 1,4-isomer. The CMC difference was attributed to the 1,2-isomer forming simultaneous hydrogen bonds with the two carboxylate functional groups in the surfactant’s headgroup. This interaction is shown in Figure 4c. At the micelle surface, the simultaneous binding of the trans-1,2-cyclohexanediamine counterion to both carboxylate functional groups may neutralize the headgroup negative charge more effectively compared to counterions that only interact with one of the carboxylates. The corresponding reduced repulsion between the monomer headgroups may then allow more monomers to aggregate, thus increasing the radii of the tridecanoic-Glu micelles.

4. Conclusions

NMR spectroscopy, molecular modeling, and conductivity measurements were used to investigate the physical properties of tridecanoic-Glu micelles. Intramolecular hydrogen bonding within the surfactant headgroup caused the surfactant’s primary carboxylic acid proton to be significantly less acidic than free glutamic acid. Intermolecular hydrogen bonding between monomers at the micelle surface also likely affected the acidity of the γ carboxylic acid protons at concentrations above the CMC. Changes in micelle radii, the mole fraction of diamine counterions bound to the micelles, and the surfactant’s CMC were observed with increasing solution pH. These changes resulted from the tridecanoic-Glu headgroup charge changing from −1 to −2 as pH was increased.

Supplementary Materials

The following supporting information can be downloaded at: https://www.mdpi.com/article/10.3390/colloids8030038/s1, Table S1. pKa values for diamine counterions. Figure S1. Proton NMR spectrum of tridecanoic-Glu and 1,4-diaminobutane at pH 7.0. Figure S2. Reaction scheme for the synthesis of tridecanoic-Glu. Figure S3. NMR diffusion plot for a mixture containing 50.0 mM tridecanoic-Glu and 50.0 mM 1,4-diaminobutane. Figure S4. Conductivity versus concentration plot for a mixture containing tridecanoic-Glu and 1,4-diaminobutane at pH 7.0. Figure S5. Initial tridecanoic-Glu surfactant structure used in the MD simulation analysis. Figure S6. Hydrogen bond distance plots from the MD simulation analyses. WATERGATE pulse sequence code and parameters. Pulse sequence code and parameters used in the NMR diffusion experiments.

Author Contributions

Conceptualization, E.J.B., F.H.B. and K.F.M.; methodology, Y.F., E.J.B., F.H.B. and K.F.M.; software, Y.F., E.J.B., F.H.B. and K.F.M.; validation, J.D.M., R.M.R. and S.R.F.; formal analysis, J.D.M., R.M.R. and S.R.F.; investigation, J.D.M., R.M.R. and S.R.F.; resources, E.J.B., F.H.B. and K.F.M.; data curation, E.J.B., F.H.B. and K.F.M.; writing—original draft preparation, K.F.M.; writing—review and editing, Y.F., E.J.B., F.H.B. and K.F.M.; visualization, J.D.M., R.M.R., S.R.F. and Y.F.; supervision, E.J.B., F.H.B. and K.F.M.; project administration, E.J.B., F.H.B. and K.F.M.; funding acquisition, E.J.B., F.H.B. and K.F.M. All authors have read and agreed to the published version of the manuscript.

Funding

This research was funded by National Science Foundation grants #2203506 and #2203652 and by a Robert A. Welch Chemistry Departmental Grant #BT-0041 awarded to the Texas A&M University Corpus Christi Chemistry Program.

Data Availability Statement

Supporting data are archived on a OneDrive at Texas A&M Corpus Christi. Contact Fereshteh Billiot ([email protected]) for access.

Acknowledgments

We acknowledge the generosity and support of the Ralph E. Klingenmeyer family.

Conflicts of Interest

The authors declare no conflicts of interest.

References

  1. Bettenhausen, C. Switching to Sustainable Surfactants. Chem. Eng. News 2022, 100, 1–12. Available online: https://cen.acs.org/business/specialty-chemicals/Switching-sustainable-surfactants/100/i15 (accessed on 5 June 2024).
  2. Nagtode, V.S.; Cardoza, C.; Yasin, H.K.A.; Mali, S.N.; Tambe, S.M.; Roy, P.; Singh, K.; Goel, A.; Amin, P.D.; Thorat, B.R.; et al. Green Surfactants (Biosurfactants): A Petroleum-Free Substitute for Sustainability. Comparison, Applications, Market, and Future Prospects. ACS Omega 2023, 8, 11674–11699. [Google Scholar] [CrossRef]
  3. Pinheiro, L.; Faustino, C. Amino Acid-Based Surfactants for Biomedical Applications. In Application and Characterization of Surfactants; Najjar, R., Ed.; IntechOpen: London, UK, 2017. [Google Scholar] [CrossRef]
  4. Soni, S.; Agrawal, P.; Haider, T.; Singh, A.P.; Rohit, R.; Kumar Patra, R.K.; Dubey, H.; Namdeo, S.; Vishwakarma, M.; Soni, V. The Potential of Biosurfactants in the Pharmaceutical Industry: A Review. Bioequiv. Bioavailab. Int. J. 2022, 6, 1–15. [Google Scholar] [CrossRef]
  5. Takassi, M.A.; Zargar, G.; Madani, M.; Zadehnazari, A. The Preparation of an Amino Acid-Based Surfactant and its Potential Application as an EOR Agent. Petrol. Sci. Technol. 2017, 35, 385–391. [Google Scholar] [CrossRef]
  6. Madani, M.; Zargar, G.; Takassi, M.A.; Daryasafar, A.; Wood, D.A.; Zang, Z. Fundamental Investigation of an Environmentally-Friendly Surfactant Agent for Chemical Enhanced Oil Recovery. Fuel 2019, 238, 186–197. [Google Scholar] [CrossRef]
  7. Tackie-Otoo, B.N.; Mohammed, M.A.A. Experimental Investigation of the Behavior of a Novel Amino Acid-based Surfactant Relevant to EOR Application. J. Mol. Liq. 2020, 316, 133848. [Google Scholar] [CrossRef]
  8. Sharma, H.; Tyagi, R. Safer Surfactants, Based on Amino Acids for Cleaner Environment: A Review. J. Biochem. Int. 2018, 5, 28–56. Available online: www.ikprress.org/index.php/JOBI/article/view/4315 (accessed on 5 June 2024).
  9. Bhadani, A.; Kafle, A.; Ogura, T.; Akamatsu, M.; Sakai, K.; Sakai, H.; Abe, M. Current Perspective of Sustainable Surfactants based on Renewable Building Blocks. Curr. Opin. Colloid Interface Sci. 2020, 45, 124–135. [Google Scholar] [CrossRef]
  10. Mori, R. Replacing All Petroleum-based Chemical Products with Natural Biomass-Based Chemical Products: A Tutorial Review. RSC Sustain. 2023, 1, 179–212. [Google Scholar] [CrossRef]
  11. Gaudin, T.; Lu, H.; Fayet, G.; Berthauld-Drelich, A.; Rotureau, P.; Pourceau, G.; Wadouachi, A.; Van Hecke, E.; Nesterenko, A.; Pezron, I. Impact of the Chemical Structure on Amphiphilic Properties of Sugar-Based Surfactants: A Literature Overview. Adv. Colloid Interface Sci. 2019, 270, 87–100. [Google Scholar] [CrossRef]
  12. Tripathy, D.B.; Mishra, A.; Clark, J.; Farmer, T. Synthesis, Chemistry, Physiochemical Properties, and Industrial Applications of Amino Acid Surfactants: A Review. Comptes Rendus Chim. 2017, 2, 112–130. [Google Scholar] [CrossRef]
  13. Guo, J.; Sun, L.; Zhang, F.; Sun, B.; Xu, B.; Zhou, Y. Review: Progress in Synthesis, Properties and Application of Amino Acid Surfactants. Chem. Phys. Lett. 2022, 794, 139484–139499. [Google Scholar] [CrossRef]
  14. Bustelo, M.; Pinazoa, A.; Manresad, M.A.; Mitjansb, M.; Vinardellb, M.P.; Péreza, L. Monocatenary Histidine-based Surfactants: Role of the Alkyl Chain Length in Antimicrobial Activity and their Selectivity over Red Blood Cells. Colliods Surfaces A 2017, 532, 501–509. [Google Scholar] [CrossRef]
  15. Lewis, C.; Hughes, B.H.; Vasquez, M.; Wall, A.M.; Northrup, V.L.; Witzleb, T.J.; Billiot, E.J.; Fang, Y.; Billiot, F.H.; Morris, K.F. Effect of pH on the Binding of Sodium, Lysine, and Arginine Counterions to L-Undecyl Leucinate Micelles. J. Surfactants Deterg. 2016, 19, 1175–1188. [Google Scholar] [CrossRef]
  16. Rothbauer, G.A.; Rutter, E.A.; Reuter-Seng, C.; Vera, S.; Billiot, E.J.; Fang, Y.; Billiot, F.H.; Morris, K.F. Nuclear Magnetic Resonance Investigation of the Effect of pH on Micelle Formation by the Amino Acid-Based Surfactant Undecyl L-Phenylalaninate. J. Surfactants Deterg. 2018, 21, 139–153. [Google Scholar] [CrossRef] [PubMed]
  17. Maynard-Benson, A.; Alekisch, M.; Wall, A.; Billiot, E.J.; Billiot, F.H.; Morris, K.F. Characterization of Micelle Formation by the Single Amino Acid-Based Surfactants Undecanoic L-Isoleucine and Undecanoic L-Norleucine in the Presence of Diamine Counterions with Varying Chain Lengths. Colloids Interfaces 2023, 7, 28. [Google Scholar] [CrossRef]
  18. Bonini, M.; Gabbani, A.; Del Buffa, S.; Ridi, F.; Baglioni, R.; Holmberg, K. Adsorption of Amino Acids and Glutamic Acid-Based Surfactants on Imogolite Clays. Langmuir 2017, 33, 2411–2419. [Google Scholar] [CrossRef]
  19. Ikeda, N.; Aramaki, K. Hydrogel Formation by Glutamic-acid-based Organogelator Using Surfactant-Mediated Gelation. J. Oleo Sci. 2022, 71, 1169–1180. [Google Scholar] [CrossRef]
  20. Zhang, N.; Chen, Y.; Ji, X.; Han, Y.; Wang, Y. Partition of Glutamic Acid-Based Single-Chain and Gemini Amphiphiles into Phospholipid Membranes. Langmuir 2018, 45, 13652–13661. [Google Scholar] [CrossRef]
  21. Ananthapadmanabhan, K.P. Amino-Acid Surfactants in Personal Cleansing (Review). Tenside Surfactants Deterg. 2019, 56, 378–386. [Google Scholar] [CrossRef]
  22. Ali, A.F.; Danielson, N.D. Liquid Chromatography of Short Chain Carboxylic Acids using a Glutamic Acid Surfactant Coated C18 Stationary Phase. Talanta 2020, 213, 120807. [Google Scholar] [CrossRef] [PubMed]
  23. Waters, D.; Yuan, M. Personal Care Compositions Comprising Naturally Derived Surfactant Systems; World Intellectual Property Organization: Geneva, Switzerland, 2021; WO2021245159. [Google Scholar]
  24. O’Lenick, A.J., Jr. Carboxylated Surfactants in Personal Care Applications. United. U.S. Patent US6642193, 11 November 2003. [Google Scholar]
  25. Arkhipov, V.P.; Arkhipov, R.V.; Filippov, A. Dynamic and Molecular Association in Premicellar Aqueous Solutions of Dicarboxylate Amino Acid-Based Surfactant as Studied by 1H NMR. Magn. Reson. Chem. 2021, 60, 359–368. [Google Scholar] [CrossRef] [PubMed]
  26. Fletcher, J.; Mahant, G.; Witzleb, T.; Busche, R.; Garcia, M.; Fang, Y.; Billiot, E.J.; Billiot, F.H.; Morris, K.F. NMR Investigation of Counterion Binding to Undecyl LL-Leucinevalanate Micelles. J. Dispers. Sci. Technol. 2020, 45, 284–295. [Google Scholar] [CrossRef]
  27. Lépori, C.M.O.; Correa, N.M.; Silber, J.J.; Falcone, R.D.; López-López, M.; Moyá, M.L. Influence of the AOT Counterion Chemical Structure on the Generation of Organized Systems. Langmuir 2020, 36, 10785–10793. [Google Scholar] [CrossRef] [PubMed]
  28. Gnezdilov, O.I.; Zuev, Y.F.; Zueva, O.S.; Potarikina, K.S.; Us’yarov, O.G. Self-Diffusion of Ionic Surfactants and Counterions in Premicellar and Micellar Solutions of Sodium, Lithium, and Cesium Dodecyl Sulfates as Studied by NMR Diffusometry. Appl. Magn. Reson. 2010, 40, 91–103. [Google Scholar] [CrossRef]
  29. Bachofer, S.J. Micelle Formation of Tetradecyltrimethylammonium X-benzoate Surfactants: Benzoate Counterion Substituent Effects. J. Surfactants Deterg. 2023, 27, 259–267. [Google Scholar] [CrossRef]
  30. Li, Y.; Zou, A.; Ye, R.; Mu, B. Counterion-Induced Changes to the Micellization of Surfactin-C16 Aqueous Solution. J. Phys. Chem. B 2009, 113, 15272–15277. [Google Scholar] [CrossRef] [PubMed]
  31. Bodet, J.F.; Scheper, W.M.; Oglesby, J.L.; Murch, B.P.; Kacher, M.L. Dishwashing Detergent Compositions Containing Organic Polyamines; World Intellectual Property Organization: Geneva, Switzerland, 2000; WO2000063334. [Google Scholar]
  32. Gao, P.; Karim, A.; Hassan, F.; Forbes, J.C. Oral Pharmaceutical Compositions Comprising a Low-Water-Soluble Drug, a Solvent, a Fatty Acid and an Organic Amine; World Intellectual Property Organization: Geneva, Switzerland, 2002; WO2002083177. [Google Scholar]
  33. Perinelli, D.R.; Cespi, M.; Lorusso, N.; Palmieri, G.F.; Bonacucina, G.; Blasi, P. Surfactant Self-Assembling and Critical Micelle Concentration: One Approach Fits All? Langmuir 2020, 21, 5745–5753. [Google Scholar] [CrossRef] [PubMed]
  34. Han, G.E.; Priefer, R. A Systematic Review of Various pKa Determination Techniques. Int. J. Pharm. 2023, 635, 112783. [Google Scholar] [CrossRef]
  35. Lui, X.; Yu, Q.; Song, A.; Dong, S.; Hao, J. Progress in Nuclear Magnetic Resonance Studies of Surfactant Systems. Curr. Opin. Colloid Interface Sci. 2020, 45, 14–27. [Google Scholar] [CrossRef]
  36. Morris, K.F.; Becker, B.A.; Tarus, J.; Almeida, V.; Froberg, A.; Larive, C.K. Using NMR Spectroscopy to Develop Insights into the Intermolecular Interactions Underlying Electrokinetic Chromatography. Anal. Chem. 2005, 77, 254A–263A. [Google Scholar] [CrossRef]
  37. Fritz, S.R. Characterization of Green Surfactants with Dicarboxylate Polar Head. Master’s Thesis, Texas A&M University-Corpus Christi, Corpus Christi, TX, USA, 2023. [Google Scholar]
  38. Piotto, M.; Saudek, V.; Skienar, V. Gradient-Tailored Excitation for Single-Quantum NMR Spectroscopy of Aqueous Solutions. J. Biomol. NMR 1992, 2, 661–665. [Google Scholar] [CrossRef] [PubMed]
  39. Stilbs, P. Diffusion and Electrophoretic NMR; Walter de Gruyter: Boston, MA, USA, 2019. [Google Scholar] [CrossRef]
  40. Wong, T.C. Micellar Systems: Nuclear Magnetic Resonance Spectroscopy. In Encyclopedia of Surface and Colloid Science; Taylor & Francis: Boca Raton, FL, USA, 2006. [Google Scholar]
  41. Wu, D.; Chen, A.; Johnson, C.S., Jr. An Improved Diffusion-Ordered Spectroscopy Experiment Incorporating Bipolar-Gradient Pulses. J. Magn. Reson. 1995, 115, 260–264. [Google Scholar] [CrossRef]
  42. Wilkins, D.K.; Grimshaw, S.B.; Receveur, V.; Dobson, C.M.; Jones, J.A.; Smith, L.J. Hydrodynamic Radii of Native and Denatured Proteins Measured by Pulse Field Gradient NMR Techniques. Biochemistry 1999, 38, 16424–16431. [Google Scholar] [CrossRef] [PubMed]
  43. Case, D.A.; Babin, V.; Berryman, J.T.; Betz, R.M.; Cai, Q.; Cerutti, D.S.; Cheatham, T.E., III; Darden, T.A.; Duke, R.E.; Gohlke, H.; et al. AMBER 16; University of California: San Francisco, CA, USA, 2016. [Google Scholar]
  44. Rumble, J. CRC Handbook of Chemistry and Physics, 103rd ed.; CRC Press: Boca Rotan, FL, USA, 2022. [Google Scholar]
  45. Tao, L.; Han, J.; Tao, F. Correlations and Predictions of Carboxylic Acid pKa Values Using Intermolecular Structure and Properties of Hydrogen-Bonded Complexes. J. Phys. Chem. A 2008, 112, 775–782. [Google Scholar] [CrossRef]
  46. Huque, F.T.; Plats, J.A. The Effect of Intramolecular Interactions on Hydrogen Bond Acidity. Org. Biomol. Chem. 2003, 1, 1419–1424. [Google Scholar] [CrossRef] [PubMed]
  47. Ghosh, S.; Ray, A.; Pramanik, N. Self-Assembly of Surfactants: An Overview on General Aspects of Amphiphiles. Biophys. Chem. 2020, 265, 106429. [Google Scholar] [CrossRef] [PubMed]
  48. Brycki, B.; Szulc, A.; Koenig, H.; Kowalczyk, I.; Pospieszny, T.; Górka, S. Effect of the Alkyl Chain Length on Micelle Formation for bis(N-alkyl-N,N-dimethylethylammonium)ether dibromides. Comptes Rendus Chim. 2019, 5, 386–392. [Google Scholar] [CrossRef]
  49. Hoque, J.; Gonuguntla, S.; Yarlagadda, V.; Aswal, V.; Haldar, J. Effect of Amide Bonds on the Self Assembly of Gemini Surfactants. Phys. Chem. Chem. Phys. 2014, 16, 11279–11288. [Google Scholar] [CrossRef]
  50. Armarego, W.L.F.; Chai, C.L.L. Purification of Lab Chemicals, 6th ed.; Elsevier: Burlington, VT, USA, 2009. [Google Scholar] [CrossRef]
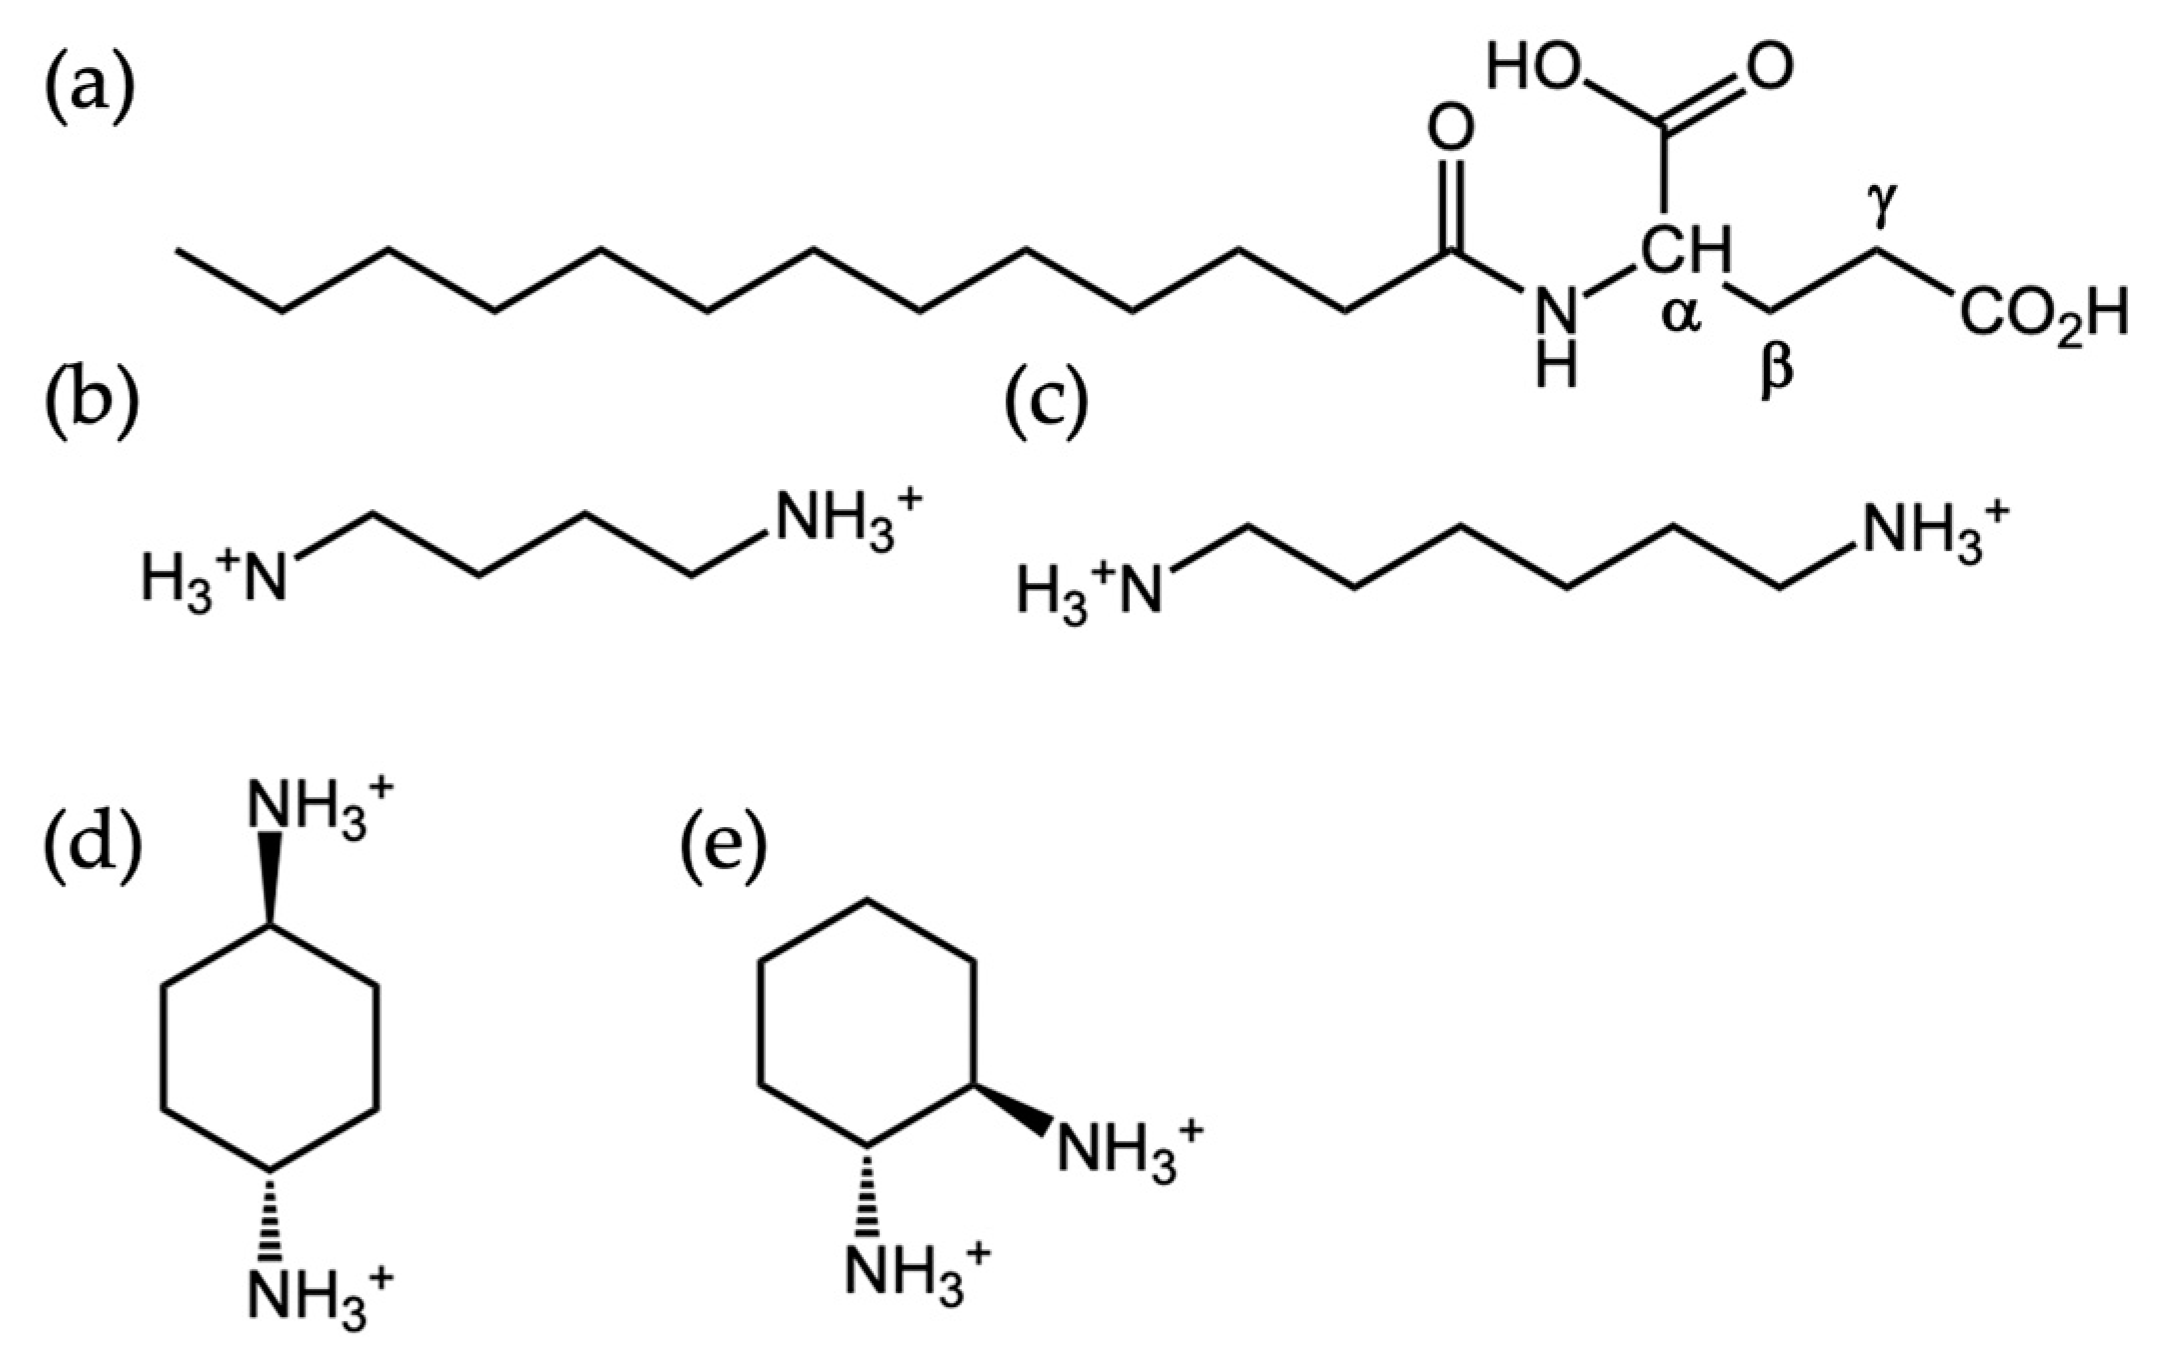
Figure 1. Chemical structures of (a) tridecanoic-Glutamic Acid, (b) 1,4-diaminobutane, (c) 1,6-diaminohexane, (d) trans-1,4-cylcohexanediamine, and (e) trans-1,2-cyclohexanediamine. Surfactant amino acid proton labels α, β, and γ are included in structure (a).
Colloids 08 00038 g001
Figure 2. NMR titration curves for (a) primary carboxylic acid in monomeric tridecanoic-Glu, (b) gamma carboxylic acid in monomeric tridecanoic-Glu, and (c) gamma carboxylic acid in micellar tridecanoic-Glu. α and γ are labels for the protons in the amino acid headgroup. A surfactant structure with these proton labels is shown in Figure 1a.
Colloids 08 00038 g002
Figure 3. Low-energy tridecanoic-Glu monomer structures obtained from a molecular modeling conformational search. (a) Structure with the lowest energy of −29.9 kcal·mol−1. (b) Structure with the second lowest energy of −27.0 kcal·mol−1. (c) Structure with the third lowest energy of −24.2 kcal·mol−1.
Colloids 08 00038 g003
Figure 4. (a) Comparison of micelle hydrodynamic radii in 1,4-diaminobutane, trans-1,4-cyclohexanediamine, and trans-1,2-cyclohexanediamine-containing solutions. (b) Model of 1,4-diaminobutane and trans-1,4-cyclohexanediamine binding to tridecanoic-Glu micelles. (c) Model of 1,2-diaminobutane and binding to tridecanoic-Glu micelles. The blue arrows in (b) depict the distance corresponding to the micelle hydrodynamic radii, Rh.
Colloids 08 00038 g004
Figure 5. Micelle radii, Rh, and mole fraction of micelle-bound counterions, fb,counterion, for tridecanoic-Glu micelles and (a) 1,4-diaminobutane, (b) 1,6-diaminohexane, (c) trans-1,4-cyclohexanediamine, and (d) trans-1,2-cyclohexanediamine.
Colloids 08 00038 g005
Figure 6. (a) Proposed model of 1,4-diaminobutane binding to tridecanoic-Glu; (b) proposed model of 1,6-diaminohexane binding to tridecanoic-Glu.
Colloids 08 00038 g006
Table 1. pKa values for free solution L-Glutamic acid from the literature [44]. Experimental pKa values for the monomeric and micellar surfactants are also shown. n/a is reported for the micellar primary CO2H functional group because the surfactant precipitated from solution before significant changes in the headgroup’s Hα proton were observed.
Primary-CO2HGamma-CO2H
L-Glutamic Acid2.24.3
Tridecanoic-Glu Monomer4.2 ± 0.34.7 ± 0.4
Tridecanoic-Glu Micellesn/a6.9 ± 0.6
Table 2. Critical Micelle Concentration (CMC) values for solutions containing either tridecanoic-Glutamic acid or undecanoic-Glutamic acid surfactants and 1,4-diaminobutane, 1,6-diaminhexane, trans-1,4-diaminocylohexane, and trans-1,2-diaminocyclohexane counterions. Measurements were performed at pH 6.0 and 7.0.
Tridecanoic-Glutamic Acid
CounterionCMC at pH 6.0 (mM)CMC at pH 7.0 (mM)
1,4-diaminobutane3.2 ± 0.16.8 ± 0.3
1,6-diaminohexane3.4 ± 0.66.3 ± 0.5
trans-1,4-diamocyclohexane3.1 ± 0.16.2 ± 0.3
trans-1,2-diamocyclohexane1.3 ± 0.22.1 ± 0.1
Undecanoic-Glutamic Acid
CounterionCMC at pH 6.0 (mM)CMC at pH 7.0 (mM)
1,4-diaminobutane22.1 ± 0.225.2 ± 0.5
1,6-diaminohexane19.6 ± 0.422.2 ± 0.5
trans-1,4-diamocyclohexane17.5 ± 0.122.1 ± 0.2
trans-1,2-diamocyclohexane11.9 ± 0.213.9 ± 0.2
Disclaimer/Publisher’s Note: The statements, opinions and data contained in all publications are solely those of the individual author(s) and contributor(s) and not of MDPI and/or the editor(s). MDPI and/or the editor(s) disclaim responsibility for any injury to people or property resulting from any ideas, methods, instructions or products referred to in the content.