Abstract
Amphiphilic silk fibroin (SF) forms stable adsorption layers at the air–water interface. The range of the investigated protein concentrations can be divided into two parts according to the peculiarities of the surface layer properties. At protein concentrations from 0.0005 to 0.01 mg/mL, the dynamic surface elasticity monotonically increases with the concentration and surface age and reaches values of up to 220 mN/m. In this range, the adsorption layer compression leads to a fast increase of the surface pressure. In the second part (>0.01 mg/mL), the surface elasticity decreases again and the kinetic dependences of the film thickness and adsorbed amount change only a little. In this case, the layer compression leads only to a slight increase of the surface pressure. These two types of behavior can be attributed to the distinctions in the protein aggregation in the surface layer. Atomic force microscopy (AFM) investigations of the layers transferred from the liquid surface onto a mica surface by the Langmuir–Schaefer method show some peculiarities of the layer morphology in the intermediate concentration range (~0.02 mg/mL).
1. Introduction
Bombyx mory silk fibroin (SF) is one of the most frequently used proteins in biotechnology [1,2,3,4,5,6]. Numerous SF applications, starting from enzyme immobilization and ranging to controlled drug release [7,8,9,10,11] and the scaffold formation for tissue engineering, have been described in the literature [2,12,13,14]. They are based on the high biocompatibility of the protein, its unique mechanical properties, and the ability of self-assembly [15]. The high tensile strength, breaking strain, and high toughness of fibroin fibers are comparable to or even exceed the corresponding properties of synthetic fibers such as Kevlar [3,16].
The unique properties of silk fibroin are caused by specific features of its primary structure. SF is a fibrous protein consisting mainly of glycine (43%), alanine (30%), serine (12%) and tyrosine (4.8%) residues [15]. Glycine-rich hydrophilic blocks alternate with alanine-rich hydrophobic blocks. In the primary structure of SF, one can distinguish heavy chains (H-chains, 325–395 kDa) connected to light chains (L-chains, 25–26 kDa) via disulfide bonds [5]. A glycoprotein (P25, 25 kDa) is linked to the H-L complex via non-covalent bonding, mainly of hydrophobic nature [17,18]. Repetitive structures such as GAGAGS, GAGAGY, and GAGAGV are essential domains in the H-chain providing the formation of anti-parallel β-sheets due to hydrogen bonds [19].
Fibroin exists in three crystalline structures: silk I, silk II, and silk III. During the silkworm’s spinning process, there occurs a restructuring of the fibroin secondary structure, and a transition from the water-soluble silk I to the fibrous silk II. Silk II is insoluble in water and predominantly composed of antiparallel β-sheets [20]. At the liquid–air interface, SF forms a triple helical structure of monoclinic symmetry—silk III [21,22].
Various modifications of fibroin and its tendency to self-assemble create the possibility to obtain a wide range of different micro- and nano-objects [3,15,19,23,24,25,26]. Due to the alternation of hydrophobic and hydrophilic segments, SF can form micelle-like aggregates, even in dilute solutions (~0.5 wt.%), of sizes in the range of 20–200 nm [27]. The increase of protein concentration leads to an increase of micelles and subsequent transition to a gel phase [28]. This self-assembly is a complex process and there is a large set of parameters affecting it: the solution’s ionic strength, pH, temperature, and hydrodynamic shear forces [24,29,30,31,32,33,34]. When the pH decreases from 6.8 to 4.8, the secondary structure of aggregates can change due to the formation of β-sheets [33]. In this case, the micelles are transformed into fibrils [27,33]. The addition of small seeds of fibrillar aggregates and a temperature increase can lead to the formation of amyloid SF structures [30,31,32,33,34]. Binding of divalent cations as Ca2+ and Mg2+ by fibroin chains promotes the formation of a stable silk gel, whereas binding of Na+, K+ destabilize the gel network [19]. Mixing of SF with polyvinyl alcohol and ethanol leads to the formation of nanoparticles or sponges of different morphology [35].
The adsorption of amphiphilic SF molecules at the air–water interface can lead to their rearrangement and the subsequent formation of different surface structures [21,36]. At relatively low surface pressures (16.7 mN/m), the surface layer contains silk helices with their main axes parallel to the surface while with the increase of surface pressure (up to 34 mN/m), lamellar crystals with the silk II structure can be observed. The SF adsorption layers near equilibrium are characterized by a high modulus of the surface elasticity, leading to the high foam stability of SF solutions [37,38,39]. At the same time, both shear and dilatational surface moduli decrease at high surface concentrations and surface pressures due to the partial destruction of the adsorption layer structure [36,37,40].
The characterization of the surface properties of SF solutions is mainly limited to measurements of the dynamic surface tension and surface elasticity close to equilibrium [37,38,39]. At the same time, there is a lack of information on the formation mechanism of the adsorption layer and the changes of its structure at the approach to equilibrium. The investigation of these processes by measurement of the kinetic dependencies of the dynamic surface elasticity and surface pressure, together with the simultaneous determination of the morphology and compression isotherms of SF adsorption layers, was the main aim of this study. This approach also allowed us to link the SF surface morphology with the mechanical properties of the adsorption layer and thereby to propose a design of SF-based biomaterials in particular of thin films for medical purposes.
2. Materials and Methods
Silk fibroin was isolated from natural raw materials. Fresh domestic Bombyx mori cocoon shells were supplied by a farm cooperative (Nalchik, Russia). Aqueous SF solutions were obtained by a procedure described in details by Rockwood et al. [41]. As the first step of fibroin dissolution, sericin was removed by boiling Bombyx mori cocoon shells in 0.2 wt.% Na2CO3 solution, followed by thorough rinsing with multiple portions of deionized water. Once degummed, the cocoons were dried at room temperature for 24 h and dissolved after that in a 9.3 M LiBr solution at 60 °C for 4 h. Afterwards, the resulting solution was dialyzed for three days against water using a cellulose membrane (Sigma-Aldrich, Darmstadt, Germany). The obtained solution was twice centrifuged (16,000× g, 4 °C, 30 min). The molecular weight of silk fibroin was about 90–140 kDa. The concentration of the solution after centrifugation (1 wt.%) was determined by a gravimetric analysis. The protein aqueous solutions were stored in a refrigerator for no more than 20 days at a temperature of 4 °C.
The investigated fibroin solutions of given concentrations were prepared in phosphate buffer. NaH2PO4 and Na2HPO4 (Sigma Aldrich, Darmstadt, Germany) were used to prepare buffer solutions with an ionic strength of 0.02 M and pH 7. The ionic strength of the solutions was regulated by the addition of NaCl. Sodium chloride (Vekton, St. Petersburg, Russia), sodium carbonate (Vekton, St. Petersburg, Russia), and lithium bromide (Vekton, St. Petersburg, Russia) were heated in an oven at 450 °C to remove organic impurities. Triply distilled water was used to prepare all solutions. All the measurements were performed at room temperature.
The oscillating ring method was used to determine kinetic dependences of the dynamic surface elasticity [42]. The periodic movement of the glass ring partially immersed into solution produces sinusoidal changes of the surface area of the meniscus at the inner surface of the ring. The induced oscillations of the surface tension were measured by the Wilhelmy plate method. The accuracy of the surface tension measurements was 0.5 mN/m; this led to an error in the dynamic surface elasticity measurements of about 5%. If the amplitude of surface area changes was much less than the area of the ring, the dilational dynamic surface elasticity was determined by the following equation:
where is the amplitude of surface tension oscillations and is the relative surface area. The real and imaginary parts of the dynamic surface elasticity were calculated from the phase shift between the surface tension and surface area oscillations:
For SF adsorption layers, the imaginary part of the dynamic dilatational surface elasticity was much less than the real part. Therefore, only the modulus of dynamic surface elasticity is discussed below. The oscillation frequency was 0.05 Hz and the relative surface area change was close to 5% for all the measurements in this work.
The compression isotherms of SF adsorption layers were measured using an ISR instrument equipped with a Wilhelmy plate (KSV NIMA, Espoo, Finland). The accuracy of the surface tension measurements was ±0.2 mN/m. The adsorption layer compression started 5 h after the SF solution was placed into a Langmuir trough. The speed of the barrier along the brims of the trough to generate surface compressions and expansions was 10 mm/min.
Kinetic dependences of the ellipsometric angles ψ and Δ were determined using the null-ellipsometer Multiskop (Optrel GBR, Kleinmachnow, Germany). The measurements were performed at a single wavelength of 632.8 nm and a fixed compensator position (±45°) using a 2-zone averaging nulling scheme [43]. The angle of incidence was kept constant for all the ellipsometric measurements (49°) and was close to the Brewster angle.
Elliptically polarized light consists of two components with the vectors of the electric field oscillating parallel and perpendicular to the plane of incidence. The reflection of light from the liquid surface induces alterations in both the phase and amplitude of the two components. These changes depend on the optical characteristics of the interface and can be described by two ellipsometric angles, ψ and Δ. These angles are associated with the reflectivity coefficients of the parallel and perpendicular light components, rp and rs, respectively.
The difference Δsurf = Δ − Δ0, where Δ0 is a value for pure water, is approximately proportional to the surface concentration Г [43,44]. Measurements of the kinetic dependencies of both ellipsometric angles ψ and Δ allow determination of the refractive index of the adsorption layer ns as a function of the surface age. In the approximation of a homogeneous film with a thickness d, which is less than the light wavelength, between two bulk phases, the ellipsometric angles can be connected with the thickness and refractive index of the film [44]. The adsorbed amount of the protein can be roughly estimated according to the De Feijter equation [44]:
where is the refractive index of surface layer and is the refractive index of water, and is the refractive index increment of the protein solution.
With the aim to determine the adsorption layer micromorphology by AFM measurements, the SF films were transferred from the air–water interface onto the surface of mica by the Langmuir–Schaefer method. After that, the samples were dried in a desiccator for several days at room temperature. AFM (NT-MDT microscope, NT-MDT Spectrum Instruments, Zelenograd, Russia) measurements were performed in a semi-contact mode.
A Brewster angle microscope (BAM 1 instrument, Nanofilm Technology, Göttingen, Germany) equipped with a 10 mV He-Ne laser was used to obtain information on the macroscopic and mesoscopic morphology of the SF adsorption layers at the air–water interface.
3. Results and Discussion
3.1. Dynamic Surface Elasticity and Dynamic Surface Tension
The dynamic surface tension (Figure 1a) and dynamic surface elasticity (Figure 1b) of SF solutions were measured as functions of time and protein concentration. For low concentrations (0.0005 mg/mL–0.002 mg/mL), an induction period is observed because it takes some time to reach a protein surface concentration corresponding to the beginning of a surface tension decrease. For concentrations higher than 0.002 mg/mL, the induction period disappears as it becomes shorter than the time accessible by the tensiometry method. The dynamic surface tension decreases with the increasing surface age and SF concentration. The surface tension reached 51 mN/m close to equilibrium for the highest concentration studied. The dynamic surface elasticity was a monotonic function of the surface age for all the concentrations studied.
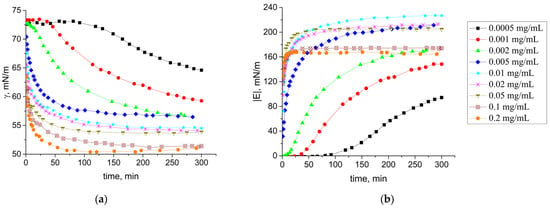
Figure 1.
Kinetic dependencies of the modulus of the dynamic surface tension (a) and surface elasticity modulus (b) of SF solutions at pH 7.0 with concentrations of 0.0005 mg/mL (black squares), 0.001 mg/mL (red circles), 0.002 mg/mL (green triangles), 0.005 mg/mL (blue diamonds), 0.01 mg/mL (cyan stars), 0.02 mg/mL (pink snowflakes), 0.05 mg/mL (dark yellow triangles down), 0.1 mg/mL (orange pentagons), and 0.2 mg/mL (brown crossed diamonds).
At the same time, the dynamic surface elasticity close to equilibrium was a non-monotonic function of the protein concentration and reached a maximum of 220 mN/m at a concentration of 0.01 mg/mL (Figure 1b and Figure 2). This feature is connected with changes of the surface layer structure and transition from almost 2D to 3D film. A similar dependence of the surface elasticity on SF concentration has been previously observed [37]. The dynamic surface elasticity is much higher than the corresponding values for globular protein solutions and dispersions of their fibrils [45,46].
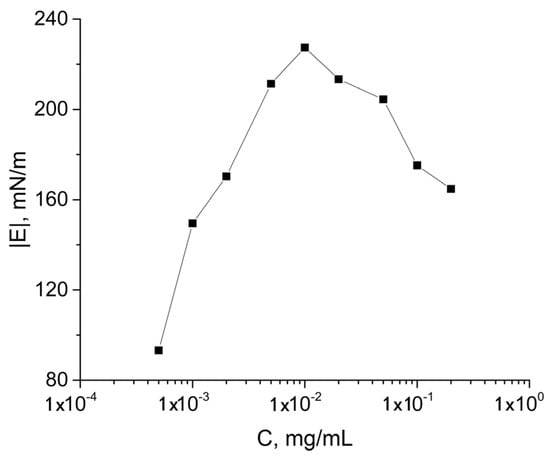
Figure 2.
Modulus of the dynamic surface elasticity as a function of SF concentration.
When the dynamic surface elasticity was plotted as a function of surface pressure (Figure 3), all the dependences coincided at surface pressures lower than 12 mN/m, indicating the same changes of the surface layer structure at least at the beginning of adsorption. This was not true at higher surface pressures when the dynamic surface elasticity depended not only on the surface pressure but also on the protein concentration in the bulk phase. The dynamic surface elasticity reached about 220 mN/m at high surface pressures for SF concentrations lower than 0.05 mg/mL but decreased to 160 mN/m at higher protein concentrations. This decrease of the surface elasticity can be a consequence of the destruction of an almost two-dimensional protein network at the interface and the formation of a thicker jamming surface phase [36,39]. A similar effect but with a stronger dependence of the dynamic surface elasticity on the bulk concentration was observed by Poirier et al. [47] for solutions of sunflower proteins and was also connected with a transition from a 2D network at low surface pressures to a softer 3D structure at the surface pressure increase.
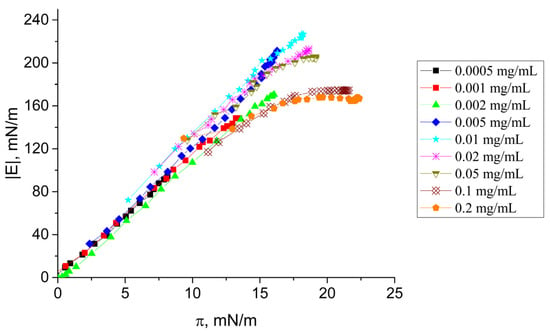
Figure 3.
Dynamic surface elasticity modulus as a function of surface pressure of SF solutions at pH 7.0 with concentrations of 0.0005 mg/mL (black squares), 0.001 mg/mL (red circles), 0.002 mg/mL (green triangles), 0.005 mg/mL (blue diamonds), 0.01 mg/mL (cyan stars), 0.02 mg/mL (pink snowflakes), 0.05 mg/mL (dark yellow triangles down), 0.1 mg/mL (orange pentagons), and 0.2 mg/mL (brown crossed diamonds).
Beyond the transition, the surface elasticity becomes history-dependent and not only concentration-dependent. As a result, the elasticity becomes a multi-valued function of the surface pressure.
Since a SF concentration of 0.02 mg/mL is on the border between two types of behavior caused by different types of self-assembled structures, we chose to investigate the influence of ionic strength on dynamic surface properties. The increase of ionic strength did not lead to significant changes of the dynamic surface elasticity (Figure 4). The obtained results were almost independent of the NaCl concentration in the range 0–0.1 M. It can be assumed that the electrostatic barrier was negligible even without salt at SF concentrations higher than 0.02 mg/mL due to a relatively high protein concentration, and the adsorption layer formation was diffusion controlled. At the same time, it has been shown recently that divalent and trivalent cations can increase the adsorption rate but their effect can be connected not only with a decrease of the electrostatic barrier but also with a better packing density of macromolecules in the surface layer, leading to the observed surface tension decrease [38].
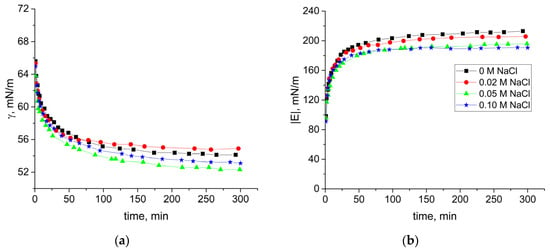
Figure 4.
Kinetic dependencies of the dynamic surface tension (a) and dynamic surface elasticity modulus (b) of 0.02 mg/mL SF solutions at pH 7.0 with concentrations of added NaCl 0 M (black squares), 0.02 M (red circles), 0.05 M (green triangles), and 0.1M mg/mL (blue diamonds).
3.2. Compression Isotherms
Strong changes of the compression isotherms of SF adsorption layers were observed at the transitions from low (<0.002 mg/mL) to medium (0.002–0.02 mg/mL) concentrations and again from medium to high (>0.02 mg/mL) concentrations (Figure 5). At concentrations lower than 0.005 mg/mL, an increase of the surface pressure from zero corresponded to the formation of a two-dimensional network of macromolecules and its gradual transformation into a thicker surface structure (Figure 5 and Figure 6a).
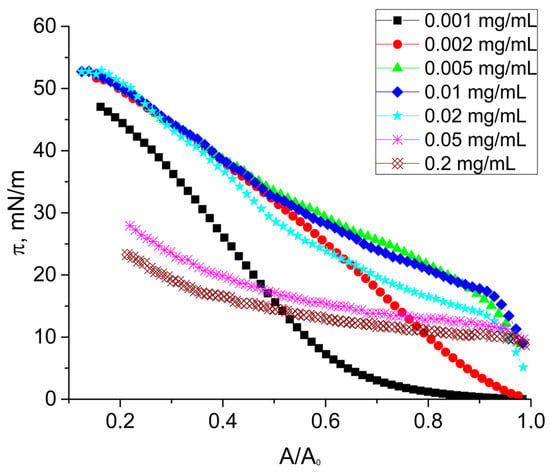
Figure 5.
Dynamic surface pressure of native SF solutions at pH 7.0 with concentrations of 0.001 mg/mL (black squares), 0.002 mg/mL (red circles), 0.005 mg/mL (green triangles), 0.01 mg/mL (blue diamonds), 0.02 mg/mL (cyan stars), 0.05 mg/mL (pink snowflakes), and 0.2 mg/mL (brown crossed diamonds).
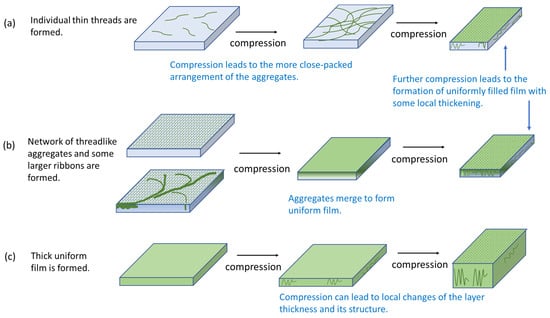
Figure 6.
Scheme of structure changes in SF surface layers under compression for low (<0.002 mg/mL), (a), intermediate (from 0.002 mg/mL to 0.02 mg/mL), (b) and high (>0.02 mg/mL), (c) SF concentrations.
In the second concentration range (0.002–0.02 mg/mL), the surface pressure rapidly increased up to 20 mN/m when the surface area decreased by less than 10% and started to increase more smoothly after that up to 53 mN/m. These two parts of the compression isotherm can be attributed to different structures of the protein adsorption layer (Figure 6b). The surface pressure at the transition between them (~20 mN/m) differed only a little from the surface pressure range where different dependencies of the surface elasticity on surface pressure deviated from each other (Figure 3).
It can be assumed that the first fast compression step in this case also corresponds to the formation of an almost two-dimensional network of macromolecules and possible thicker aggregates in it. At surface pressures higher than about 20 mN/m, the thicker aggregates started to interact, leading to a further, smoother increase of the surface pressure (Figure 6b). This process can lead to a local thickening of the adsorption layer. The spontaneously formed adsorption layer at bulk concentrations higher than 0.02 mg/mL was relatively thick, less rigid and not homogeneous from the very beginning of compression (cf. AFM and ellipsometric results below). In this case, the surface compression can lead to local changes of the layer thickness and its structure and, therefore, to weaker changes of the surface pressure reaching values of only about 30 mN/m (Figure 5 and Figure 6c).
3.3. Ellipsometry
The ellipsometric angle Δ increased monotonically with the surface age and concentration (Figure 7a). Unlike kinetic dependences of the dynamic surface elasticity and surface tension, no induction period was observed in this case, confirming the continuous adsorption process. For low concentrations, we observed fluctuations of the ellipsometric signal at the beginning of the adsorption layer formation. They were presumably caused by the formation of mobile SF aggregates in the surface layer or their adsorption from the bulk phase [48,49]. The difference between the ellipsometric angles Δ near equilibrium for the lowest and for the highest concentrations studied was close to 3°, reflecting significant changes of the SF concentration in the surface layer. Calculations of the adsorption layer thickness according to the model of a homogeneous layer between two bulk phases showed a strong thickness increase from 6 to 40 nm as the protein concentration increased (Figure 7b). Since at low surface lifetimes and concentrations, the thickness of the layer did not exceed 5 nm, it was possible to assume that the first adsorption step corresponded to the formation of a monolayer. This step shifted to smaller surface lifetimes with the increase of concentration. At concentrations less than 0.1 mg/mL, the layer thickness did not reach a steady-state value for 500 min. For concentrations of 0.1 and 0.2 mg/mL, the layer thickness reached a steady-state value during the first hour of the layer formation. A similar tendency was observed for the adsorbed amount (Figure 7c). It monotonically increased with the surface age and concentration, reaching about 10 mg/m2 for the highest investigated concentrations. This means that the adsorbed amount for the air–water interface turned out to be about four times higher than for the air–solid interface [50].
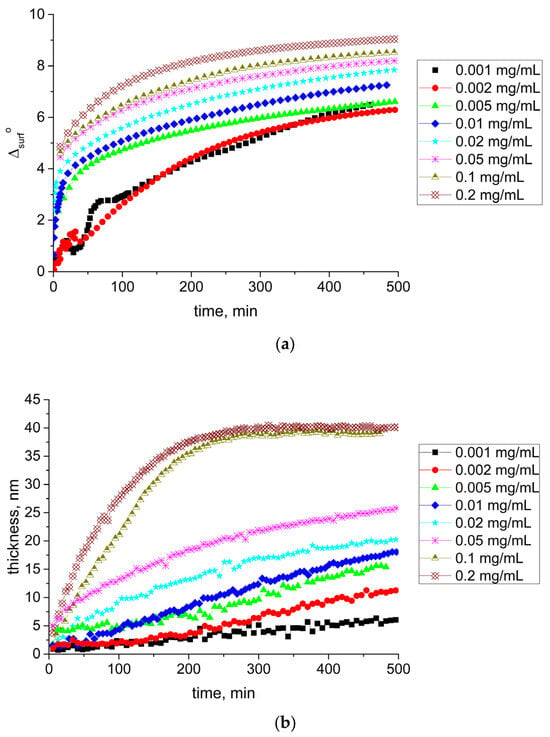
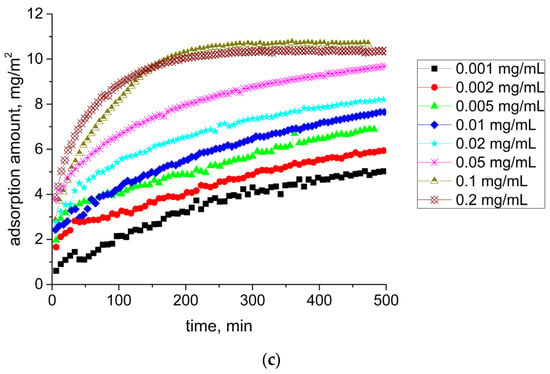
Figure 7.
Kinetic dependencies of ellipsometric angle Δsurf0 (a), film thickness (b), and adsorption (c) for SF solutions at pH 7.0 with concentrations of 0.001 mg/mL (black squares), 0.002 mg/mL (red circles), 0.005 mg/mL (green triangles), 0.01 mg/mL (blue diamonds), 0.02 mg/mL (cyan stars), 0.05 mg/mL (pink snowflakes), 0.1 mg/mL (dark yellow triangles down), and 0.2 mg/mL (brown crossed diamonds).
3.4. Brewster Angle Microscopy and Atomic Force Microscopy
We also traced the evolution of the layer structure using AFM and BAM. For low and intermediate SF concentrations (<0.05 mg/mL), the BAM images (Figure 8) showed only a uniform gray background without any features. At higher concentrations (0.1 and 0.2 mg/mL), the layer destruction could be detected after a slight mechanical disturbance by a thin needle.
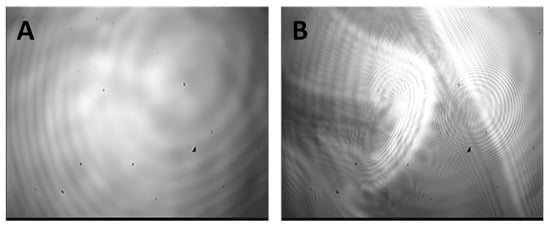
Figure 8.
BAM images of SF adsorption layers for protein concentrations of 0.01 mg/mL (A) and 0.1 mg/mL (B) at 5 h after surface formation and a small mechanical disturbance.
More detailed information was obtained from AFM images. We observed thin threads with local thickenings, even for the lowest protein concentration (Figure 9a). The increase of concentration resulted in the formation of a network with a mesh size of few hundreds of nm (Figure 9b). The 1D surface profile showed that the thread diameter changed in the range of 20–50 nm. At concentrations higher than about 0.005 mg/mL, we observed not only a network of threadlike aggregates, similar to those at lower concentrations, but also some larger ribbons (Figure 9c–e).
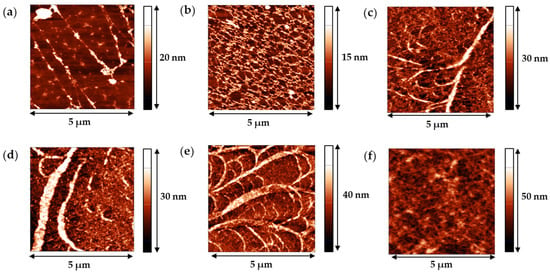
Figure 9.
AFM images of SF films transferred from the air–water interface onto a mica surface. The films were obtained from solutions with concentrations of 0.001 mg/mL (a), 0.002 mg/mL (b), 0.005 mg/mL (c), 0.01 mg/mL (d), 0.02 mg/mL (e), and 0.2 mg/mL (f).
They formed a structure resembling a branched tree. The width of a ribbon varied from 300 nm for a “tree trunk” to 50–100 nm for a short “branch”. The size in Z direction was about 40 nm, in agreement with the ellipsometric measurements. This tree-like structure was presumably the nucleus of a more homogeneous layer, which could be observed at SF concentrations higher than 0.02 mg/mL (Figure 9f).
The formation of a network of surface aggregates at the liquid–gas interface has been observed previously for a few systems. A similar network of surface aggregates with a narrow distribution of cell sizes was observed for adsorbed and spread layers of DNA complexes with hydrophobized polyelectrolytes or cationic surfactants [48,51]. The dynamic surface elasticity of these systems was much lower than that of SF solutions. Although the dynamic elasticity of spread and adsorbed layers of investigated amyloid fibrils was higher than the surface elasticity of native protein solutions [46], it was still about 100 mN/m and much lower than the values for SF solutions. At the same time, the dynamic surface elasticity for SF solutions approached the values for dispersions of solid nanoparticles [52], which was obviously a result of the unique mechanical properties of SF [26]. A few authors showed that SF molecules adsorbed at the air–water interface rearranged from silk I to helical silk III or laminated silk II with a high amount of β-sheet crystallites [21,36]. At the same time, it was not only the type of SF modification that determined the surface properties of its adsorption layers but also the assembly of the protein into supramolecular structures. Threads, ribbons, and more complex surface aggregates, which were observed by AFM, led to different responses of the surface layer to deformation. The highest surface elasticity corresponded to the coexistence of a network of threadlike aggregates and some bigger ribbons. Presumably these surface aggregates contained laminated silk II, which is characterized by a high mechanical strength.
4. Conclusions
The dynamic surface elasticity of SF solutions significantly exceeded the values of previously studied protein solutions and reached up to 220 mN/m. Unlike globular proteins, SF tended to form more varied surface aggregates such as threads, ribbons, and branched tree-like structures. The formation of supramolecular structures at the interface resulted in a variety of mechanical properties of the adsorption layer. Previous studies considered the SF adsorption layer as a soft glassy system and the characteristic features of a viscoelastic behaviour were attributed to the states below, above, and near the glass transition [21,36]. The application of a greater number of experimental techniques in this work allowed us, on one hand, to check the existing hypotheses on the organization of the SF layers, and on the other hand, to connect the mechanical and optical properties of SF adsorption layers with their structure and morphology. It was shown that at the beginning of adsorption, an almost two-dimensional network of SF aggregates was formed at the solution–air interface. In the course of adsorption and with the increase of surface pressure, the layer became more heterogeneous and thicker. The transition from an almost 2D structure to a 3D layer structure could occur rather abruptly at surface pressures close to 15 mN/m in the course of adsorption layer compression in the concentration range 0.005–0.02 mg/mL. At the same time, the structure and properties of SF adsorption layers depended not only on the surface pressure but were history-dependent. The fast adsorption at bulk concentrations higher than 0.02 mg/mL resulted in the formation of a less rigid 3D layer with a lower surface elasticity than at lower SF concentrations.
Author Contributions
Conceptualization, O.Y.M., B.A.N. and R.M.; methodology, B.A.N., A.V.A. and A.R.R.; validation, A.G.B. and K.Y.R.; investigation, A.R.R., K.Y.R. and O.Y.M.; data curation, O.Y.M., A.G.B. and A.V.A.; writing—original draft preparation, B.A.N. and O.Y.M.; writing—review and editing, R.M.; supervision, B.A.N. and O.Y.M. All authors have read and agreed to the published version of the manuscript.
Funding
The work was financially supported by Russian Science Foundation (project No. 23-73-10021).
Data Availability Statement
The data presented in this study are available in the article.
Acknowledgments
The authors are grateful to the resource centers of SPbU (Centre for Optical and Laser Materials Research, the Chemical Analysis and Materials Research Centre, Centre for Diagnostics of Functional Materials for Medicine, Pharmacology and Nanoelectronics, Interdisciplinary Resource Centre for Nanotechnology, Centre for Microscopy and Microanalysis, Centre for Molecular, and Cell Technologies and Centre for Innovative Technologies of Composite Nanomaterials) for the use of their equipment.
Conflicts of Interest
The authors declare no conflicts of interest.
References
- Nilebäck, L.; Chouhan, D.; Jansson, R.; Widhe, M.; Mandal, B.B.; Hedhammar, M. Silk-Silk Interactions between Silkworm Fibroin and Recombinant Spider Silk Fusion Proteins Enable the Construction of Bioactive Materials. ACS Appl. Mater. Interfaces 2017, 9, 31634–31644. [Google Scholar] [CrossRef]
- Chen, K.; Li, Y.; Li, Y.; Pan, W.; Tan, G. Silk Fibroin Combined with Electrospinning as a Promising Strategy for Tissue Regeneration. Macromol. Biosci. 2023, 23, e2200380. [Google Scholar] [CrossRef]
- Cui, C.; Fu, Q.; Meng, L.; Hao, S.; Dai, R.; Yang, J. Recent Progress in Natural Biopolymers Conductive Hydrogels for Flexible Wearable Sensors and Energy Devices: Materials, Structures, and Performance. ACS Appl. Bio Mater. 2021, 4, 85–121. [Google Scholar] [CrossRef]
- Bossi, A.M.; Bucciarelli, A.; Maniglio, D. Molecularly Imprinted Silk Fibroin Nanoparticles. ACS Appl. Mater. Interfaces 2021, 13, 31431–31439. [Google Scholar] [CrossRef]
- Guo, C.; Li, C.; Mu, X.; Kaplan, D.L. Engineering Silk Materials: From Natural Spinning to Artificial Processing. Appl. Phys. Rev. 2020, 7, 011313. [Google Scholar] [CrossRef]
- Li, C.; Qin, R.; Liu, R.; Miao, S.; Yang, P. Functional Amyloid Materials at Surfaces/Interfaces. Biomater. Sci. 2018, 6, 462–472. [Google Scholar] [CrossRef]
- Jain, A.; Singh, S.K.; Arya, S.K.; Kundu, S.C.; Kapoor, S. Protein Nanoparticles: Promising Platforms for Drug Delivery Applications. ACS Biomater. Sci. Eng. 2018, 4, 3939–3961. [Google Scholar] [CrossRef]
- Ghalei, S.; Mondal, A.; Hopkins, S.; Singha, P.; Devine, R.; Handa, H. Silk Nanoparticles: A Natural Polymeric Platform for Nitric Oxide Delivery in Biomedical Applications. ACS Appl. Mater. Interfaces 2020, 12, 53615–53623. [Google Scholar] [CrossRef]
- Hu, Y.; Zou, Y.; Ma, Y.; Yu, J.; Liu, L.; Chen, M.; Ling, S.; Fan, Y. Formulation of Silk Fibroin Nanobrush-Stabilized Biocompatible Pickering Emulsions. Langmuir 2022, 38, 14302–14312. [Google Scholar] [CrossRef]
- Mottaghitalab, F.; Kiani, M.; Farokhi, M.; Kundu, S.C.; Reis, R.L.; Gholami, M.; Bardania, H.; Dinarvand, R.; Geramifar, P.; Beiki, D.; et al. Targeted Delivery System Based on Gemcitabine-Loaded Silk Fibroin Nanoparticles for Lung Cancer Therapy. ACS Appl. Mater. Interfaces 2017, 9, 31600–31611. [Google Scholar] [CrossRef]
- Borkner, C.B.; Elsner, M.B.; Scheibel, T. Coatings and Films Made of Silk Proteins. ACS Appl. Mater. Interfaces 2014, 6, 15611–15625. [Google Scholar] [CrossRef]
- Veiga, A.; Castro, F.; Rocha, F.; Oliveira, A.L. Protein-Based Hydroxyapatite Materials: Tuning Composition toward Biomedical Applications. ACS Appl. Bio Mater. 2020, 3, 3441–3455. [Google Scholar] [CrossRef]
- Singh, Y.P.; Bandyopadhyay, A.; Mandal, B.B. 3D Bioprinting Using Cross-Linker-Free Silk-Gelatin Bioink for Cartilage Tissue Engineering. ACS Appl. Mater. Interfaces 2019, 11, 33684–33696. [Google Scholar] [CrossRef]
- Cheng, G.; Davoudi, Z.; Xing, X.; Yu, X.; Cheng, X.; Li, Z.; Deng, H.; Wang, Q. Advanced Silk Fibroin Biomaterials for Cartilage Regeneration. ACS Biomater. Sci. Eng. 2018, 4, 2704–2715. [Google Scholar] [CrossRef]
- Qi, Y.; Wang, H.; Wei, K.; Yang, Y.; Zheng, R.Y.; Kim, I.S.; Zhang, K.Q. A Review of Structure Construction of Silk Fibroin Biomaterials from Single Structures to Multi-Level Structures. Int. J. Mol. Sci. 2017, 18, 237. [Google Scholar] [CrossRef]
- Li, K.; Li, P.; Fan, Y. The Assembly of Silk Fibroin and Graphene-Based Nanomaterials with Enhanced Mechanical/Conductive Properties and Their Biomedical Applications. J. Mater. Chem. B 2019, 7, 6890–6913. [Google Scholar] [CrossRef]
- Tanaka, K.; Mori, K.; Mizuno, S. Immunological Identification of the Major Disulfide-Linked Light Component of Silk Fibroin. J. Biochem. 1993, 114, 1–4. [Google Scholar] [CrossRef]
- Tanaka, K.; Inoue, S.; Mizuno, S. Hydrophobic Interaction of P25, Containing Asn-Linked Oligosaccharide Chains, with the H-L Complex of Silk Fibroin Produced by Bombyx Mori. Insect Biochem. Mol. Biol. 1999, 29, 269–276. [Google Scholar] [CrossRef]
- Dubey, P.; Murab, S.; Karmakar, S.; Chowdhury, P.K.; Ghosh, S. Modulation of Self-Assembly Process of Fibroin: An Insight for Regulating the Conformation of Silk Biomaterials. Biomacromolecules 2015, 16, 3936–3944. [Google Scholar] [CrossRef]
- Callone, E.; Dirè, S.; Hu, X.; Motta, A. Processing Influence on Molecular Assembling and Structural Conformations in Silk Fibroin: Elucidation by Solid-State NMR. ACS Biomater. Sci. Eng. 2016, 2, 758–767. [Google Scholar] [CrossRef]
- Valluzzi, R.; Gido, S.P.; Muller, W.; Kaplan, D.L. Orientation of Silk III at the Air-Water Interface. Int. J. Biol. Macromol. 1999, 24, 237–242. [Google Scholar] [CrossRef]
- Valluzzi, R.; Gido, S.P. The Crystal Structure of Bombyx Mori Silk Fibroin at the Air-Water Interface. Biopolym. Nucleic Acid Sci. Sect. 1997, 42, 705–717. [Google Scholar] [CrossRef]
- Bai, S.; Liu, S.; Zhang, C.; Xu, W.; Lu, Q.; Han, H.; Kaplan, D.L.; Zhu, H. Controllable Transition of Silk Fibroin Nanostructures: An Insight into in Vitro Silk Self-Assembly Process. Acta Biomater. 2013, 9, 7806–7813. [Google Scholar] [CrossRef]
- Koebley, S.R.; Thorpe, D.; Pang, P.; Chrisochoides, P.; Greving, I.; Vollrath, F.; Schniepp, H.C. Silk Reconstitution Disrupts Fibroin Self-Assembly. Biomacromolecules 2015, 16, 2796–2804. [Google Scholar] [CrossRef]
- Ling, S.; Li, C.; Adamcik, J.; Shao, Z.; Chen, X.; Mezzenga, R. Modulating Materials by Orthogonally Oriented β-Strands: Composites of Amyloid and Silk Fibroin Fibrils. Adv. Mater. 2014, 26, 4569–4574. [Google Scholar] [CrossRef]
- Koh, L.D.; Cheng, Y.; Teng, C.P.; Khin, Y.W.; Loh, X.J.; Tee, S.Y.; Low, M.; Ye, E.; Yu, H.D.; Zhang, Y.W.; et al. Structures, Mechanical Properties and Applications of Silk Fibroin Materials. Prog. Polym. Sci. 2015, 46, 86–110. [Google Scholar] [CrossRef]
- Chen, P.; Kim, H.S.; Park, C.Y.; Kim, H.S.; Chin, I.J.; Jin, H.J. PH-Triggered Transition of Silk Fibroin from Spherical Micelles to Nanofibrils in Water. Macromol. Res. 2008, 16, 539–543. [Google Scholar] [CrossRef]
- Jin, H.J.; Kaplan, D.L. Mechanism of Silk Processing in Insects and Spiders. Nature 2003, 424, 1057–1061. [Google Scholar] [CrossRef]
- Park, D.; Cheng, J.; Park, J.B.; Shin, S.; Lee, S.H.; Hong, B.H.; Kim, S.H.; Hyun, J.; Yang, C. PH-Triggered Silk Fibroin/Alginate Structures Fabricated in Aqueous Two-Phase System. ACS Biomater. Sci. Eng. 2019, 5, 5897–5905. [Google Scholar] [CrossRef]
- Kamada, A.; Toprakcioglu, Z.; Knowles, T.P.J. Kinetic Analysis Reveals the Role of Secondary Nucleation in Regenerated Silk Fibroin Self-Assembly. Biomacromolecules 2023, 24, 1709–1716. [Google Scholar] [CrossRef]
- Jiang, F.; Liu, K.; Zhao, M.; Tao, X.; Hu, X.; Lu, S.; Lu, S. Tunable High-Molecular-Weight Silk Fibroin Polypeptide Materials: Fabrication and Self-Assembly Mechanism. ACS Appl. Bio Mater. 2020, 3, 3248–3259. [Google Scholar] [CrossRef]
- Zhong, J.; Liu, X.; Wei, D.; Yan, J.; Wang, P.; Sun, G.; He, D. Effect of Incubation Temperature on the Self-Assembly of Regenerated Silk Fibroin: A Study Using AFM. Int. J. Biol. Macromol. 2015, 76, 195–202. [Google Scholar] [CrossRef]
- Ahrami, M.; Khatami, M.; Heli, H. Study of Nanofibrils Formation of Fibroin Protein in Specific Thermal and Acidity Conditions. J. Biomed. Phys. Eng. 2020, 10, 39–50. [Google Scholar] [CrossRef]
- Chen, Z.; Zhang, H.; Lin, Z.; Lin, Y.; van Esch, J.H.; Liu, X.Y. Programing Performance of Silk Fibroin Materials by Controlled Nucleation. Adv. Funct. Mater. 2016, 26, 8978–8990. [Google Scholar] [CrossRef]
- Shi, P.; Goh, J.C.H. Self-Assembled Silk Fibroin Particles: Tunable Size and Appearance. Powder Technol. 2012, 215–216, 85–90. [Google Scholar] [CrossRef]
- Yang, Y.; Dicko, C.; Bain, C.D.; Gong, Z.; Jacobs, R.M.J.; Shao, Z.; Terry, A.E.; Vollrath, F. Behavior of Silk Protein at the Air-Water Interface. Soft Matter 2012, 8, 9705–9712. [Google Scholar] [CrossRef]
- Qiao, X.; Miller, R.; Schneck, E.; Sun, K. Foaming Properties and the Dynamics of Adsorption and Surface Rheology of Silk Fibroin at the Air/Water Interface. Colloids Surf. A Physicochem. Eng. Asp. 2020, 591, 124553. [Google Scholar] [CrossRef]
- Qiao, X.; Miller, R.; Schneck, E.; Sun, K. Influence of Salt Addition on the Surface and Foaming Properties of Silk Fibroin. Colloids Surfaces A Physicochem. Eng. Asp. 2021, 609, 125621. [Google Scholar] [CrossRef]
- Qiao, X.; Miller, R.; Schneck, E.; Sun, K. Influence of PH on the Surface and Foaming Properties of Aqueous Silk Fibroin Solutions. Soft Matter 2020, 16, 3695–3704. [Google Scholar] [CrossRef]
- Wang, L.; Xie, H.; Qiao, X.; Goffin, A.; Hodgkinson, T.; Yuan, X.; Sun, K.; Fuller, G.G. Interfacial Rheology of Natural Silk Fibroin at Air/Water and Oil/Water Interfaces. Langmuir 2012, 28, 459–467. [Google Scholar] [CrossRef]
- Rockwood, D.N.; Preda, R.C.; Yücel, T.; Wang, X.; Lovett, M.L.; Kaplan, D.L. Materials Fabrication from Bombyx Mori Silk Fibroin. Nat. Protoc. 2011, 6, 1612–1631. [Google Scholar] [CrossRef]
- Mikhailovskaya, A.A.; Noskov, B.A.; Lin, S.-Y.; Loglio, G.; Miller, R. Formation of Protein/Surfactant Adsorption Layer at the Air/Water Interface as Studied by Dilational Surface Rheology. J. Phys. Chem. B 2011, 115, 9971–9979. [Google Scholar] [CrossRef]
- Ducharme, D.; Tessier, A.; Leblanc, R.M.R.M. Null Ellipsometer for the Studies of Thin Films at Gas-Water Interface. Rev. Sci. Instrum. 1987, 58, 571–578. [Google Scholar] [CrossRef]
- Motschmann, H.; Teppner, R. Ellipsometry in Interface Science. Stud. Interface Sci. 2001, 11, 1–42. [Google Scholar] [CrossRef]
- Noskov, B.A. Protein Conformational Transitions at the Liquid-Gas Interface as Studied by Dilational Surface Rheology. Adv. Colloid Interface Sci. 2014, 206, 222–238. [Google Scholar] [CrossRef]
- Noskov, B.A.; Akentiev, A.V.; Bykov, A.G.; Loglio, G.; Miller, R.; Milyaeva, O.Y.Y. Spread and Adsorbed Layers of Protein Fibrils at Water–Air Interface. Colloids Surf. B Biointerfaces 2022, 220, 112942. [Google Scholar] [CrossRef]
- Poirier, A.; Stocco, A.; Kapel, R.; In, M.; Ramos, L.; Banc, A. Sunflower Proteins at Air–Water and Oil–Water Interfaces. Langmuir 2021, 37, 2714–2727. [Google Scholar] [CrossRef]
- Chirkov, N.S.; Campbell, R.A.; Michailov, A.V.; Vlasov, P.S.; Noskov, B.A. DNA Interaction with a Polyelectrolyte Monolayer at Solution—Air Interface. Polymers 2021, 13, 2820. [Google Scholar] [CrossRef]
- Campbell, R.A.; Tummino, A.; Varga, I.; Milyaeva, O.Y.; Krycki, M.M.; Lin, S.Y.; Laux, V.; Haertlein, M.; Forsyth, V.T.; Noskov, B.A. Adsorption of Denaturated Lysozyme at the Air-Water Interface: Structure and Morphology. Langmuir 2018, 34, 5020–5029. [Google Scholar] [CrossRef]
- Jayawardane, D.; Pan, F.; Lu, J.R.; Zhao, X. Interfacial Adsorption of Silk Fibroin Peptides and Their Interaction with Surfactants at the Solid-Water Interface. Langmuir 2016, 32, 8202–8211. [Google Scholar] [CrossRef]
- Lyadinskaya, V.V.; Lin, S.Y.; Noskov, B.A. Dynamic Surface Elasticity of the Mixed Solutions of DNA and Cetyltrimethylammonium Bromide. Mendeleev Commun. 2016, 26, 64–65. [Google Scholar] [CrossRef]
- Noskov, B.A.; Bykov, A.G. Dilational Rheology of Monolayers of Nano- and Micropaticles at the Liquid-Fluid Interfaces. Curr. Opin. Colloid Interface Sci. 2018, 37, 1–12. [Google Scholar] [CrossRef]
Disclaimer/Publisher’s Note: The statements, opinions and data contained in all publications are solely those of the individual author(s) and contributor(s) and not of MDPI and/or the editor(s). MDPI and/or the editor(s) disclaim responsibility for any injury to people or property resulting from any ideas, methods, instructions or products referred to in the content. |
© 2024 by the authors. Licensee MDPI, Basel, Switzerland. This article is an open access article distributed under the terms and conditions of the Creative Commons Attribution (CC BY) license (https://creativecommons.org/licenses/by/4.0/).