Article

Improving the Size Distribution of Polymeric Oblates Fabricated by the Emulsion-in-Gel Deformation Method

1
Instituto de Química, Universidad Nacional Autónoma de México, Mexico City 04510, Mexico
2
Departamento de Física, Universidad Autónoma Metropolitana Iztapalapa, Mexico City 09340, Mexico
*
Author to whom correspondence should be addressed.
Colloids Interfaces 2023, 7(3), 50; https://doi.org/10.3390/colloids7030050
Submission received: 3 April 2023 / Revised: 17 May 2023 / Accepted: 25 May 2023 / Published: 12 July 2023
(This article belongs to the Special Issue Recent Advances in Emulsions and Applications)

Abstract

:
The optimization of fabrication conditions for colloidal micron-sized oblates obtained by the deformation of an oil-in-hydrogel emulsion is reported. The influence of the type of emulsion stabilizer, ultrasonication parameters, and emulsion and gel mixing conditions was explored. The best conditions with which to obtain more uniform particles were using polyvinyl alcohol as an emulsion stabilizer mixed with the gelatine solution at 35 °C and slowly cooling to room temperature. Four fractionation methods were applied to oblates to improve their size uniformity. The iterative differential centrifugation method produced the best size polydispersity reduction.

Graphical Abstract

1. Introduction

Auto-organization of colloidal particles is an active field of research due to the possibilities of application of this knowledge in the fabrication of new functional materials [1,2,3,4,5]. For spherical submicrometer particles with different types of isotropic interactions, a wide variety of structures was observed, both ordered (such as crystals) and disordered (such as fluids, gels, glasses, etc.) [6,7,8,9,10]. When a binary mixture of spherical colloids of different sizes is used, the structure complexity increases and the types of order become much more diverse [11]. Another way of increasing the structural divergence is by using anisotropic colloids as more complex building blocks for self-assembly. Therefore, recent studies have demonstrated much interest in anisotropically shaped particles such as colloidal rods, dumbbells, ellipsoids, spherocylinders, cubes, etc. [12,13,14,15]. Since inter-particle interactions between such colloids depend on the particle orientation, new self-assembly routes were discovered [16,17]. While there are a considerable number of computer simulations and theoretical predictions concerning the self-assembly of such anisotropic colloids, the experimental verification of predicted structures is still in its initial stage. This is mainly due to the fact that syntheses of such building blocks in the large amount required for the self-assembly studies are not well established. While many scientific reports have described the fabrication of colloids of many different shapes, usually only a small amount of these may be obtained as a batch, which complicates the conduction of the assembly studies [14,18].
Colloidal oblates have gained considerable attention due to the high degree of directionality in their inter-particle interactions. The preferable orientation of oblates in their self-organization is along their minor axes, forming stacks and columnar structures [19,20,21,22,23]. Such an organization is an example of a more complex phase behavior. Therefore, it is expected that the directionality would affect both equilibrium and non-equilibrium suspension properties in the bulk and at fluid interfaces. In addition, the particle dynamics are expected to be more complex due to the directionality of oblate translation and rotation. Besides the formation of novel structures, colloidal oblates may be potentially applied as a model for blood cells [24], drug carriers [25,26], emulsion stabilizers [27], and to the fabrication of photonic materials [28,29]. For the majority of studies and applications, the main requirements for oblates are to be fabricated in a good amount and with high uniformity in size and shape. Therefore, there is a need for a versatile synthesis of these colloids.
One of the most common synthetic methods of colloidal oblates is based on the mechanical deformation of pre-synthesized spherical polymeric particles (polystyrene, PS, or poly(methyl methacrylate), PMMA) embedded in an elastic matrix [30,31]. The advantages of this method include the ability to obtain a larger number of particles from a single synthesis and their relatively uniform size and shape. The main drawback is the need for precise control of deformation at a rather high temperature (above 135 °C). In addition, pre-formed, almost monodisperse, solid spherical particles are used, which reduces the variety of the ellipsoid materials to mainly PS or PMMA. Courbaron et al. suggested a similar method of fabrication, but with an oil-in-hydrogel emulsion to be deformed at room temperature [32]. The oil could be solidified by photo-cross-linking while the droplets are deformed. A large yield of oblates could be obtained, but with a rather large particle polydispersity stemming mainly from the original emulsion. Although the particle size was not as uniform as in the case of the deformation of solid particles, considerable advantages of this method include the possibility of using different materials as an oil phase and the deformation that takes place at room temperature. These advantages could potentially be used in the fabrication of drug carriers. The importance of the particle shape has been underlined for drug delivery systems [33]. For instance, ellipsoid particles were shown to have different adhesion in blood vessels and during endocytosis [34,35]. Therefore, an emulsion-in-gel deformation method might open up the possibility of using biocompatible materials for drug encapsulation in-situ, which is not accessible by the deformation of pre-fabricated solid spherical particles.
In the present work, we explored the conditions for producing colloidal oblates by deforming an oil-in-gel emulsion. We clarified the influence of each fabrication step on the oblate size and polydispersity. We demonstrated that the initial emulsion droplet polydispersity has a strong effect on the ellipsoid size distribution. Thus, we explored different methods of oblate fractionation to optimize the yield of more uniform particles. This work represents a significant advancement in that a large amount of ellipsoids (approximately 600 mg) were produced from a single batch. After particle fractionation, about 100 mg of particles with considerably reduced polydispersity were obtained. Unlike previously reported works, this is the first optimized method suggested for the fabrication of uniform ellipsoids with a large yield starting from an emulsion. Our method may be useful for the large-scale production of ellipsoid carriers for bioactive compounds since it does not require extreme fabrication conditions.

2. Materials and Methods

The following steps can be used to describe the overall process of particle fabrication: (1) emulsification of the polymerizable oil; (2) emulsion-in-gel preparation; (3) emulsion-in-gel deformation followed by deformed droplet solidification; and (4) particle recovery and fractionation.

2.1. Emulsion Preparation

An oil phase and an aqueous phase were prepared to make an oil-in-water emulsion. The oil phase consisted of 0.6 g of the mixture of 1,6-hexanediol diacrylate (polymerizable oil monomer) and 1-hydroxycyclohexylphenyl ketone (photoinitiator) at 1% wt of the oil phase. The aqueous phase was 5 mL of deionized water (resistivity  ρ = 18.1  M Ω · cm) with a surfactant. Two types of surfactants were tested: (1) sodium dodecyl sulfate at a concentration of 10 mM and (2) polyvinyl alcohol (PVA, 87–89% hydrolyzed,  M w  = 13,000–23,000) at 1% wt. All the reactants were obtained from Sigma-Aldrich, and deionized water was used throughout the study.
In a 10 mL vial, an oil phase was deposited on top of an aqueous phase, and the sample was homogenized by using an ultrasonic processor (500 W, Cole-Parmer, Vernon Hills, IL, USA) for 10 min at a constant power of 100 W and an amplitude of 20%.

2.2. Emulsion-in-Gel Preparation

To form a gel, 9 g of an aqueous solution of gelatin (G1890, Sigma-Aldrich, St. Louis, MO, USA) at 4% wt was prepared at 80 °C to dissolve gelatin completely at constant stirring. Then, the emulsion-in-gel was prepared using two methods. In the first method, the emulsion was added directly to the gelatin solution at 80 °C with moderate stirring and then the mixture was cooled down to room temperature, with gelatin forming a solid gel. In the second method, a gelatin solution was first cooled down to about 35–40 °C before its complete solidification. Then an emulsion was added, and the mixture was left to solidify, trapping the oil droplets during its cooling down to room temperature. The gel solidification after mixing with the emulsion was performed in a custom-made PTFE rectangular mold with dimensions  L × W × H  of  56 × 24 × 7  mm, which allowed us to avoid further gel cutting by using a well-shaped emulsion-in-gel brick ready for deformation.

2.3. Gel Deformation and Droplet Solidification

A rectangular gel brick was then mechanically deformed in a custom-made press (see Supplementary Materials). Prior to deformation, the press was placed inside a custom-made wooden box on a Dewar flask filled with ice and illuminated with a UV lamp (100 W, B100AP, Analytik Jena, Jena, Germany) at a distance of 25 cm. Such a collocation allowed for precise temperature control of the gel at  22 ± 0.5  °C during the entire 2.5-h droplet solidification. The sample brick was covered with a rectangular glass, and the deformation was applied along the vertical axis by moving down the screw sliding cylinder. The deformation degree (the ratio between the final and initial brick heights) was kept constant in all the cases and was equal to 57%. After the deformation and droplet solidification, the brick was dissolved in warm water, and the particles were recovered by the sedimentation-redispersion method.

2.4. Characterization

Particle size and size distribution were characterized by scanning electron microscopy (SEM, JSM-7800F Jeol, Tokyo, Japan). The equatorial radius of the oblates was measured with the Digimizer software using only the particles oriented in such a way that their images were circular. Over 300 particles were analyzed. A Gaussian distribution function was then fitted to the data to obtain the average particle equatorial radius R and standard deviation  S D . The polydispersity index ( P D I ) was then calculated as  P D I = S D / R . The minor axis (pole-to-pole) oblate dimensions and the corresponding  P D I  were ignored due to the difficulties in the location of particles oriented with their profiles perpendicular to the observation direction. Fractionated particles were observed under an optical microscope (AxioImager, Zeiss, Jena, Germany) in bright and dark fields. For selected samples, particle size distribution was measured by dynamic light scattering (DLS) using the CONTIN method. For this, a dilute dispersion of oblates was prepared in water and measured at a scattering angle of 90° during 300 s at 20 °C in a 3DLS spectrometer (LS Instruments, Fribourg, Switzerland) equipped with a 632.8 nm laser, an index-matching bath, and a temperature control.

2.5. Fractionation

Several methods of particle fractionation were applied. The first one was differential centrifugation. For this, 500 mg of ellipsoids were dispersed in 50 mL of a 10 mM SDS solution and centrifuged for 3 min at the following rpm values: 400 (11× g), 500 (18× g), 650 (30× g), and 800 (45× g). After each centrifugation cycle, the supernatant was decanted, dispersed again, and sedimented at a higher speed. Therefore, four fractions were obtained using this method.
The second method used was the Bibette method [36], where 500 mg of particles were dispersed in 100 mL of an 8.2 mM SDS solution, which corresponds to one critical micelle concentration (CMC) of SDS [37]. The suspension was poured into a tall glass cylinder (diameter of about 10 mm) and left to settle under gravity for 24 h. Then, the sediment was collected, and the particles from the supernatant were recovered, washed with water and ethanol, and dispersed in a 2 CMC SDS solution. The procedure was repeated for 3, 4, and 5 CMC of SDS solution. Thus, five fractions of particles were obtained.
The third method consisted of particle fractionation along a sucrose density gradient. A 15-mL falcon tube was filled with five layers (2 mL each) of sucrose solutions from 40 to 20% wt in steps of 5% wt. Then, 2 mL of the sample was deposited on top of the gradient at a concentration of 20 mg/mL in a 10 mM SDS solution, which was followed by centrifugation at 4000 rpm (1115× g) for 5 min. Five fractions of particles were recovered and analyzed.
Iterative differential centrifugation, an extension of the first method of differential centrifugation, was used as the fourth method. For this method, 40 mg of particles were dispersed in 15 mL of a 10 mM SDS solution and centrifuged at 4000 rpm (1115× g) for 5 min. The supernatant was withdrawn and observed under an optical microscope (AxioImager, Zeiss). Only very small particles were observed. The supernatant was then stored in a separate tube, while the sediment was dispersed and centrifuged again twice under the same conditions. The supernatant of the three runs was collected as the first fraction, F1. The second fraction F2 was formed in a similar way by the particles left in the supernatant after three-run sedimentation at 4000 rpm (1115× g) for 1 min. The third fraction F3 was obtained by collecting the supernatants during ten-run sedimentation at 3500 rpm (865× g) for 1 min. The particles were observed under the microscope after each run to rule out the presence of larger particles. In a similar way, the fourth fraction F4 was obtained by collecting the supernatant after the five-run sedimentation at 1000 rpm (70× g) for 1 min. The sediment was recovered, forming the fifth fraction, F5.

3. Results and Discussion

3.1. Emulsion-in-Gel Preparation

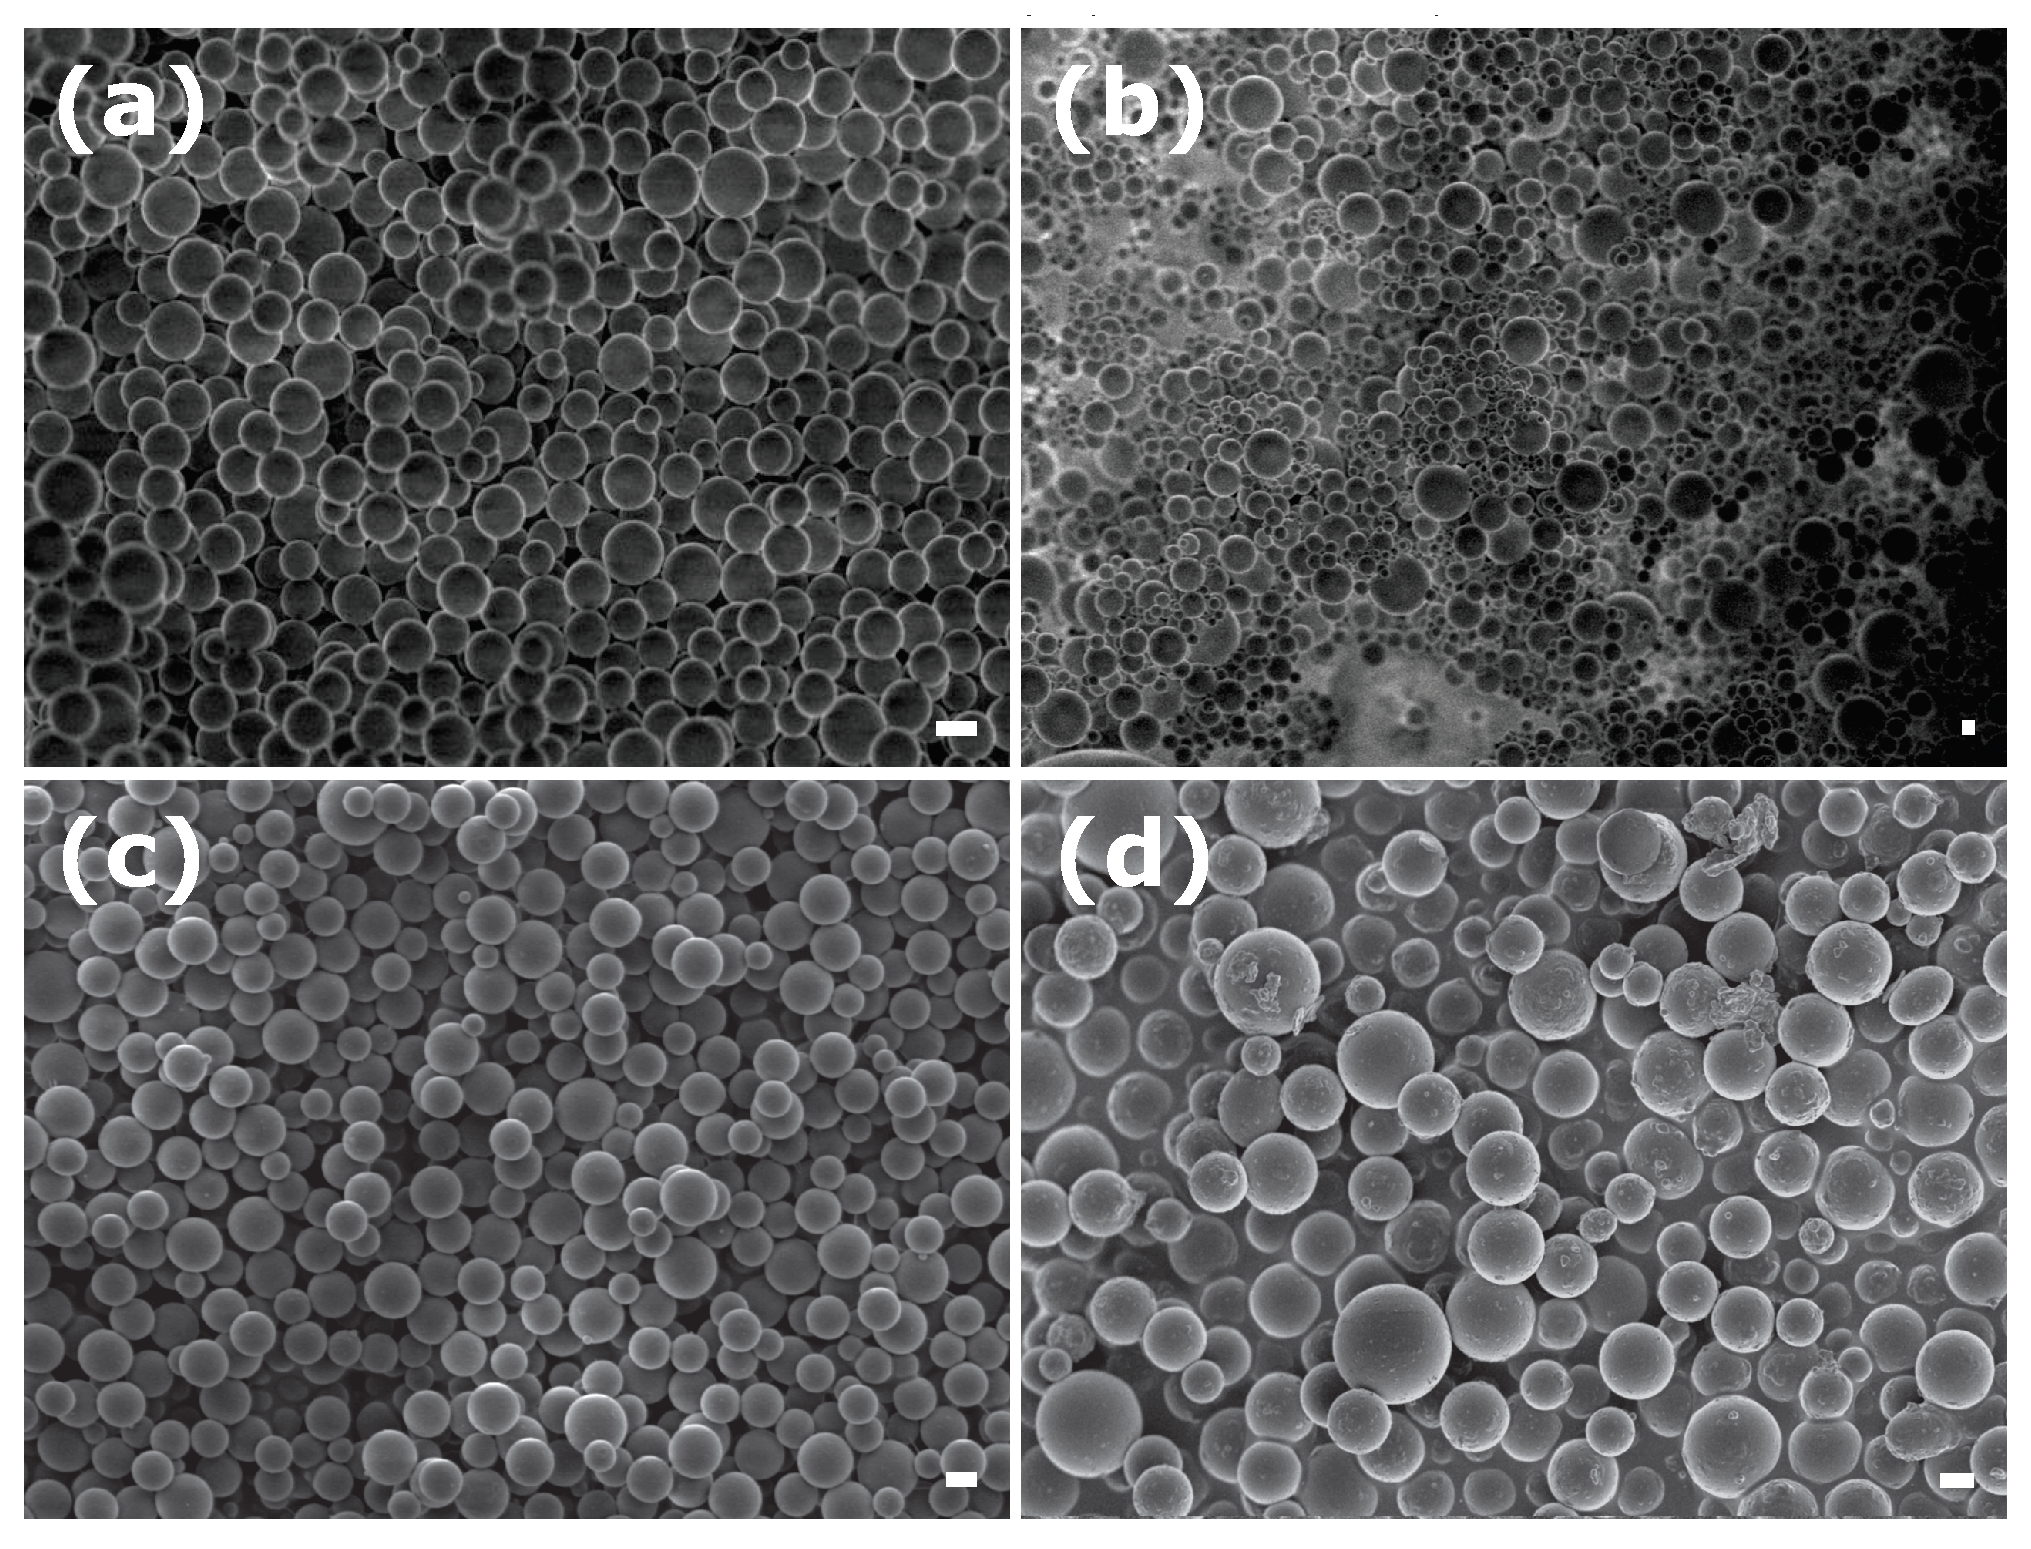
Figure 1 shows SEM images of spherical particles obtained after emulsion preparation and droplet solidification without gel for emulsions stabilized by two surfactants: SDS and PVA.
As is seen from the figure, in all the cases, spherical particles were successfully formed. The following particle characteristics were obtained after 10 min of ultrasonication at 20% amplitude: average radius R of 710 nm and  P D I = 0.35  using 10 mM SDS solution (Figure 1a) and 720 nm and  P D I = 0.14  for 1% PVA solution (Figure 1b). As one may notice, although the average particle size did not change significantly, the polydispersity decreased more than twice with the use of PVA. This is connected with the higher viscosity of PVA solution as compared to 10 mM SDS, which reduces cavitation during the ultrasound treatment [38]. In addition, a larger medium viscosity hinders droplet coalescence, which results in a more uniform particle size distribution. Curiously, an increase of the ultrasonic processor amplitude for PVA-stabilized emulsion up to 50% resulted in a decrease of the average particle radius to 470 nm with a drastic increase of  P D I  up to 0.53 (Figure 1c). A similar result was observed previously on the fabrication of oil-in-water nanoemulsions by ultrasonication, where a large applied amplitude resulted in promoted droplet coalescence [39]. Therefore, the low amplitude is more favorable for  P D I  reduction. A decrease in sonication time to 3 min at the same amplitude of 20% did not have a significant effect on  P D I  (0.36) as shown for SDS-stabilized emulsion in Figure 1d, while the average radius increased to 900 nm. Previous studies revealed the absence of a significant impact of processing time on particle size and polydispersity, while the physicochemical properties of the dispersed and continuous phases as well as the type and concentration of the surfactant had a much larger contribution to the droplet rupture [39,40,41].
To check the reproducibility of the method, various samples were prepared. Table 1 summarizes particle radii and  P D I .
As can be seen, the ultrasonication method produces spheres with a relatively high polydispersity for SDS-stabilized emulsions with a radius of about 700 nm. Similar radii but lower  P D I  are observed for PVA-stabilized emulsions. While PVA helps to reduce  P D I , it does not completely solve the problem since the polydispersity varies in the range of 0.14–0.22, which is still considered large. Nevertheless, further  P D I  reduction may be laborious and, as will be shown later, not a necessary process since the droplet trapping in the gel and their further deformation contribute to an increase in particle  P D I .
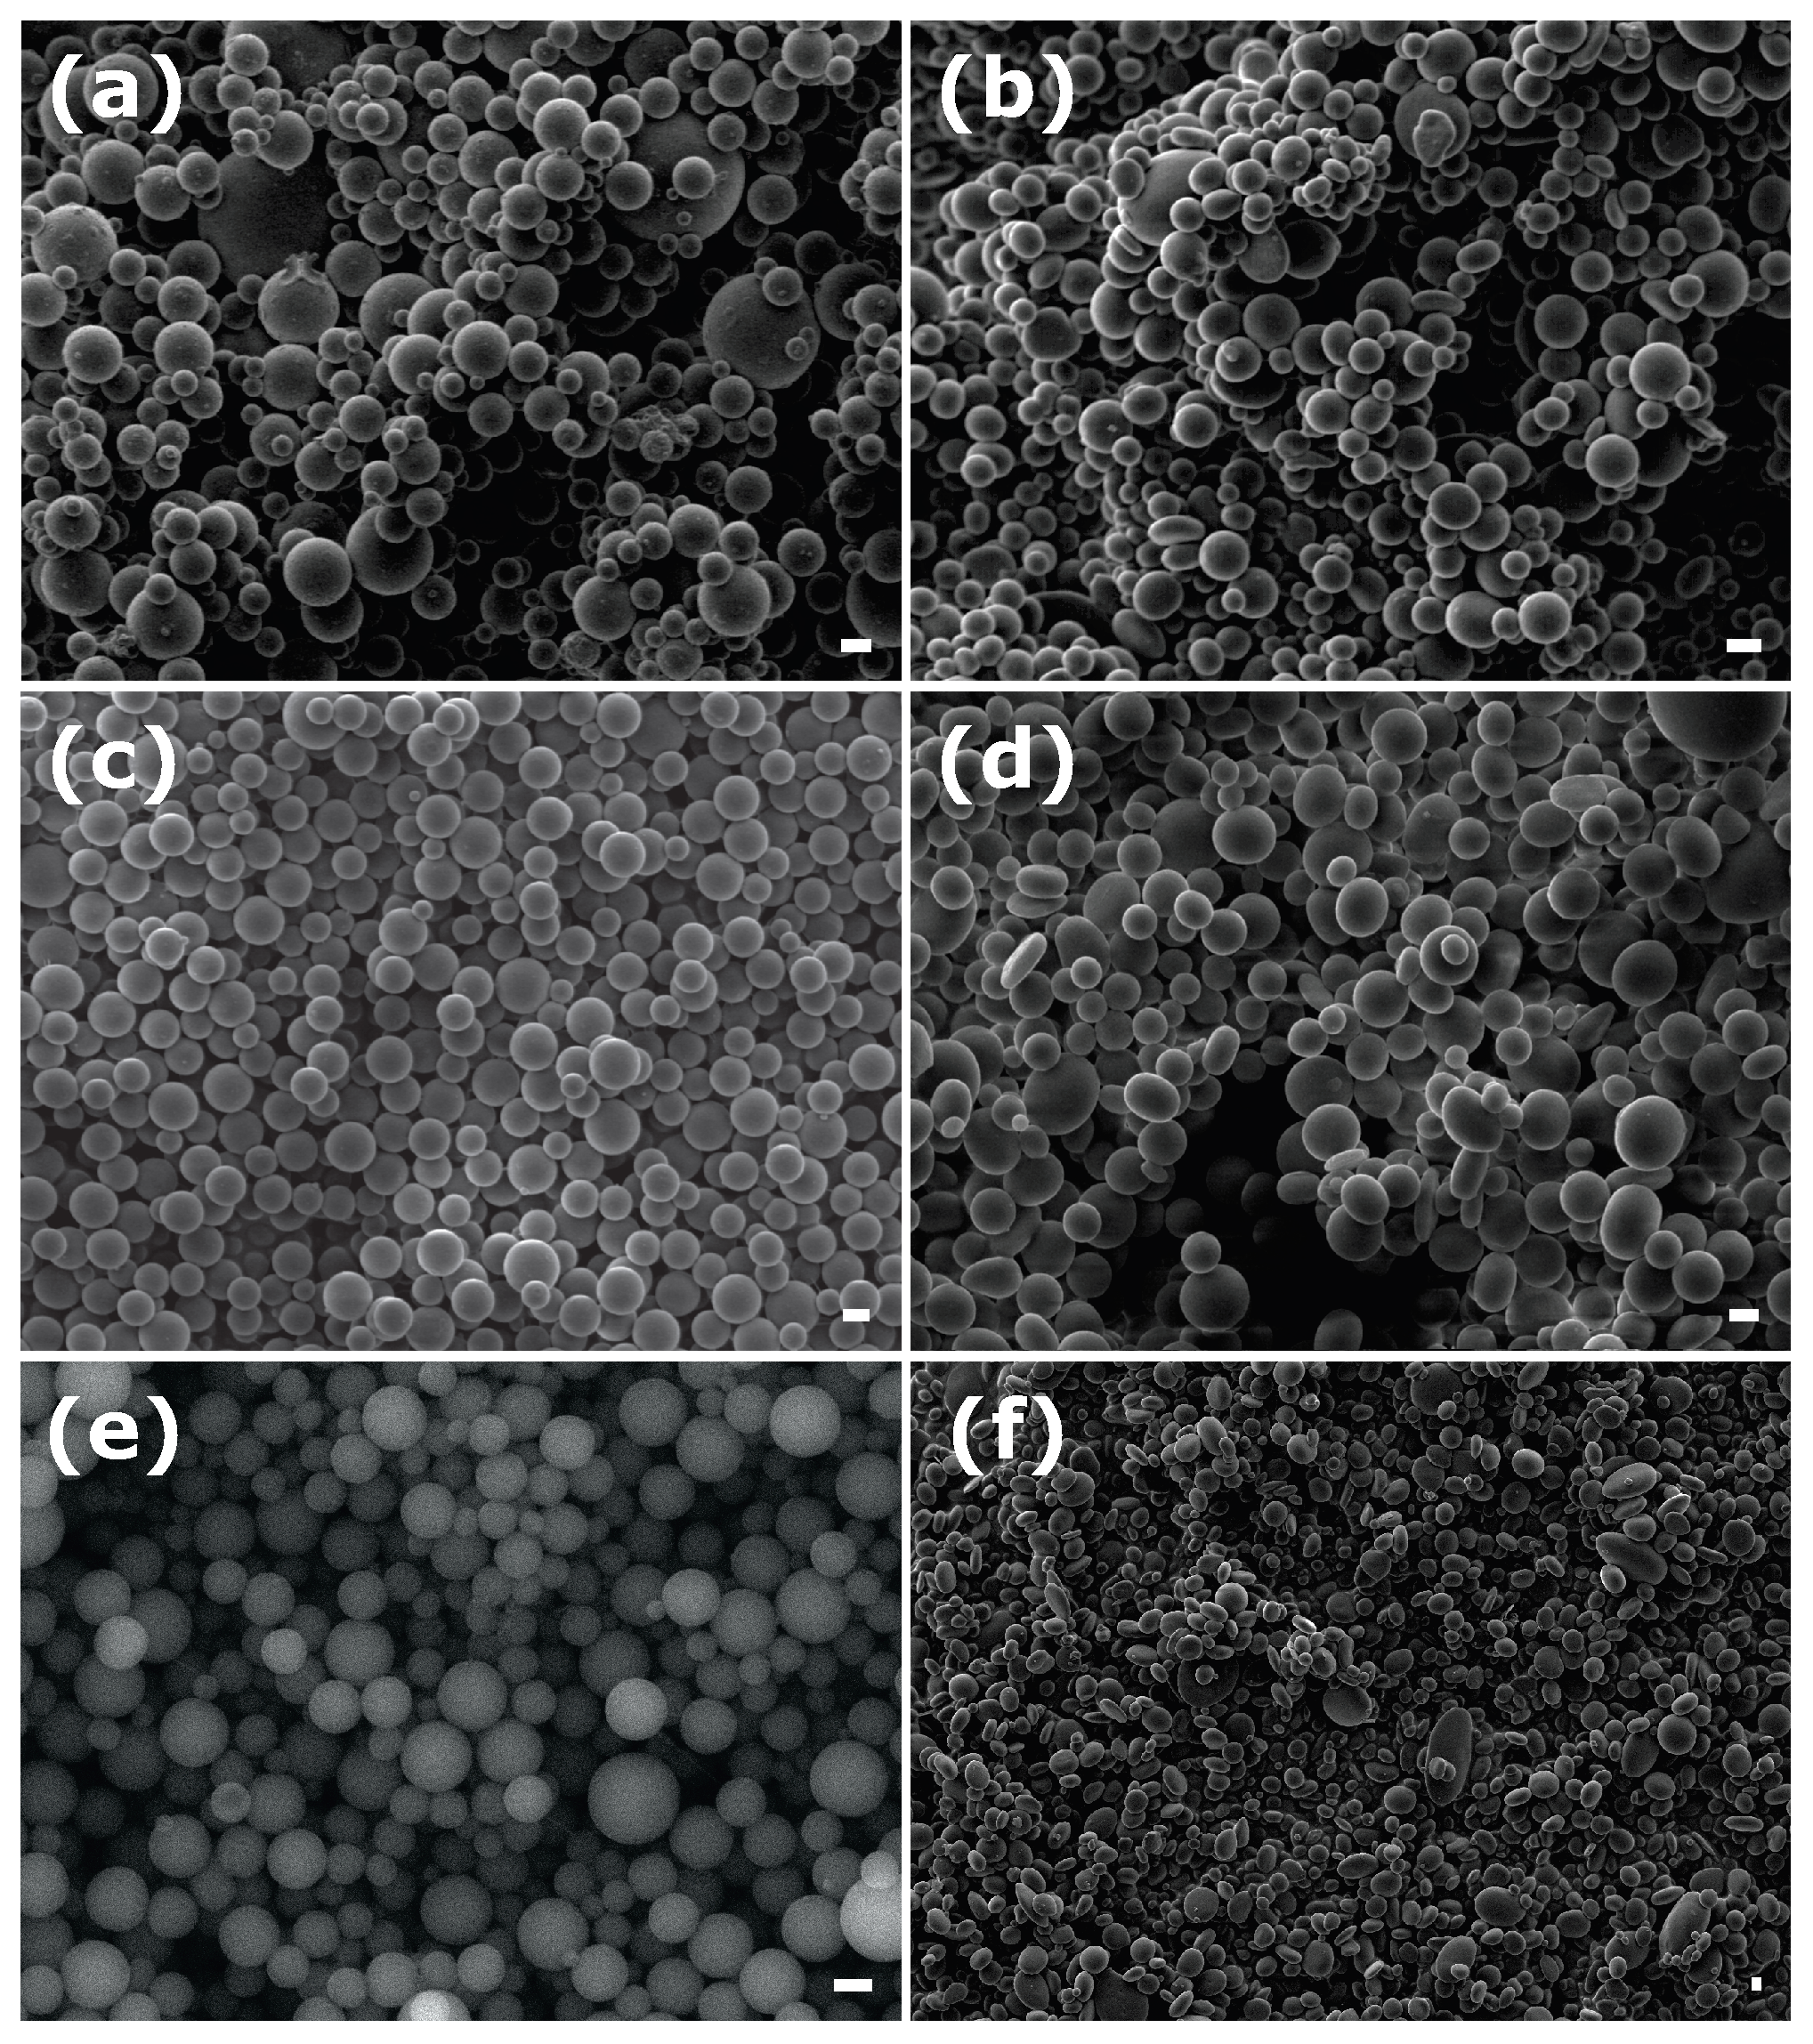
The next step was the emulsion-in-gel preparation, which involved mixing the emulsion with the gelatin solution. Two ways of mixing were evaluated: at high (80 °C) and low (35 °C) temperatures. Figure 2 shows SEM images of spherical particles E8 and E5 that were UV-cured before their mixing with gelatin solution (in the original emulsion) and after their emulsion-in-gel solidification, curing, and recovery without deformation (EG8 and EG5). Sample EG8 was recovered after mixing with the gelatin solution at 80 °C followed by gel solidification and oil curing. Sample EG5 was recovered after mixing with the gelatin solution at 35 °C, followed by gel solidification and oil curing.
As can be seen, the particles solidified in the gel (EG8 and EG5) are less uniform in size as compared to the original emulsions. Sample EG8 (Figure 2b) resulted in a radius of 820 nm with a  P D I  of 0.47, while sample EG5 had an average radius of 970 nm and a  P D I  of 0.24. Thus, on mixing emulsions with gels, both average particle size and polydispersity increase, indicating a possible emulsion droplet coalescence during the gelation. High temperature promotes emulsion destabilization, which results in a drastic increase in polydispersity. Lowering the mixing temperature helps to hinder droplet coalescence, which nevertheless results in a  P D I  increase of about 10%. Despite an increase in  P D I  at the low temperature, this way of mixing was used in further ellipsoids preparation. At even lower temperatures, satisfactory emulsion mixing is limited by the gelatin’s extremely high viscosity.

3.2. Emulsion-in-Gel Droplet Deformation

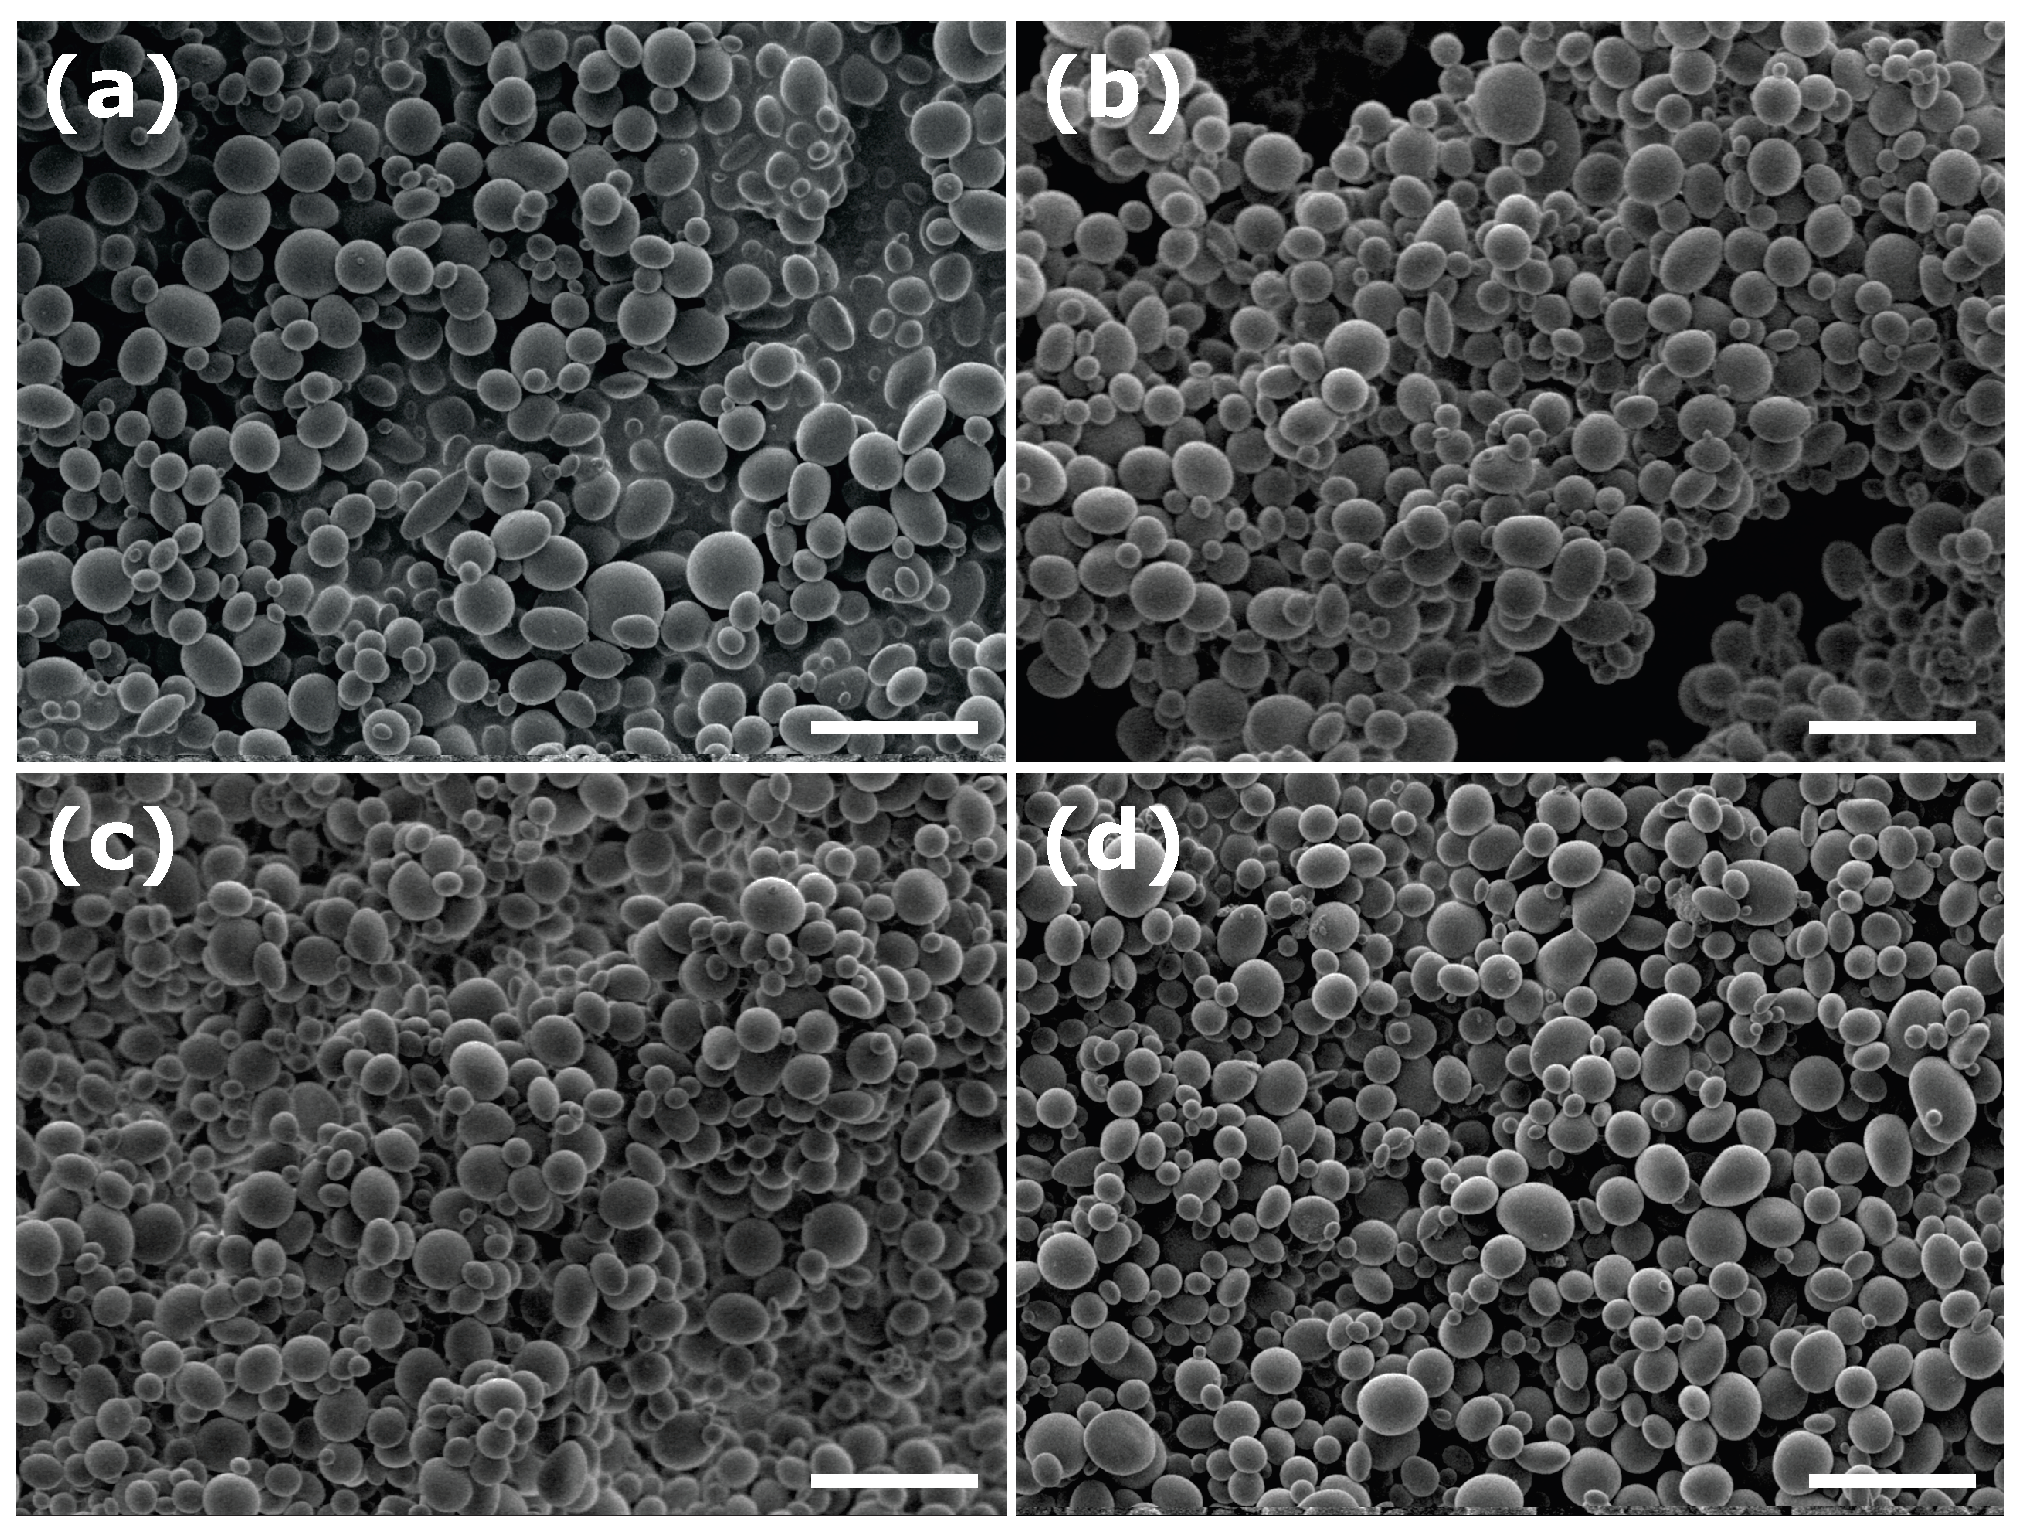
Figure 3 shows SEM images of spherical particles and their corresponding deformed particles.
In all the cases, deformation took place, which resulted in ellipsoidal particles of oblate shape. Similarly, Figure 4 shows samples obtained by the deformation of emulsions E2, E4, E7, and E8.
Table 2 summarizes the deformed particles’ equatorial radii and  P D I  (see Supplementary Materials for particle size distributions).
The analysis shows that particle deformation causes a significant increase in particle size and polydispersity. While the increase in the radius is expected since a spherical droplet is pressed, such a drastic increase in  P D I  indicates emulsion destabilization during both gelation and deformation. Another reason for such an increase in  P D I  may be a difference in particle deformation as a function of particle size. At a constant external deformation, smaller particles are expected to deform less than the large ones due to the larger Laplace pressure. Different degrees of deformation result in differences in the radii of ellipsoids, which significantly widen the particle size distribution.

3.3. Particle Fractionation

The first fractionation method used was differential centrifugation. Figure 5 shows SEM images of the four fractions of sample EGD4.
The following values for average radii and  P D I  were obtained (see Supplementary Materials for particle size distributions): fraction 1 (400 rpm, 11× g R o b = 1090  nm,  P D I o b = 0.41 ; fraction 2 (500 rpm, 18× g R o b = 1110  nm,  P D I o b = 0.35 ; fraction 3 (650 rpm, 30× g R o b = 1220  nm,  P D I o b = 0.44 ; and fraction 4 (800 rpm, 45× g R o b = 1170  nm,  P D I o b = 0.37 . It is clear that neither the average particle size nor the  P D I  changed significantly. These results could not be considered satisfactory since the polydispersity was too large. The possible reasons for such a poor separation could be a large particle concentration during the fractionation and a too-narrow interval of centrifugal force. Such conditions could favor particle sedimentation in clusters or aggregates, hindering differentiation in particle settling velocities. Therefore, other methods were implemented to improve particle fractionation.
Table 3 summarizes particle sizes and  P D I  for five fractions obtained by the Bibette method from sample EGD5 (see Supplementary Materials for the corresponding particle size distributions).
As can be seen from the table, fractionation was able to reduce the particle polydispersity by at least 0.13 (EGD5F1). The intermediate fraction resulted in being the least polydisperse, with  P D I o b = 0.14 . We connected it with the intermediate depletion attraction strength, which allows more selective particle aggregation. This fractionation method appears to have the potential to reduce the polydispersity of intermediate fractions. However, the rest of the fractions would require additional fractionation. Thus, this method can be recommended for ellipsoid fractionation but implies additional fractionation steps. The achievement of this method is the fraction EGD5F3, with a  P D I  value similar to that reported earlier on the deformation of almost monodisperse polymeric particles [30].
The next method applied was fractionation in a density gradient. Table 4 summarizes particle sizes and  P D I  for five fractions obtained by this method from sample EGD5 (see Supplementary Materials for particle size distributions).
The uppermost and smallest in its average size sample, EGD5F1, improved its  P D I , reducing it to 0.25. Nevertheless, the rest of the fractions did not improve significantly, either in their radius or in  P D I , probably due to the presence of small particles in all the fractions. The heaviest fraction, EGD5F5, contained extremely large particles with an average size of 24  μ m. Such large particles were not observed in the original emulsion, E5. Therefore, the appearance of these gigantic ellipsoids is connected with the deformation process in gel, probably due to the droplet coalescence during the gelation and gel deformation. These gigantic particles were not detected in the deformed EGD5 sample by SEM, probably due to the sample preparation method in which the dry sample was withdrawn from the uppermost part of the tube, whereas such large particles are expected to settle on the bottom due to their extremely fast sedimentation. Considering the above results, we can conclude that the method of fractionation in a density gradient is not efficient for the studied dispersion.
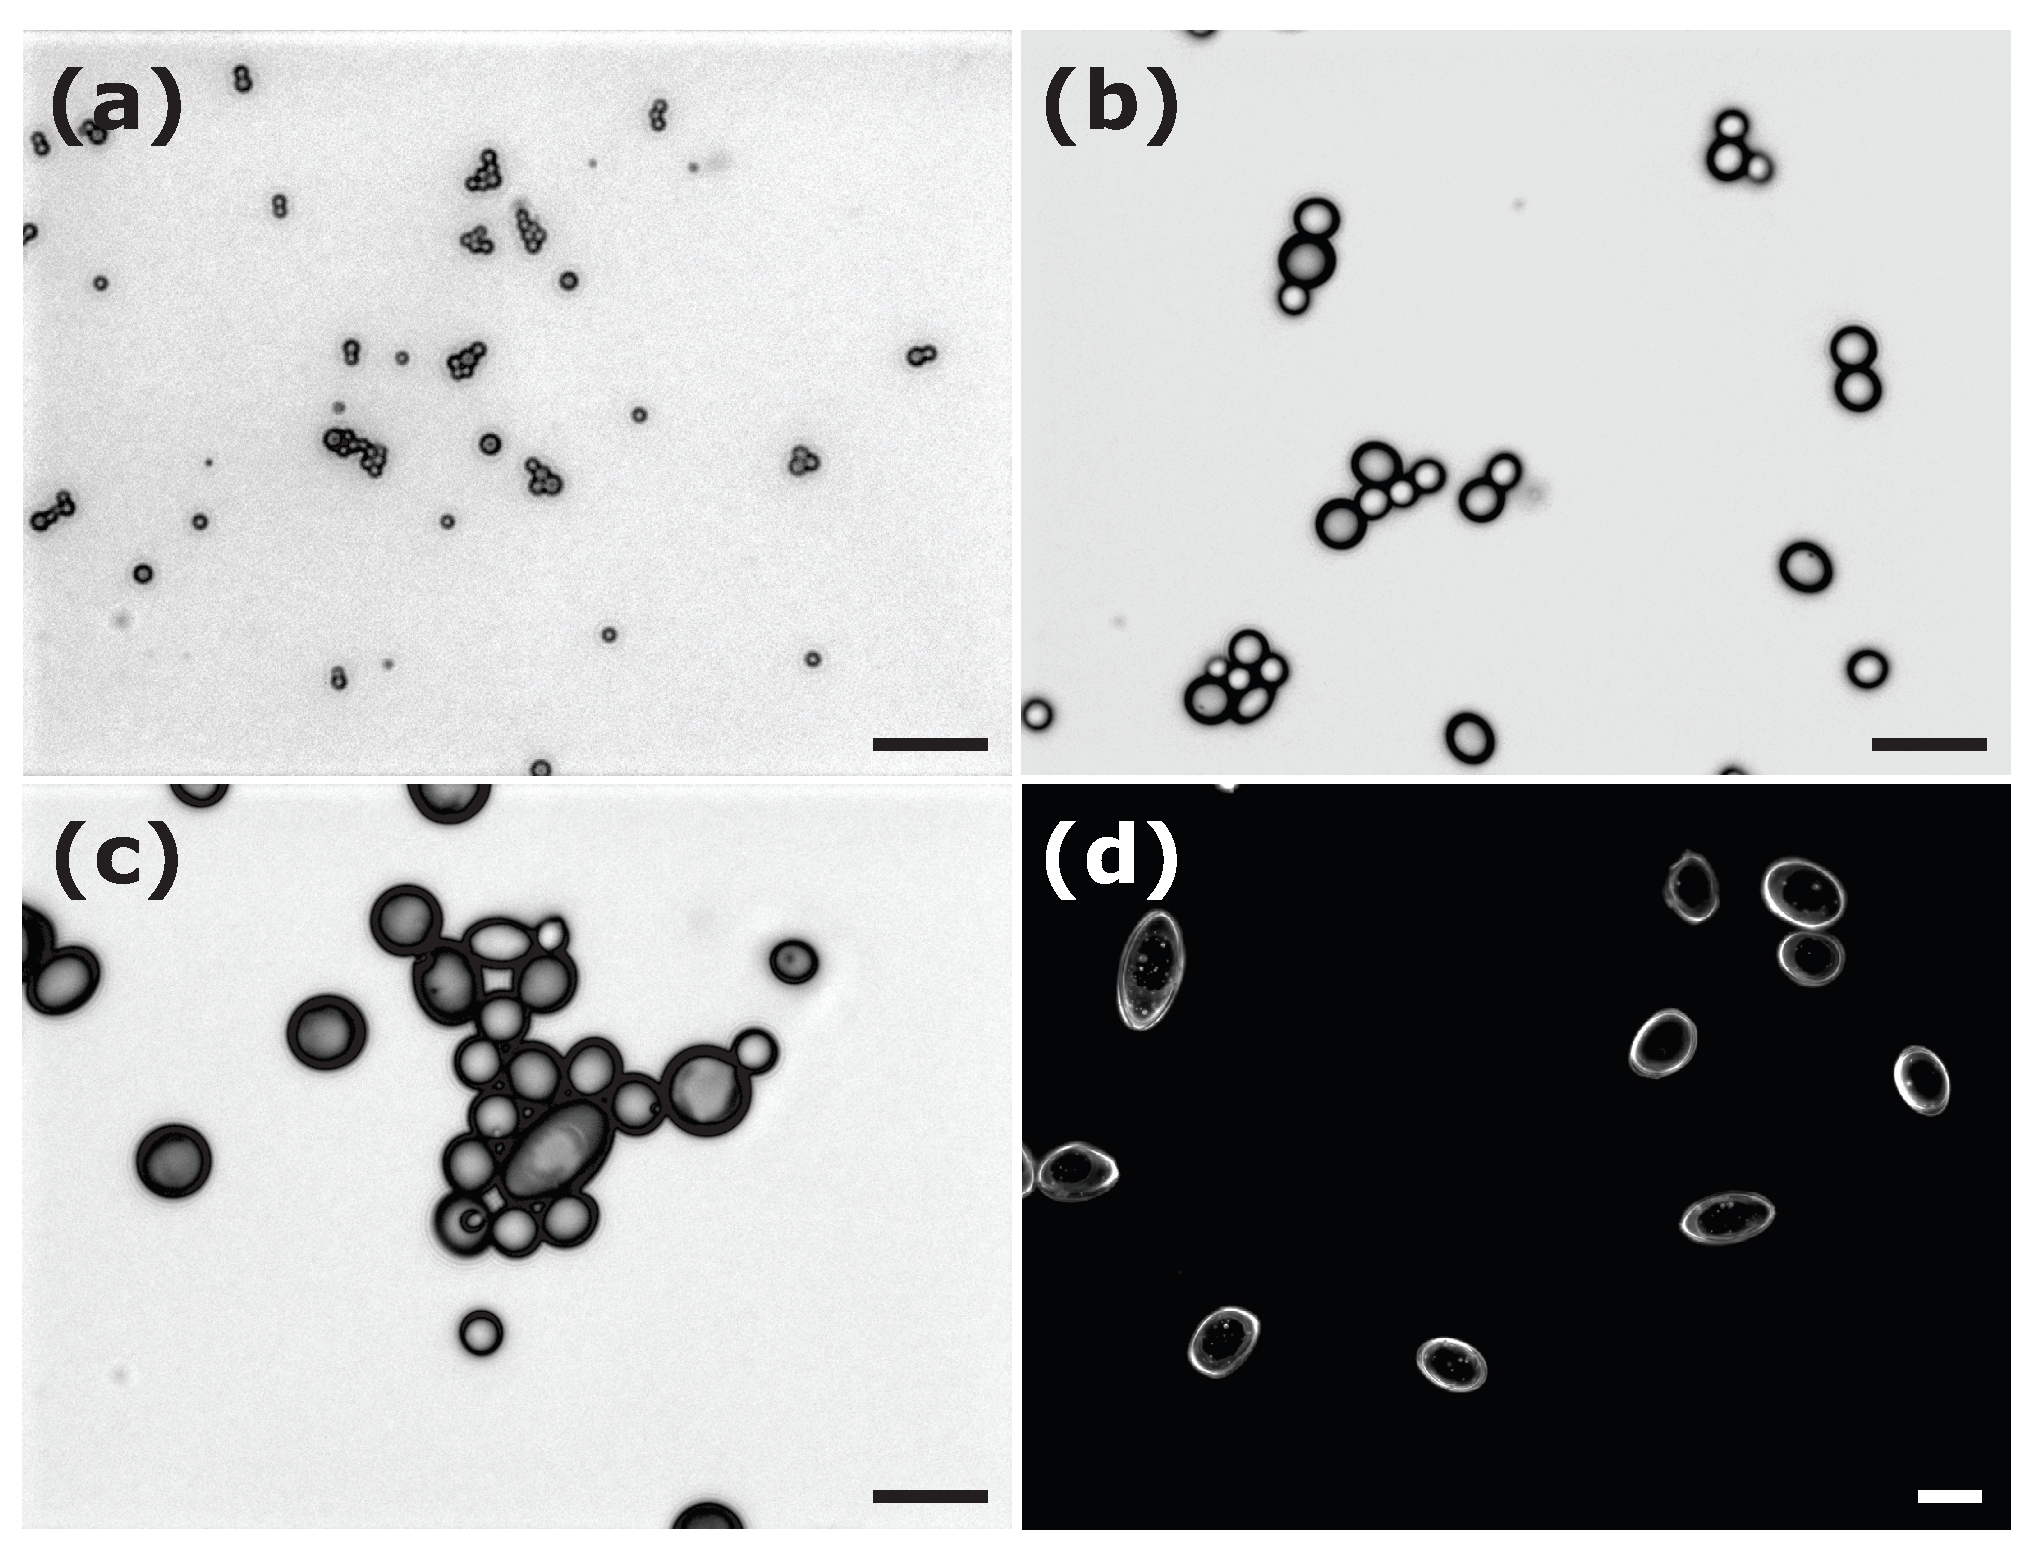
The last method tested was iterative differential centrifugation. Figure 6 shows light microscopy images for the four fractions.
The average particle size and  P D I  of the corresponding fractions obtained from sample EGD5 are summarized in Table 5 (see Supplementary Materials for particle size distributions).
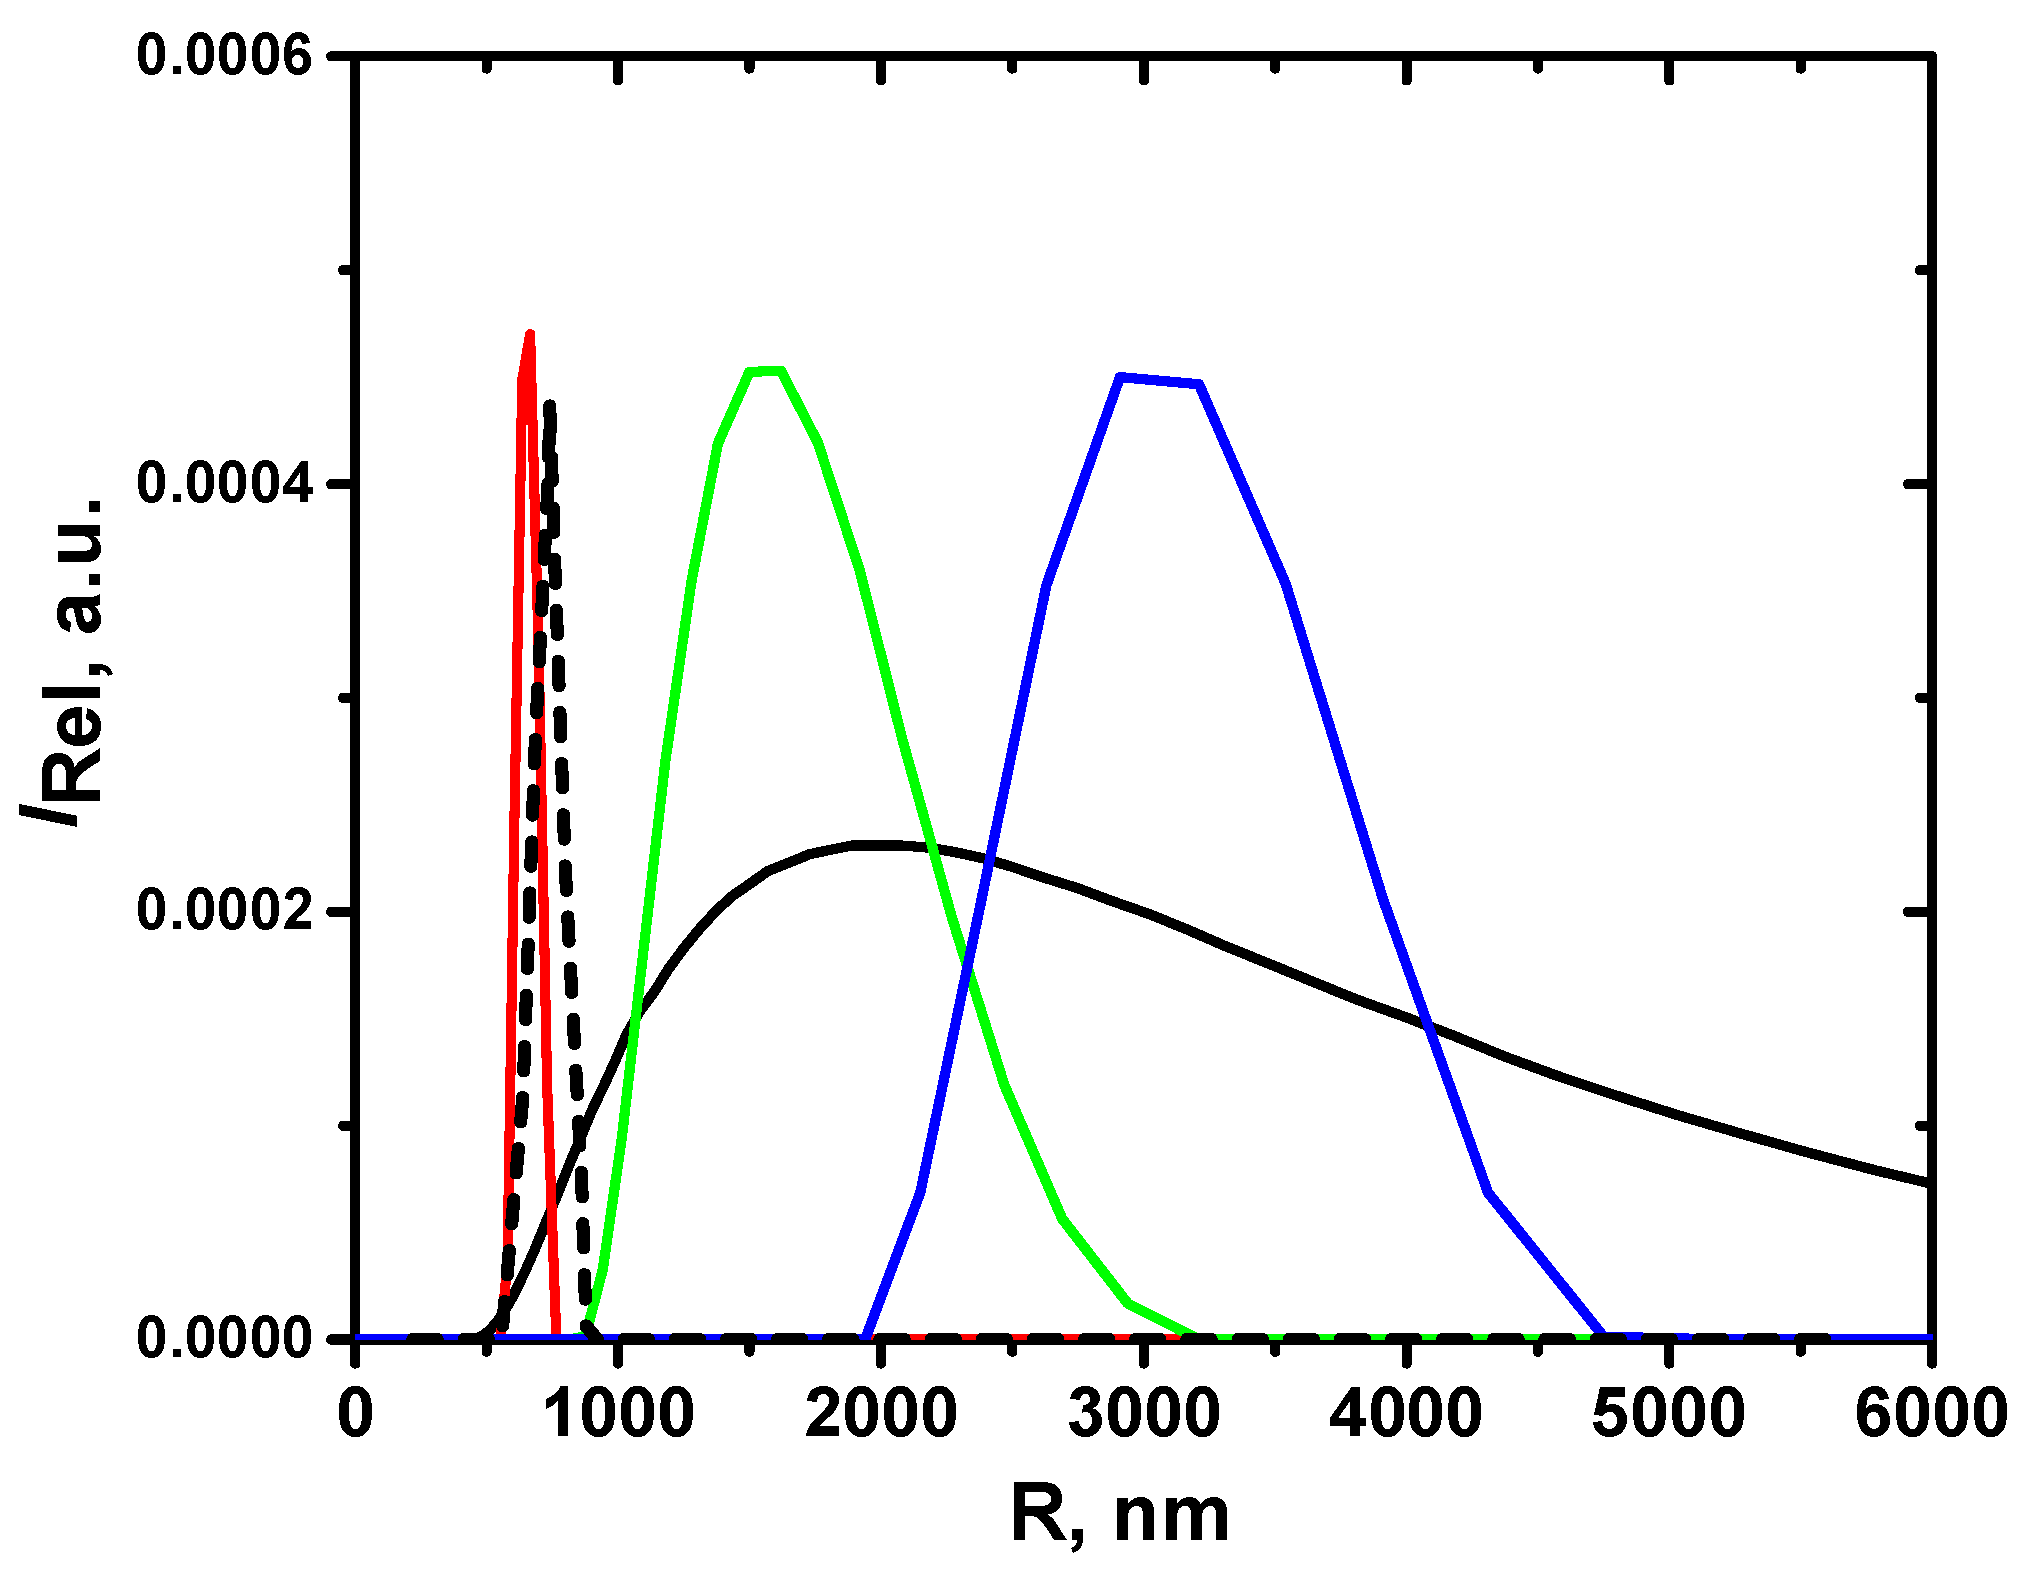
The first two fractions containing the smallest average particles have considerably improved their  P D I . In fact, these  P D I  values are comparable with the one for fraction EGD5F3 of the Bibette method and with those reported earlier [30]. Thus, this result may be considered good. The larger fractions remained quite polydisperse. Figure 7 shows the size distributions obtained by DLS for initial spherical particles E5, ellipsoids EGD5 before fractionation, and the particle fractions EGD5F1, EGD5F2, and EGD5F3.
As can be seen, the initial size distribution is significantly narrowed after the first fractionation. As a result, we can conclude that fractionation by iterative centrifugation has the potential to significantly reduce the size distribution of oblates.

4. Conclusions

We demonstrated the versatility of producing colloidal oblates by deforming an oil-in-gel emulsion. Controlled deformation at a constant temperature yields a large amount of oblates (about 500 mg from one deformation cycle). Therefore, this method of oblate fabrication may be potentially extended to the encapsulation of biologically active substances. Even with proper deformation control, the size of the droplet has a significant impact on the shape of the resulting oblates. Therefore, a broad size distribution of oblate sizes is inevitable. Nevertheless, it is possible to improve the size uniformity by further sample fractionation. The most efficient method of fractionation was found to be iterative differential fractionation.

Supplementary Materials

The following supporting information can be downloaded at: https://www.mdpi.com/article/10.3390/colloids7030050/s1, Figure S1: Schematic representation of the custom-made press for the gel sample deformation: (1) metallic lid; (2) metallic base; (3) PTFE center groove; (4) glass sample cell; (5) PTFE press sliding cylinder; (6) sliding rails; (7) screw sliding cylinder.; Figure S2: Particle size distributions obtained from the analysis of SEM images of spherical polymeric particles solidified in emulsion before droplet deformation (upper row) and deformed particles obtained from the corresponding emulsions (lower row): (a) E1, (b) E5, (c) E6, (d) EGD1, (e) EGD5, and (f) EGD5; Figure S3: Size distributions of particles obtained from DLS using the CONTIN method: spherical particles E6 (black dashed line) and deformed initial EGD6 oblates (black solid line); Figure S4: Particle size distributions obtained from the analysis of SEM images of the four fractions of sample EGD4 (as given in the legend) after differential centrifugation; Figure S5: Particle size distributions obtained from the analysis of SEM images of the effective fractions of sample EGD5 (as given in the legend) after the Bibette fractionation method; Figure S6: Particle size distributions obtained from the analysis of SEM images of the eefective fractions of sample EGD5 (as given in the legend) after fractionation in a sucrose density gradient; Figure S7: Particle size distributions obtained from the analysis of SEM images of the effective fractions of sample EGD5 (as given in the legend) after iterative differential centrifugation; Figure S8: Light microscopy images taken 1 day (a,b), and 14 days (c,d) after preparation of sample EGD5F2 (obtained by iterative centrifugation) by dispersion in water. Scale bars = 10  μ m.

Author Contributions

Conceptualization, A.K.; methodology, S.L.-G. and P.D.-L.; formal analysis, S.L.-G.; investigation, G.V. and S.L.-G.; resources, P.D.-L. and A.K.; writing—original draft, A.K.; writing—review and editing, S.L.-G., P.D.-L. and A.K.; supervision, A.K.; funding acquisition, A.K. All authors have read and agreed to the published version of the manuscript.

Funding

This research was funded by CONACyT (grant CB-A1S-21124) and DGAPA-UNAM (grant IN100322).

Data Availability Statement

Data is contained within the article. Supporting data and figures are provided in Supplementary Materials.

Acknowledgments

We thank Samuel Tehuacanero-Cuapa for SEM image acquisition.

Conflicts of Interest

The authors declare no conflict of interest.

References

  1. Whitesides, G.M.; Grzybowski, B. Self-assembly at all scales. Science 2002, 295, 2418–2421. [Google Scholar] [CrossRef] [PubMed] [Green Version]
  2. Iyer, A.S.; Paul, K. Self-assembly: A review of scope and applications. IET Nanobiotechnol. 2015, 9, 122–135. [Google Scholar] [CrossRef] [PubMed]
  3. Vogel, N.; Retsch, M.; Fustin, C.-A.; del Campo, A.; Jonas, U. Advances in colloidal assembly: The design of structure and hierarchy in two and three dimensions. Chem. Rev. 2015, 115, 6265–6311. [Google Scholar] [CrossRef] [PubMed]
  4. Zhang, H.; Bu, X.; Yip, S.; Liang, X.; Ho, J.C. Self-assembly of colloidal particles for fabrication of structural color materials toward advanced intelligent systems. Adv. Intell. Syst. 2020, 2, 1900085. [Google Scholar] [CrossRef] [Green Version]
  5. Li, Z.; Fan, Q.; Yin, Y. Colloidal self-assembly approaches to smart nanostructured materials. Chem. Rev. 2022, 122, 4976–5067. [Google Scholar] [CrossRef]
  6. Poon, W.C.K.; Pusey, P.N. Phase transition of spherical colloids. In Observation, Prediction, and Simulation of Phase Transitions in Complex Fluids; Baus, M., Rull, L.F., Ryckaert, J.-P., Eds.; Kluwer Academic Publishers: Dordrecht, The Netherlands, 1995. [Google Scholar]
  7. Poon, W.C.K. Colloidal Suspensions; Clarendon Press: Oxford, UK, 2012. [Google Scholar]
  8. Zaccarelli, E. Colloidal gels: Equilibrium and non-equilibrium routes. J. Phys. Condens. Matter 2007, 19, 323101. [Google Scholar] [CrossRef] [Green Version]
  9. Pusey, P.N.; Zaccarelli, E.; Valeriani, C.; Sanz, E.; Poon, W.C.K.; Cates, M.E. Hard spheres: Crystallization and glass formation. Phil. Trans. R. Soc. A 2009, 367, 4993–5011. [Google Scholar] [CrossRef] [Green Version]
  10. Lu, P.J.; Weitz, D.A. Colloidal particles: Crystals, glasses, and gels. Annu. Rev. Condens. Matter Phys. 2013, 4, 217–233. [Google Scholar]
  11. Lopez-Godoy, S.; Díaz-Leyva, P.; Kozina, A. Self-assembly in binary mixtures of spherical colloids. Adv. Coll. Inter. Sci. 2022, 308, 102748. [Google Scholar] [CrossRef]
  12. Sacanna, S.; Pine, D.J. Shape-anisotropic colloids: Building blocks for complex assemblies. Curr. Opin. Coll. Inter. Sci. 2011, 16, 96–105. [Google Scholar] [CrossRef]
  13. Dugyala, V.R.; Daware, S.V.; Basavaraj, G.M. Shape anisotropic colloids: Synthesis, packing behavior, evaporation driven assembly, and their application in emulsion stabilization. Soft Matter 2013, 9, 6711. [Google Scholar] [CrossRef]
  14. Lee, K.J.; Yoon, J.; Lahann, J. Recent advances with anisotropic particles. Curr. Opin. Coll. Inter. Sci. 2011, 16, 195–202. [Google Scholar] [CrossRef]
  15. Li, T.; Lilja, K.; Morris, R.J.; Brandani, G.B. Langmuir–Blodgett technique for anisotropic colloids: Young investigator perspective. J. Coll. Inter. Sci. 2019, 540, 420–438. [Google Scholar] [CrossRef]
  16. Krishnamurthy, S.; Kalapurakal, R.A.M.; Mani, E. Computer simulations of self-assembly of anisotropic colloids. J. Phys. Condens. Matter 2022, 34, 273001. [Google Scholar] [CrossRef]
  17. Furst, E.M. Directed self-assembly. Soft Matter 2013, 9, 9039–9045. [Google Scholar] [CrossRef]
  18. Yang, S.-M.; Kim, S.-H.; Lima, J.-M.; Yi, G.-R. Synthesis and assembly of structured colloidal particles. J. Mater. Chem. 2008, 18, 2177–2190. [Google Scholar] [CrossRef]
  19. Cuetos, A.; Martínez-Haya, B. Columnar phases of discotic spherocylinders. J. Chem. Phys. 2008, 129, 214706. [Google Scholar] [CrossRef]
  20. Fejer, S.N.; Chakrabarti, D.; Wales, D.J. Self-assembly of anisotropic particles. Soft Matter 2011, 7, 3553–3564. [Google Scholar] [CrossRef]
  21. Kao, P.-K.; Solomon, M.J.; Ganesan, M. Microstructure and elasticity of dilute gels of colloidal discoids. Soft Matter 2022, 18, 1350–1363. [Google Scholar] [CrossRef]
  22. Lu, J.; Bu, X.; Zhang, X.; Liu, B. Self-assembly of shape-tunable oblate colloidal particles into orientationally ordered crystals, glassy crystals and plastic crystals. Soft Matter 2021, 17, 6486–6494. [Google Scholar] [CrossRef]
  23. Hsiao, L.C.; Schultz, B.A.; Glaser, J.; Engel, M.; Szakasits, M.E.; Glotzer, S.C.; Solomon, M.J. Metastable orientational order of colloidal discoids. Nat. Commun. 2015, 6, 8507. [Google Scholar] [CrossRef] [PubMed] [Green Version]
  24. Doshia, N.; Zahr, A.S.; Bhaskar, S.; Lahann, J.; Mitragotri, S. Red blood cell-mimicking synthetic biomaterial particles. Proc. Natl. Acad. Sci. USA 2009, 106, 21495–21499. [Google Scholar] [CrossRef] [PubMed]
  25. Chen, J.; Clay, N.; Kong, H. Non-spherical particles for targeted drug delivery. Chem. Eng. Sci. 2015, 125, 20–24. [Google Scholar] [CrossRef] [PubMed] [Green Version]
  26. Kapate, N.; Clegg, J.R.; Mitragotri, S. Non-spherical micro- and nanoparticles for drug delivery: Progress over 15 years. Adv. Drug Delivery Rev. 2021, 177, 113807. [Google Scholar] [CrossRef]
  27. de Folter, J.W.J.; Hutter, E.M.; Castillo, S.I.R.; Klop, K.E.; Philipse, A.P.; Kegel, W.K. Particle shape anisotropy in Pickering emulsions: Cubes and peanuts. Langmuir 2014, 30, 955–964. [Google Scholar] [CrossRef]
  28. Ding, T.; Liu, Z.-F.; Song, K.; Clays, K.; Tung, C.-H. Photonic crystals of oblate spheroids by blown film extrusion of prefabricated colloidal crystals. Langmuir 2009, 25, 10218–10222. [Google Scholar] [CrossRef]
  29. Cho, Y.-S.; Kim, Y.K.; Chung, K.C.; Choi, C.J. Deformation of colloidal crystals for photonic band gap tuning. J. Dispers. Sci. Technol. 2011, 32, 1408–1415. [Google Scholar] [CrossRef]
  30. Florea, D.; Wyss, H.M. Towards the self-assembly of anisotropic colloids: Monodisperse oblate ellipsoids. J. Coll. Int. Sci. 2014, 416, 30–37. [Google Scholar] [CrossRef]
  31. Ahn, S.J.; Ahn, K.H.; Lee, S.J. Film squeezing process for generating oblate spheroidal particles with high yield and uniform sizes. Colloid Polym. Sci. 2016, 294, 859–867. [Google Scholar] [CrossRef]
  32. Courbaron, A.-C.; Cayre, O.J.; Paunov, V.N. A novel gel deformation technique for fabrication of ellipsoidal and discoidal polymeric microparticles. Chem. Commun. 2007, 2007, 628–630. [Google Scholar] [CrossRef]
  33. Mathaes, R.; Winter, G.; Besheer, A.; Engert, J. Non-spherical micro- and nanoparticles: Fabrication, characterization and drug delivery applications. Expert Opin. Drug Deliv. 2015, 12, 481–492. [Google Scholar] [CrossRef] [PubMed]
  34. Doshi, N.; Prabhakarpandian, B.; Rea-Ramsey, A.; Pant, K.; Sundaram, S.; Mitragotri, S. Flow and adhesion of drug carriers in blood vessels depend on their shape: A study using model synthetic microvascular networks. J. Control. Rel. 2010, 146, 196–200. [Google Scholar] [CrossRef] [PubMed] [Green Version]
  35. Yoo, J.-W.; Doshi, N.; Mitragotri, S. Endocytosis and intracellular distribution of PLGA particles in endothelial cells: Effect of particle geometry. Macromol. Rapid Commun. 2010, 31, 142–148. [Google Scholar] [CrossRef] [PubMed]
  36. Bibette, J. Depletion interactions and fractionated crystallization for polydisperse emulsion purification. J. Coll. Int. Sci. 1991, 147, 474–478. [Google Scholar] [CrossRef]
  37. Moroi, Y.; Motomura, K.; Matuura, R. The critical micelle concentration of sodium dodecyl sulfate-bivalent metal dodecyl sulfate mixtures in aqueous solutions. J. Coll. Int. Sci. 1974, 46, 111–117. [Google Scholar] [CrossRef]
  38. Peters, D. Ultrasound in materials chemistry. J. Mater. Chem. 1996, 6, 1605–1618. [Google Scholar] [CrossRef]
  39. Pratap-Singh, A.; Guo, Y.; Ochoa, S.L.; Fathordoobady, F.; Singh, A. Optimal ultrasonication process time remains constant for a specific nanoemulsion size reduction system. Sci. Rep. 2021, 11, 9241. [Google Scholar] [CrossRef]
  40. Gupta, A.; Eral, H.B.; Hatton, T.A.; Doyle, P.S. Controlling and predicting droplet size of nanoemulsions: Scaling relations with experimental validation. Soft Matter 2016, 12, 1452–1458. [Google Scholar] [CrossRef] [Green Version]
  41. Belgheisi, S.; Motamedzadegan, A.; Milani, J.M.; Rashidi, L.; Rafe, A. Impact of ultrasound processing parameters on physical characteristics of lycopene emulsion. J. Food Sci. Technol. 2021, 58, 484–493. [Google Scholar] [CrossRef]
Figure 1. SEM images of spherical polymeric particles solidified in an emulsion prepared by ultrasonication using (a) 10 mM aqueous SDS solution during 10 min of ultrasonication at the ultrasonic processor amplitude of 20%, (b) 1% wt PVA solution as a continuous phase during 10 min of ultrasonication at the ultrasonic processor amplitude of 20%, (c) 1% wt PVA solution during 10 min of ultrasonication at the ultrasonic processor amplitude of 50%, and (d) 10 mM aqueous SDS solution during 3 min of ultrasonication at the ultrasonic processor amplitude of 20%. Scale bars = 1  μ m.
Colloids 07 00050 g001
Figure 2. SEM images of solidified spherical polymeric particles in emulsion: (a,c) without gel; (b,d) in the gel. The upper row corresponds to samples E8 and EG8, and the lower row to samples E5 and EG5. Scale bars = 1  μ m.
Colloids 07 00050 g002
Figure 3. SEM images of spherical polymeric particles solidified in emulsion (left column) and their corresponding deformed particles (right column): (a) E1, (b) EGD1, (c) E5, (d) EGD5, (e) E6, and (f) EGD6. Scale bars = 1  μ m.
Colloids 07 00050 g003
Figure 4. SEM images of deformed particles obtained from the corresponding emulsions: (a) EGD2 from E2, (b) EGD4 from E4, (c) EGD7 from E7, and (d) EGD8 from E8. Scale bars = 1  μ m.
Colloids 07 00050 g004
Figure 5. SEM images of fractions of deformed particles obtained by centrifugation for 3 min at: (a) 400 (11× g), (b) 500 (18× g), (c) 650 (30× g), and (d) 800 (45× g) rpm. Scale bars = 10  μ m.
Colloids 07 00050 g005
Figure 6. Light microscopy images of fractions of deformed particles obtained by iterative differential centrifugation: (a) EGD5F1 (1115× g; 5 min), (b) EGD5F2 (1115× g; 1 min), (c) EGD5F3 (865× g; 1 min), and (d) EGD5F4 (70× g; 1 min). Scale bars = 10  μ m.
Colloids 07 00050 g006
Figure 7. Size distributions of particles obtained from DLS using the CONTIN method: spherical particles E5 (black dashed line), a deformed initial EGD5 sample (black solid line), and the fractions EGD5F1 (red line), EGD5F2 (green line), and EGD5F3 (blue line).
Colloids 07 00050 g007
Table 1. Average radius and  P D I  for spherical particles prepared by ultrasonication at 20% amplitude for 10 min.
SampleSurfactantR, nm   PDI
E1SDS7100.32
E2SDS7500.26
E3SDS5500.27
E4SDS7100.35
E5PVA7200.14
E6PVA6100.20
E7PVA8500.22
E8PVA6200.19
Table 2. Average radius and  P D I  for spherical (R and  P D I ) and deformed (R o b  and  P D I o b ) particles.
SampleSurfactantR, nm   PDI R ob , nm   PDI ob
EGD1SDS7100.329900.53
EGD2SDS7500.269300.46
EGD4SDS7100.3510300.41
EGD5PVA7200.1411000.37
EGD6PVA6100.209000.40
EGD7PVA8500.229600.35
EGD8PVA6200.197500.38
Table 3. Average particle radius and  P D I  for deformed particles obtained by fractionation with the Bibette method.
SampleCMCR ob , nm   PDI ob
EGD5011000.37
EGD5F1111300.24
EGD5F2211000.21
EGD5F339500.14
EGD5F446500.23
EGD5F559800.23
Table 4. Average particle radius and  P D I  for deformed particles obtained by fractionation in a sucrose density gradient. The fraction numbering starts from the uppermost fraction.
SampleSucrose, % wtR ob , nm   PDI ob
EGD5011000.37
EGD5F1205150.25
EGD5F2257800.34
EGD5F3307400.33
EGD5F4357300.30
EGD5F54024,0000.36
Table 5. Average particle radius and  P D I  for deformed particles obtained by iterative differential centrifugation. The fraction numbering starts from the fraction of the smallest particle size.
Sampleg-Force, gR ob , nm   PDI ob
EGD5011000.37
EGD5F11115 (5 min)4900.14
EGD5F21115 (1 min)14500.19
EGD5F3865 (1 min)27400.28
EGD5F470 (1 min)16,6000.33
EGD5F5sediment24,6000.25
Disclaimer/Publisher’s Note: The statements, opinions and data contained in all publications are solely those of the individual author(s) and contributor(s) and not of MDPI and/or the editor(s). MDPI and/or the editor(s) disclaim responsibility for any injury to people or property resulting from any ideas, methods, instructions or products referred to in the content.