Abstract
This study reports a simple, fast, and low-cost detection of noradrenaline (NA) in wastewater using citrate-capped colloidal gold nanoparticles (AuNPs). The addition of NA to citrate-capped colloidal AuNPs generates a colour modulation that the bare eye can detect due to the aggregation of the colloidal AuNPs. The relationship between the NA concentration and colloidal AuNPs aggregation was further monitored by ultraviolet–visible light (UV–vis) spectroscopy in an aqueous solution. The method displayed a linear range of 0–500 μM with R2 = 0.99 and an LOD and LOQ of 42.2 and 140.5 μM. Application in an environmental sample collected from the Darville Wastewater Treatment Plant shows that this work provided a cost-effective and spectrophotometric method that could be used for monitoring contamination in wastewater.
1. Introduction
Micro-pollutants, especially hormones, are endocrine disruptor (EDC) biomarkers that enter the environment at trace levels and pose threat to human and aquatic organisms [1,2]. The World Health Organization (WHO) defines EDCs as a substance that alters the function of the endocrine system and causes an adverse effect in target organisms at trace level [3,4]. Hence, the need to develop colloidal nanoparticle probes that can be implemented on-site to control contaminants in environmental water bodies is a pressing issue [4,5,6,7]. The alarming rate of the release of emerging anthropogenic and industrial contaminants in water prioritizes the development of fast, specific, in-situ, and straightforward methods to understand their effects, removal efficiency in wastewater treatments, and implementation of early warning systems. A large percentage of environmental emerging contaminants are pharmaceuticals due to increased production and consumption [8,9]. Pharmaceutical active biological compounds, even in small quantities, may adversely affect the quality of water for drinking and the aquatic life in the contaminated water body.
Noradrenaline (NA) is a catecholamine neurotransmitter that dual functions as a hormone. NA hormone is produced by the adrenal glands and nerve endings in response to anxiety, stress, memory, and sleep; it is also responsible for the body’s “fight or flight” response [10,11]. NA is known to cause an increase in patients’ blood pressure [12]. The presence of abnormal levels of NA in bodily fluids is linked to mental health illnesses, neurogenerative diseases, and cancerous tumours [10,12]. Thus, the detection in body fluids, such as blood and urine, is an imperative tool in the medical industry in the early detection and diagnosis of cancer. Therefore, the environmental monitoring of NA in wastewater would prove beneficial by providing an overall health assessment of the population, also allowing the opportunity to understand its accumulation, transformation, and effect on the quality of the environment. Analytical techniques reported for the determination of NA require sophisticated instrumentation such as liquid chromatography (LC) [13], mass spectroscopy (MS) [14], and fluorometric techniques [15] for the determination of NA at low concentrations. Hence, the existing analytical methods of NA detection require sophisticated instrumentation and require complicated procedures. Therefore, optical biosensors are a suitable option for providing time and cost-efficient, sensitive, selective and specific detection of contaminants and offering on-site analysis for effective environmental monitoring [16]. Recently, the analysis of neurotransmitters such as NA in wastewater has gained more interest from researchers. Casadio et al. investigated molecularly imprinted polymers for thermal detection of NA in an aqueous solution up to environmental relevant concentration [17]. In another study, Mukdusai et al. fabricated a novel electrochemical sensor for the determination of NA using multi-walled carbon nanotubes [18]. In general, the occurrence of neurotransmitters in the environment is greater than first anticipated and more researchers are now developing a rapid method for their detection in surface waters [13,19,20]. Pandopulos et al. developed a sensitive method for the measurement of neurotransmitter metabolites in wastewater [21].
Colloidal gold nanoparticles (AuNPs) are ideal colorimetric biosensors due to their (i) simple functionalization, (ii) unique optical properties, and (iii) simple synthesis of uniform shape and size particles [22,23]. Their unique optical property is the localized surface plasmon resonance (LSPR), which is a result of the interaction of light and conduction of the delocalized electron bands on citrate-capped colloidal AuNPs [24,25]. The LSPR is dependent on the distance between nanoparticles. Therefore, the introduction of an analyte promotes the selective and sensitive aggregation of AuNPs, which can be interpreted as an analytical signal. The aggregation decreases the distance between the nanoparticles (NPs) and results in the shift of the LSPR of AuNPs to a longer wavelength [10,26,27]. This allows for the bare-eye detection based on colour modulation of the original ruby-red solution to blue. This bare-eye detection technique coupled with UV–vis spectrophotometry provides for the simple, fast and in-situ qualitative and quantitative determination of the target analyte to be studied.
Therefore, this study describes a spectroscopic technique to detect and quantify NA in wastewater. Upon the addition of NA, the citrate-capped colloidal AuNPs interact via electrostatic response and therefore result in aggregation of the colloidal AuNPs accompanied by a shift to a longer wavelength. The aggregation provides a colour modulation, which allows the detection of NA by the bare eye, and the plasmonic peak at the visible region allows quantification of NA up to 140.5 μM in wastewater.
2. Materials and Methods
2.1. Reagents and Apparatuses
Gold(III) chloride trihydrate (99.9%), L-norepinephrine hydrochloride (noradrenaline) (98.0% HPLC grade), salicylic acid, xylitol, sulfamethoxazole, and acetic acid were purchased from Sigma Aldrich. Acetaminophen and phenacetin were purchased from BDH laboratory reagents. Caffeine was purchased from UniLab. Trisodium citrate dihydrate was purchased from Merck. All reagents were used without further purification. All aqueous solutions were prepared using 18.2 MΩ cm Millipore water.
2.2. Instrumental Specifications and Parameters
UV–vis absorption spectra were recorded on an Ocean Optics spectrometer HR200+ high-resolution spectrometer using a 1 cm pathlength quartz cuvette with the light source shutter, halogen and deuterium bought from Ocean Optics (Duiven, The Netherlands). TEM images were obtained using a JOEL 1010 transmission electron microscope. XRD patterns were recorded using the Bruker AXS with a D8 advanced spectrometer with a step size of 0.034° and a 2ϴ range of 20–100°. FT-IR spectra were captured using PerkinElmer Spectrum 100 FT-IR Spectrometer at a wavelength range of 400–4000 cm−1 bought from PerkinElmer (Midrand, South Africa). Zetasizer ultra zeta meta (Malvern Panalytical, Malvern, UK). All analyses were conducted at room temperature 25 ± 3 °C.
2.3. Preparation of Citrated-Gold Nanoparticles
Citrate-capped AuNPs were prepared in Millipore water via the Turkevich citrate reduction method of reducing gold(III) chloride trihydrate as shown in Scheme 1 [25]. Firstly, 0.0202 g of gold(III) chloride trihydrate was added to 190 mL of boiling Millipore water on a hotplate. When the 0.27 mM gold solution was vigorous boiling, 10 mL of 13.54 mM sodium citrate (0.1747 g in 50 mL) was instantly added to the heating system. The solution was left vigorously boiling until the solution underwent a colour modulation from yellow to colourless to black and finally, ruby red. The solution was removed from the hotplate and cooled to room temperature upon obtaining the ruby-red colour. After that, the solution was transferred into a glass bottle and stored in a dark place at room temperature for several weeks.
Scheme 1.
Preparation of nanoparticle probe and sensing of NA.
2.4. Sensing of NA and Selectivity Studies
For NA sensing, standards of 50–750 μM were freshly prepared in Millipore water. A volume of 1 mL of citrate-capped AuNPs was added to 1 mL of the corresponding NA standard. The mixture was shaken for 5 min before the UV–vis spectra were obtained at room temperature. This procedure was repeated for samples related to NA analysis.
To ensure the selectivity of the colloidal probe, sensing of possible interferences (acetaminophen, phenacetin, salicylic acid, caffeine, xylitol, and sulfamethoxazole) were tested. The selectivity studies were conducted as described in sensing of NA, the concentration of 500 μM prepared in Millipore water was chosen for the possible interference-studied analytes.
2.5. Analysis of NA in Real Water Samples
To ensure the reliability of the colloidal nanoparticle probe, NA in a real environmental water sample was tested via the standard addition method. The water samples were obtained from the Darville WasteWater Treatment Site in KwaZulu Natal, South Africa. Briefly, 1 mL of the real water sample was added to the NA standards and made up with Millipore water thereafter.
3. Results
3.1. Characterisation of Citrate-Capped Colloidal AuNPs
The colour modulation of the yellow gold solution to the ruby-red solution confirmed the synthesis of citrate-capped AuNPs, indicating the reduction of Au+ → Au0 (Figure 1a) [25,28]. The synthesized citrate-capped colloidal AuNPs were characterized by UV–vis spectrophotometry, FT-IR, XRD, and TEM and the results are presented in Figure 1. The UV–vis confirmed the LSPR absorbance peak at λmax 526 nm, which is a characteristic absorption band of AuNPs (Figure 1a). The FT-IR spectra of citrate-capped colloidal AuNPs (Figure 1b) show a broad band ranging from 3400–3200 cm−1 and a peak at 1642 cm−1 that was attributed to the C-OH and asymmetric stretch of COO− of citrate groups, indicating the presence of citrate on the surface of the AuNPs. The XRD pattern (Figure 1c) was used to investigate the crystallinity and size of citrate-capped AuNPs. The citrate-capped AuNPs exhibited characteristic peaks at 38.473, 44.74, 65.135, and 78.229°, with corresponding Bragg reflections at (111), (200), (220), and (311) of a face cubic centre (fcc) lattice. The intense peak at 38.473° indicates the preferred growth orientation (moderate texture) of the Au0. Overall, the pattern is typical of citrate-capped AuNPs with small intensities resulting from the organic residue present in the sample and an apparent average particle size of 34.63 ± 3.1 nm. The size and shape of citrate-capped AuNPs were also confirmed via several TEM images; it was observed that the average particle had a spherical shape with a size of 19 ± 1 nm, which differs from the value obtained with the XRD diffractogram. However, the XRD value was close to the average diameter of 40 nm determined using the zeta sizer instrument shown in Figure 1f.
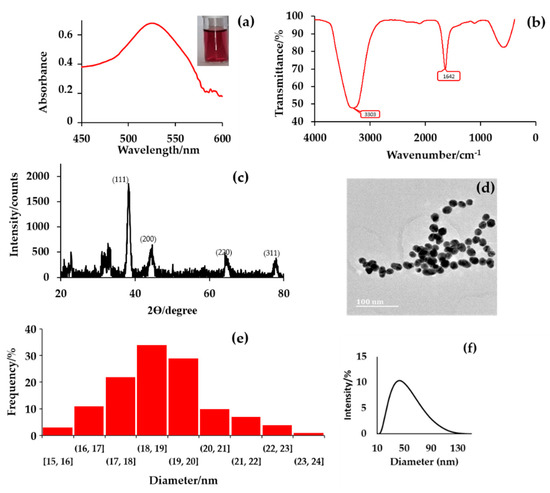
Figure 1.
The characterization of citrate-capped AuNPs via, (a) UV–vis spectroscopy and colour modulation, (b) FT-IR spectroscopy, (c) XRD analysis, (d) TEM imaging, (e) particle size distribution obtained from several TEM images, and (f) zeta sizer size distribution.
3.2. Characterisation of Aggregated Colloidal AuNPs
The introduction of NA into the citrate-capped colloidal AuNPs resulted in an instant colour modulation from an intense ruby-red colour to a deep blue colour. This was due to the shift in the LSPR peak as a result of aggregation of the citrate-capped colloidal AuNPs. UV–vis spectroscopy and TEM images in Figure 2, further confirm the interaction of NA and AuNPs. The UV–vis spectrum shows the peak at 526 nm of AuNPs decreases in absorbance with the appearance of an increasing peak at 642 nm proportional to the concentration of the target analyte. This is due to the integration of the negative citrate charges and positive amine group charges via electrostatic forces, bringing about the aggregation of the citrate-capped colloidal AuNPs. The TEM images in Figure 2b shows that the shape of the AuNPs remains spherical and the average particle size (20 ± 1 nm). This supports a scenario whereby the shift in the LSPR peak of the citrate-capped colloidal AuNPs is due to the presence of NA, causing AuNPs aggregates. This aggregation results from the electrostatic interaction between the negatively charged citrate and positivity charges amine group promoted by the affinity of nitrogen for Au colloids on NA, supported by TEM images. The formation of aggregate was further confirmed by zeta sizer in Figure 2d, an observable peak at 122 nm, which was attributed to the size of aggregated nanoparticles.
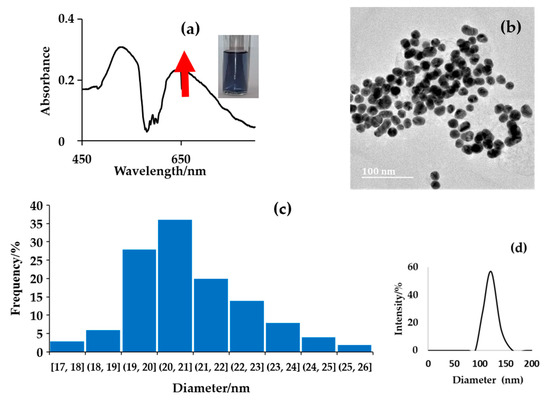
Figure 2.
The characterization of citrate-capped AuNPs colloidal aggregated by NA, (a) UV–vis spectroscopy and colour modulation, (b) TEM imaging, (c) particle size distribution obtained from several TEM images and (d) zeta sizer size distribution.
3.3. Method Development
Since NA in wastewater has not been evaluated or regulated, and its concentration permissible in environmental water has not been set, the concentration range evaluated in this study was between 0–500 μM. In Figure 3a, the colour varies with a concentration in the targeted range; changes from a light red colour at low concentrations (0–200 μM), to violet mid-concentrations (250–350 μM) and finally, blue at the high-concentrations (400–500 μM). This is due to robust aggregation at higher concentrations of NA, resulting in a wavelength shift from 526 nm to 645 nm.
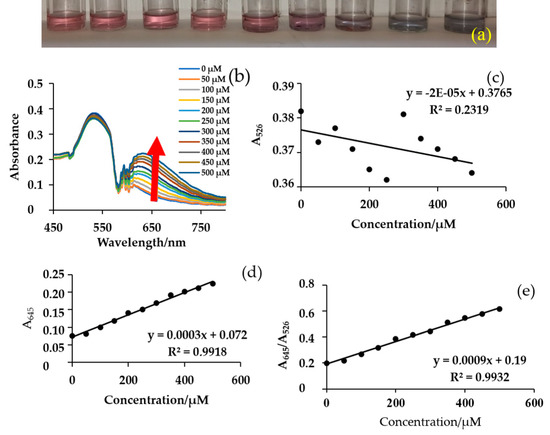
Figure 3.
Response of NA to citrate-capped AuNPs (a) colour variation, (b) UV–vis spectra of AuNPs and NE, and calibration curves plotted from (c) absorbance at 526 nm, (d) absorbance at 645 nm, and (e) ratio of 645 and 526 nm as a function of NA standards from 0–500 μM.
Absorbance increases proportionally to the concentration of NA in Figure 3b at 645 nm wavelength. In Figure 3b–d, different calibration curves were constructed and regression analysis was performed to evaluate them, a plot of absorbance ratio at 645/526 nm versus concentration of NA shows a good analytical signal (Figure 3). The R2 values of absorbance at 526 nm were very low at 0.2319, at 654 nm, and at the absorbance ratio R2 = 0.99. The R2 improved at the absorbance ratio (R2 = 0.9932). This is because the aggregation depends on both concentrations of NA and Au colloids.
Limit of Detection (LOD) and Limit of Quantification (LOQ)
The LOD and LOQ were obtained from the calibration curves shown in Figure 3, validation results are presented in Table 1. LOD and LOQ were calculated using formulas 3.3 σ/S and 10 σ/S, respectively. Where σ is the standard deviation and S is the slope of the curve. The absorbance ratio calibration curve had low detection limits due to free Au colloids correcting aggregated AuNPs, functioning similarly to an internal standard. Detection limits were low enough to allow this proposed colorimetric probe method to be applied in the quantification of NA in wastewater.

Table 1.
The LOD and LOQ for NA using citrate-capped AuNPs.
The citrate-capped AuNPs probe was tested against possible compounds normal detected in wastewater; acetaminophen, phenacetin, salicylic acid, caffeine, xylitol, and sulfamethoxazole. In Table 2, the probe demonstrated selectivity for NA only over investigated analytes demonstrating the environmental suitability of the probe.
Table 2.
The selectivity of the citrate-capped AuNPs against NA and possible interferences.
4. Discussion
4.1. Application of Citrate-Capped Colloidal AuNPs Probe in Wastwater
The proposed colorimetric probe was tested for its efficiency in determining NA in complex matrices. The probe was tested in wastewater obtained from the Darville Wastewater Treatment Plant via the standard addition method. In Figure 4, the calibration curve was constructed using the absorbance ratio with 1 mL of wastewater added. The linearity of the R2 value decreased in comparison to the calibration curve obtained in Millipore water, indicating potential matrice interferences and supporting the use of the standard addition method. However, the calibration curves were not significantly different, indicating that the matrix effect is low and was kept at a minimum by using a smaller volume of sample. The concentration of NA in wastewater was found to be below the quantification limits.
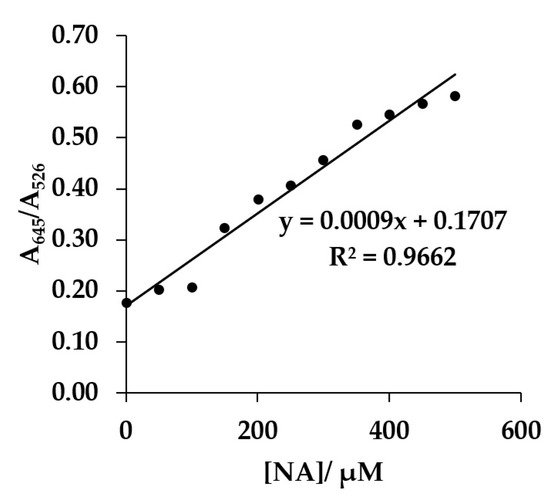
Figure 4.
Analysis of NA in wastewater using colloidal gold nanoparticles by the standard addition method.
4.2. Comparison with the Literature
Colloidal nanoparticles probe present alternative analytical methods for monitoring environmental contaminants because they are very easy to prepare, cheap, and versatile. The colorimetric sensing application of AuNPs to detect the target analyte relies on the quantitative coupling between colloidal nanoparticles. Table 3 shows promising visual readout sensors that have been developed to detect various analytes. There is a need to develop techniques for on-site monitoring of emerging contaminants and biomarkers. The methods provided are recent, showing that the use of colloidal AuNPs for detection is ongoing research, which is under development.
Table 3.
Comparison of the current method with the literature.
5. Conclusions
The findings of this study proved that simple, fast and low-cost citrate-capped colloidal AuNPs can be used for colorimetric and spectrophotometric detection of NA in wastewater. Citrate-capped colloidal AuNPs with a diameter of 18 ± 1 nm were synthesised via Turkevich’s method. In the presence of NA, the ruby-red solution of AuNPs underwent a colour modulation to blue, indicating the formation of aggregates. This results in a shift of the citrate-capped AuNPs LSPR peak from 526 nm to 645 nm due to the aggregation of citrate-capped AuNPs. The LOD and LOQ were 42.16 and 140.54 μM, respectively. The linearity range was 0–500 μM with an R2 of 0.9932 using the absorbance ratios. The wastewater application of the method proved to detect moderate levels of NA. The proposed technique can be used to investigate the accumulation, transformation, and removal efficiency of NA in wastewater treatment plants.
Author Contributions
Conceptualization, B.G. and N.H.; methodology, N.A.; software, N.A.; validation, N.A., B.G. and N.H.; formal analysis, N.A.; investigation, N.A.; resources, B.G.; data curation, N.A.; writing—original draft preparation, N.A.; writing—review and editing, B.G. and N.H.; visualization, N.H.; supervision, B.G.; project administration, B.G. and N.H.; funding acquisition, B.G. All authors have read and agreed to the published version of the manuscript.
Funding
This research was funded by the National Research of South Africa, grant number 12202.
Data Availability Statement
Not applicable.
Acknowledgments
The authors would like to acknowledge honors technician, Mehawalal Somaru.
Conflicts of Interest
The authors declare no conflict of interest. The funders had no role in the design of the study; in the collection, analyses, or interpretation of data; in the writing of the manuscript; or in the decision to publish the results.
References
- Adeel, M.; Song, X.; Wang, Y.; Francis, D.; Yang, Y. Environmental Impact of Estrogens on Human, Animal and Plant Life: A Critical Review. Environ. Int. 2017, 99, 107–119. [Google Scholar] [CrossRef]
- Yazdan, M.M.S.; Kumar, R.; Leung, S.W. The Environmental and Health Impacts of Steroids and Hormones in Wastewater Effluent, as Well as Existing Removal Technologies: A Review. Ecologies 2022, 3, 206–224. [Google Scholar] [CrossRef]
- Chen, Y.; Xie, H.; Junaid, M.; Xu, N.; Zhu, Y.; Tao, H.; Wong, M. Spatiotemporal distribution, source apportionment and risk assessment of typical hormones and phenolic endocrine disrupting chemicals in environmental and biological samples from the mariculture areas in the Pearl River Delta, China. Sci. Total Environ. 2022, 807, 150752. [Google Scholar] [CrossRef]
- Nayak, M.K.; Kumari, P.; Patel, M.K.; Kumar, P. Functional nanomaterials based opto-electrochemical sensors for the detection of gonadal steroid hormones. TrAC Trends Anal. Chem. 2022, 150, 116571. [Google Scholar]
- Otsuki, A.; de Campo, L.; Garvey, C.J.; Rehm, C. H2O/D2O Contrast Variation for Ultra-Small-Angle Neutron Scattering to Minimize Multiple Scattering Effects of Colloidal Particle Suspensions. Colloids Interfaces 2018, 2, 37. [Google Scholar] [CrossRef]
- Smith, A.M.; Maroni, P.; Borkovec, M.; Trefalt, G. Measuring Inner Layer Capacitance with the Colloidal Probe Technique. Colloids Interfaces 2018, 2, 65. [Google Scholar] [CrossRef]
- Hong, S.P.; Zakaria, S.N.A.; Ahmed, M.U. Trends in the development of immunoassays for mycotoxins and food allergens using gold and carbon nanostructured material. Food Chem. Adv. 2022, 1, 100069. [Google Scholar] [CrossRef]
- Pollap, A.; Baran, K.; Kuszewska, N.; Kochana, J. Electrochemical sensing of ciprofloxacin and paracetamol in environmental water using titanium sol based sensor. J. Electroanal. Chem. 2020, 878, 114574. [Google Scholar] [CrossRef]
- Gaw, S.; Brooks, B.W. Changing tides: Adaptive monitoring, assessment, and management of pharmaceutical hazards in the environment through time. Environ. Toxicol. Chem. 2016, 35, 1037–1042. [Google Scholar] [CrossRef]
- Godoy-Reyes, T.M.; Costero, A.M.; Gaviña, P.; Martinez-Manez, R.; Sancenón, F. A Colorimetric Probe for the Selective Detection of Norepinephrine Based on a Double Molecular Recognition with Functionalized Gold Nanoparticles. ACS Appl. Nano Mater. 2019, 2, 1367–1373. [Google Scholar] [CrossRef]
- Baluta, S.; Swist, A.; Cabaj, J.; Malecha, K. Point-of-Care Testing: Biosensor for Norepinephrine Determination. Int. J. Electron. Telecommun. 2020, 66, 369–372. [Google Scholar]
- Martin, C.; Medam, S.; Antonini, F.; Alingrin, J.; Haddam, M.; Hammad, E.; Meyssignac, B.; Vigne, C.; Zieleskiewicz, L.; Leone, M. Norepinephrine: Not Too Much, Too Long. Shock 2015, 44, 305–309. [Google Scholar] [CrossRef]
- Ferrer, D.G.; García, A.G.; Peris-Vicente, J.; Gimeno-Adelantado, J.V.; Esteve-Romero, J. Analysis of epinephrine, norepinephrine, and dopamine in urine samples of hospital patients by micellar liquid chromatography. Anal. Bioanal. Chem. 2015, 407, 9009–9018. [Google Scholar] [CrossRef]
- Woo, H.I.; Yang, J.S.; Oh, H.J.; Cho, Y.Y.; Kim, J.H.; Park, H.-D.; Lee, S.-Y. A simple and rapid analytical method based on solid-phase extraction and liquid chromatography-tandem mass spectrometry for the simultaneous determination of free catecholamines and metanephrines in urine and its application to routine clinical analysis. Clin. Biochem. 2016, 49, 573–579. [Google Scholar] [CrossRef]
- Tong, S.-L.; Xiang, G.-H.; Chen, P.-P. Fluorescence reaction of terbium(III) ion and norepinephrine and its analytical application. Guang Pu Xue Yu Guang Pu Fen Xi 2004, 24, 1612–1614. [Google Scholar]
- Li, Y.; Schluesener, H.J.; Xu, S. Gold nanoparticle-based biosensors. Gold Bull. 2010, 43, 29–41. [Google Scholar] [CrossRef]
- Casadio, S.; Lowdon, J.; Betlem, K.; Ueta, J.; Foster, C.; Cleij, T.; van Grinsven, B.; Sutcliffe, O.; Banks, C.; Peeters, M. Development of a novel flexible polymer-based biosensor platform for the thermal detection of noradrenaline in aqueous solutions. Chem. Eng. J. 2017, 315, 459–468. [Google Scholar] [CrossRef]
- Mukdasai, S.; Langsi, V.; Pravda, M.; Srijaranai, S.; Glennon, J.D. A highly sensitive electrochemical determination of norepinephrine using l-cysteine self-assembled monolayers over gold nanoparticles/multi-walled carbon nanotubes electrode in the presence of sodium dodecyl sulfate. Sens. Actuators B Chem. 2016, 236, 126–135. [Google Scholar] [CrossRef]
- Rivetti, C.; Climent, E.; Gómez-Canela, C.; Barata, C. Characterization of neurotransmitter profiles in Daphnia magna juveniles exposed to environmental concentrations of antidepressants and anxiolytic and antihypertensive drugs using liquid chromatography–tandem mass spectrometry. Anal. Bioanal. Chem. 2019, 411, 5867–5876. [Google Scholar] [CrossRef]
- Fouad, D.M.; El-Said, W.A. Selective Electrochemical Detection of Epinephrine Using Gold Nanoporous Film. J. Nanomater. 2016, 2016, 6194230. [Google Scholar] [CrossRef]
- Pandopulos, A.J.; Gerber, C.; Tscharke, B.J.; O’Brien, J.; White, J.M.; Bade, R. A sensitive analytical method for the measurement of neurotransmitter metabolites as potential population biomarkers in wastewater. J. Chromatogr. A 2020, 1612, 460623. [Google Scholar] [CrossRef]
- Nie, L.; Liu, F.; Ma, P.; Xiao, X. Applications of gold nanoparticles in optical biosensors. J. Biomed. Nanotechnol. 2014, 10, 2700–2721. [Google Scholar] [CrossRef]
- Mahato, K.; Nagpal, S.; Shah, M.A.; Srivastava, A.; Maurya, P.K.; Roy, S.; Jaiswal, A.; Singh, R.; Chandra, P. Gold nanoparticle surface engineering strategies and their applications in biomedicine and diagnostics. 3 Biotech 2019, 9, 57. [Google Scholar] [CrossRef]
- Shahbazi, N.; Zare-Dorabei, R. A Facile Colorimetric and Spectrophotometric Method for Sensitive Determination of Metformin in Human Serum Based on Citrate-Capped Gold Nanoparticles: Central Composite Design Optimization. ACS Omega 2019, 4, 17519–17526. [Google Scholar] [CrossRef]
- Gumbi, B.; Ngila, J.C.; Ndungu, P.G. Gold nanoparticles for the quantification of very low levels of poly-diallyldimethylammonium chloride in river water. Anal. Methods 2014, 6, 6963–6972. [Google Scholar] [CrossRef]
- Mao, L.; Wang, Q.; Luo, Y.; Gao, Y. Detection of Ag+ ions via an anti-aggregation mechanism using unmodified gold nanoparticles in the presence of thiamazole. Talanta 2021, 222, 121506. [Google Scholar] [CrossRef]
- Yu, X.; Wei, L.; Chen, H.; Niu, X.; Dou, Y.; Yang, J.; Wang, Z.; Tang, Y.; Diao, Y. Development of Colloidal Gold-Based Immunochromatographic Assay for Rapid Detection of Goose Parvovirus. Front. Microbiol. 2018, 9, 953. [Google Scholar] [CrossRef]
- Turkevich, J.; Stevenson, P.C.; Hillier, J. A study of the nucleation and growth processes in the synthesis of colloidal gold. Discuss. Faraday Soc. 1951, 11, 55–75. [Google Scholar] [CrossRef]
- Mahmoud, B.G.; Khairy, M.; Rashwan, F.A.; Banks, C.E. Simultaneous Voltammetric Determination of Acetaminophen and Isoniazid (Hepatotoxicity-Related Drugs) Utilizing Bismuth Oxide Nanorod Modified Screen-Printed Electrochemical Sensing Platforms. Anal. Chem. 2017, 89, 2170–2178. [Google Scholar] [CrossRef]
- Yao, J.; Xu, X.; Liu, L.; Kuang, H.; Wang, Z.; Xu, C. Simultaneous detection of phenacetin and paracetamol using ELISA and a gold nanoparticle-based immunochromatographic test strip. Analyst 2021, 146, 6228–6238. [Google Scholar] [CrossRef]
- Liang, L.; Huang, Y.; Liu, W.; Zuo, W.; Ye, F.; Zhao, S. Colorimetric Detection of Salicylic Acid in Aspirin Using MIL-53(Fe) Nanozyme. Front. Chem. 2020, 8, 671. [Google Scholar] [CrossRef]
- Fouad, F.A.Q.; Siti, H.J.; Md, P.A.; Zainab, H.M.; Nurfaizah, A.T.; Wan, M.; Mohamed, R.O. Determination of caffeine in surface water using solid phase extraction and high perfomance liquid chromatography. Malays. J. Anal. Sci. 2017, 21, 95–104. [Google Scholar]
- Chen, X.; Jiang, Z.-H.; Chen, S.; Qin, W. Microbial and bioconversion production of D-xylitol and its detection and application. Int. J. Biol. Sci. 2010, 6, 834–844. [Google Scholar] [CrossRef]
- Yeh, S.-H.; Huang, M.-S.; Huang, C.-H. Electrochemical sensors for sulfamethoxazole detection based on graphene oxide/graphene layered composite on indium tin oxide substrate. J. Taiwan Inst. Chem. Eng. 2022, 131, 104155. [Google Scholar] [CrossRef]
- Niu, Z.; Liu, Y.; Li, X.; Zhu, H.; Zhang, M.; Yan, K.; Chen, H. Colorimetric detection of sulfamethazine based on target resolved calixarene derivative stabilized gold nanoparticles aggregation. Microchim. Acta 2022, 189, 71. [Google Scholar] [CrossRef]
- Zhou, X.; Wang, L.; Shen, G.; Zhang, D.; Xie, J.; Mamut, A.; Huang, W.; Zhou, S. Colorimetric determination of ofloxacin using unmodified aptamers and the aggregation of gold nanoparticles. Microchim. Acta 2018, 185, 355. [Google Scholar] [CrossRef]


Publisher’s Note: MDPI stays neutral with regard to jurisdictional claims in published maps and institutional affiliations. |
© 2022 by the authors. Licensee MDPI, Basel, Switzerland. This article is an open access article distributed under the terms and conditions of the Creative Commons Attribution (CC BY) license (https://creativecommons.org/licenses/by/4.0/).