
Catalytic Production of Levulinic and Formic Acids from Fructose over Superacid ZrO2–SiO2–SnO2 Catalyst

Abstract
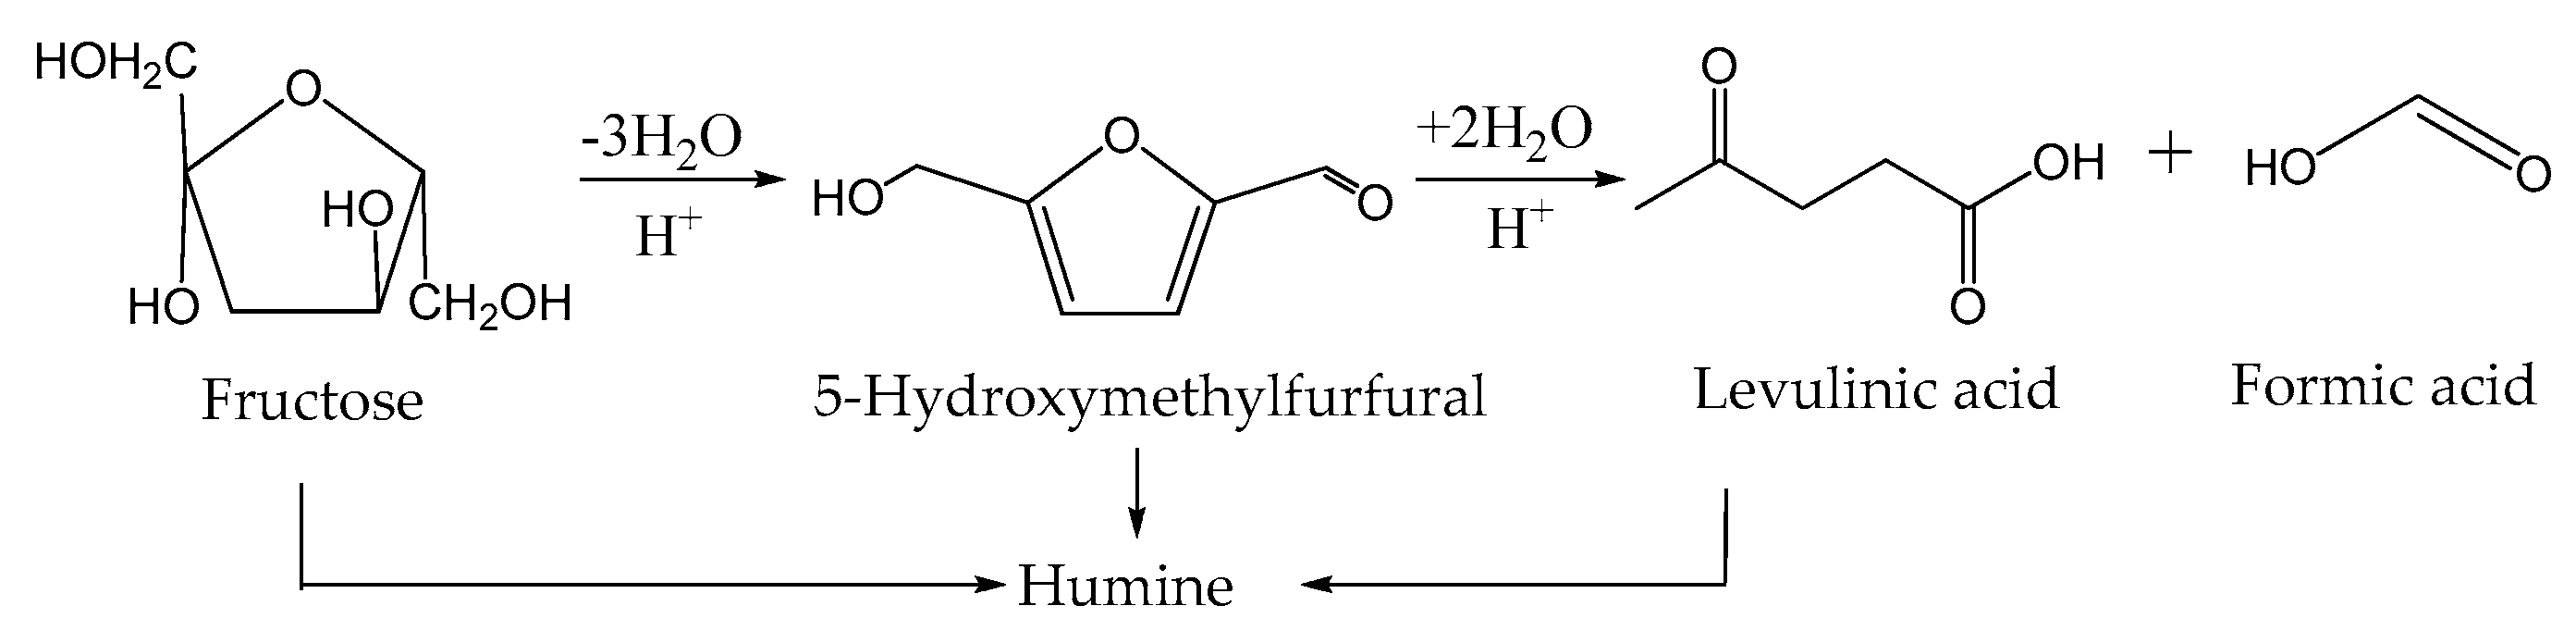
:1. Introduction
2. Materials and Methods
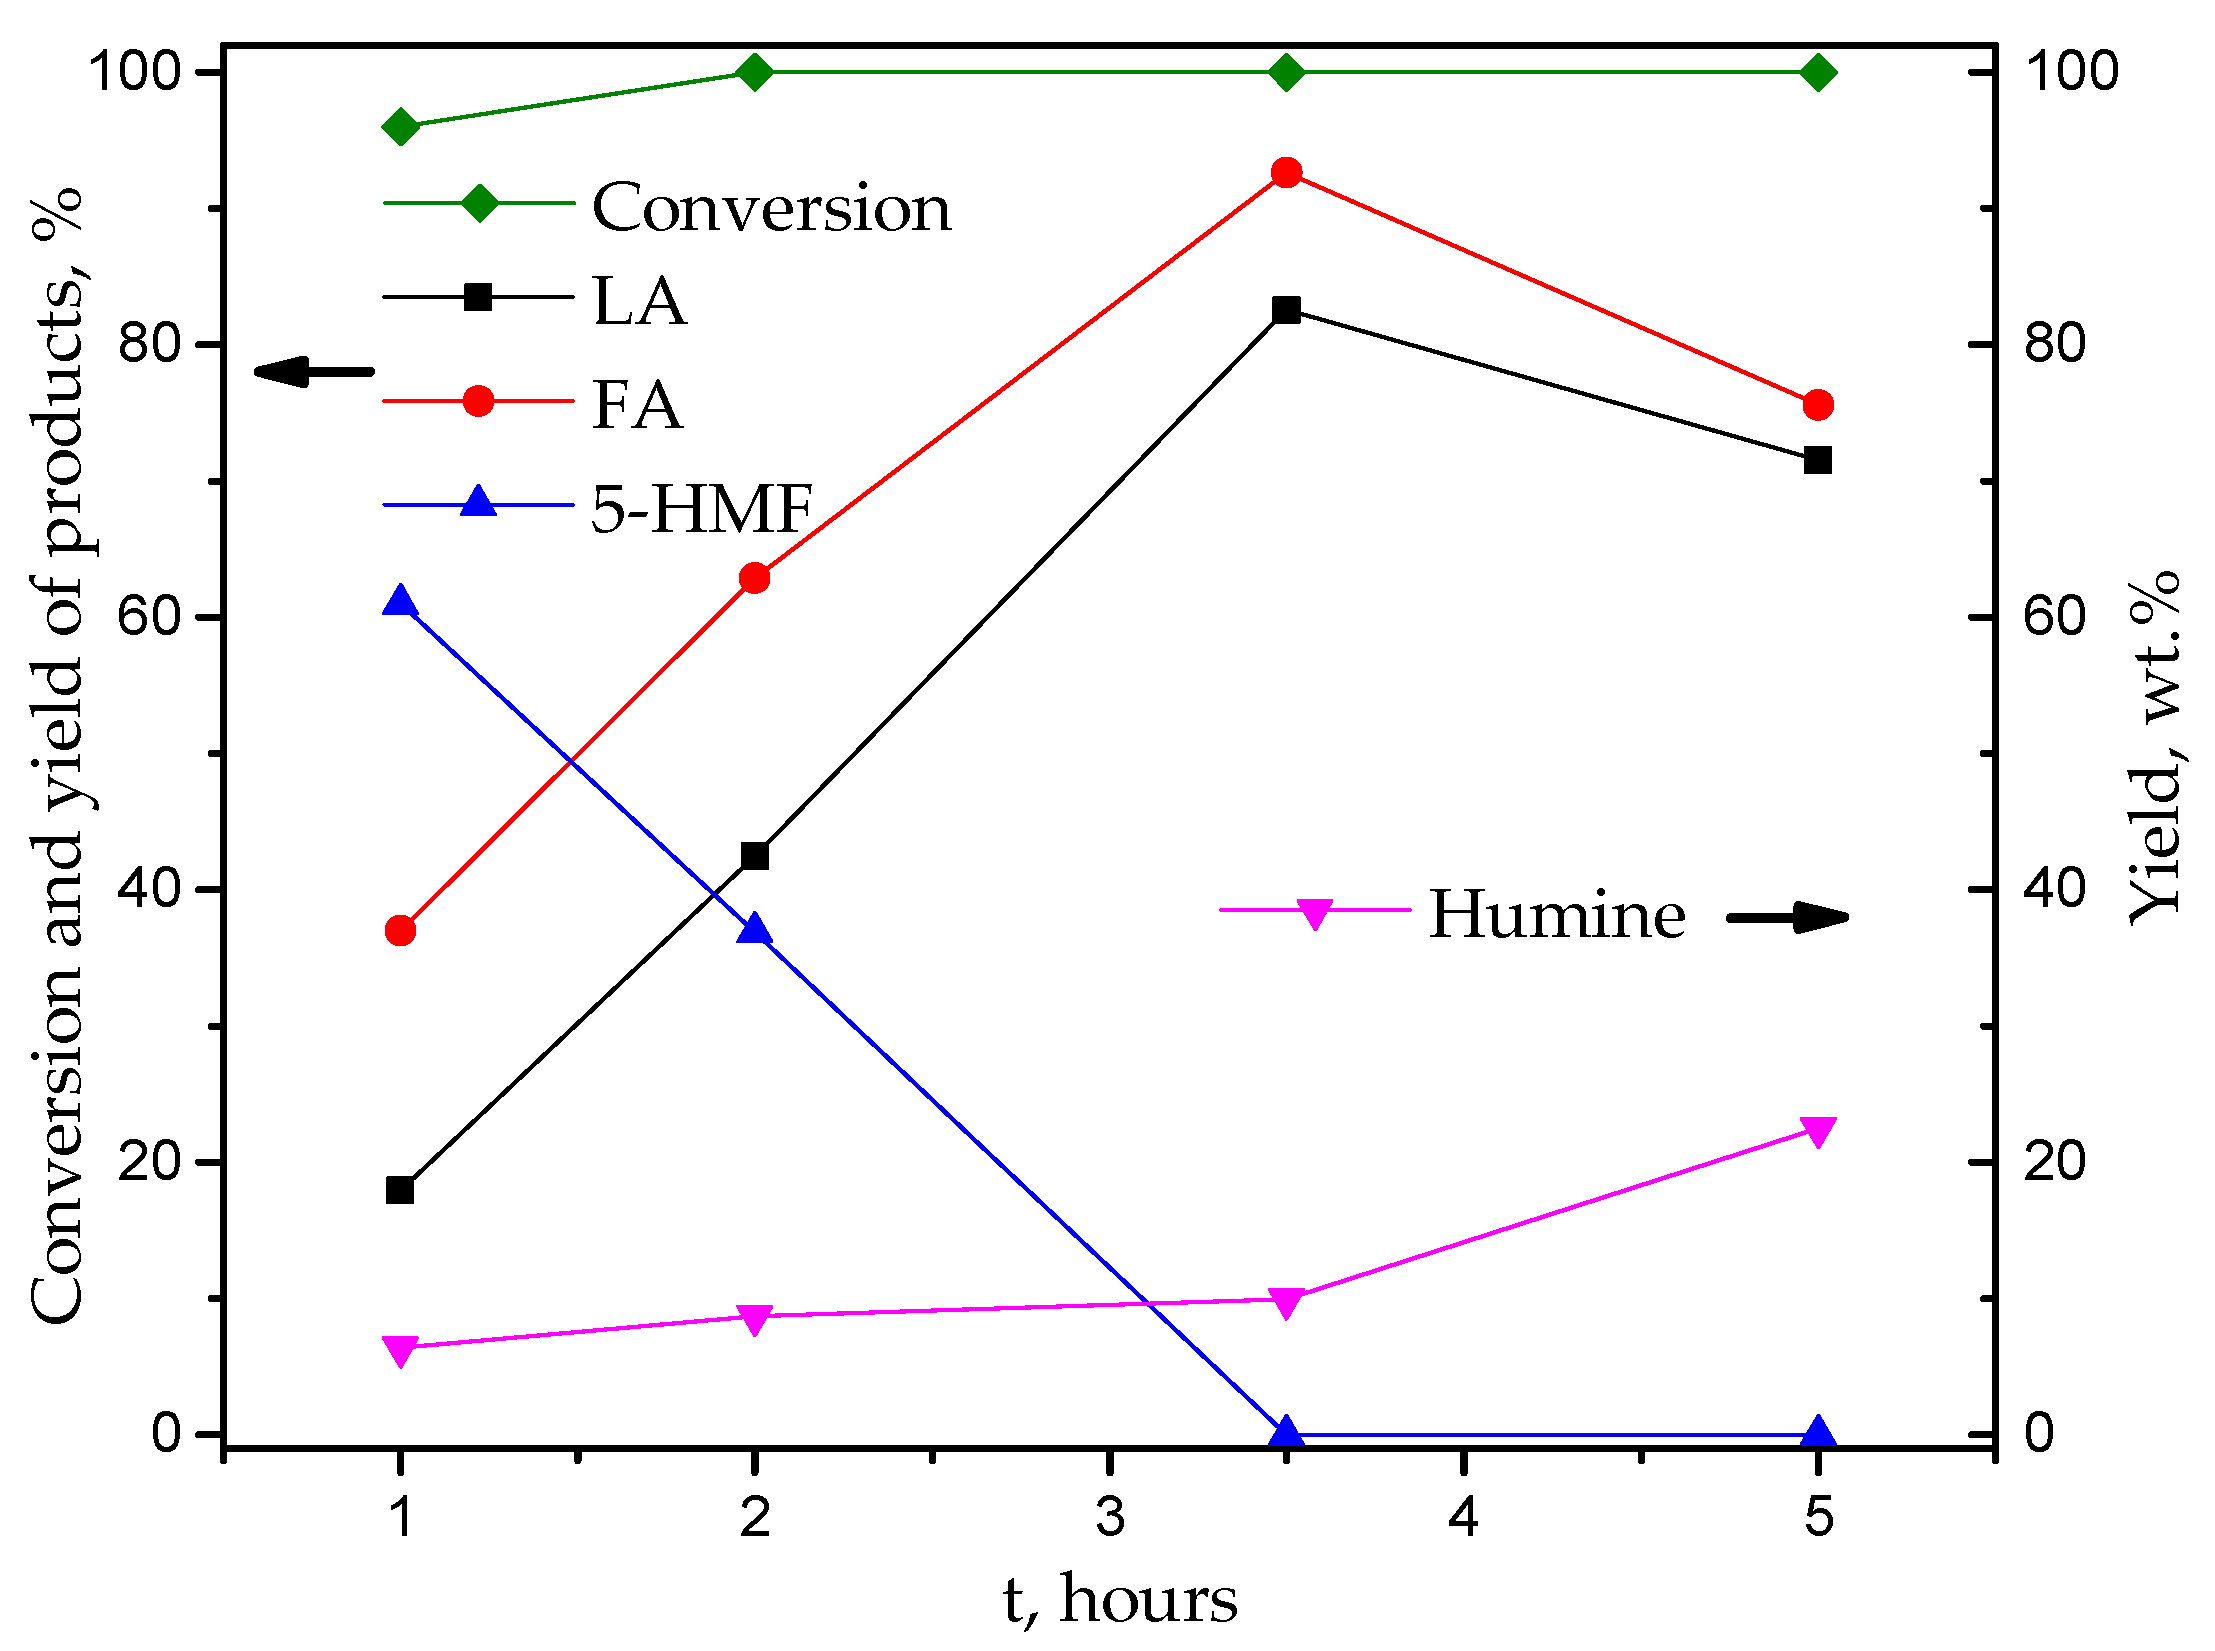
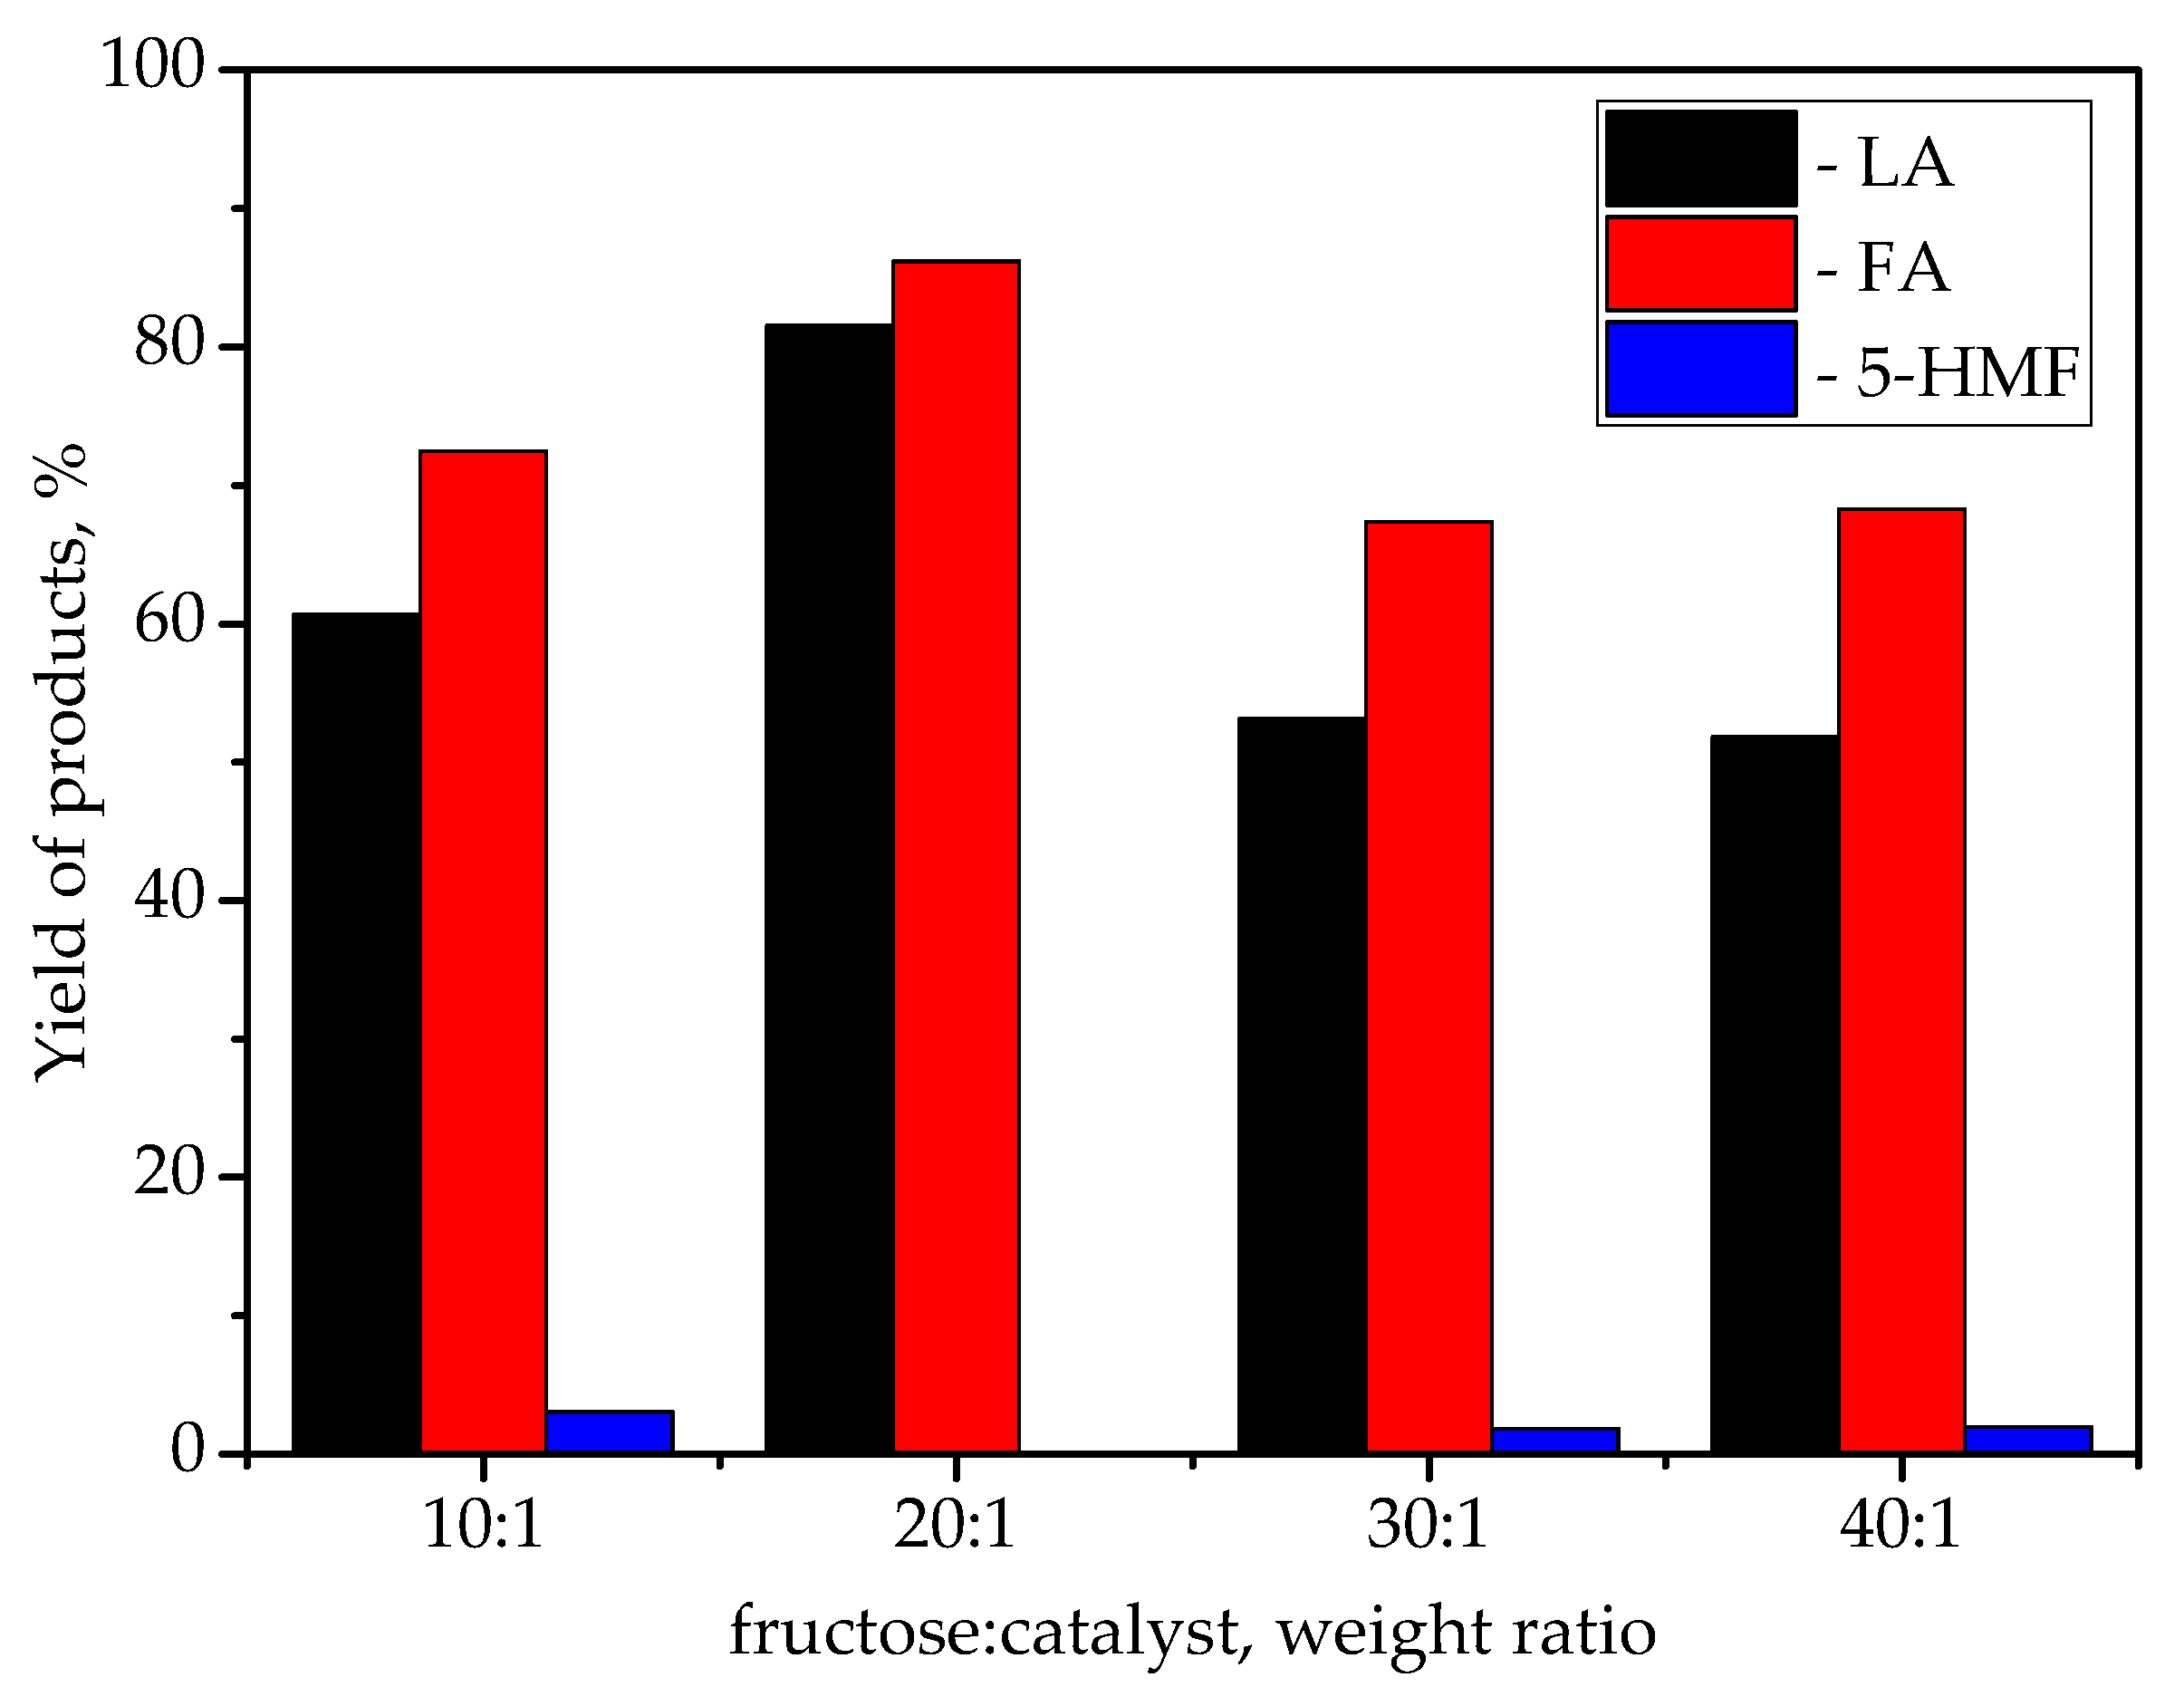
3. Results and Discussion
4. Conclusions
Author Contributions
Funding
Institutional Review Board Statement
Informed Consent Statement
Conflicts of Interest
References
- Signoretto, M.; Taghavi, S.; Ghedini, E.; Menegazzo, F. Catalytic Production of Levulinic Acid (LA) from Actual Biomass. Molecules 2019, 24, 2760. [Google Scholar] [CrossRef] [PubMed] [Green Version]
- Gérardy, R.; Debecker, D.P.; Estager, J.; Luis, P.; Monbaliu, J.-C.M. Continuous Flow Upgrading of Selected C2–C6 Platform Chemicals Derived from Biomass. Chem. Rev. 2020, 120, 7219–7347. [Google Scholar] [CrossRef] [PubMed]
- Antonetti, C.; Licursi, D.; Fulignati, S.; Valentini, G.; Galletti, A.M.R. New Frontiers in the Catalytic Synthesis of Levulinic Acid: From Sugars to Raw and Waste Biomass as Starting Feedstock. Catalysts 2016, 6, 196. [Google Scholar] [CrossRef]
- Hietala, J.; Vuori, A.; Johnsson, P.; Pollari, I.; Reutemann, W.; Kieczka, H. Formic Acid. In Ullmann’s Encyclopedia of Industrial Chemistry; Wiley-VCH Verlag GmbH & Co. KGaA: Weinheim, Germany, 2016. [Google Scholar] [CrossRef]
- Bulushev, D.A.; Ross, J.R.H. Towards Sustainable Production of Formic Acid. ChemSusChem 2018, 11, 821–836. [Google Scholar] [CrossRef] [PubMed] [Green Version]
- Hayes, D.J.; Fitzpatrick, S.; Hayes, M.H.B.; Ross, J.R.H. The Biofine Process—Production of Levulinic Acid, Furfural, and Formic Acid from Lignocellulosic Feedstocks. In Biorefineries-Industrial Processes and Products: Status Quo and Future Directions; Kamm, B., Gruber, P.R., Kamm, M., Eds.; John Wiley & Sons: Weinheim, Germany, 2006; pp. 139–163. [Google Scholar] [CrossRef]
- Thapa, I.; Mullen, B.; Saleem, A.; Leibig, C.; Baker, R.T.; Giorgi, J.B. Efficient green catalysis for the conversion of fructose to levulinic acid. Appl. Catal. A Gen. 2017, 539, 70–79. [Google Scholar] [CrossRef]
- Upare, P.P.; Yoon, J.-W.; Kim, M.Y.; Kang, H.-Y.; Hwang, D.W.; Hwang, Y.K.; Kung, H.H.; Chang, J.-S. Chemical conversion of biomass-derived hexose sugars to levulinic acid over sulfonic acid-functionalized graphene oxide catalysts. Green Chem. 2013, 15, 2935–2943. [Google Scholar] [CrossRef]
- Ramli, N.A.S.; Amin, N.A.S. Kinetic study of glucose conversion to levulinic acid over Fe/HY zeolite catalyst. Chem. Eng. J. 2016, 283, 150–159. [Google Scholar] [CrossRef]
- Ya’Aini, N.; Amin, N.A.S.; Endud, S. Characterization and performance of hybrid catalysts for levulinic acid production from glucose. Microporous Mesoporous Mater 2013, 171, 14–23. [Google Scholar] [CrossRef]
- Joshi, S.S.; Zodge, A.D.; Pandare, K.V.; Kulkarni, B.D. Efficient Conversion of Cellulose to Levulinic Acid by Hydrothermal Treatment Using Zirconium Dioxide as a Recyclable Solid Acid Catalyst. Ind. Eng. Chem. Res. 2014, 53, 18796–18805. [Google Scholar] [CrossRef]
- Kumar, V.B.; Pulidindi, I.N.; Mishra, R.K.; Gedanken, A. Development of Ga Salt of Molybdophosphoric Acid for Biomass Conversion to Levulinic Acid. Energy Fuels 2016, 30, 10583–10591. [Google Scholar] [CrossRef]
- Weingarten, R.; Tompsett, G.A.; Conner, W.C.; Huber, G.W. Design of solid acid catalysts for aqueous-phase dehydration of carbohydrates: Therole of Lewis and Brønsted acid sites. J. Cata. 2011, 279, 174–182. [Google Scholar] [CrossRef]
- Ordomsky, V.V.; van der Schaaf, J.; Schouten, J.C.; Nijhuis, T.A. Fructose Dehydration to 5-Hydroxymethylfurfural over Solid Acid Catalysts in a Biphasic System. ChemSusChem 2012, 5, 1812–1819. [Google Scholar] [CrossRef] [PubMed]
- Weingarten, R.; Conner, W.C.; Huber, G.W. Production of levulinic acid from cellulose by hydrothermal decomposition combined with aqueous phase dehydration with a solid acid catalyst. Energy Environ. Sci. 2012, 5, 7559–7574. [Google Scholar] [CrossRef]
- Hongzhang, C.; Bin, Y.; Shengying, J. Production of levulinic acid from steam exploded rice straw via solid superacid, S2O82−/ZrO2–SiO2–Sm2O3. Bioresour. Technol. 2011, 102, 3568–3570. [Google Scholar] [CrossRef]
- Wang, Y.; Nie, X. Preparation of magnetic solid acid catalyst S2O82−/ZrO2–TiO2–Fe3O4 and its application to synthesis of levulinic acid. J. Cent. South Univ. Sci. Technol. 2016, 1, 26–32. Available online: http://caod.oriprobe.com/articles/47615888/Preparation_of_magnetic_solid_acid_catalyst_S_sub_.htm (accessed on 16 November 2021).
- Prudius, S.V.; Hes, N.L.; Trachevskiy, V.V.; Khyzhun, O.Y.; Brei, V.V. Superacid ZrO2–SiO2–SnO2 Mixed Oxide: Synthesis and Study. Chem. Chem. Technol. 2021, 15, 336–342. [Google Scholar] [CrossRef]
- Tanabe, K. Solid Acids and Bases: Their Catalytic Properties; Academic Press: New York, NY, USA; London, UK, 1970; pp. 5–35. ISBN 0-12-683250-1. [Google Scholar]
- Abramoff, M.D.; Magalhaes, P.J.; Ram, S.J. Image Processing with ImageJ. Biophotonics Int. 2004, 11, 36–42. Available online: https://imagej.nih.gov/ij/docs/pdfs/Image_Processing_with_ImageJ.pdf (accessed on 16 November 2021).
- Antal, M.J.; Mok, W.S.L.; Richards, G.N. Mechanism of formation of 5-(hydroxymethyl)-2-furaldehyde from d-fructose and sucrose. Carbohydr. Res. 1990, 199, 91–109. [Google Scholar] [CrossRef]
- Amarasekara, A.S.; Williams, L.T.D.; Ebede, C.C. Mechanism of the dehydration of d-fructose to 5-hydroxymethylfurfural in dimethyl sulfoxide at 150 °C: An NMR study. Carbohydr. Res. 2008, 343, 3021–3024. [Google Scholar] [CrossRef] [Green Version]
- Fusaro, M.B.; Chagnault, V.; Postel, D. Reactivity of d-fructose and d-xylose in acidic media in homogeneous phases. Carbohydr. Res. 2015, 409, 9–19. [Google Scholar] [CrossRef]
- Jiang, Z.; Hu, D.; Zhao, Z.; Yi, Z.; Chen, Z.; Yan, K. Mini-Review on the Synthesis of Furfural and Levulinic Acid from Lignocellulosic Biomass. Processes 2021, 9, 1234. [Google Scholar] [CrossRef]
- van Putten, R.-J. Experimental and Modelling Studies on the Synthesis of 5-hydroxymethylfurfural from Sugar. Doctor’s Thesis, University of Groningen, Groningen, The Netherlands, 2015; p. 374. Available online: https://research.rug.nl/en/publications/experimental-and-modelling-studies-on-the-synthesis-of-5-hydroxym (accessed on 16 November 2021).
- Horvat, J.; Klaić, B.; Metelko, B.; Šunjić, V. Mechanism of levulinic acid formation. Tetrahedron Lett. 1985, 26, 2111–2114. [Google Scholar] [CrossRef]
- Tsilomelekis, G.; Orella, M.J.; Lin, Z.; Cheng, Z.; Zheng, W.; Nikolakis, V.; Vlachos, D.G. Molecular structure, morphology and growth mechanisms and rates of 5-hydroxymethylfurfural (HMF) derived humins. Green Chem. 2016, 18, 1983–1993. [Google Scholar] [CrossRef] [Green Version]
- Son, P.A.; Nishimura, S.; Ebitani, K. Synthesis of levulinic acid from fructose using Amberlyst-15 as a solid acid catalyst. React. Kinet. Mech. Catal. 2012, 106, 185–192. [Google Scholar] [CrossRef]
- Lai, D.-M.; Deng, L.; Guo, Q.-X.; Fu, Y. Hydrolysis of biomass by magnetic solid acid. Energy Environ. Sci. 2011, 4, 3552–3557. [Google Scholar] [CrossRef]
- Zeng, W.; Cheng, D.-G.; Chen, F.; Zhan, X. Catalytic Conversion of Glucose on Al–Zr Mixed Oxides in Hot Compressed Water. Catal. Lett. 2009, 133, 221–226. [Google Scholar] [CrossRef]
- Moreau, C.; Durand, R.; Razigade, S.; Duhamet, J.; Faugeras, P.; Rivalier, P.; Ros, P.; Avignon, G. Dehydration of fructose to 5-hydroxymethylfurfural over H-mordenites. Appl. Catal. A Gen. 1996, 145, 211–224. [Google Scholar] [CrossRef]
- Flannelly, T.; Lopes, M.; Kupiainen, L.; Dooley, S.; Leahy, J.J. Non-stoichiometric formation of formic and levulinic acids from the hydrolysis of biomass derived hexose carbohydrates. RSC Adv. 2016, 6, 5797–5804. [Google Scholar] [CrossRef] [Green Version]
- Tarabanko, V.E.; Smirnova, M.A.; Chernyak, M.Y.; Kondrasenko, A.A.; Tarabanko, N.V. The Nature and Mechanism of Selectivity Decrease of the Acid-catalyzed Fructose Conversion with Increasing the Carbohydrate Concentration. J. Sib. Fed. Univ. Chem. 2015, 8, 6–18. [Google Scholar] [CrossRef]


| Catalyst | Specific Surface Area, m2/g | Pore Volume, cm3/g | Average Pore Radius, nm | Total Acidity [HB], mmol/g | Acid Strength, H0 |
| ZrO2–SiO2–SnO2 | 340 | 0.20 | 1.2 | 1.5 | −14.52 |
| ZrO2–SiO2 | 360 | 0.27 | 1.5 | 1.7 | −11.35 |
Publisher’s Note: MDPI stays neutral with regard to jurisdictional claims in published maps and institutional affiliations. |
© 2022 by the authors. Licensee MDPI, Basel, Switzerland. This article is an open access article distributed under the terms and conditions of the Creative Commons Attribution (CC BY) license (https://creativecommons.org/licenses/by/4.0/).
Share and Cite
Hes, N.; Mylin, A.; Prudius, S. Catalytic Production of Levulinic and Formic Acids from Fructose over Superacid ZrO2–SiO2–SnO2 Catalyst. Colloids Interfaces 2022, 6, 4. https://doi.org/10.3390/colloids6010004
Hes N, Mylin A, Prudius S. Catalytic Production of Levulinic and Formic Acids from Fructose over Superacid ZrO2–SiO2–SnO2 Catalyst. Colloids and Interfaces. 2022; 6(1):4. https://doi.org/10.3390/colloids6010004
Chicago/Turabian StyleHes, Nataliia, Artur Mylin, and Svitlana Prudius. 2022. "Catalytic Production of Levulinic and Formic Acids from Fructose over Superacid ZrO2–SiO2–SnO2 Catalyst" Colloids and Interfaces 6, no. 1: 4. https://doi.org/10.3390/colloids6010004
APA StyleHes, N., Mylin, A., & Prudius, S. (2022). Catalytic Production of Levulinic and Formic Acids from Fructose over Superacid ZrO2–SiO2–SnO2 Catalyst. Colloids and Interfaces, 6(1), 4. https://doi.org/10.3390/colloids6010004