Abstract
Stable molybdenum blue nanoparticles dispersions were synthesized using ammonium heptamolybdate and ascorbic acid. The effect of molar ratios of reducing agent/Mo and acid/Mo on the speed of formation and stability of the disperse system has been demonstrated. The particles were characterized by UV/vis, infrared (FTIR), nuclear magnetic resonance (NMR) spectroscopy, and dynamic light scattering (DLS) methods. The X-ray photoelectron spectroscopy (XPS) method confirmed the presence of reduced MoV in the structure of molybdenum oxide nanoclusters, the proportion of which was 30%.
1. Introduction
Molybdenum blue is a compound containing giant molybdenum oxide clusters that belong to the class of polyoxometalates (POMs) [1]. These clusters contain molybdenum atoms with oxidation states between +5 and +6. The structural nature of polyoxomolybdate dictates its light absorption within the short-wavelength region of the visible light spectrum, leading to its characteristic blue color [2]. Depending on the synthesis conditions, molybdenum blues may exhibit clusters of various shapes and sizes. The presence of 2 to 6 nm clusters with spherical, toroidal, and lemon-like forms has been reported by Botar et al. [3].
The unique structure of molybdenum blue particles determines their application in various fields. The molybdenum blue is traditionally used in the field of analytical chemistry for qualitative analysis of a series of elements through the formation of a characteristic blue color. Currently, this application is advancing in developing special sensors for the qualitative analysis [4,5]. The unique size of nanostructured molybdenum blue particle enables their application in homogeneous and heterogeneous catalytic systems [6,7,8,9,10].
The presence of pores of a definite size in toroidal clusters makes it possible to create membrane-type sensor devices [11,12] and drugs for targeted drug delivery [13,14]. Many of these applications require the use of both chemically and aggregative stable dispersions of molybdenum oxide nanoclusters. Nowadays, stable dispersions or colloidal softoxometalates are not still investigated. In this case, molybdenum blue should be considered as objects of colloid chemistry, and the determination of their properties and stability over time is applicable to the methods of colloidal chemistry. The problems of stability are of great scientific interest and determine the originality of this work [1,15,16,17].
It has now been established that molybdenum oxide giant clusters are formed as a result of self-assembly from the initial building blocks, such as Mo1, Mo2, and Mo8 [18]. The number of clusters formed as well as their shape and size are determined by the number of parameters including content of reducing agent, acid content, and pH of dispersion medium [4]. The self-assembly process takes place over time; the duration of giant clusters formation can reach up to three weeks [19]. An important condition to the synthesized dispersion is the equilibrium in the system, which is determined by a composition of the dispersion medium. Unfortunately, so far, there are no established general conditions for the synthesis of molybdenum blue hydrosol; for each reducing agent, it is necessary to determine the optimal synthesis conditions [20].
Earlier, we synthesized molybdenum blues dispersions containing ring-shaped clusters using glucose and hydroquinone as reducing agents [21,22,23]. The aspects of the formation of molybdenum oxide clusters were studied, and the influence of synthesis conditions on the stability of the synthesized dispersions were established. The results obtained suggested that glucose and its oxidation products not only participate in the POM self-assembly, but also act as a stabilizer. Whereas the systems obtained using hydroquinone require additional stabilization, which prevents the formation of aggregates from already formed clusters. In relation to the aforementioned findings, it is of interest to investigate the patterns of the formation of molybdenum blue using other organic reducing agents such as ascorbic acid.
The self-organization of molybdenum oxide nanoclusters begins with a specific content of MoV and MoVI, which requires partial reduction of the molybdate ions of the initial solution [1]. In this case, the process of self-organization is possible only at a specific pH value of the dispersion medium. Only in this medium is the polycondensation of molybdate ions observed, with their subsequent assembly into large molybdenum clusters (nanoparticles of molybdenum blue).
Thus, to obtain dispersions of molybdenum oxide clusters, herein referred to as molybdenum blue, it is necessary to determine the optimal molar ratios of the reagents, reducing agent/Mo ([R]/[Mo]) and acid/Mo (hereinafter, [H]/[Mo]), and set the pH at which stable dispersions of molybdenum blue are formed.
The aim of this work is the synthesis of molybdenum blue dispersion using ascorbic acid as reducing agent and to establish the conditions under which chemically and aggregative stable dispersions are formed.
2. Materials and Methods
For the synthesis of molybdenum blue dispersions, ammonium heptamolybdate (NH4)6Mo7O24∙4H2O, ascorbic acid C6H8O6, and concentrated hydrochloric acid HCl were used. All chemicals (CT Lantan, Moscow, Russia) used were laboratory grades.
Dispersions of molybdenum blue were synthesized by reducing a solution of ammonium heptamolybdate with ascorbic acid acidified with hydrochloric acid. The synthesis was carried out at a molybdenum concentration of 0.07 M (calculated on monomolybdate), at different molar ratios [R]/[Mo] = 0.2–5 and different molar ratios [H]/[Mo] = 0.3–3. For comparison and analysis, mixtures of ascorbic and hydrochloric acids that did not contain molybdate ions were prepared. Samples for studying the interaction of molybdate ions with ascorbic acid were mixtures of ascorbic acid solution and ammonium heptamolybdate solution at different molar ratios [R]/[Mo] = 0.4–7.
The redox reaction was monitored by measuring the redox potential (ORP). The redox potential and pH were measured using a combined and platinum electrode on a HI-8314 pH meter–millivoltmeter (Hanna Instruments Germany GmbH, Vöhringen, Germany). The error in measuring the pH value was 0.01, ORP—1 mV.
Electronic absorption spectra were obtained using Leki SS2110 UV scanning spectrophotometer (MEDIORA OY, Helsinki, Finland) and quartz cuvettes with an optical path length of 10 mm. For spectrophotometric studies, the samples were preliminarily diluted with hydrochloric acid solutions with the same pH values. The hydrodynamic diameter of the molybdenum blue particles was measured using the dynamic light scattering (DLS) technique in Photocor Compact-Z instrument (Photocor LLC, Moscow, Russia). The signal accumulation time was 10 min at a laser power of 25 mW and a wavelength of 658 nm.
To establish the structure of the clusters/particles contained in molybdenum blue, samples were separately isolated from dispersions by coagulation in the presence of saturated solution of potassium chloride with further separation of the precipitate by decantation, and subsequent washing with ethanol and drying at room temperature.
IR spectra were obtained using Nicolet 380 IR Fourier spectrometer (Thermo Fisher Scientific Inc., Waltham, MA, USA) with an ATR attachment in KBr pellets with the range of 350 to 4000 cm−1. X-ray photoelectron spectroscopy (XPS) spectra were acquired on ESCA + X-ray photoelectron spectrometer (OMICRON Nanotechnology GmbH, Taunusstein, Germany). Nuclear magnetic resonance (NMR) spectroscopy was carried out on a CXP-200 NMR spectrometer (Bruker, Billerica, MA, USA); the samples were dispersed in distilled water. Spectra were recorded on 13C nuclei.
3. Results
3.1. Synthesis of Molybdenum Blue without HCL
In the first part of the work, the synthesis of molybdenum blue was carried out without the use of hydrochloric acid, because the reducing agent used (ascorbic acid) can dissociate as weak acid. For this, mixtures of solutions of ammonium heptamolybdate and ascorbic acid at different molar ratios [R]/[Mo] were prepared while pH and ORP values were monitored. The dependences of these parameters on the molar ratio [R]/[Mo] are shown in Figure 1.
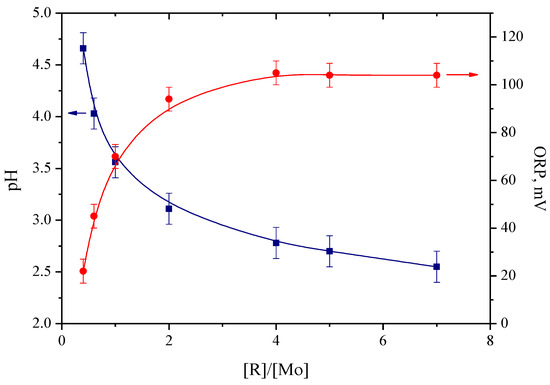
Figure 1.
ORP and pH plot of samples with different molar ratio [R]/[Mo].
As can be seen from the above curves, an increase in the molar ratio [R]/[Mo] from 0.4 to 4.0 leads to the expected increase in the redox potential, with maximum value reaching about 100 mV. In this case, ORP is mainly a characteristic of the ascorbic acid/dehydroascorbic acid pair. The redox potential remained constant at [R]/[Mo] > 4. On the other hand, pH value continues to decrease owing to the increase in the concentration of ascorbic acid. The minimum pH value of 2.5 recorded corresponds to [R]/[Mo] = 7.
Investigations of the synthesized samples by the DLS method showed that, a day after the mixing of the reagents, the formation of particles with hydrodynamic diameter of 3 nm is observed in all samples. The exception was the sample with a molar ratio of [R]/[Mo] = 0.4. The formation of particles in this sample was determined only after 7 days, and the diameter was also found to be 3 nm, indicating that the formation of particles of the dispersed phase (molybdenum oxide nanoclusters) was completed.
For these samples, the absorption maxima were observed around the region from 730 to 810 nm (see Figure 2). In this case, an increase in the [R]/[Mo] ratio causes an absorption shift towards the shorter wavelength region.
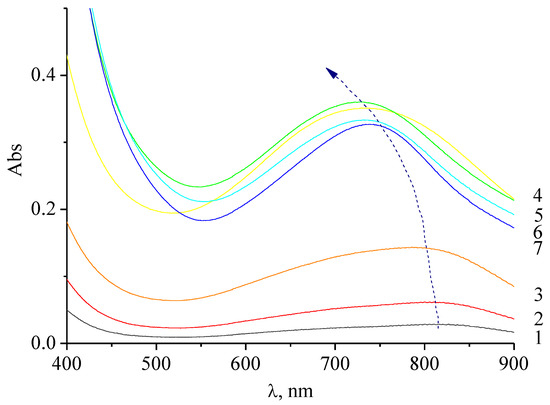
Figure 2.
Electronic absorption spectra of molybdenum blue, synthesized without the use of HCl at different [R]/[Mo] ratios: 0.4 (1), 0.6 (2), 1.0 (3), 2.0 (4), 4.0 (5), 5.0 (6), and 6.0 (7). Diluted 72.5 times.
The presence of intense absorption bands in the region of 750 nm indicates a partial reduction of MoVI compounds to MoV (d–d transition band) [24].
The change in the position of the absorption maximum is probably the result of the particles/clusters’ formation of different structure. It is known that the position of the absorption maximum in the spectrum indicates not only the presence of molybdenum oxide clusters, but also their shape. So, for spherical clusters, the absorption maximum at 450 nm is characteristic, and for ring-shaped ones at 750 nm [25].
If the absorbance at the maximum (750 nm) was used as a parameter that determines the concentration of toroidal particles, it can then be concluded that an increase in [R]/[Mo] leads to an increase in the concentration of formed particles.
The above results indicate that the conditions used are not entirely suitable for the formation of stable molybdenum blue with giant molybdenum oxide clusters. Ascorbic acid cannot fully assume the role of an acid regulator, because, to reach the required pH value, it is necessary to introduce an excess amount of ascorbic acid, which is accompanied by the formation of a large number of products of its oxidation and subsequent destruction of clusters. It should be noted that, over time, the appearance of a brown color was observed in samples with high content of reducing agent ([R]/[Mo] > 1). Studies have shown that this color change is not associated with the molybdenum ions, but is owing to further oxidation of ascorbic acid [26,27]. Moreover, an increase in the acidity of the media in the samples significantly intensifies the process of oxidation of ascorbic acid.
3.2. Synthesis of Molybdenum Blue Using HCL
In this part of the work, the synthesis of molybdenum blue dispersions was carried out with additional acidification of mixtures of ammonium heptamolybdate and ascorbic acid solutions with hydrochloric acid. As in the previous part of the work, the molar ratio [R]/[Mo] was varied from 0.4 to 5, while the molar ratio [H]/[Mo] in all samples was maintained at 0.5.
After mixing all the reagents, the formation of dispersions with a saturated blue color was observed. pH and redox potential (ORP) were monitored immediately after mixing the reagents and after one day (Figure 3). It was established that, a day after mixing all components, the pH and ORP values had decreased as a result of the redox reaction in all samples.
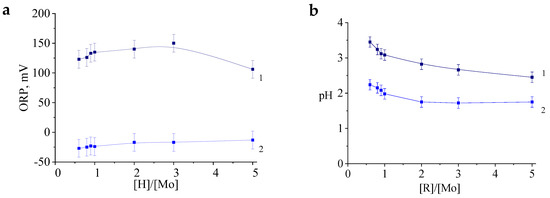
Figure 3.
The values of the redox potential (a) and pH (b) of the samples at different molar ratios [R]/[Mo] immediately after mixing the reagents (1) and the next day (2).
According to the spectral data (Figure 4), all samples exhibit a maximum absorption in the region of 750 nm, which indicates the formation of ring-shaped particles in the studied range [R]/[Mo].
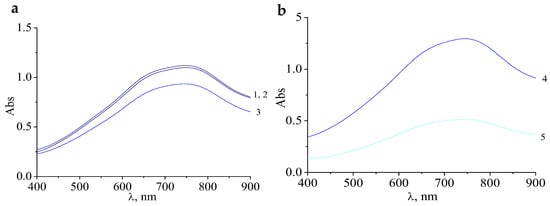
Figure 4.
Electronic absorption spectra of molybdenum blue with a molar ratio of [R]/[Mo] = 0.4 (1), 0.5 (2), 0.6 (3); (a); 1 (4); 2 (5); (b), measured 24 h after mixing the reagents. (pH = 2.0; [H]/[Mo] = 0.5, diluted 125 times).
It should be noted that these samples have a higher absorbance at a wavelength of 750 nm compared with samples of molybdenum blue synthesized without the addition of hydrochloric acid. This means that the addition of hydrochloric acid played an important role in the synthesis of molybdenum blue with a higher concentration of molybdenum clusters.
The spectral data on the formation of particles are confirmed by the DLS results, from which it follows that, 24 h after mixing the reagents, particles with a diameter of about 3 nm are formed in all samples (Figure 5).
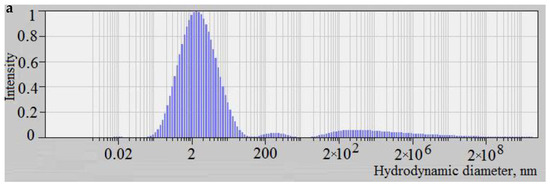
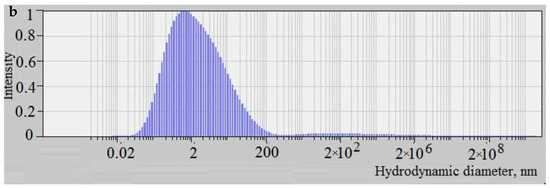
Figure 5.
The distribution of the scattered light intensity depending on the particle size of the molybdenum blue synthesized at molar ratios [R]/[Mo] = 0.6 (a) and [R]/[Mo] = 2.0 (b) a day after mixing reagents.
Over time, sedimentation was observed in samples with a high concentration of ascorbic acid ([R]/[Mo] > 1.0). To track how the concentration of particles changes over time after their formation, the absorbance of the samples at the maximum (750 nm) was used.
As can be seen from the data shown in Figure 6a, the maximum concentration of particles is achieved in the range of molar ratios [R]/[Mo] from 0.6 to 1.0. Over time, there is a general trend in decrease in the absorbance in all samples, which is probably owing to the equilibrium reached between the concentration of the initial building blocks and molybdenum oxide clusters. In other words, when ascorbic acid is used in the synthesis of molybdenum blue, first, lots of particles were rapidly formed, and then their concentration gradually decreases, unlike molybdenum blue synthesized using glucose or hydroquinone [21,23].
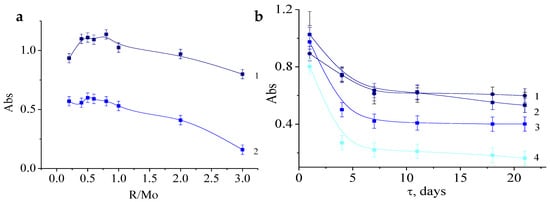
Figure 6.
The dependence of the absorbance of the samples (λmax = 750 nm) on the molar ratio R/Mo after 1 (1) and 21 (2) days after mixing the reagents (a). Dependence of absorbance on storage time (b) of molybdenum blue samples synthesized at molar ratios [R]/[Mo] = 0.6 (1); 1 (2); 2 (3); 3 (4). (pH = 2.0; [H]/[Mo] = 0.5, diluted 125 times).
This is probably owing to a large number of MoV complexes, which are not only necessary for the formation of molybdenum blue particles, but also accelerate the oxidation of ascorbic acid by atmospheric oxygen (changes in oxidative-reducing properties of the medium are indicated by negative ORP values as shown in Figure 3a). Ascorbic acid is oxidized by molecular oxygen without a catalyst, but in the presence of a catalyst, the oxidation becomes faster in few times [26,28].
To determine the time required to reach an equilibrium, the dependences of the absorbance on time were measured for samples at different contents of ascorbic acid. Figure 6b shows these data for molybdenum blue synthesized at a molar ratio of [R]/[Mo] = 0.6; 1; 2; 3. The results obtained for systems with a lower content of ascorbic acid are very close to the sample [R]/[Mo] = 0.6.
An intensive decrease in absorbance, measured at the maximum absorption, is observed during the first 7 days after mixing, and stabilizes after 21 days. Measurements taken after 240 days showed that, for samples with a ratio of [R]/[Mo] less than 1.0, an intense blue color is observed and the absorbance values are close to those previously obtained for samples reaching an equilibrium state after 15 days. This indicates the chemical and aggregative stability of the synthesized systems. For samples synthesized at [R]/[Mo] > 1.0, the appearance of a green color was noted over time, the intensity of which increased with increasing [R]/[Mo]. It was presumed that the green color is the result of a mixture of the saturated yellow color of the products of the oxidized ascorbic acid and molybdenum blue particles.
Thus, the synthesis of dispersions with a high content of ascorbic acid in the ratio [R]/[Mo] does not allow obtaining chemically and aggregatively stable dispersion. The main reason is the not stopping redox process, the main participant of which is ascorbic acid and its oxidation products. An equally important parameter other than the ratio [R]/[Mo] is the molar ratio [H]/[Mo], as the pH of the dispersion medium is a key factor of the formation rate and stability of molybdenum clusters.
To establish the optimal [H]/[Mo] value, the following series of molybdenum blue samples were synthesized with different [H]/[Mo] value and a constant [R]/[Mo] value of 0.6. The pH and absorbance (750 nm) of the samples of these series are shown in Figure 7.
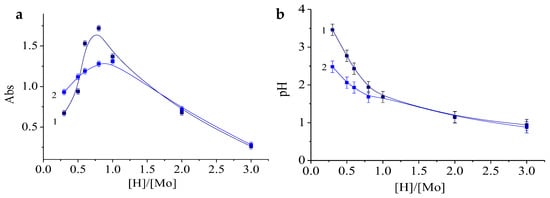
Figure 7.
The dependence of the absorbance at 750 nm (a) and the pH (b) of the samples on the value of the [H]/[Mo] ratio immediately after mixing the reagents (1) and after one day (2). [R]/[Mo] = 0.6. Diluted 125 times.
As can be seen from the presented plots (Figure 7a), the maximum concentration of particles was determined within the range of molar ratios [H]/[Mo] of 0.5–1.5. Over time, the samples synthesized at [H]/[Mo] ≤ 1 showed a decrease in absorbance. For the same samples, a drop in pH values is obvious.
To investigate the stability of dispersions, the dependence of the absorbance on storage time was measured. The measured data taken within 28 days after mixing all the components are presented in Figure 8. As can be seen from these data, at the initial period of time, the concentration of hydrochloric acid has a strong effect on the concentration of clusters/particles formed, however, over time, the absorbance stabilizes at the absorption maximum (750 nm), as well as the cluster concentration. As for the samples synthesized at [H]/[Mo] ratios in the range from 0.3 to 3, the optical region values are very close after 15 days. This means that the particle concentration under these conditions is practically independent of the pH value.
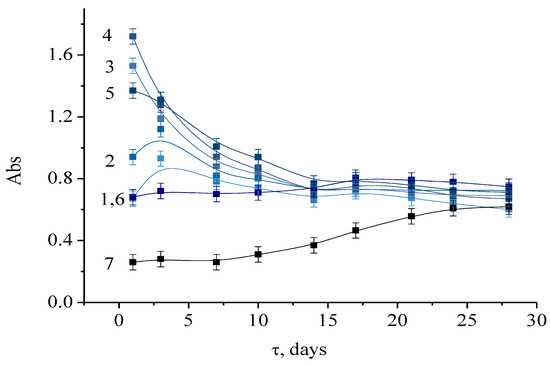
Figure 8.
The dependence of the absorbance of molybdenum blue, synthesized at [H]/[Mo] values equal to 0.3 (1); 0.5 (2); 0.6 (3); 0.8 (4); 1 (5); 2 (6); 3 (7) from the time elapsed after mixing the reagents. [R]/[Mo] = 0.6. Diluted 125 times.
Thus, in the specified conditions, it takes 15 days to reach the equilibrium and complete the self-assembly of molybdenum clusters in the presence of ascorbic acid. Moreover, to obtain a stable dispersions of molybdenum blue, it is recommended to use molar ratios of 0.3 < [H]/[Mo] < 0.8, which corresponds to a range of pH values from 2.5 to 1.7.
It can be seen that samples with [H]/[Mo] > 2 reached equilibrium quicker. However, with such a high content of hydrochloric acid, the number of clusters formed is small, because, under these conditions, precipitate of MoO3 is formed.
3.3. Properties of Molybdenum Blue Nanoparticles
Nanoparticles of molybdenum blue dispersions can be represented by a number of giant molybdenum oxide clusters. To identify the structure and composition of the clusters in the synthesized samples, their analysis was carried out using a set of spectral methods: UV/vis, IR, NMR, and XPS.
To obtain the characteristics of the particle structure, the dispersed phase of molybdenum blue was previously isolated from dispersions (dispersions were synthesized at [R]/[Mo] = 1, [H]/[Mo] = 0.6). For UV/vis spectroscopy analysis, the particles were redispersed in water (the conditions of extraction are given above in the methodological part). Figure 9 shows the electronic absorption spectrum of a dispersion of molybdenum clusters.
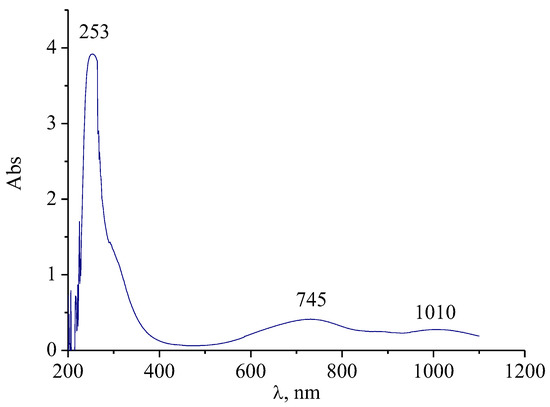
Figure 9.
The spectrum of electronic absorption of molybdenum clusters isolated from dispersions of molybdenum blue and dispersed in water.
As can be seen from the spectrum, the sample is characterized by the presence of absorption bands with maxima at 745 nm and 1007 nm. The presence of the absorption maximum in the visible part of the spectrum indicates a partial reduction of Mo (VI) compounds (d–d transition band). The second band, in the near IR region, is the band of the intervalent charge transfer Mo (V) → Mo (VI) [29]. According to the published data [2], the observed bands are characteristic of molybdenum blue, which contain toroidal clusters (Mo138, Mo150, Mo154, Mo176). Thus, toroidal clusters are likely to be present when the molybdate solution is reduced in the presence of ascorbic acid.
For the analysis of synthesized clusters, IR spectroscopy was also used, which gives a more detailed characterization of the structure of the synthesized nanoclusters [30]. To obtain the IR spectra, particles isolated from a dispersion medium and dried at room temperature were used. In the FTIR spectra of molybdenum blue particles (see Figure 10), it is possible to distinguish regions in which characteristic strectching bands of certain types of bonds are presented. Their assignement and position are given in Table 1.
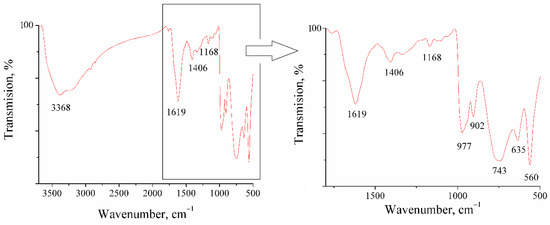
Figure 10.
FTIR spectrum of synthesized molybdenum oxide clusters.

Table 1.
Assignment of several bands in IR spectra of molybdenum blue nanoparticles.
Molybdenum blue particles have a large number of hydrogen bonds ν(OH…H), as evidenced by the presence of a wide band in the region of 3100–3500 cm−1. These results are in good agreement with published data, which repeatedly noted a high concentration of OH groups on the surface of toroidal particles, as well as the presence of aqualigands and intracluster water molecules (including the inner space of the torus) [7]. The bands around the region of 1620 cm−1 correspond to bending vibrations of water δH2O.
The region below 1000 cm−1 contains bands related to vibrations of the polyoxomolybdate framework. In the range of 950–990 cm−1, closely spaced poorly resolvable bands are observed, which are related to the Mo=O bond. A band of 977 cm−1, corresponding to stretching vibrations of the Mo-O-Mo bond [30,31,32], is also presented in this region.
The set of absorption bands observed on the spectra of the synthesized samples is in good agreement with the literature data and corresponds to the structure of toroidal complexe family [30,31,32,33,34]. It has now been established [3,35] that the composition of toroidal clusters is mainly determined by the pH of the dispersion medium during the synthesis of molybdenum blue. Clusters of composition Mo172 are formed at pH << 1.0, an increase in pH to a value of 1.2–2.0 allows the synthesis of a cluster of composition Mo154. A further increase in pH leads to the formation of defective structures Mo154−x/Mo148 (pH = 1.7), Mo142 (pH = 2.5–3.3), and Mo138 (pH = 3.4–4.5). On the basis of the pH value of the synthesized molybdenum blue dispersions, we can exclude the presence of clusters of the composition Mo138 and Mo172. In the studied pH range from 1.0 to 2.5, the presence of Mo154−x clusters and its defective derivatives is possible.
Nuclear magnetic resonance (NMR) studies on 13C nuclei provided information on organic ligands embedded in the structure of clusters [36,37]. Analysis of the NMR spectra of the synthesized particles did not reveal the presence of peaks characteristic of alkyl, acetate and carboxyl groups. This may indicate the absence of organic substances attached to polyoxomolybdates in the analyzed samples (dispersions were synthesized at [R]/[Mo] = 1, [H]/[Mo] = 0.6).
To determine the presence of reduced MoV molybdenum in the analyzed samples, XPS was used. To determine the oxidation state of an element, bands of internal electrons are usually used; for molybdenum, this is the region of the Mo3d line. This region of the molybdenum spectrum is shown in Figure 11a.
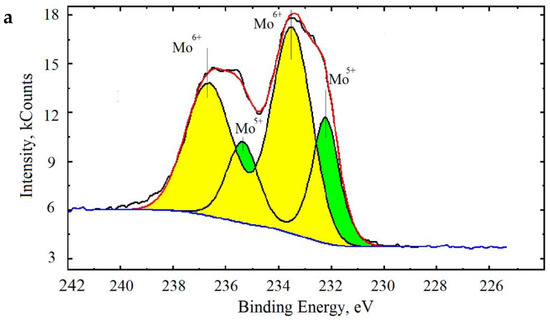
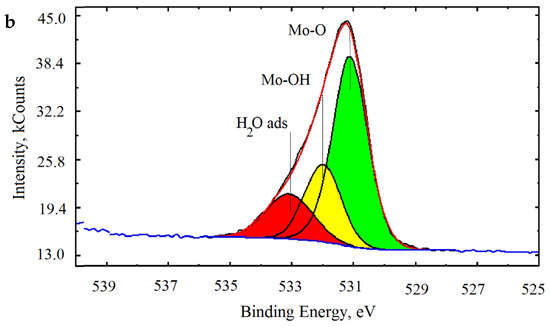
Figure 11.
X-ray photoelectron spectroscopy (XPS) spectrum of Mo (a) and O (b) of synthesized molybdenum clusters.
As can be seen from the data presented, molybdenum in molybdenum clusters is presented in two forms: Mo6+ 5d/2 and Mo6+ 3d/2 (with doublet energy lines at 232 and 237 eV) and Mo5+ 5d/2 and Mo3+ 3d/2 (doublet energy lines output at 231 and 235 eV). Thus, XPS confirmed the presence of reduced Mo5+ molybdenum in molybdenum oxide clusters. It was calculated that the content of reduced Mo5+ molybdenum is about 30%, which is comparable to published data of the Mo5+ content in toroidal particles [4].
The spectrum of the oxygen energy region O1s (Figure 11b) is represented by the broadened asymmetric line, which indicates the presence of oxygen ions in various energy states.
The oxygen spectrum was divided into three lines with binding energies of 531.0, 532.4, and 533.6 eV, which correspond to the bond lengths of Mo-O, Mo-OH, and oxygen in the composition of adsorbed water H2Oads. The data obtained are in good agreement with the results of studies of the structure of molybdenum clusters published in the literature [38,39,40].
4. Discussion
The experiments showed that the formation of particles and the concentration of the dispersed phase of molybdenum blue are determined by the synthesis conditions. To shift the equilibrium toward particle formation, certain ratios between the reagents are required (molar ratios [R]/[Mo] and [H]/[Mo]).
The concentration of ascorbic acid significantly affects the self-organization of molybdenum clusters and the stability of molybdenum blue dispersions. This reducing agent can take the role of an acidity regulator, but only partially as its excess in dispersions leads to the further redox process and the destruction of clusters. The optimal molar ratios for the synthesis are [R]/[Mo] = 0.2–0.6.
The acid concentration also has a strong effect on the synthesis of molybdenum blue. For the synthesis of stable dispersions of molybdenum blue, it is recommended to use molar ratios in the range 0.3 < [H]/[Mo] < 0.8, which corresponds to a range of pH values from 2.5 to 1.7.
Unlike molybdenum blue, synthesized using glucose and hydroquinone, in which cluster formation is completed after 15 days, in systems with ascorbic acid, a large number of molybdenum clusters are formed within one day, but it takes time to reach equilibrium between the forming clusters and the initial building blocks.
Using ascorbic acid, it is possible to synthesize molybdenum blues dispersions containing toroidal molybdenum clusters of the Mo154−x family, which is confirmed by UV/vis and IR spectroscopy. XPS spectroscopy confirmed the presence of reduced MoV molybdenum in their structure. The hydrodynamic diameter of the clusters according to dynamic light scattering is 3 nm, which is comparable with published data on the sizes of toroidal clusters of Mo154−x [2].
5. Conclusions
Stable dispersions of molybdenum blue were synthesized using ascorbic acid as a reducing agent. The influence of the main synthesis parameters ([R]/[Mo], [H]/[Mo]) on the rate of formation and stability of molybdenum oxide clusters is investigated.
Using DLS, IR, NMR, UV/vis, and XPS spectroscopy, some properties of molybdenum blue particles synthesized using ascorbic acid were determined. It was established that, in synthesized samples, the nanoparticles are toroidal-shaped polyoxomolybdate clusters.
Author Contributions
Conceptualization, N.G., M.M., and V.N.; methodology, D.H. and M.M.; formal analysis, N.G.; investigation, D.H., M.M., and N.G.; resources, N.G.; writing—original draft preparation, D.H., M.M., and N.G.; writing—review and editing, D.H., M.M., N.G., and V.N.; visualization, D.H., M.M., and N.G.; supervision, N.G. and V.N. All authors have read and agreed to the published version of the manuscript.
Funding
This research was funded by D. Mendeleev University of Chemical Technology, grant number 032-2020.
Conflicts of Interest
The authors declare no conflict of interest.
References
- Liu, T.; Diemann, E.; Müller, A. Hydrophilic inorganic macro-ions in solution: Unprecedented self-assembly emerging from historical “blue waters”. J. Chem. Educ. 2007, 84, 526–532. [Google Scholar] [CrossRef]
- Muller, A.; Serain, C. Soluble molybdenum blues—“Des pudels kern”. Acc. Chem. Res. 2000, 33, 2–10. [Google Scholar] [CrossRef]
- Botar, B.; Ellern, A.; Kögerler, P. Mapping the formation areas of giant molybdenum blue clusters: A spectroscopic study. Dalton Trans. 2012, 41, 8951–8959. [Google Scholar] [CrossRef] [PubMed]
- Arvas, M.B.; Gorduk, O.; Gencten, M.; Sahin, Y. Preparation of a novel electrochemical sensor for phosphate detection based on molybdenum blue modified poly (vinyl chloride) coated pencil graphite electrode. Anal. Methods 2019, 11, 3874–3881. [Google Scholar] [CrossRef]
- Okazaki, T.; Wang, W.; Kuramitz, H.; Hata, N.; Taguchi, S. Molybdenum blue spectrophotometry for trace arsenic in ground water using a soluble membrane filter and calcium carbonate column. Anal. Sci. 2013, 29, 67–72. [Google Scholar] [CrossRef] [PubMed]
- Long, D.L.; Burkholder, E.; Cronin, L. Polyoxometalate clusters, nanostructures and materials: From self-assembly to designer materials and devices. Chem. Soc. Rev. 2007, 36, 105–121. [Google Scholar] [CrossRef] [PubMed]
- Noro, S.; Tsunashima, R.; Kamiya, Y.; Uemura, K.; Kita, H.; Cronin, L.; Akutagawa, T.; Nakamura, T. Adsorption and catalytic properties of the inner nanospace of a gigantic ring-shaped polyoxometalate cluster. Angew. Chem. Int. Ed. 2009, 48, 8703–8706. [Google Scholar] [CrossRef]
- Vit, Z.; Gulkova, D.; Novak, M. Preparation of alumina supported Mo catalysts from molybdenum blue precursor. React. Kinet. Catal. Lett. 1995, 55, 221–226. [Google Scholar] [CrossRef]
- Liu, X.; Conte, M.; Weng, W. Molybdenum blue nano-rings: An effective catalyst for the partial oxidation of cyclohexane. Catal. Sci. Technol. 2014, 5, 217–227. [Google Scholar] [CrossRef]
- Gavrilova, N.N.; Nazarov, V.V.; Skudin, V.V. Synthesis of membrane catalysts based on Mo2C. Kinet. Catal. 2015, 56, 670–680. [Google Scholar] [CrossRef]
- Müller, A.; Krickemeyer, E.; Bögge, H.; Schmidtmann, M.; Roy, S.; Berkle, A. Changeable pore sizes allowing effective and specific recognition by a molybdenum-oxide based “Nanosponge”: En route to sphere-surface and nanoporous-cluster chemistry. Angew. Chem. 2002, 114, 3756–3761. [Google Scholar] [CrossRef]
- Gilles, A.; Mihai, S.; Nasr, G.; Mahon, E.; Garai, S.; Müller, A.; Barboiu, M. Highly selective Li+ ion transport by porous molybdenum-oxide keplerate-type nanocapsules integrated in a supported liquid membrane. Isr. J. Chem. 2013, 53, 102–107. [Google Scholar] [CrossRef]
- Yang, H.-K.; Cheng, Y.-X.; Su, M.-M.; Xiao, Y.; Hu, M.B.; Wang, W.; Wang, Q. Polyoxometalate–biomolecule conjugates: A new approach to create hybrid drugs for cancer therapeutics. Bioorganic Med. Chem. Lett. 2013, 23, 1462–1466. [Google Scholar] [CrossRef] [PubMed]
- Ostroushko, A.A.; Danilova, I.G.; Gette, I.F.; Medvedeva, S.Y.; Tonkushina, M.O.; Prokofieva, A.V.; Morozova, M.V. Study of safety of molybdenum and iron-molybdenum nanocluster polyoxometalates intended for targeted delivery of drugs. J. Biomater. Nanobiotech. 2011, 2, 557–560. [Google Scholar] [CrossRef]
- Thomas, P.; Chandel, S.; Mallick, A.; Sreejith, S.S.; Ghosh, N.; Roy, S. Studying the crystallization of polyoxometalates from colloidal doftoxometalates. Cryst. Growth Des. 2018, 18, 4068–4075. [Google Scholar] [CrossRef]
- Liu, T. Hydrophilic macroionic solutions: What happens when soluble ions reach the size of nanometer scale? Langmuir 2010, 26, 9202–9213. [Google Scholar] [CrossRef]
- Roy, S. Soft-oxometalates beyond crystalline polyoxometalates: Formation, structure and properties. Cryst. Eng. Comm. 2014, 16, 4667–4676. [Google Scholar] [CrossRef]
- McCleverty, J.A.; Meyer, T.J. Comprehensive Coordination Chemistry II: From Biology to Nanotechnology; Elsevier: Amsterdam, The Netherlands, 2003. [Google Scholar]
- Liu, T. An unusually slow self-assembly of inorganic ions in dilute aqueous solution. J. Am. Chem. Soc. 2003, 125, 312–313. [Google Scholar] [CrossRef]
- Nagul, E.A.; McKelvie, I.D.; Worsfold, P.; Kolev, S.D. The molybdenum blue reaction for the determination of orthophosphate revisited: Opening the black box. Anal. Chim. Acta 2015, 890, 60–82. [Google Scholar] [CrossRef] [PubMed]
- Myachina, M.A.; Gavrilova, N.N.; Nazarov, V.V. Formation of molybdenum blue particles via the reduction of a molybdate solution with glucose. Russ. J. Phys. Chem. 2018, 92, 2237–2241. [Google Scholar] [CrossRef]
- Bazhenova, M.D.; Gavrilova, N.N.; Nazarov, V.V. Some colloidochemical properties of molybdenum blues synthesized using glucose as a reducing agent. Colloid J. 2015, 77, 1–5. [Google Scholar] [CrossRef]
- Myachina, M.A.; Gavrilova, N.N.; Nazarov, V.V. Formation of molybdenum blues particles via the reduction of molybdate solutions with hydroquinone. Colloid J. 2019, 81, 541–545. [Google Scholar] [CrossRef]
- Tytko, K.H.; Trobisch, U. Mo Molybdenum: Molybdenum Oxide Hydrates. Oxomolybdenum Species in Aqueous Solutions; Springer: Berlin/Heidelberg, Germany, 1987. [Google Scholar]
- Müller, A.; Sarkar, S.; Shah, S.Q.N.; Bögge, H.; Schmidtmann, M.; Sarkar, S.; Kögerler, P.; Hauptfleisch, B.; Trautwein, A.X.; Schünemann, V. Archimedean synthesis and magic numbers: “sizing” giant molybdenum-oxide-based molecular spheres of the keplerate type. Ang. Chem. Int. Ed. 1999, 38, 3238–3241. [Google Scholar] [CrossRef]
- Davies, M.B.; Austin, J.; Partridge, D.A. Vitamin C: Its Chemistry and Biochemistry; Royal Society of Chemistry: Letchworth, UK, 1991. [Google Scholar]
- Michiels, Y.; Puyvelde, P.; Sels, B. Barriers and Chemistry in a Bottle: Mechanisms in Today’s Oxygen Barriers for Tomorrow’s Materials. Appl. Sci. 2017, 7, 665. [Google Scholar] [CrossRef]
- Moss, R.W. Free Radical: Albert Szent-Gyorgyi and Battle over Vitamin C; Paragon House: New York, NY, USA, 1988. [Google Scholar]
- Pope, M.T.; Müller, A. Polyoxometalate chemistry: An old field with new dimensions in several disciplines. Angew. Chem. Int. Ed. 1991, 30, 34–48. [Google Scholar] [CrossRef]
- Ostroushko, A.A.; Korotayev, V.Y.; Tonkushina, M.O.; Grzhegorzhevskii, K.V.; Vazhenin, V.A.; Kutyashev, I.B.; Martynova, N.A.; Men’shikov, S.Y.; Selezneva, N.V. Electrotransport, sorption, and photochemical properties of nanocluster polyoxomolybdates with a toroidal structure. Russ. J. Phys. Chem. 2012, 86, 1268–1273. [Google Scholar] [CrossRef]
- Muller, A.; Meyer, J.; Krickmeyer, E.; Diemann, E. Molybdenum blue: A 200 year old mystery unveiled. Angew. Chem. Int. Ed. 1996, 35, 1206–1208. [Google Scholar] [CrossRef]
- Guzman, G.; Yebka, B.; Livage, J.; Julien, C. Lithium intercalation studies in hydrated molybdenum oxides. Solid State Ion. 1996, 86, 407–413. [Google Scholar] [CrossRef]
- Grzhegorzhevskii, K.V.; Zelenovsky, P.S.; Koryakova, O.V.; Ostroushko, A.A. Thermal destruction of giant polyoxometalate nanoclusters: A vibrational spectroscopy study. Inorg. Chim. Acta 2019, 489, 287–300. [Google Scholar] [CrossRef]
- Muller, A.; Maiti, R.; Schmidtmann, M.; Bögge, H.; Das, S.K.; Zhang, W. Mimicking oxide surfaces: Different types of defects and ligand coordination at well-defined positions of a molybdenum oxide-based nanoclusters. Chem. Comm. 2001, 2126–2127. [Google Scholar] [CrossRef]
- Shishido, S.; Ozeki, T. The pH dependent nuclearity variation of {Mo154−x}-type polyoxomolybdates and tectonic effect on their aggregations. J. Am. Chem. Soc. 2008, 130, 0588–10595. [Google Scholar] [CrossRef] [PubMed]
- Ostroushko, A.A.; Korotaev, V.Y.; Tonkushina, M.O.; Vazhenin, V.A.; Artemov, M.Y.; Men’shikov, S.Y.; Kutyashev, I.B. Spectroscopic studies of molybdenum polyoxometallates with the buckyball structure and polymer-containing compositions based thereon. Russ. J. Inorg. Chem. 2011, 56, 276–281. [Google Scholar] [CrossRef]
- Ziv, A.; Grego, A.; Kopilevich, S.; Zeiri, L.; Miro, P.; Bo, C.; Müller, A.; Weinstock, I.A. Flexible pores of a metal oxide-based capsule permit entry of comparatively larger organic guests. J. Am. Chem. Soc. 2009, 131, 6380–6382. [Google Scholar] [CrossRef]
- Ju, F.; VanderVelde, D.; Nikolla, E. Molybdenum-based polyoxometalates as highly active and selective catalysts for the epimerization of aldoses. ACS Catal. 2014, 4, 1358–1364. [Google Scholar] [CrossRef]
- Conte, M.; Liu, X.; Murphy, D.M.; Taylor, S.H.; Whiston, K.; Hutchings, G.J. Insights into the reaction mechanism of cyclohexane oxidation catalyzed by molybdenum blue nanorings. Catal. Lett. 2016, 146, 126–135. [Google Scholar] [CrossRef]
- Koyun, O.; Gorduk, S.; Besir Arvas, M.; Sahin, Y. Direct, one-step synthesis of molybdenum blue using an electrochemical method, and characterization studies. Synth. Metals 2017, 233, 111–118. [Google Scholar] [CrossRef]
© 2020 by the authors. Licensee MDPI, Basel, Switzerland. This article is an open access article distributed under the terms and conditions of the Creative Commons Attribution (CC BY) license (http://creativecommons.org/licenses/by/4.0/).