Abstract
The surface tension of C13DMPO aqueous solution drops in hexane vapor is studied using the drop profile method. The hexane was injected into the measuring cell at three different conditions: before the formation of the solution drop, at a certain moment during the adsorption process, and after reaching the equilibrium of surfactant adsorption. The surface tension values for all experiments at the same concentration and different injection situations ultimately coincide with each other after attaining the final equilibration stage. The equilibrium surface tension isotherms of C13DMPO solutions, and the adsorption of both components—surfactant and hexane—were calculated. It was shown that the presence of surfactant leads to an increased hexane adsorption.
1. Introduction
The description of thermodynamics and kinetics of surfactant adsorption at aqueous solution–oil interfaces was presented, for example, in [1,2], respectively. The Langmuir [3] and Frumkin [4] adsorption models are the most frequently used ones for a quantitative analysis of experimental results. For many surfactants, these classical models were successfully applied [5,6,7,8], and it was found that the surfactant molar area and the surface concentration depend on the chain lengths of the alkane. The adsorption layer dynamics at the water–oil interface is more complex than would be expected based on a classical diffusion-controlled adsorption or exchange of matter process of surfactants at the water–air interface. Thus, it is very important to get a deeper insight into the interaction between surfactant and oil molecules. Concerning water–oil interfaces, systematic studies on the dynamics and thermodynamics of surfactant adsorption layers were performed for aqueous solutions in contact with alkane vapor, for example by Javadi et al. [9]. The results indicate that the water–alkane vapor interface represents an intermediate situation between the water–air and water–alkane interface because the presence of alkane molecules in the gas phase leads to co-adsorption or competition of the oil molecules. The experiments were performed mainly using drop shape analysis tensiometry [10], modified such that experiments were possible at the water–vapor interface. The entire mechanism of the adsorption of oil molecules at the surface of aqueous surfactant solutions is not completely clear yet. However, the studies reported for example in [11] give certain insight into this phenomenon. A theoretical model exists for an approximated physical picture of the cooperative and competitive adsorption of the oil and surfactant molecules. This model goes beyond earlier approaches that essentially assumed that the alkane molecules only fill the empty spaces between the chains of adsorbed surfactants [12,13]. Theory and experimental results relative to the interfacial tension at the water–liquid hexane interface were presented in [11]. In particular, the quantum chemical calculations confirmed the ratio of alkane to surfactant molecules at very diluted interfacial layers.
An aqueous solution drop can be formed either in a gaseous or liquid phase of alkane. The theoretical models developed earlier are capable to account not only for the adsorption of alkanes and the effects exerted thereby on the adsorption of surfactants, but also for the influence of surfactants on the adsorption of alkanes [11]. System properties for gaseous alkanes are different from those of systems involving liquid alkanes due to their different physical nature. More specifically, the adsorption of alkane from its gaseous phase onto a water drop surface initially occurs with a slight decrease (by a few mN/m) of surface tension, and subsequently, over longer times, it can result in the formation of a liquid alkane film, with a surface tension decrease down to 35 mN/m or even less. In contrast, we can assume by convenience that no adsorption of alkane occurs on the surface of a water drop immersed in liquid alkane, where the interfacial tension values vary between 51 and 53 mN/m depending on the alkane chain length [14]. However, for aqueous solutions of surfactants the situation is by far more complicated.
For the adsorption system considered here, the equation of state and the adsorption isotherm equation are derived by equating the chemical potential of each component in the bulk phase to that in the surface or interfacial layer (Butler equation), as explained in detail in [15].
In this work, the experimental systems were the drops of aqueous C13DMPO solutions surrounded by hexane-saturated air. In some experiments, the hexane was injected into the closed measuring cell which initially contained the drop either in equilibrium or in dynamic regime. In other experiments, hexane was injected into the cell before the formation of the drop, i.e., the air phase was pre-saturated by hexane. The results were processed using a theory proposed earlier, which was generalised to account for the depletion of surfactant within the drop caused by the adsorption at the drop surface.
The work presented here is dedicated to studies of surfactants adsorbing at the water–alkane vapor interfaces as intermediate state of water–air and water–alkane interfaces help to better understand the structure of surfactant adsorption layers. It will also be shown that at experimental conditions for which the classical Laplace equation was originally not derived, the drop profile analysis tensiometry can be only applied with respective caution. This means that the measured dynamic surface tensions in time domains where the hexane molecules start to form films at the surface of the studied aqueous drops have to be called ‘apparent surface tensions’. For an easier reading, however, we keep the simple nomination ‘surface tension’ throughout the manuscript.
2. Theory
In the present work, we discuss two-phase system consisting of a surfactant solution drop immersed into an air phase saturated with hexane. On drops of dilute solutions (and also of pure water) a phase of pure hexane can form, while this does not occur for drops of concentrated solutions. This phenomenon is discussed further below.
For the simultaneous adsorption of surfactant from the solution and alkane from the vapor phase at the drop interface the equation of state reads [11]
with
Here Π = γ0 − γ is the interfacial pressure, where γ0 and γ are the interfacial tension of pure solvent (water) and solution, respectively. In what follows, the subscript i refers to the components of the adsorption system (i = 1 or 2 for hexane and surfactant, respectively). In particular,
θi is the surface coverage, Гi the adsorbed amount, ωi the molar area, ωi0 the molar area at zero surface pressure of molecules of component i. The coefficients a1, a2 and a12 are the Frumkin interaction constants: a1 and a2 refer to the molecules of the same component and a12 to the two different types of molecules (surfactant and hexane). For alkane, the adsorption isotherm is [11,16,17]
where P1 is the partial pressure of the component 1 (alkane) in the gas phase, and d1 is its adsorption activity coefficient [11]. Note that the partial pressure of saturated hexane vapor at 25 °C is ca. 150 Torr (or 2 × 10⁴ Pa). The adsorption activity of alkane depends both on the interaction of alkane vapor with water (d1), and with the surfactant (k1). The additional term k1θ2 on the left-hand side in Equation (4) for k1 > 0 accounts for the influence of surfactant on the adsorption of alkane from the vapor phase, i.e., the presence of the surfactant enhances the adsorption of alkanes. The coefficient k1, reflecting the cooperativity of the two adsorbing species, was introduced in [18] where the adsorption of liquid alkane at the interface with aqueous surfactant solution drops was studied.
For water-soluble surfactants the corresponding adsorption isotherm reads
where b2 is the surfactant adsorption activity coefficient, and c2 is the equilibrium surfactant concentration within the drop. Note that the molar areas of adsorbed species enter into Equations (1)–(5) via Equation (3), and it is assumed that the molar area of the surfactant ω2 in Equation (3) depends linearly on the surface pressure [19]
Here, ε2 is the two-dimensional relative surface layer compressibility coefficient, which characterizes the intrinsic compressibility of the molecules in the surface layer. A similar approach was used in [18] to account for the surfactant influence on the adsorption of liquid alkanes, and vice versa (cooperativity effects).
In the experiment, the dependence of the interfacial tension (or interfacial pressure Π) on the initial bulk concentration C20 is measured. However, the actual equilibrium surfactant concentration within the drop C2 is lower, due to the depletion caused by the adsorption of surfactant at the drop surface
where S and V are the surface area and the volume of the drop, respectively. The software used in the calculation to determine the parameters of the adsorption model accounts for this effect.
3. Materials and Methods
The interfacial tension measurements were performed with the bubble/drop profile analysis tensiometers PAT-1 and PAT-2P (SINTERFACE Technologies, Berlin, Germany). As detailed in [10], the measurement relies on the best fit of a theoretical profile to the acquired experimental points of the profile. It is worth noting that the interfacial tension, γ, is calculated from the best fit values of the shape factor parameter.
After knowing the density difference, Δρ, between the two phases forming the interface, the gravity acceleration, g, and the radius of curvature at the drop apex, the parameter b is obtained by the best fit procedure.
For each experimental surface tension point, the software (SINTERFACE Technologies, Berlin, Germany) also yields the mean square error of the best fit profile, determined by comparing the measured drop profile coordinates with the calculated ones [10].
Two types of experiments were performed. In the first type, the hexane was injected into the cell either when the equilibrium surface tension was already established, or earlier, i.e., during the adsorption equilibration process. In the second type of experiments the hexane was initially injected into the cell, and after 30 s the drop was formed. Note that the equilibration of hexane vapor pressure, as monitored by the surface tension value, requires about 5 s.
The method used in this work (injection of pure hexane into the measurement cell) results in the saturation of the air in the cell by hexane vapors. It is not the subject of this work to study the influence of the partial hexane vapors pressure here as it was done before in [17], where it was shown that the amount of co-adsorbed hexane depends directly on the partial vapor pressure, leading to an increased surface pressure.
The aqueous drops were formed at the bottom tip of a vertical steel capillary. The internal profile was conical with an inner diameter of 2.8 mm at the tip. The used drops had a surface area between 35 and 38 mm2, which was kept constant in all measurements by the PAT software during the measurements (at about 20–21 mm3 of drop volume). Therefore, the volume to surface area ratio was 0.5–0.6 mm, which shows that the drops were non-spherical in shape.
Tridecyl dimethyl phosphine oxide (C13DMPO) was synthesized and purified as described in [20]. The hexane was of spectroscopic grade (Lab-SCAN, Bangkok, Thailand) with a purity better than 99% and used as received. The measurements were also performed with less pure hexane (98% and 95%) supplied by other manufacturers. In these samples the composition of impurities was not specified, except that in the production sheet of the 95% sample the presence of no less than 50 organic substances was mentioned. All aqueous surfactant solutions were prepared using Milli-Q water (Merck KGaA, Darmstadt, Germany) having a surface tension to air of 72.0 ± 0.2 mN/m at 25 °C. This value was constant for up to 20000 s. In experiments at the water/hexane vapor interface, 2 mL of hexane was poured on the bottom of the measuring cell having a volume of 30 mL.
4. Results and Discussion
Figure 1 illustrates the influence of the purity of hexane vapor on the surface tension of water drops. Two time domains could be distinguished on the dependencies shown in this Figure. At short times, the decrease of surface tension down to 66–67 mN/m occurs, with minimum error of drop profile calculation (ca. 1 µm). It is within this time range that the adsorption of hexane at the water drop surface occurs. The hexane samples with 98% and 95% purity exhibit smaller and less rapid surface tension decrease as compared with that for the 99% purity sample. The second time domain spans from 20 s upward for the hexane of 99% purity, and from 90 s for the sample of 95% purity. This faster surface tension decrease is accompanied by the increase in the error of drop profile calculation; therefore, the surface tension values for which the error exceeds 2 or 3 µm are unrealistic. Nevertheless, it is seen that in this second time domain the surface tension values are lower for the interface with hexane of higher purity grade. At times above 3000 s, all samples exhibit the presence of a liquid hexane phase in the water drop: when the experimental regime automatically maintains constant drop surface area, small variations of drop volume result due to the withdrawal of liquid from the drop, while normally the water is pumped into the drop to compensate the losses caused by evaporation. Note, the less pure hexane samples contain probably longer chain alkanes which are less volatile and hence decelerate and damp the hexane vapor effects.
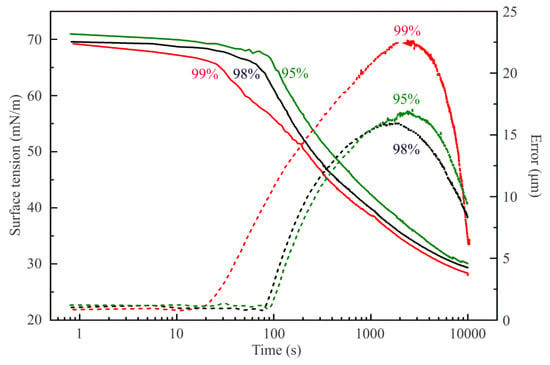
Figure 1.
Dynamic surface tension (solid lines) and fitting errors (dashed lines) for water drops in hexane vapor of different purity of 99%, 98%, and 95%, as labelled in the figure.
In addition, it is interesting to observe that at large times, the errors achieve values not too far from those indicative of realistic values of the interfacial tension obtained by the fitting procedure. If we use in Equation (8) the density of hexane (0.665 g/cm3 at 20 °C), instead of that of water, to recalculate the values of the interfacial tensions of about 30 mN/m, observed at these large times, we obtain the values expected for the hexane–water interface: about 19 mN/m, a clear indication for the formation of a fully developed hexane film around the water drop. The observed final surface tensions are similar.
Figure 2 illustrates the dynamic surface tension of C13DMPO solutions against air at concentrations of 5 and 10 μmol/L (solid lines). After 3000 or 2000 s, respectively, 2 mL of hexane were injected into the cell. The dynamic surface tensions of the same solutions for drops formed in a hexane pre-saturated air atmosphere are shown by dashed lines. Similar results obtained for higher C13DMPO concentrations of 20 and 40 µmol/L are shown in Figure 3, where the hexane was injected at 1900 and 1300 s, respectively. The injection of hexane resulted in a fast (during ca. 5–10 s) decrease of surface tension by 12–16 mN/m, followed by a much slower decrease. The dependencies shown in Figure 2 and Figure 3 by dashed curves, which correspond to experiments with drops formed in a hexane pre-saturated air atmosphere exhibit lower surface tension. This is caused by the initial adsorption of hexane onto the pure water drop surface. It is clearly seen, that after the injection was made, both curves corresponding to the same surfactant concentration almost coincide. Accordingly, the equilibrium surface tensions of the mixed C13DMPO + hexane adsorption layers do not depend on the way in which the mixed layers were formed.
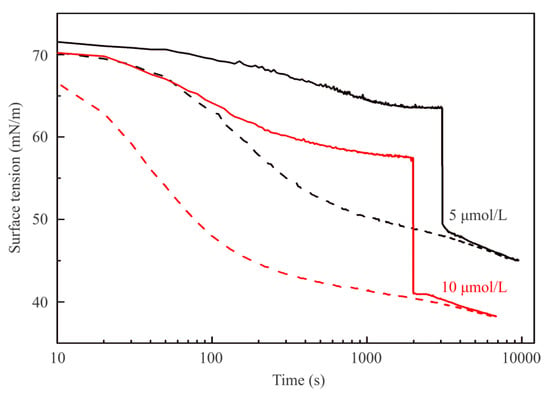
Figure 2.
Dynamic surface tension of 5 μmol/L and 10 μmol/L C13DMPO solutions for drops formed in a cell initially containing only air and injection of 2 mL of hexane after equilibration (solid curves); dashed curves illustrate the dynamics of the same solutions for drops formed in a cell with pre-saturated hexane atmosphere.
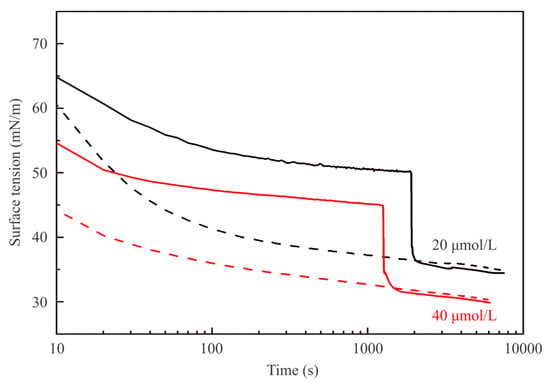
Figure 3.
The same as in Figure 1 for C13DMPO concentrations of 20 and 40 μmol/L.
Interestingly, in this context the results shown in Figure 4 illustrate the dynamic surface tension of C13DMPO solutions with a concentration of 5 μmol/L in the experiment where the 2 mL of hexane were injected into the cell at 100, 500, and 3000 s after the drop was formed in pure air. The curve for 3000 s and the dashed curve are reproduced from Figure 2. At the surface tension of 70 mN/m (at 100 s) the injection resulted in the surface tension decrease by 9 mN/m, while when the hexane was injected at 64 mN/m (at 3000 s) the sudden decrease was even 14 mN/m. For all studied C13DMPO concentrations, the hexane injections after establishment of the surfactant adsorption equilibrium lead to almost the same sudden surface tension jumps of 13–14 mN/m. Note that all curves obtained for different injection times merge with the dynamic curve obtained for the case when the drop was formed in a hexane pre-saturated air atmosphere.
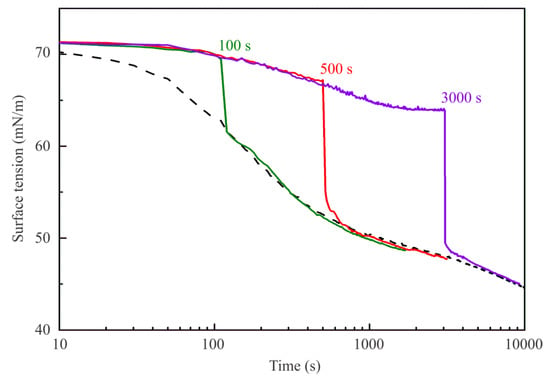
Figure 4.
Dynamic surface tension of a 5 μmol/L C13DMPO solution for injections of 2 mL of hexane after 100, 500, and 3000 s of the drop formation moment. Curves for hexane injection at 3000 s and for the hexane injection prior to the drop formation are reproduced from Figure 2.
Let us consider the errors in the drop profile calculations for the experiments in hexane saturated air. Before the injection this error at all concentrations is about 0.8–1.4 µm. Immediately after the hexane injection this error increases to 3–4 µm, and decreases to 0.6–1.0 µm within 10–20 s after the injection. This increase of the error can be attributed to the fast decrease of the surface tension due to hexane injection, and to the deformation of the drop. There is an essential difference between the error values determined for surfactant solution drops and those determined for pure water drops in hexane vapor. For the latter case, the error becomes as high as 20–30 μm, because condensed layers of hexane on the surface of pure water drops are formed, often leading to hexane lenses hanging at the water drop apex. This effect was not observed for sufficiently high surfactant solution drops.
Figure 5 illustrates the equilibrium surface tension isotherms of C13DMPO solutions at the aqueous solution/air interface. Note that, for the sake of comparison, some experimental values and theoretical curves are plotted in two scales: against the initial C13DMPO concentration in the solution bulk c20 (black curves and symbols), and against the equilibrium concentration c2 within the drop (red curves and symbols), if different from c20. Theoretical curves plotted in Figure 5 were calculated using the model defined by Equations (1)–(7); note however that for the solution drop/air interface (no alkane vapor in the system) Equation (4) becomes irrelevant (P1 = k1 = θ1 = 0) and the set of equations simplifies to the ordinary Frumkin adsorption model.
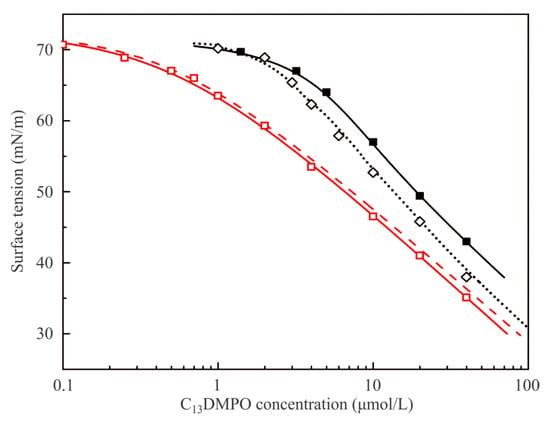
Figure 5.
Equilibrium surface tension isotherms for the aqueous C13DMPO solution/air interface obtained by various methods. For details, see text.
Data obtained in the present work using the drop profile method and plotted against the initial concentration in the solution are shown by black solid squares (■); the black solid curve represents the results obtained by fitting these experimental values to the theoretical model using the following parameter values: ω20 = 3.1 × 10⁵ m2/mol, b2 = 670 m3/mol, a2 = 0.9 and ε2 = 0.005 m/mN. Also shown are the data obtained in [21] using the drop profile tensiometry method (black open diamonds ◊). Some discrepancy between the two sets of data obtained by the same method can be attributed to the fact that in the experiments reported in [21] the V/S ratio for the drop (0.6–0.7 mm) was higher than that in the present work (0.50–0.55 mm); therefore, in the present experiments the depletion losses due to adsorption were higher, which implies larger initial concentration at equal surface tension values. These results are fitted by the black dotted line calculated with the same values of model parameters as the solid curve, but with a higher V/S ratio. The lower this ratio, the larger are the concentration losses caused by adsorption on the drop surface. The red dashed curve corresponds to the curve obtained by fitting of the experimental results obtained here, but replotted against the final equilibrium concentration in the drop. This result can be compared with the experimental values (red open squares) obtained in [21] by the Du Noüy ring method and the red solid curve obtained by fitting of these data by the Frumkin model. Note that for this method the difference between c and c0 values is irrelevant. It is seen that the obtained curve agrees quite well with the red dashed curve obtained earlier in [21]. Note the data illustrated in Figure 5 are all below the CMC (for aqueous C13DMPO solutions it is about 60–70 μmol/L).
Figure 6 illustrates dependencies of equilibrium surface tension of C13DMPO solutions on the initial concentration at various interfaces. Curve 1 and experimental points shown by solid squares are reproduced from Figure 5 and correspond to the interface with air. Curve 2 and points shown by solid diamonds correspond to the adsorption isotherm for solution drops at the interface with hexane vapor plotted against the initial concentration c20, while curve 3 and points shown by open diamonds show the same values as the curve and points 2, but re-plotted against the equilibrium concentration in the drop c2, i.e., taking into account the surfactant concentration losses due to its adsorption at the drop surface. Curves 2 and 3 were calculated by fitting the experimental data shown by solid diamonds using the software for the model Equations (1)–(7). Model parameters for the surfactant which yield the best fit are only slightly higher than those determined for the solution–air interface: b2 = 730 m3/mol and a2 = 1.2; the parameters which become involved due to the presence of hexane vapor are: P1 = 2 × 10⁴ Pa, d1 = 4 × 10⁻⁵ 1/Pa, k1 = 10, ω10 = 3.0 × 10⁵ m2/mol, a1 = 0, ε1 = 0, a12 = 1.5. It is seen that the proposed model provides a very good description of experimental results.
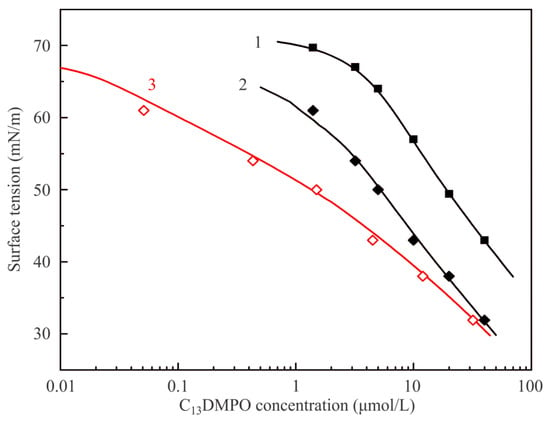
Figure 6.
Equilibrium surface tension isotherms of C13DMPO aqueous solutions at the interfaces with air and hexane vapor. For details see text.
Figure 7 illustrates dependencies of the adsorbed amounts of components on the equilibrium concentration of C13DMPO. The dependence of C13DMPO adsorption on the initial concentration is also shown by black dash-dotted line; it is seen that in this concentration range the depletion effect results in a difference between the equilibrium concentration and the initial concentration of about one order of magnitude. Clearly for the minimum studied concentration the adsorption of hexane somewhat exceeds 1 µmol/m2. This adsorbed amount corresponds to the decrease of surface tension by 5–6 mN/m, in agreement with the experiments reported in [9] for the water drop/hexane vapor surface. With increasing surfactant concentration, the adsorption of hexane first increases to 2.2 µmol/m2, and then decreases. At maximum C13DMPO concentration hexane adsorption is 10 times lower than at the maximum value due to the replacement of hexane by surfactant. This result coincides quite well with that reported earlier in [16]. Of interest are also the results obtained for k1 = 0 and a12 = 0, which simulate the situation when there is no interaction between hexane and surfactant, which in reality enhances the adsorption of hexane. In this fictitious case, the adsorption of hexane rapidly decreases from 1.2 µmol/m2 to zero (at the C13DMPO concentration of 10−5 mol/L). At the same time, the adsorption of C13DMPO significantly increases at concentrations above 10−6 mol/L. Thus, the presence of surfactant causes essential increase of the adsorption of hexane, which is controlled by the parameter k1.
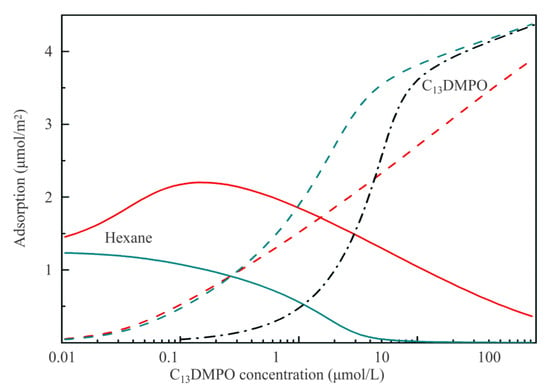
Figure 7.
Adsorption values of hexane (solid red line) and C13DMPO (dashed red line) corresponding to the theoretical curves 2 and 3 in Figure 6. Green lines show the unrealistic results of calculations made for zero values of k1 and a12. Black dash-dotted line shows the dependence of C13DMPO adsorption plotted against the initial concentration c20.
Note, in [11] a new method (which involves the interfacial tension data) was used to determine the C13DMPO distribution coefficient between water and hexane. These results are presented in the Appendix A.
An interesting feature characteristic for the solutions with low C13DMPO concentration should be mentioned. Figure 8 illustrates the dynamic surface tension of solutions with concentrations of 1 μmol/L and 5 μmol/L. The capillary used for these experiments was 3 mm in diameter, thus the V/S ratio was equal to 0.7 mm, i.e., somewhat higher than the value 0.6 mm for the capillary 2.8 mm in diameter used for the experiments illustrated by Figure 2, Figure 3 and Figure 4. This difference only slightly affects the dependencies shown in Figure 6 and Figure 7: for the initial concentration below 20 μmol/L the surface tension lowers by 2 mN/m while adsorption increases by 10–15%.
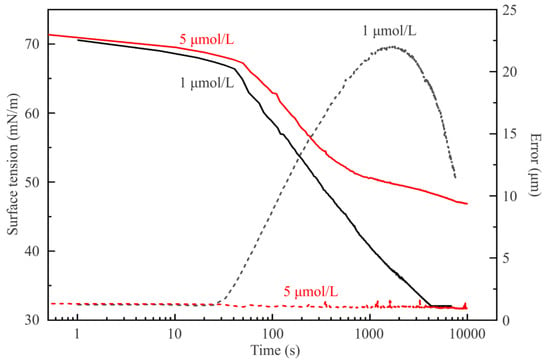
Figure 8.
Dynamic surface tension and fitting error for aqueous solution drops of C13DMPO of concentrations of 1 µmol/L and 5 µmol/L in hexane vapor.
At first sight, it seems extremely strange that the higher surfactant concentration results in a higher surface tension value than that for the lower. In Figure 8, the equilibrium value for the C13DMPO concentration of 5 μmol/L is 47 mN/m, which is higher than the very low equilibrium value 32 mN/m for the surfactant concentration of 1 µmol/L. This fact can be explained based on the values of the drop profile fitting error (also shown in Figure 8) and on the drop image appearance. It appears that, in the drop of 1 µmol/L surfactant solution, a liquid hexane phase is formed. In Figure 9, images of C13DMPO solution drops are shown after a certain time of drop formation. While after about 500 s the drop profiles are almost undisturbed, after about 3500 s the result of condensation and drainage of hexane towards to drop apex is clearly visible. About 6500 s after drop formation, this hexane lens has been further grown up.
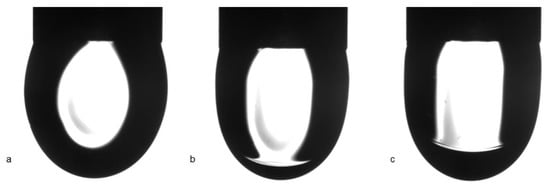
Figure 9.
Images of 1 µmol/L aqueous C13DMPO solution drops formed in hexane vapor at different times after drop formation: (a) 516 s, (b) 3522 s, (c) 6535 s.
The concentration error made due to the presence of liquid hexane phase condensed at the drop surface can be estimated as follows. There are two factors which can lead to a decrease of the surfactant concentration in the drop. The first one is the adsorption of surfactant at the drop surface; however, this is accounted for by the theoretical model via Equation (7). It is seen from Figure 6 that for the initial concentration of 10 μmol/L the equilibrium concentration within the drop decreases to 5 μmol/L. The second factor is the dissolution of surfactant in the liquid hexane phase (hexane layer around and at the bottom of the drop). The volume of this hexane phase at the drop can be determined using the parameters measured by PAT during the experimental run. Note that the drop profile measurement error at this concentration is about 1.2–1.5 μm. During the run, the PAT software keeps the drop surface area constant; this is controlled automatically by sucking solution out of the drop to compensate the expansion of drop surface caused by the decreasing interfacial tension. At a concentration of 5 μmol/L, the drop volume decreases by 0.9 mm3 during 10000 s. At the same time, the volume of water sucked out of the drop and measured by PAT is larger and amounts to 1.1 mm3. The difference between these two values gives the volume of liquid hexane collected around the drop: 0.2 mm3. The coefficient of C13DMPO distribution between hexane and water is 30 [2]. If the equilibrium is attained between the concentrations of the surfactant in hexane and water (which is however improbable) then for a drop volume of 25 mm3 the equilibrium surfactant concentration decreases from 5 μmol/L to 4.3 μmol/L (assuming also the decrease due to adsorption), and the surfactant concentration in hexane (the third phase) becomes 120 μmol/L. This feature, also assuming the absence of the equilibrium state, is too complicated to be accounted for in the given theory. However, this effect should be negligible for dynamic experiments when the distribution coefficient does not exceed the value of 5 to 10.
Hence, at a very low C13DMPO concentration the amount of surfactant in the drop is too small to prevent the penetration of hexane into the interfacial layer at the drop surface. It can be seen from Figure 7 that for the initial concentration of 1 µmol/L the adsorbed amount is about 0.47 µmol/m2, which is 8 times lower than the maximum value. Therefore, the adsorbed layer formed by surfactant on this aqueous solution drop is capable to enhance the adsorption of hexane, but on the other side cannot prevent the co-adsorption of hexane at the drop surface and subsequent formation of a liquid hexane phase at the apex via condensation and drainage downwards. Thus, for such low C13DMPO concentrations, the profile at large times is that of the hexane film surrounding the aqueous droplet. Consequently, the surface tension reported in Figure 8 (about 32 mN/m) has to be recalculated using the density of hexane in Equation (8), which provides values close to 21 mN/m, not far from that of pure hexane. This phenomenon will further be studied systematically for other surfactants in subsequent work.
5. Conclusions
The present work deals with the surface tension of aqueous C13DMPO solution drops in hexane vapor. The experiments were performed using the drop profile tensiometry process method. The hexane was injected into the measuring cell, either before the formation of the solution drop, or at certain times during or after the adsorption equilibration at the drop surface. It was confirmed that the surface tension curves for all experimental regimes ultimately coincide with each other when attaining the final equilibrium stage of adsorption.
The experimental equilibrium surface tension isotherms of C13DMPO solutions, at the interface with air and at the interface with hexane vapor were processed using a theory proposed earlier [11]. The model was extended here to additionally account for the depletion of the surfactant concentration caused by its adsorption on the drop surface. The adsorption of components was calculated and it is shown that the presence of surfactant leads to a two-times-higher hexane adsorption and its subsequent decrease, while the adsorption of C13DMPO exhibits an almost monotonous increase with increasing surfactant concentration. The model coefficient k1, which controls the dependence of the ‘effective’ surface activity of hexane at the drop surface covered by a surfactant adsorption layer, is responsible for the increase of the hexane adsorption from the hexane vapor phase. It confirms that the enhancement of hexane adsorption results from its interaction with the surfactant hydrophobic tails within the interfacial layer.
Author Contributions
V.B.F. and R.M. conceived the study and developed the theory; R.M., V.I.K., V.B.F., and L.L. designed the experiments; E.V.A. developed the fitting software; A.J., N.M., and A.V.M. performed the experiments; A.V.M. maintained the experimental tools and contributed materials; A.J.; V.B.F., R.M., L.L., and E.V.A. wrote the manuscript. All authors have read and agreed to the published version of the manuscript.
Funding
This research was funded by the ESA MAP projects “Soft Matter Dynamics” and “Emulsion Dynamics and Droplet Interfaces”, and by the ICCCW NASU project III-6-16:20.
Acknowledgments
We thank Svetlana V. Lylyk for performing careful experiments.
Conflicts of Interest
The authors declare no conflict of interest.
Appendix A
Drop profile analysis tensiometry was applied to determine the distribution coefficient of C13DMPO for a water–hexane system in [2]. The basic idea is to measure the interfacial tension isotherm in two configurations: a hexane drop immersed in the surfactant aqueous solutions at different bulk concentrations, and a water drop immersed into a hexane solution of the same surfactant. Both types of experiments lead to an isotherm for the equilibrium interfacial tensions with the same slope but with a concentration shift between them. This shift refers exactly to the value of the distribution coefficient. It is seen from Figure A1 that at the same interfacial tension the C13DMPO concentration in hexane is by a factor of 30 larger than that in water. This value gives the distribution coefficient.
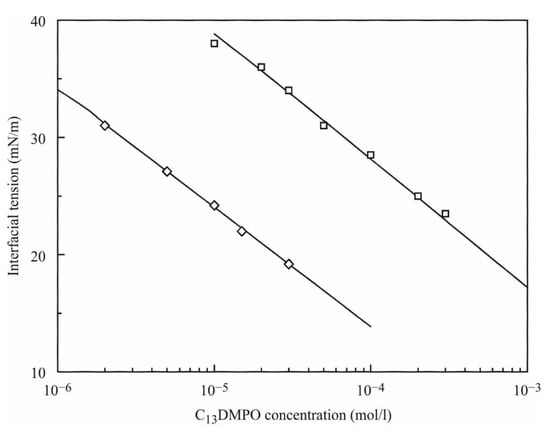
Figure A1.
Equilibrium interfacial tension isotherms for C13DMPO solutions (reproduced from [2]). Experimental values: squares (☐)—water drop immersed into the surfactant solution in hexane; diamonds (◊)—hexane drop immersed into the aqueous surfactant solution. Lines show the results of model calculations as explained in [2].
References
- Liggieri, L.; Ravera, F.; Ferrari, M.; Passerone, A.; Miller, R. Adsorption kinetics of alkyl phosphine oxides at water/hexane interface: 2. Theory of the adsorption with transport across the interface in finite systems. J. Colloid Interface Sci. 1997, 186, 46–52. [Google Scholar] [CrossRef] [PubMed]
- Fainerman, V.B.; Sharipova, A.A.; Aidarova, S.B.; Kovalchuk, V.I.; Aksenenko, E.V.; Makievski, A.V.; Miller, R. Direct determination of the distribution coefficient of tridecyl dimethyl phosphine oxide between water and hexane. Colloids Interfaces 2018, 2, 28. [Google Scholar] [CrossRef]
- Langmuir, I. The constitution and fundamental properties of solids and liquids. II. Liquids. J. Am. Chem. Soc. 1917, 39, 1848–1907. [Google Scholar] [CrossRef]
- Frumkin, A. Die Kapillarkurve der höheren Fettsäuren und die Zustandsgleichung der Oberflächenschicht. Z. Physikalische Chemie 1925, 116, 466–484. [Google Scholar] [CrossRef]
- Aveyard, R.; Binks, B.P.; Cooper, P.; Fletcher, P.D.I. Incorporation of hydrocarbons into surfactant monolayers. Adv. Colloid Interface Sci. 1990, 33, 59–77. [Google Scholar] [CrossRef]
- Thoma, M.; Schwendler, M.; Baltes, H.; Helm, C.A.; Phohl, T.; Riegler, H.; Möhwald, H. Ellipsometry and X-ray reflectivity studies on monolayers of phosphatidylethanolamine and phosphatidylcholine in contact with n-dodecane, n-hexadecane, and bicyclohexyl. Langmuir 1996, 12, 1722–1728. [Google Scholar] [CrossRef]
- Phohl, T.; Möhwald, H.; Riegler, H. Ellipsometric study of the wetting of air/water interfaces with hexane, heptane, and octane from saturated alkane vapors. Langmuir 1998, 14, 5285–5290. [Google Scholar] [CrossRef]
- Medrzycka, K.; Zwierzykowski, W. Adsorption of alkyltrimethylammonium bromides at the various interfaces. J. Colloid Interface Sci. 2000, 230, 67–72. [Google Scholar] [CrossRef]
- Javadi, A.; Moradi, N.; Möhwald, H.; Miller, R. Adsorption of alkanes from the vapour phase on water drops measured by drop profile analysis tensiometry. Soft Matter 2010, 6, 4710–4720. [Google Scholar] [CrossRef]
- Loglio, G.; Pandolfini, P.; Liggieri, L.; Makievski, A.V.; Ravera, F. Determination of interfacial properties by the pendant drop tensiometry: Optimisation of experimental and calculation procedures. In Bubble and Drop Interfaces; Miller, R., Liggieri, L., Eds.; Brill Publishers: Leiden, The Netherlands, 2011; Volume 2, pp. 7–38. ISBN 978 90 04 17495 5. [Google Scholar]
- Fainerman, V.B.; Aksenenko, E.V.; Kovalchuk, V.I.; Mucic, N.; Javadi, A.; Liggieri, L.; Ravera, F.; Loglio, G.; Schneck, E.; Miller, R. New view of the adsorption of surfactants at the water–alkane interface–competitive and cooperative effects of surfactant and alkane molecules. Adv. Colloid Interface Sci. 2020, 279, 102143. [Google Scholar] [CrossRef]
- Binks, B.P.; Crichton, C.; Fletcher, P.D.I.; MacNab, J.R.; Li, Z.X.; Thomas, R.K.; Penfold, J. Adsorption of oil into surfactant monolayers and structure of mixed surfactant+oil films. Colloids Surf. A 1999, 146, 299–313. [Google Scholar] [CrossRef]
- Kwon, O.-S.; Jing, H.; Shin, H.K.; Wang, X.; Satija, S.K. Formation of n-alkane layers at the vapor/water interface. Langmuir 2007, 23, 12249–12253. [Google Scholar] [CrossRef] [PubMed]
- Zeppieri, S.; Rodríguez, J.; López de Ramos, A.L. Interfacial tension of alkane + water systems. J. Chem. Eng. Data 2001, 46, 1086–1088. [Google Scholar] [CrossRef]
- Fainerman, V.B.; Lucassen-Reynders, E.H.; Miller, R. Description of the adsorption behaviour of proteins at water/fluid interfaces in the framework of a two-dimensional solution model. Adv. Colloid Interface Sci. 2003, 106, 237–259. [Google Scholar] [CrossRef]
- Mucic, N.; Moradi, N.; Javadi, A.; Aksenenko, E.V.; Fainerman, V.B.; Miller, R. Mixed adsorption layers at the aqueous CnTAB solution/hexane vapor interface. Colloids Surf. A 2014, 442, 50–55. [Google Scholar] [CrossRef]
- Mucic, N.; Moradi, N.; Javadi, A.; Aksenenko, E.V.; Fainerman, V.B.; Miller, R. Effect of partial vapor pressure on the co-adsorption of surfactants and hexane at the water/hexane vapor interface. Colloids Surf. A 2015, 480, 79–84. [Google Scholar] [CrossRef]
- Fainerman, V.B.; Aksenenko, E.V.; Makievski, A.V.; Nikolenko, M.V.; Javadi, A.; Schneck, E.; Miller, R. Particular behavior of surface tension at the interface between aqueous solution of surfactant and alkane. Langmuir 2019, 35, 15214–15220. [Google Scholar] [CrossRef] [PubMed]
- Fainerman, V.B.; Kovalchuk, V.I.; Aksenenko, E.V.; Michel, M.; Leser, M.E.; Miller, R. Models of two-dimensional solution assuming the internal compressibility of adsorbed molecules: A comparative analysis. J. Phys. Chem. 2004, 108, 13700–13705. [Google Scholar] [CrossRef]
- Lunkenheimer, K.; Haage, K.; Hirte, R. Novel Results on the Adsorption Properties of n-Alkyldimethylphosphine Oxides at the Air/Water Interface. Langmuir 1999, 15, 1052–1058. [Google Scholar] [CrossRef]
- Fainerman, V.B.; Lylyk, S.V.; Makievski, A.V.; Miller, R. Interfacial tensiometry as a novel methodology for the determination of surfactant adsorption at a liquid surface. J. Colloid Interface Sci. 2004, 275, 305–308. [Google Scholar] [CrossRef] [PubMed]
© 2020 by the authors. Licensee MDPI, Basel, Switzerland. This article is an open access article distributed under the terms and conditions of the Creative Commons Attribution (CC BY) license (http://creativecommons.org/licenses/by/4.0/).
