1. Introduction
In contact with a solvent, surfaces will typically charge; indeed it is often difficult to achieve a completely neutral surface in solution. This makes understanding electrostatics extremely important across a broad array of systems containing liquid interfaces, be they biological such as protein–protein interactions, or synthetic as in many commercial formulations. Although energetically unfavourable, the charging of a surface is driven by the entropy and solvation gains as counterions are released into solution. The magnitude of the surface charge density generated is controlled by the chemical natures of the surface, the solvent, and the strength of ion-surface binding. In aqueous systems, this balance often results in highly charged surfaces, such as glass or silica in water that can have >10
charges per
m
, where the propensity of the surface groups to dissociate is significantly stronger than the energetic cost of charging [
1]. However, by contrast, in nonpolar systems, the energetic cost of ionization may become more comparable to the entropic gain of counterion release, so few surface groups dissociate. Such low-charge surfaces are expected to be far more sensitive to external factors that could alter the delicate balance between bound and ionized surface states.
Several length scales quantify the strength of electrostatic interactions; the two most fundamental being the Bjerrum length
and the Debye-Hückel screening length
. The Bjerrum length is the distance at which two opposite point charges must be separated in order for them to dissociate via thermal excitation:
where
is the thermal energy,
is the permittivity of free space, and
is the dielectric constant of the solvent. Equation (
1) reveals that the Bjerrum length is significantly larger for low dielectric solvents such as dodecane (
,
nm) than for polar solvents such as water (
0.72 nm at 298 K). The number density of ions generated by the dissociation of a weak electrolyte scales as
, where
c is the concentration of an added salt, and equivalently the surface charge density as
. Consequently, low surface charge densities and low ionic strengths are expected in low dielectric solvents. The second key length scale in the statistical mechanics of electrolyte solutions is the screening length
introduced first by Debye and Hückel [
2] (DH). The central result of their work is that the potential of mean force
between two ions in a simple 1:1 electrolyte at a separation
r behaves like
as
, where the DH screening length is
. Here
and
is the total density of monovalent ions. With the number density of ions dependent on both
c and
, it is more prudent to use the electrostatic coupling parameter
rather than the molarity to determine the significance of electrostatic correlations. Following [
3],
, where
q is the valency of the ion (here,
), and
is the surface charge density. Ionic correlations are unimportant in the limit
, where the Poisson–Boltzmann description is expected to be valid. For the system investigated here, we estimate
(estimating
from the measured particle charge
Z and the surface area
) and hence a mean-field framework should be accurate.
Near a charged surface or colloid, ions distribute themselves according to the competing effects of electrostatics and entropy. The lowest free energy state is the formation of an electrical double layer. When two like-charged surfaces approach each other, the outer diffuse layers of ions become confined and as a consequence the two surfaces or colloids repel. In a linear Poisson–Boltzmann (PB) treatment [
4,
5], the interaction potential, as a function of the surface-to-surface separation
h, behaves as
, in the limit of
. In the classical Derjaguin–Landau–Verwey–Overbeek (DLVO) theory of charged colloids [
5], the decay length of the potential between particles
is identified with the DH screening length
. Although
is found in an approximate theory, Kjellander and Mitchell [
6] has shown rigorously using a formally exact dressed-ion theory that the ion cloud around a single colloid particle must behave asymptotically as predicted by linear PB theory. Thus, they concluded, more generally, that the force between two single colloid particles immersed in an electrolyte solution will decay at large separations with a decay length equal to that of the ion–ion distribution of the electrolyte [
6]. Measurement of the asymptotic tail of the potential between individual colloids should therefore yield a decay length
which depends only on the properties of the electrolyte solution and not on the surface properties of the colloids. The statistical mechanical theory of electrolyte solutions has seen a long and complex development ever since Debye and Hückel [
2]. Monte Carlo simulations [
7] for the restricted primitive model of an electrolyte solution have shown that a single effective ion–ion correlation length can be defined at high electrolyte concentrations, which is smaller than the DH limiting theory. The departures from DH are, however, relatively small [
8] for concentrations of monovalent salts below about 0.1 M. Theoretical calculations do, however, consistently predict a reduction in the effective ion–ion correlation length below the DH theory (see [
9] for an extensive review). In summary, we note that, while the decay length
, determined from the force between colloids, must rigorously approach
at low electrolyte concentration, at high salt concentrations, theory suggests that the measured decay length should be
smaller than DH predictions (i.e., over-screened).
Experimental measurements of the screening length
from the direct interactions between charged surfaces or charged colloids are surprisingly rare. The earliest results seem to be the surface force (SFA) measurements of Israelachvili and Adams [
10] who found close agreement between measured screening lengths and DH predictions in dilute aqueous KNO
solutions (
M). However, in slightly more concentrated salt solutions, they reported decay lengths that were ∼25% larger than the theoretical
values, while in 1 M KNO
the measured decay length seemed to be up to
larger than DH predictions. Observations of such anomalously large screening lengths (i.e., under-screening) in concentrated electrolytes and ionic liquids have been reported recently [
11,
12]. Careful SFA measurements [
12] suggest that the phenomenon of under-screening only occurs in the high salt limit, where the predicted Debye length
becomes comparable to or smaller than the size of an ion. Direct measurements of the screening length in colloidal systems are similarly sparse. Flicker and Bike [
13] reported total internal reflection microscopy (TIRM) measurements of the screening length
, which agreed well with DH predictions at least at low electrolyte concentrations (
M NaCl in water). However, at higher salt concentrations, the authors note that the range of the electrostatic and van der Waals interactions become comparable and it becomes increasingly problematic [
14] to disentangle them. Ao et al. using TIRM [
15] similarly found reasonable agreement with DH predictions at
M, although at higher concentrations they observed screening lengths apparently significantly larger than the calculated Debye lengths. Their measurements were repeated by Nayeri et al., who treated the retarded van der Waals forces with particular care, and showed that screening lengths obtained from fitted TIRM-measured potentials agreed with predicted Debye lengths to within a few nm [
16], for
M.
In this paper, we seek to clarify if the screening length measured from the force between two charged colloids equals the Debye length, when dispersed in a low dielectric environment. Studying electrostatic interactions in nonpolar solvents has two advantages over aqueous-based experiments. First, aside from a straightforward scaling of the Bjerrum length , the fundamental equations of electrostatics should be unchanged. Second, the charge interactions will be extremely long range by comparison to those found in water, so van der Waals interactions, which complicate the analysis of TIRM measurements for instance at high ionic strengths, can be safely neglected. We conduct a systematic study of the screening of electrostatic interactions as electrolyte is added, using blinking optical tweezers to measure the force between pairs of individual charged colloids. The screening length measured from the optical tweezer data is compared to the Debye length , determined from the conductivity of the suspensions. The comparison, as a function of the concentration of an added salt, is discussed in line with the predictions of DH theory.
2. Materials and Methods
Dilute dispersions of poly(methyl methacrylate) (PMMA) particles (radius
nm), sterically stabilised with a layer of poly(12-hydroxystearic acid) (PHSA), were dispersed in dodecane (
) at a volume fraction of
. The solvent was dried with 10 Å molecular sieves to keep water content low (<15 ppm) and was not used until the conductivity reduced to 3 pS cm
. The electrolyte used consisted of a tetradodecyl ammonium cation with a tetrakis [3,5-bis-(tri-fluoromethyl) phenyl] borate anion, abbreviated here to TDAT. The synthesis of both the particles and the electrolyte used are detailed elsewhere [
17,
18]. Nonpolar suspensions were loaded into a 0.1 × 2 mm (internal dimensions) capillary (CM scientific, borosilicate) which was sealed with UV adhesive (Norland Optical Adhesives, No.81) and cured with a UV lamp until solid. The slide was placed upside down on an inverted microscope (Axiovert 200, Carl Zeiss, Oberkochen, Germany) and imaged with a 1.3 N.A. oil immersion objective (Plan Neofluor, 100×, Carl Zeiss, Oberkochen, Germany).
The force between a pair of charged particles was measured using holographic, blinking optical tweezers (BOTs). The BOT technique measures the force between two optically trapped particles via a statistical method [
19]. The two optical traps, created using a 5 W diode-pumped Nd:YAG laser (1064 nm, IPG Photonics) and a spatial light modulator (Holoeye PLUTO-NIR)), were periodically blinked on and off such that both particles were repeatedly free to diffuse for a short period of time (25 ms) before being recaptured by the optical traps and returned to their original locations. To prevent any hydrodynamic effects from nearby charged interfaces [
20], we ensured the particles were located in the centre of the cell, several screening lengths from any charged surfaces or other particles. Using a high speed camera (Dalsa Genie HM640 at 500 fps), the particles were tracked [
21] to measure their displacement and mean square displacement over time. Averaging these values over ≈ 5000 trap cycles gave the velocity
v and diffusion constant
D at each pair separation
r. The force
F is determined from the fluctuation-dissipation theorem as
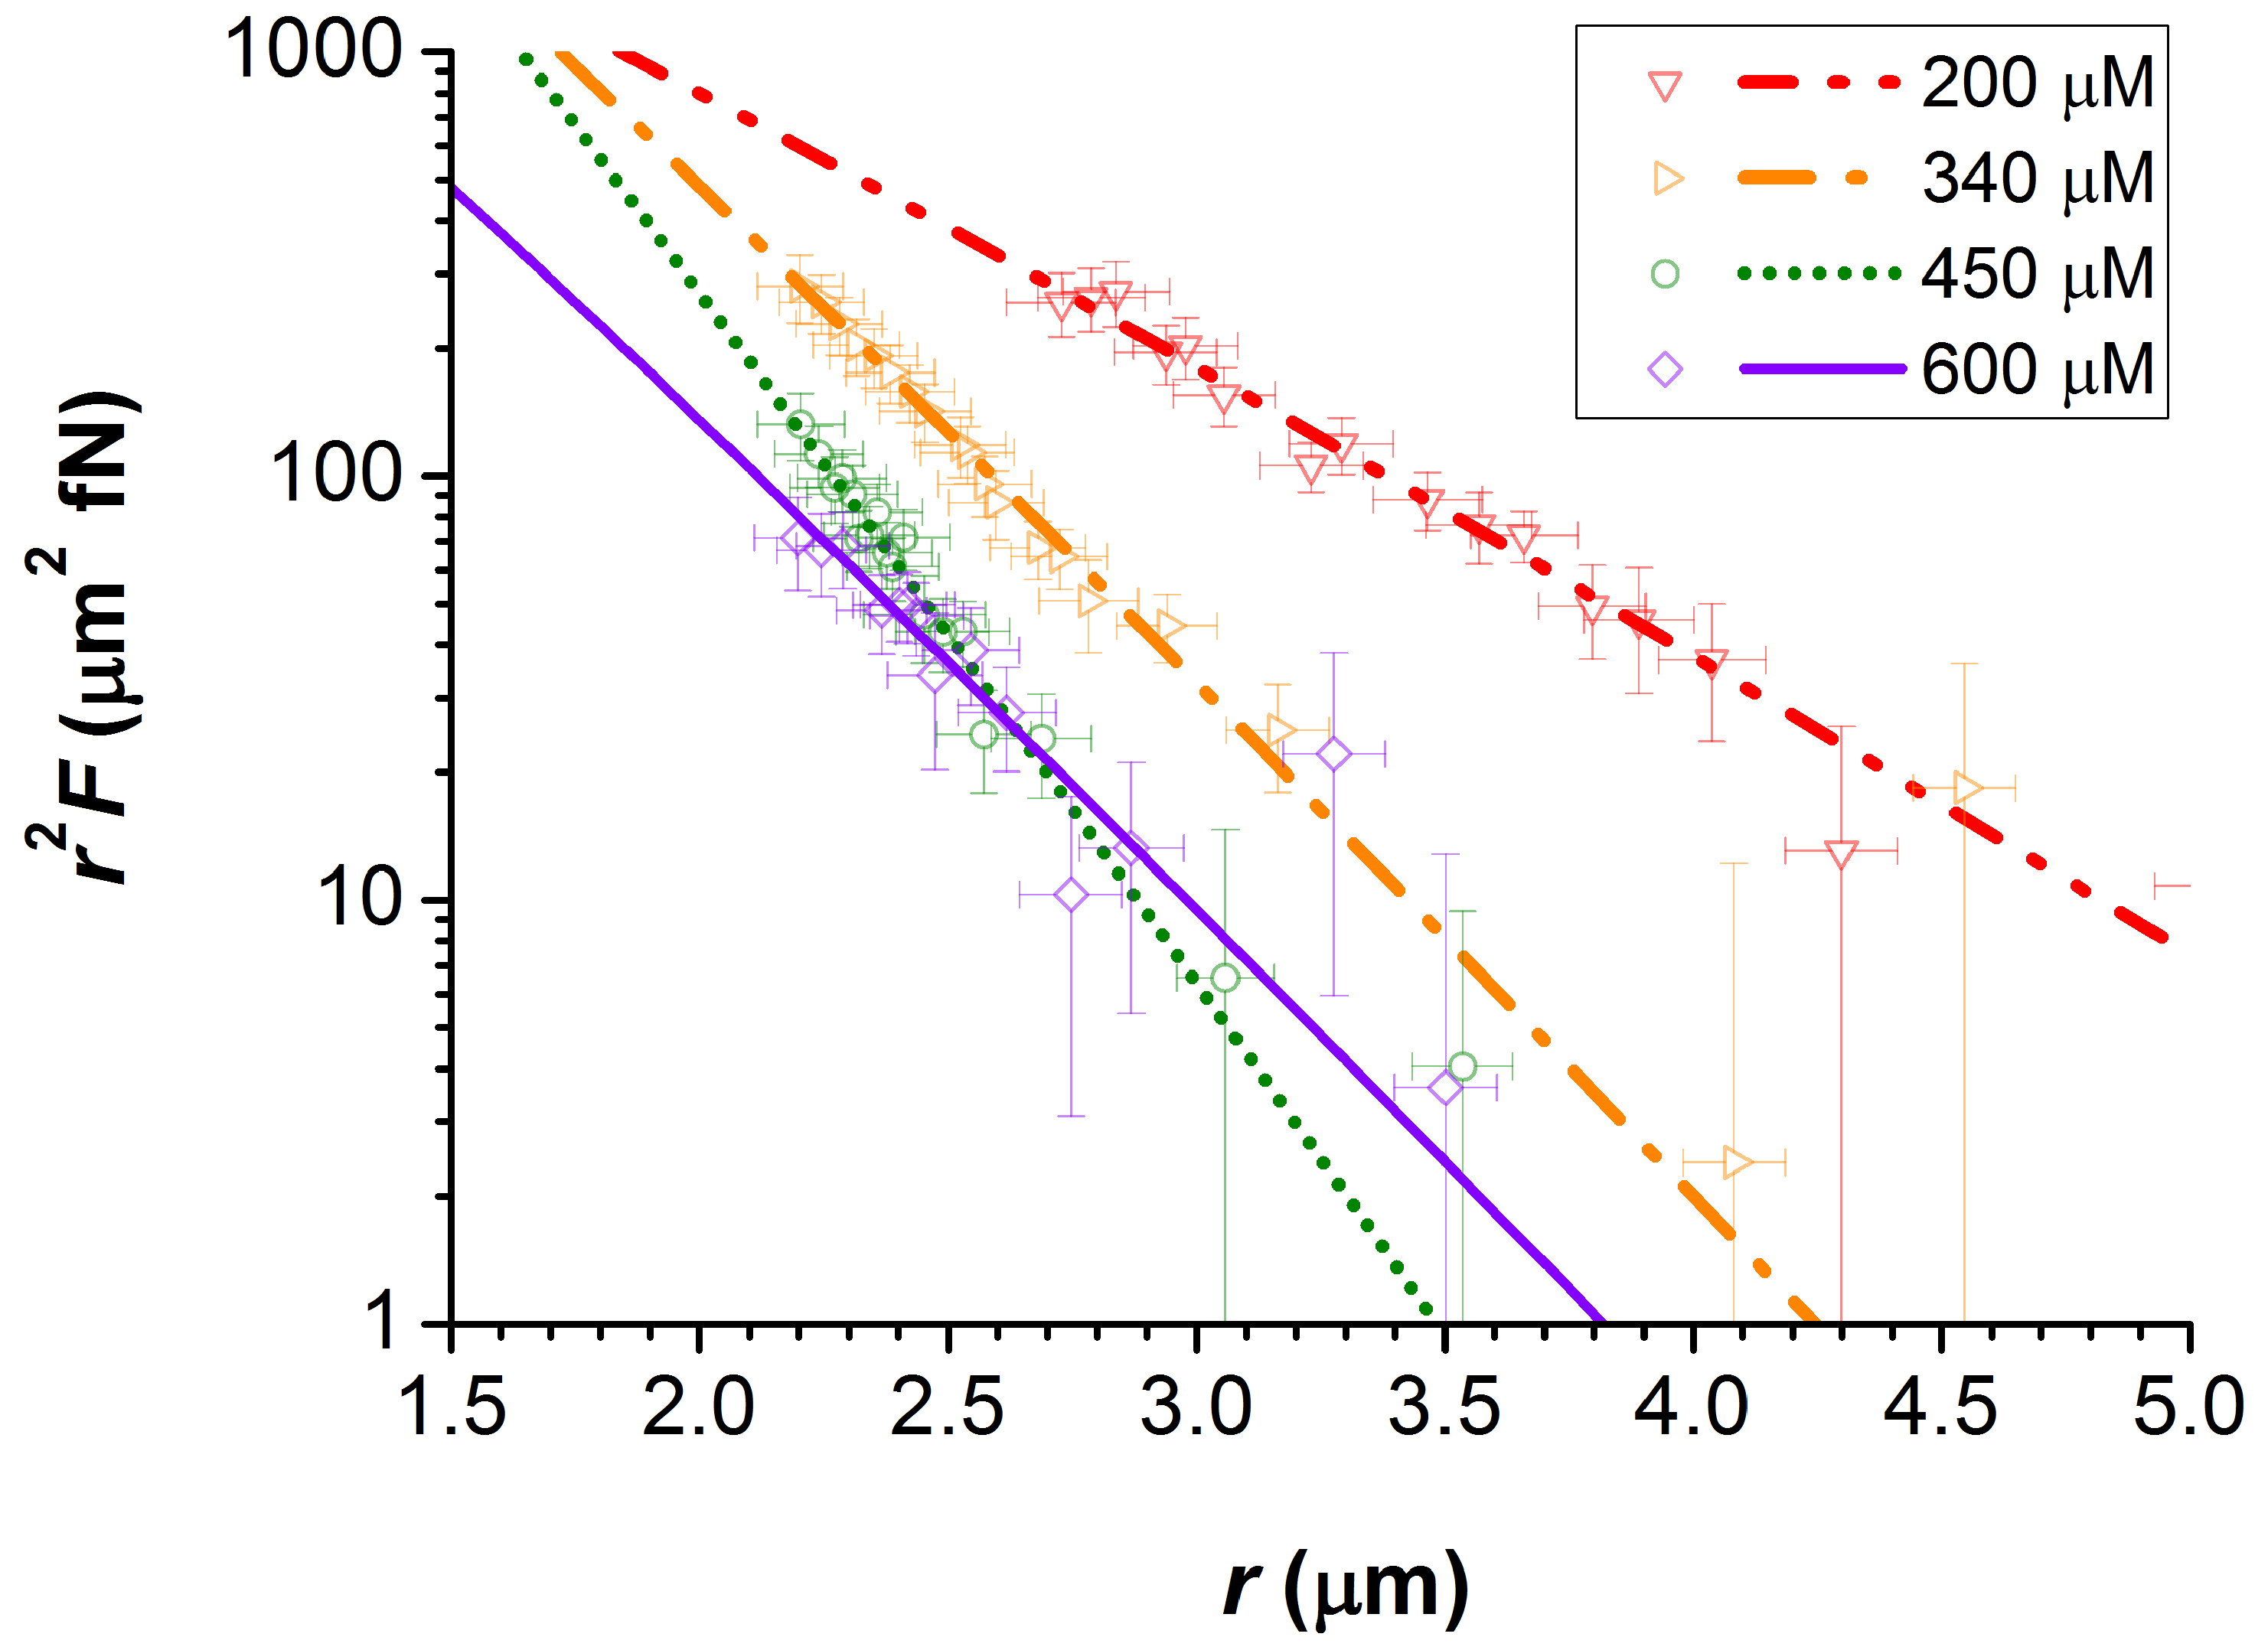
. The resulting force profile is fitted to a Yukawa expression to retrieve the effective particle charge
Z and the screening length
:
where the factor
is a charge correction that accounts for the exclusion of the ionic atmosphere from the core of the particle, and
nm in dodecane at room temperature. Four examples of such force profiles are plotted in
Figure 1 for
200, 340, 450, and 600
M. The fitted lines to this data are that of Equation (
2), from which the values of the screening length
and the particle charge
Z were obtained. These force profiles are plotted on a semi-log scale as
against
r. This is to emphasise the changing value of
with the addition of electrolyte, which is effectively the negative of the gradient of these plots.
The conductivity of each sample was measured using a Scientifica (Model 627) conductivity meter, operating at 18 Hz. The number density
of monovalent ions in a sample was calculated directly from the measured conductivity of the sample
S and the pure solvent
via
where the molar conductivity of the ions is
for a solvent of viscosity
. Here
is Avogadro’s constant and
e is the elementary charge. The corresponding Debye-Hückel length was then determined from
. For TDAT, the cationic and anionic radii,
and
, were taken as 5.85 and 4.40 Å, respectively [
17].
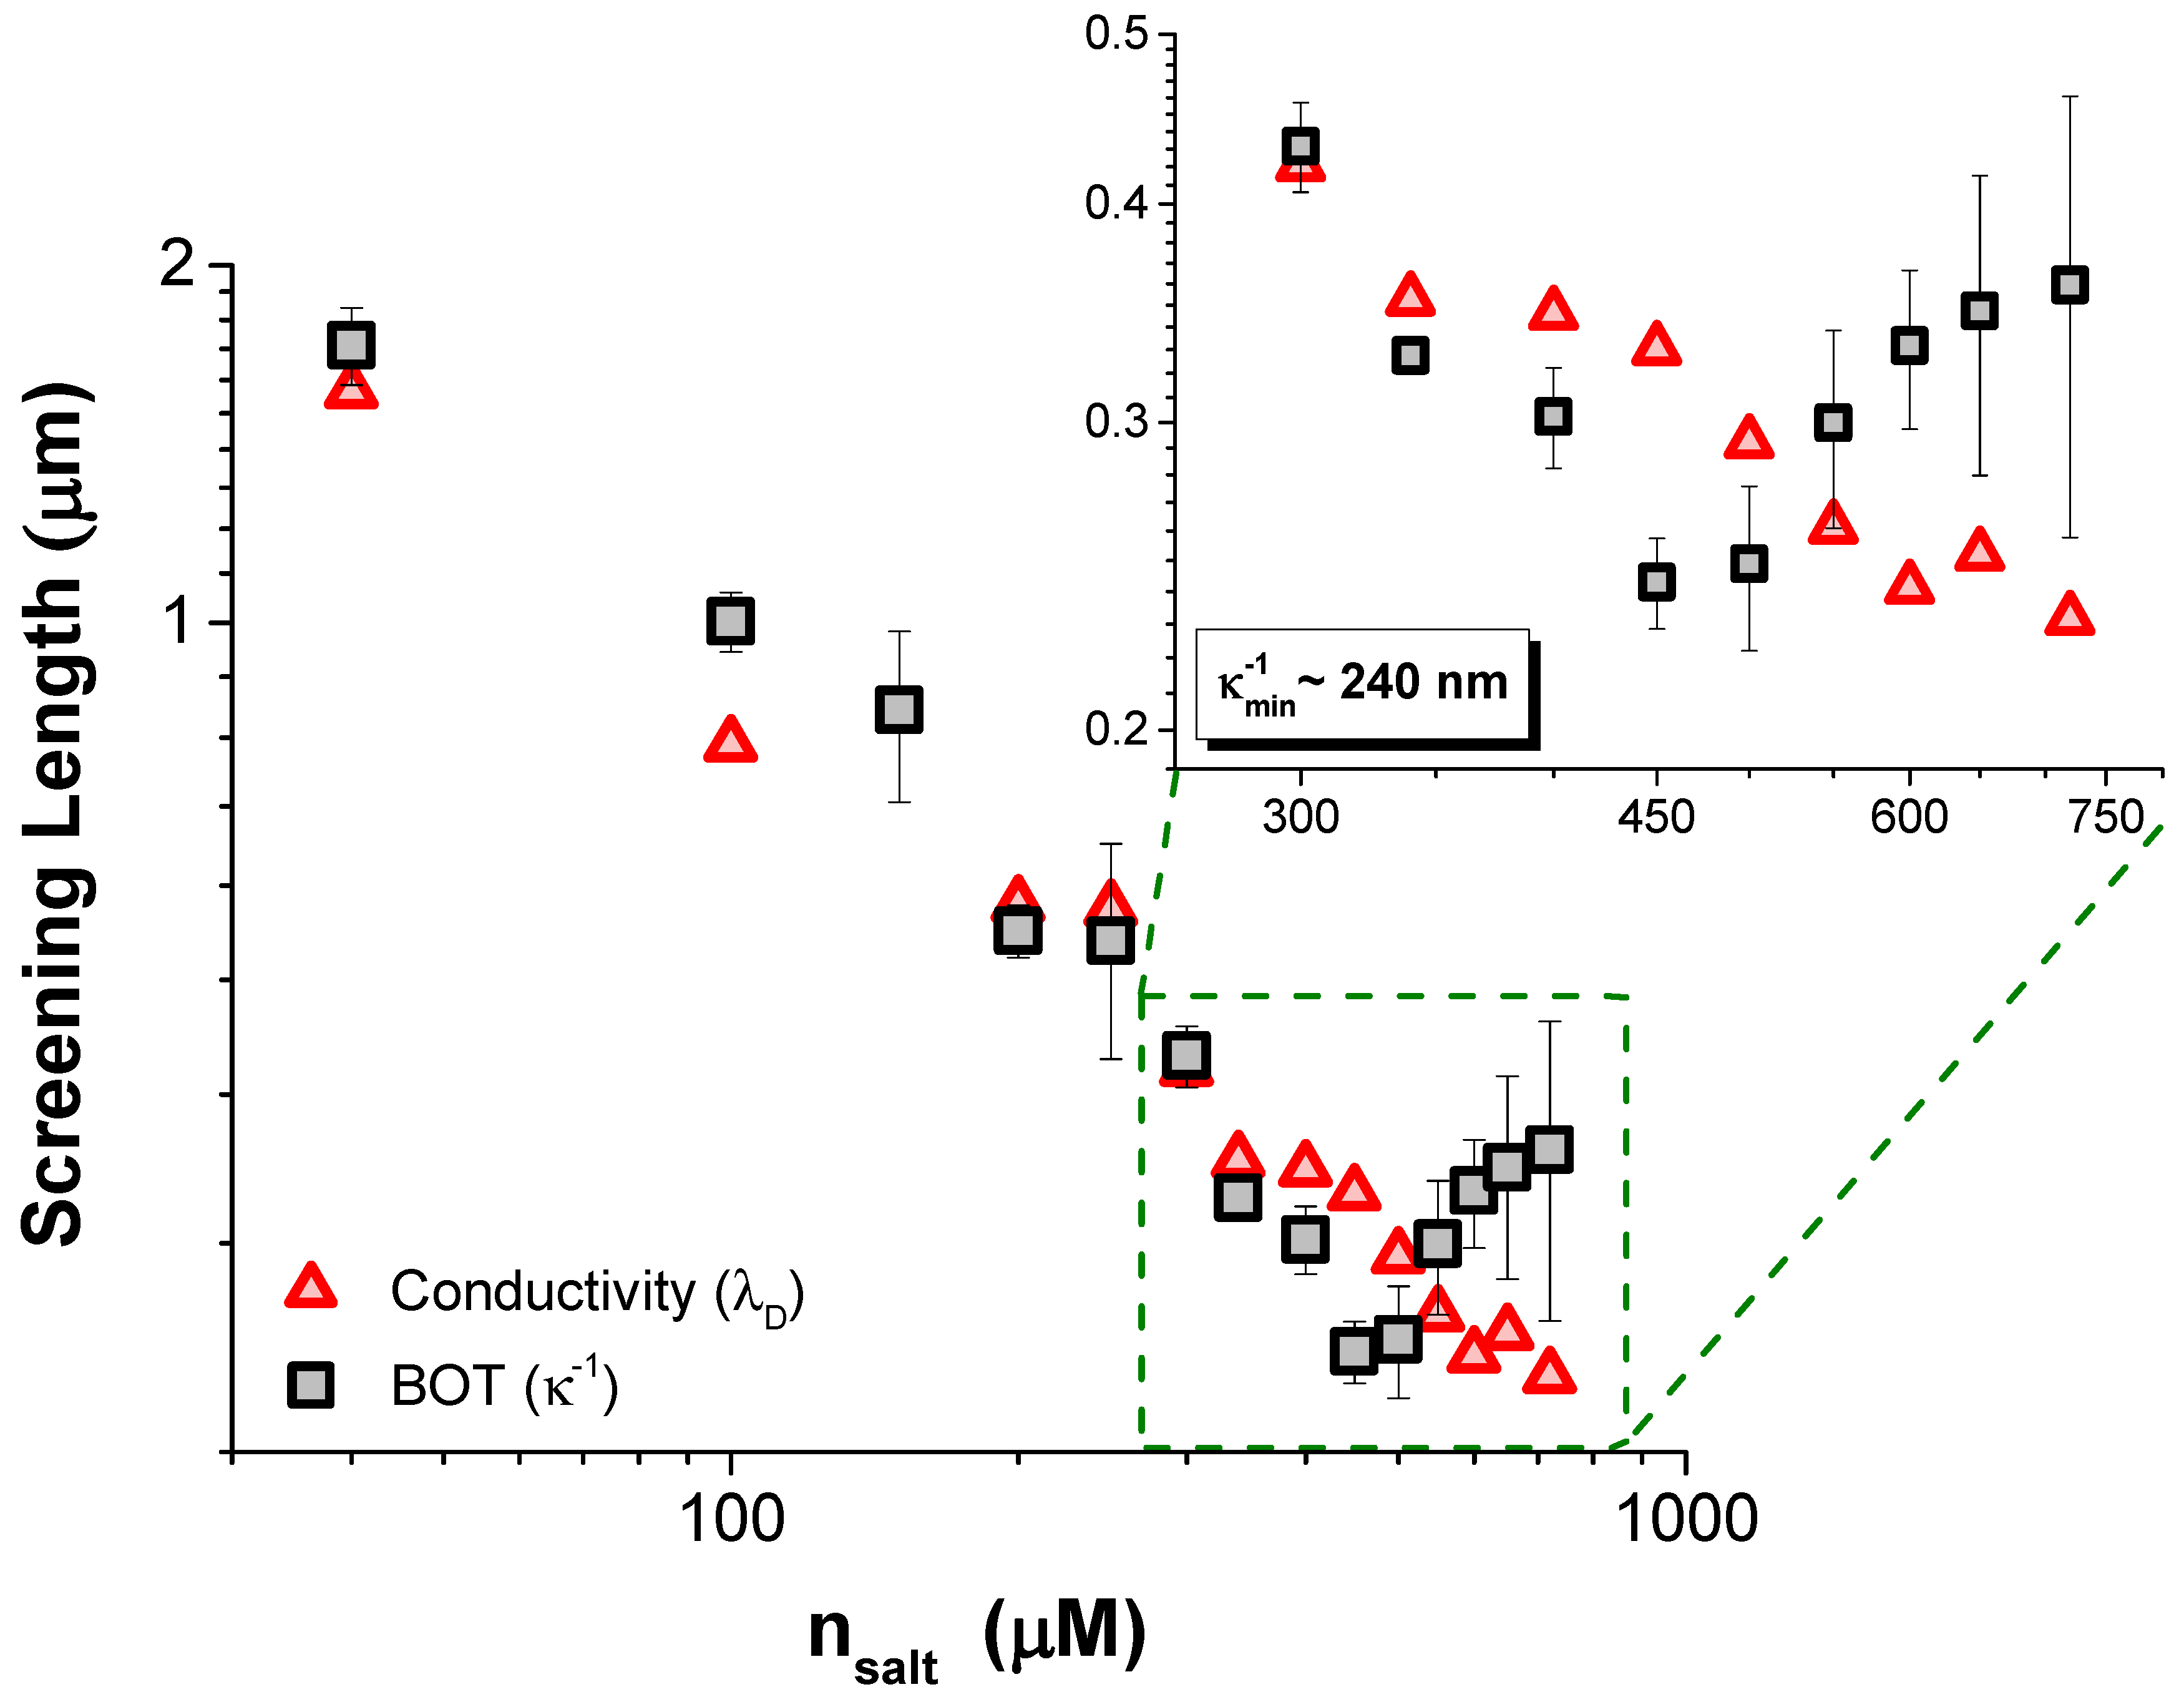
Finally, we emphasise the origins of the different lengths discussed here: is the Debye length, determined from the conductivity and Debye-Hückel theory, whereas we use for the screening length found from a least-squares fit to the BOT force profiles of two interacting particles.
3. Results and Discussion
Force profiles, analogous to those presented in
Figure 1, were measured for several TDAT concentrations
1 mM, which is well below the solubility limit for the electrolyte. From fitting these profiles to Equation (
2), the values of the screening length
and the scaled particle charge
were obtained. Plotted in
Figure 2 are the values of
and
, measured with conductivity, as a function of
. Inset into this plot is an enlargement of the data at the highest
, where we found discrepancy between the values of
and
, suggesting that the interactions at high
are no longer well described by the DH theory.
The steady decrease in
with
seen in
Figure 2 is evidence that adding more electrolyte always increases the number of ions in solution; hence,
reduces monotonically with
. Despite this, we found that the screening length
fitted to the force profiles showed a non-monotonic dependence on
,
increasing with the further addition of salt at high concentrations. The screening length
was fitted over the same range of scaled separations for each TDAT concentration,
, so the origin of this unusual screening cannot be due to decreasing the surface separation to below
at higher
. Despite the apparent similarity of our findings to those reported for concentrated electrolytes by Perkin et al. [
11,
12], the minimum in the screening length in our data is about two orders of magnitude larger than ion sizes, at
nm. Indeed, it is difficult to envisage that their findings could be relevant to our results since we remain within the regime where
is much larger than the molecular size. Our system lies within a dilute weak electrolyte framework (
), meaning that the effects of strong ion correlations [
3] and effects of asymmetric electrolytes [
22,
23] are all negligible. Other considerations beyond the behavior of just the ions are therefore required to explain why the interaction between these particles is not well described with DH theory, where
should always equal
.
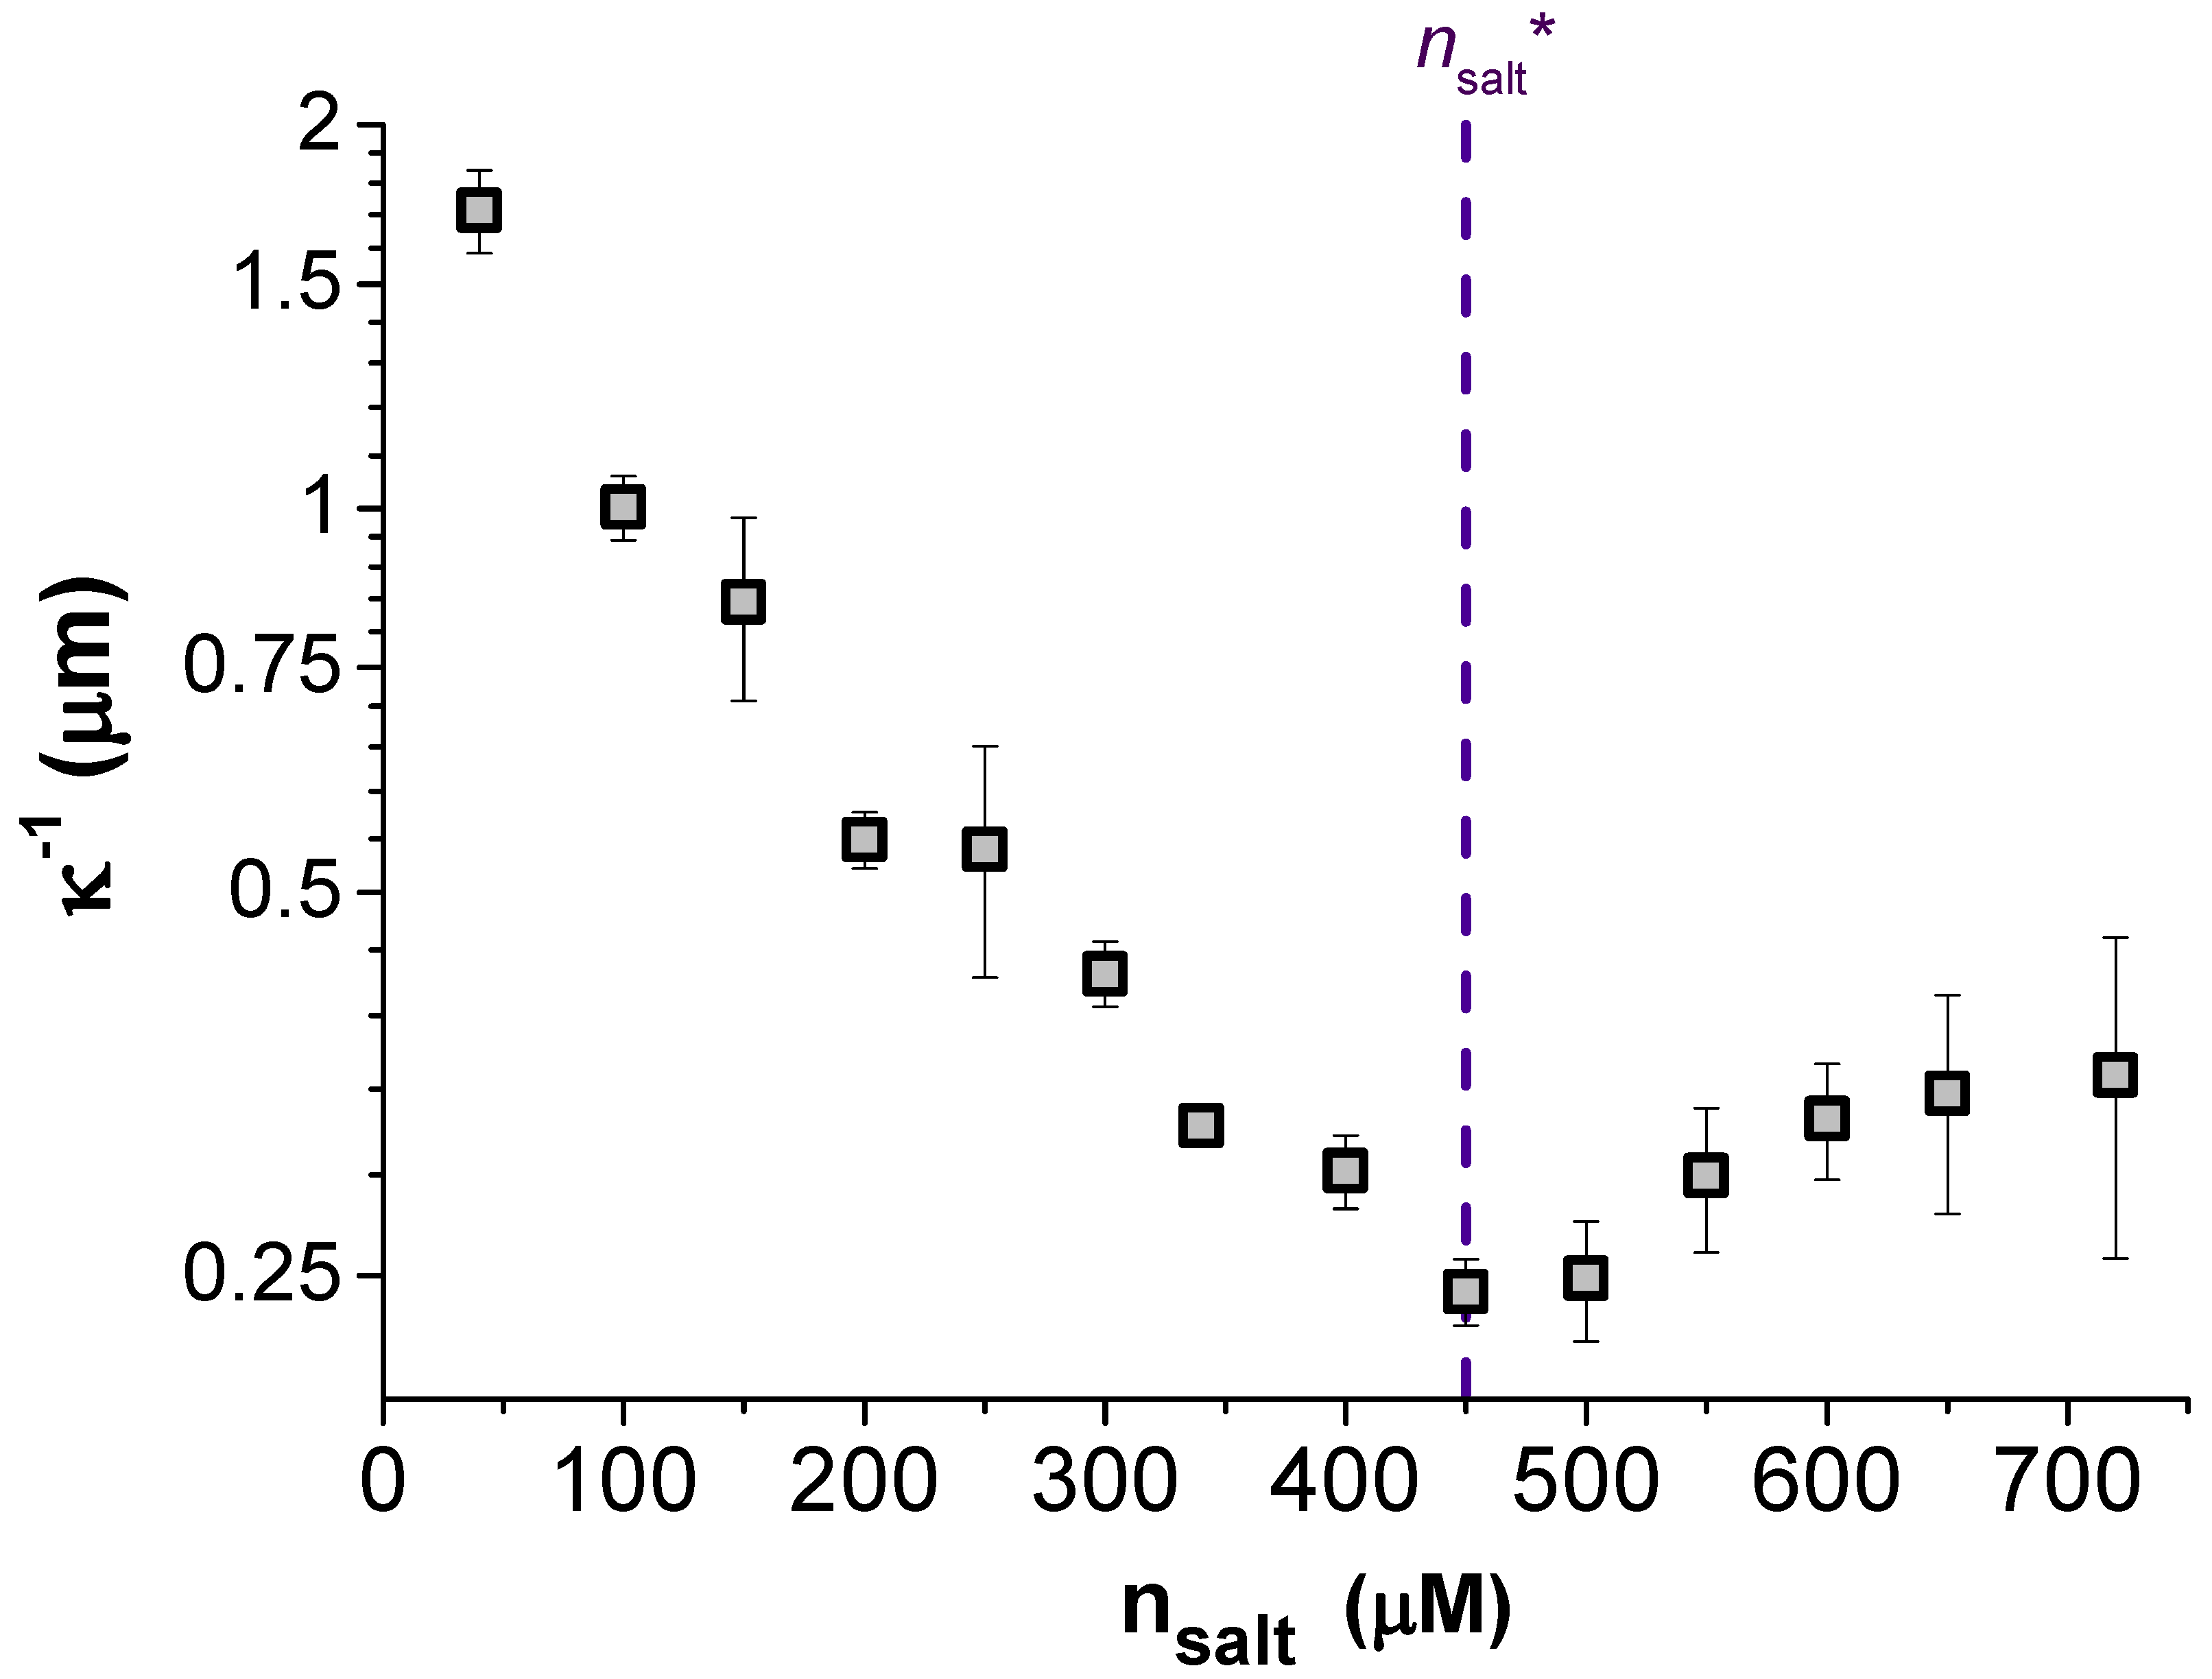
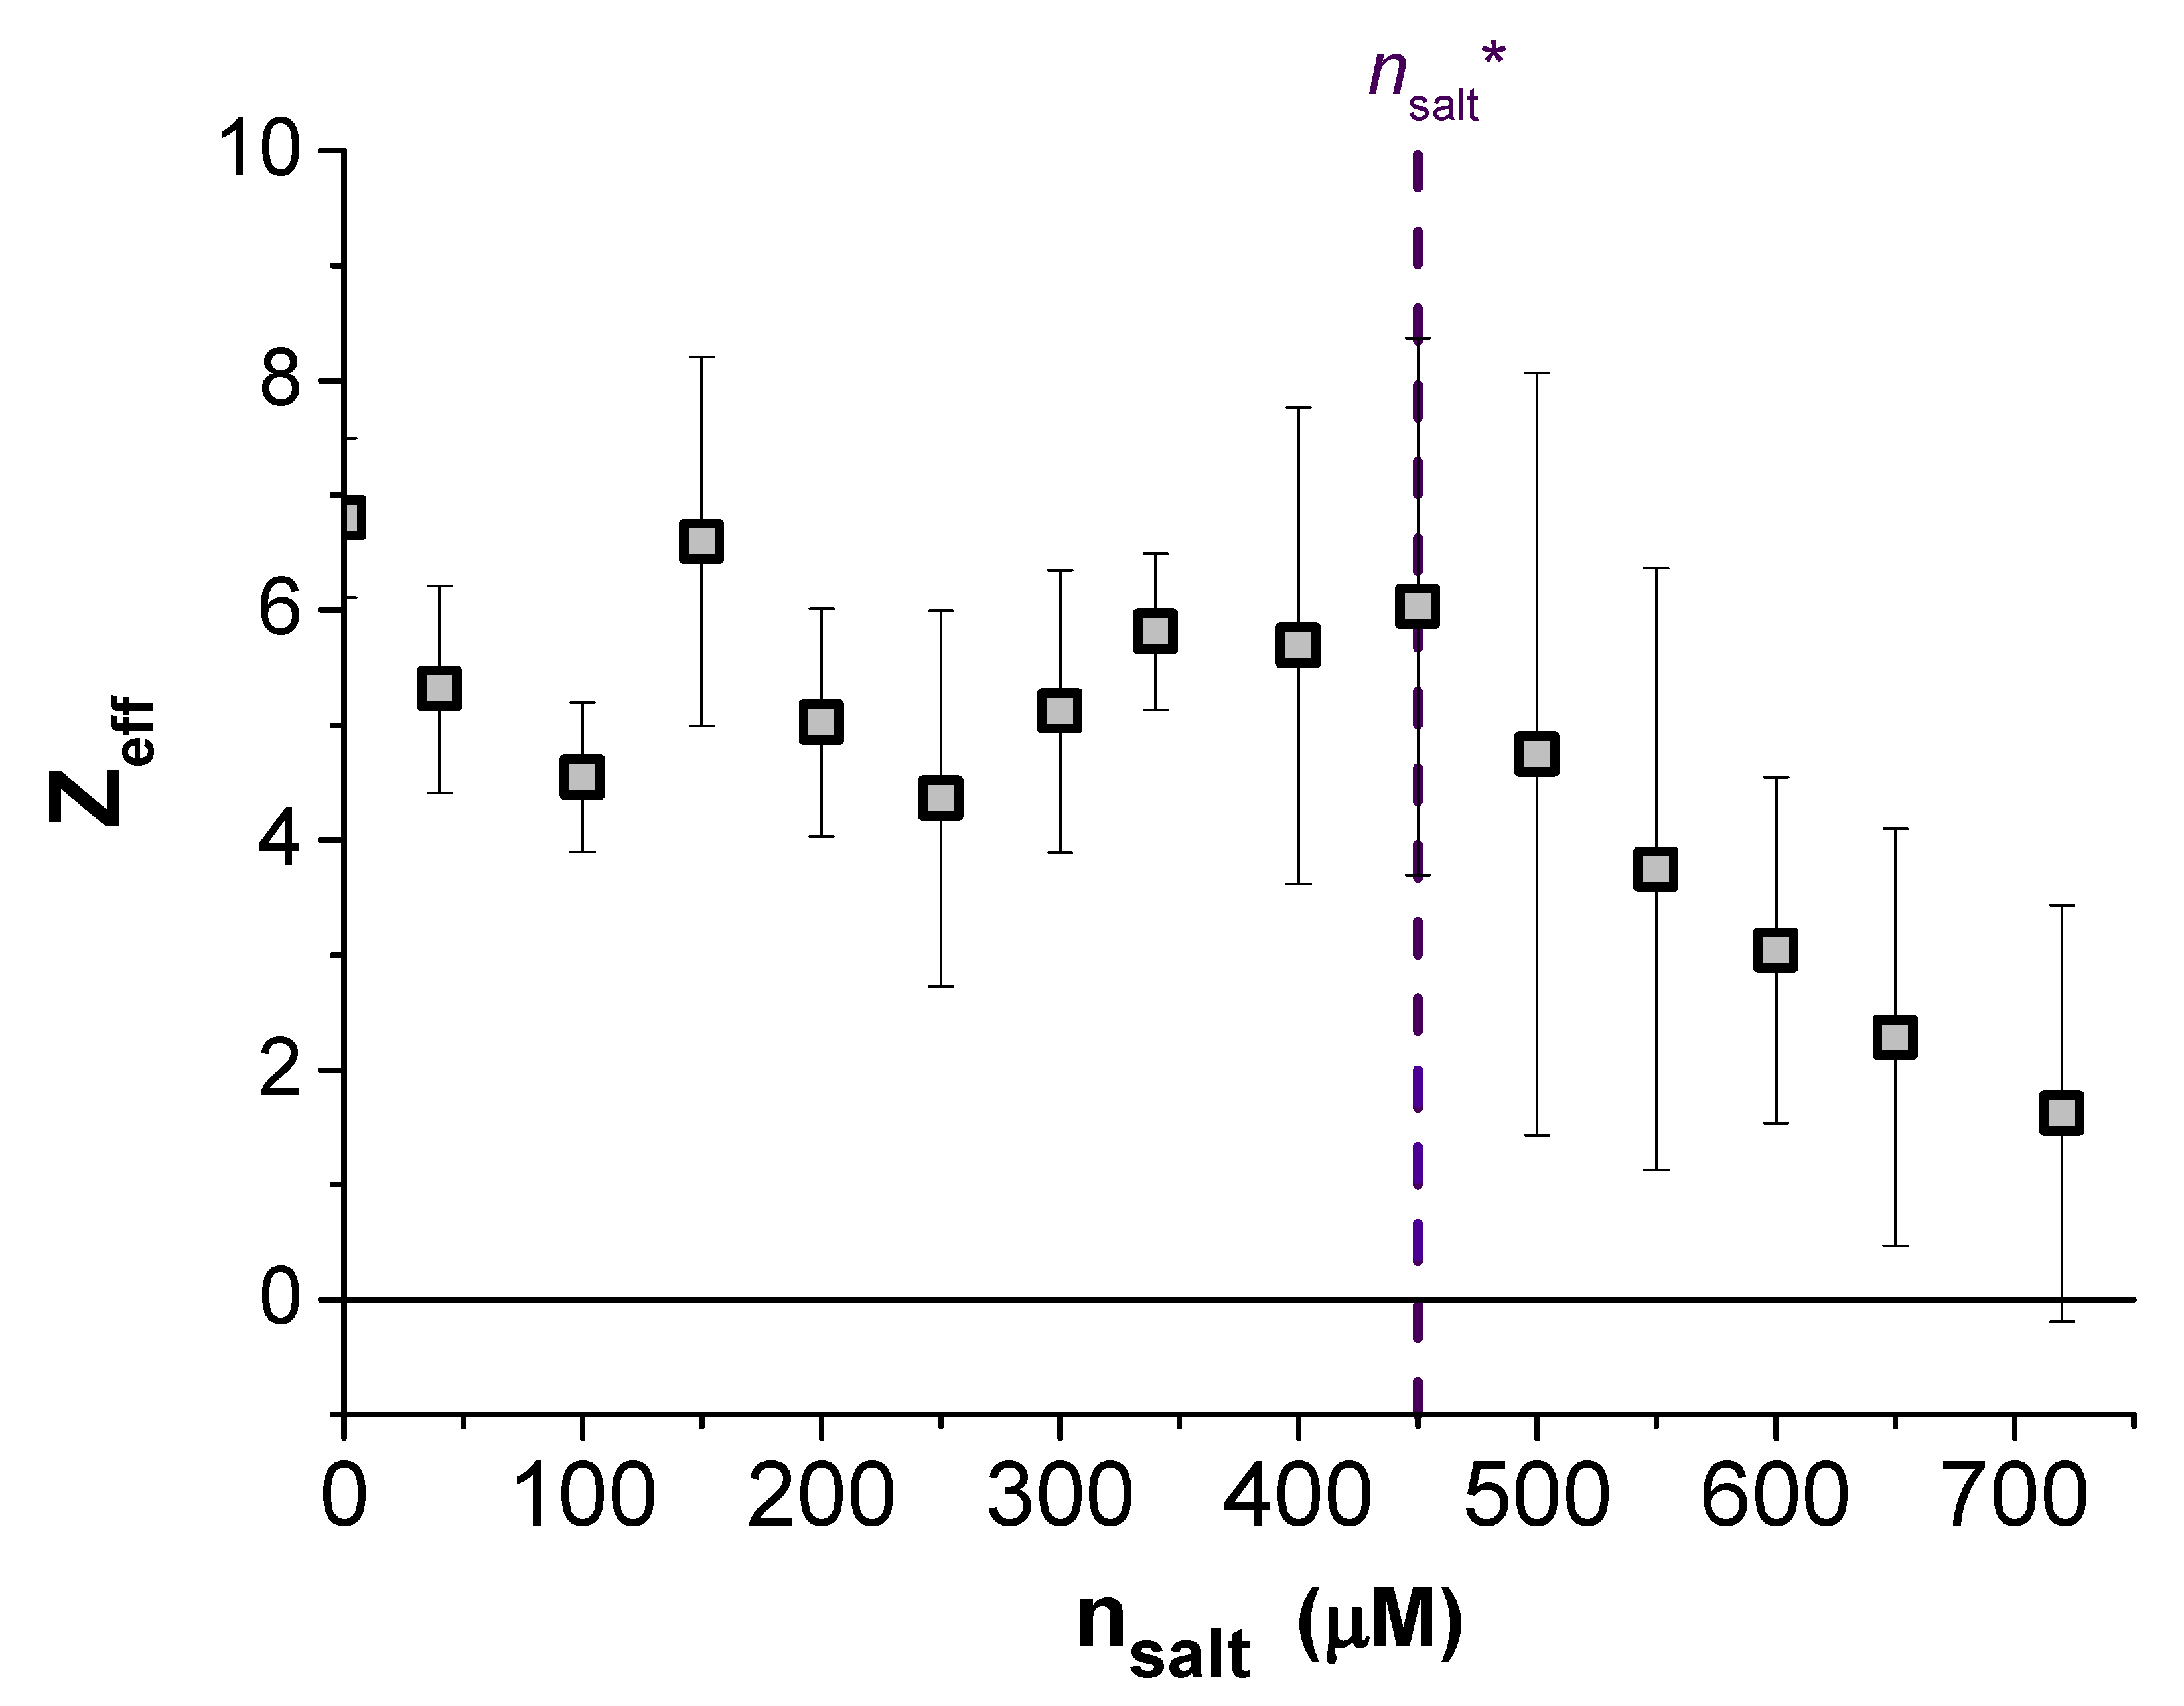
An indication of the origin of the non-monotonic screening length evident in our data is the trend in the strength of the pair interactions, i.e., the dependence of the fitted particle charge
Z on
. This data is given in the lower portion of
Figure 3 as the effective particle charge
. Replotted alongside this in the top of
Figure 3 is the measured screening length
over the same range of
, where a critical TDAT concentration has been marked as
at the point of the minimum in
on both plots. What is obvious from these two plots is that below
, the expected behaviour was observed with a (nearly) constant particle charge and
. However, above
neither of these observations remains true. The fitted charge of the particles decreases almost linearly with
towards neutral suggesting that the surface of the particles can no longer be assumed to be at a constant charge but is adapting to its environment.
Figure 3 highlights the sensitivity of the charge state of the surface to the number of ions in the surrounding solution. Increasing
above
leads to a discharge of the surface as the ions are increasingly confined in solution, and the entropic gain to the system of a solvated counterion is no longer sufficient to dissociate it from the surface. A critical ion density is likely to exist in all ionic systems, but for nonpolar systems the effects of charge regulation will be considerable, even at rather low electrolyte concentrations. As a result of the surface equilibrium between free and bound ions, the surfaces are expected to discharge as the particles are pushed closer together, i.e.,
Z becomes a function of
r [
24]. Indeed, similar variations of particle charge with separation to those reported in
Figure 3 have been found in aqueous systems (although at higher salt concentrations) using a colloidal probe-atomic force microscope to measure particle interactions [
25]. In the current nonpolar system, the effect of particle separation on the surface charge has been reported previously [
26], but the simultaneous measurement of non-Debye-Hückel screening between these particles has not been observed until now.
The origin of the unexpected increase in the screening length
with added salt, evident in
Figure 3, is puzzling. One clue is that the increase in
appears to be correlated with the point where regulation effects first leads to a fall in the particle charge. This suggests that non-Debye-Hückel screening seen in experiments may be a result of the charge state of the particles adapting to the increased electrostatic interactions between particles, as they are pushed closer together. With the force becoming weaker at closer separations due to a decrease in
Z, the force profile simultaneously presents a slower decay (larger
) and a decreased intercept (smaller
Z). By increasing
further, the distance dependence of
Z becomes stronger, resulting in the non-monotonic trend of
with
evident in
Figure 3. While the effect of surface equilibria on the decay length has been discussed before in the context of hydration forces [
27], the arguments have not been generalized to electrostatic forces. We expect similar behavior should be displayed by many systems of low charge and strong charge regulation at close separations. This may have particular significance for protein systems where charge regulation is possible due to the association and dissociation of amino acid groups [
28].


