1. Introduction
Many studies have paid attention to the adsorption behaviour of various surface-active substances at liquid/liquid interfaces from the viewpoints of basic sciences as well as practical applications. This problem was considered in various books, such as [
1,
2,
3,
4]; also, a number of studies were published in which both adsorption (equilibrium and kinetic) and rheological characteristics at the surfactant aqueous solution/alkane (oil) interface are analysed [
5,
6,
7,
8,
9,
10,
11,
12,
13,
14,
15,
16,
17,
18,
19,
20].
One of the most important problems arising during the analysis of experimental results obtained for a liquid/liquid interface is the determination of the coefficient of surfactant distribution between the adjacent phases. Several methods were proposed earlier to solve this problem. In particular, the method used in [
9,
10,
11] to determine the distribution coefficient for various surfactants between water and hexane was as follows. First, the surface tension isotherm at the interface between the aqueous solution of the surfactant and air was measured. Then, certain volumes of the aqueous solution and pure hexane were brought into contact for sufficiently long times, and the surface tension of the aqueous solution at its interface with air was then measured. Finally, from the analysis of the obtained adsorption isotherm, the hexane distribution coefficient was calculated based on the surfactant mass balance. Using this method, it was determined in [
9,
10,
11] that the solubility of the nonionic surfactant tridecyl dimethyl phosphine oxide (C
13DMPO) in hexane is 34 times higher than in water. Besides methods based on interfacial tension methods, there are also chemical procedures in which the aqueous solution is brought into contact with the oil phased, and after reaching the distribution equilibrium, the amount of surfactant is determined by a suitable analytical method. Such protocols are specific for each surfactant and not further discussed here (see for example the discussions in [
7,
9,
11] and the references therein).
This method described in [
9,
10,
11], however, suffers from certain deficiencies. In particular, the influence of hexane which remains dissolved in water after its prolonged contact with hexane on the surface tension of the aqueous solution of the surfactant remains unaccounted for. Also, the pendent drop shape method, used to measure the surface tension of the surfactant solution, could yield an incorrect value of the surfactant concentration within the drop if the depletion of the solution caused by the adsorption of the surfactant at the drop surface is not considered correctly [
15].
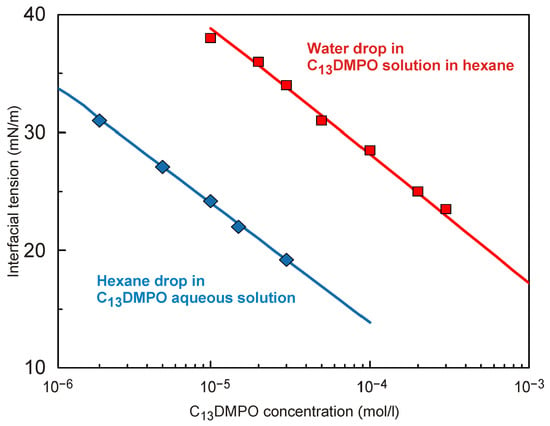
In this study, the interfacial tension isotherms at the hexane/water interface were measured for hexane drops formed in the C13DMPO aqueous solution and for water drops formed in C13DMPO solutions in hexane using the drop profile analysis method. From these isotherms, the interfacial distribution coefficient could be easily and precisely determined as the ratio of concentrations at the same interfacial tension. Note, the volumes of the C13DMPO aqueous solution and the C13DMPO solution in hexane are about 1000 times larger than the volume of the used drops. Thus, any variation of concentration caused by the adsorption of C13DMPO onto the drop surface and the diffusion of C13DMPO into the drop could be neglected.
3. Theory
The attempts to calculate the temporal dependence of surface tension at the interface between two phases were undertaken previously; the first practical calculations of adsorption dynamics on a drop or bubble surface based on Fick’s equations were performed in 1997 [
10]. The approach used in this study was presented in [
22]. The diffusion of the surfactant in the system of two concentric phases which exhibit spherical symmetry (phase 1 of radius R
1 and phase 2 of radius R
2) is governed by Fick’s law, which in spherical coordinates reads as
where c = c(r,t) is the surfactant concentration at time t and distance r from the centre of the cell, and D
i (i = 1 and 2) are the diffusion coefficients of the surfactant in the ith phase. The adsorbed amount Γ is involved in the model via the boundary condition at the drop surface:
The boundary conditions at r = 0 and at r = R
2 follow from the symmetry of the system and the fact that the system is closed:
The initial conditions for the set of Equations (1) and (2) are
In the present experiments the surfactant was initially dissolved only in the external liquid phase. Therefore, in Equation (6), the concentration c10 should be set to zero.
Close to the interface an equilibrium distribution of the surfactant exists which relates the two boundary concentrations via the distribution coefficient K
p. Hence, the distribution coefficient K
p corresponds to the ratio of subsurface concentrations of the surfactant in hexane to that in water:
Note, however, that the equilibrium distribution of the surfactant close to the interface can be assumed for any time moment t > 0 but not for the initial time moment t = 0, as it would contradict the initial conditions, Equation (6). A detailed discussion of the numerical procedure is presented in [
22].
To calculate the surface tension γ, which is usually the experimentally accessible quantity, and the adsorption Γ, which enters the boundary condition at the interface, Equation (3), an appropriate equation of state and adsorption isotherm, should be used. The theoretical models used to describe the equilibrium surface tension and adsorption of nonionic surfactants were described in [
15,
22,
23]. The model which is commonly used is the Frumkin model, in which the equations of state and adsorption isotherm take the form
where R is the gas law constant, T is the temperature,
is the surface pressure (
= γ
0 − γ), and γ and γ
0 are the surface tensions of the solution and the solvent, respectively; ω
0 is the partial molar area of the surfactant at infinite dilution, a is the intermolecular interaction constant, b is the adsorption equilibrium coefficient, c is the subsurface surfactant concentration, and θ is the surface layer coverage by the surfactant. The model assumes the compressibility of adsorbed molecules in the surface layer, i.e., the dependence of the partial molar area of the surfactant on the monolayer coverage and surface pressure: ω = ω
0 (1 − ε
θ), where ε is the compressibility parameter. The surfactant adsorption Γ is calculated from the relation θ = Γω.
For the processing of the experimental isotherms, the reorientation model was also used. This model assumes that the adsorbed surfactant molecule can have two orientations (states), referred to by subscripts 1 and 2, each characterised by its partial molar area ω
i; for definiteness, ω
2 > ω
1. Compressibility is assumed for the state with the lower molar area ω
1: ω
1 = ω
10(1 − ε
θ), where ω
10 is the maximum molar area in state 1, corresponding to zero adsorption. The resulting equation of state reads as
where ω = (ω
1Γ
1 + ω
2Γ
2)/Γ is the average molar area with θ = ωΓ = ω
1Γ
1 + ω
2Γ
2 being the surface coverage, and Γ = Γ
1 + Γ
2 being the total adsorption. The adsorption isotherms for the adsorbed states 1 and 2 read as
where α is the exponent of a power law which accounts for different surface activities of the molecules in the two adsorption states. As the surfactant is dissolved in a large volume of liquid into which the drop is immersed, the depletion of the surfactant concentration caused by its adsorption on the drop surface is negligible.
4. Results and Discussion
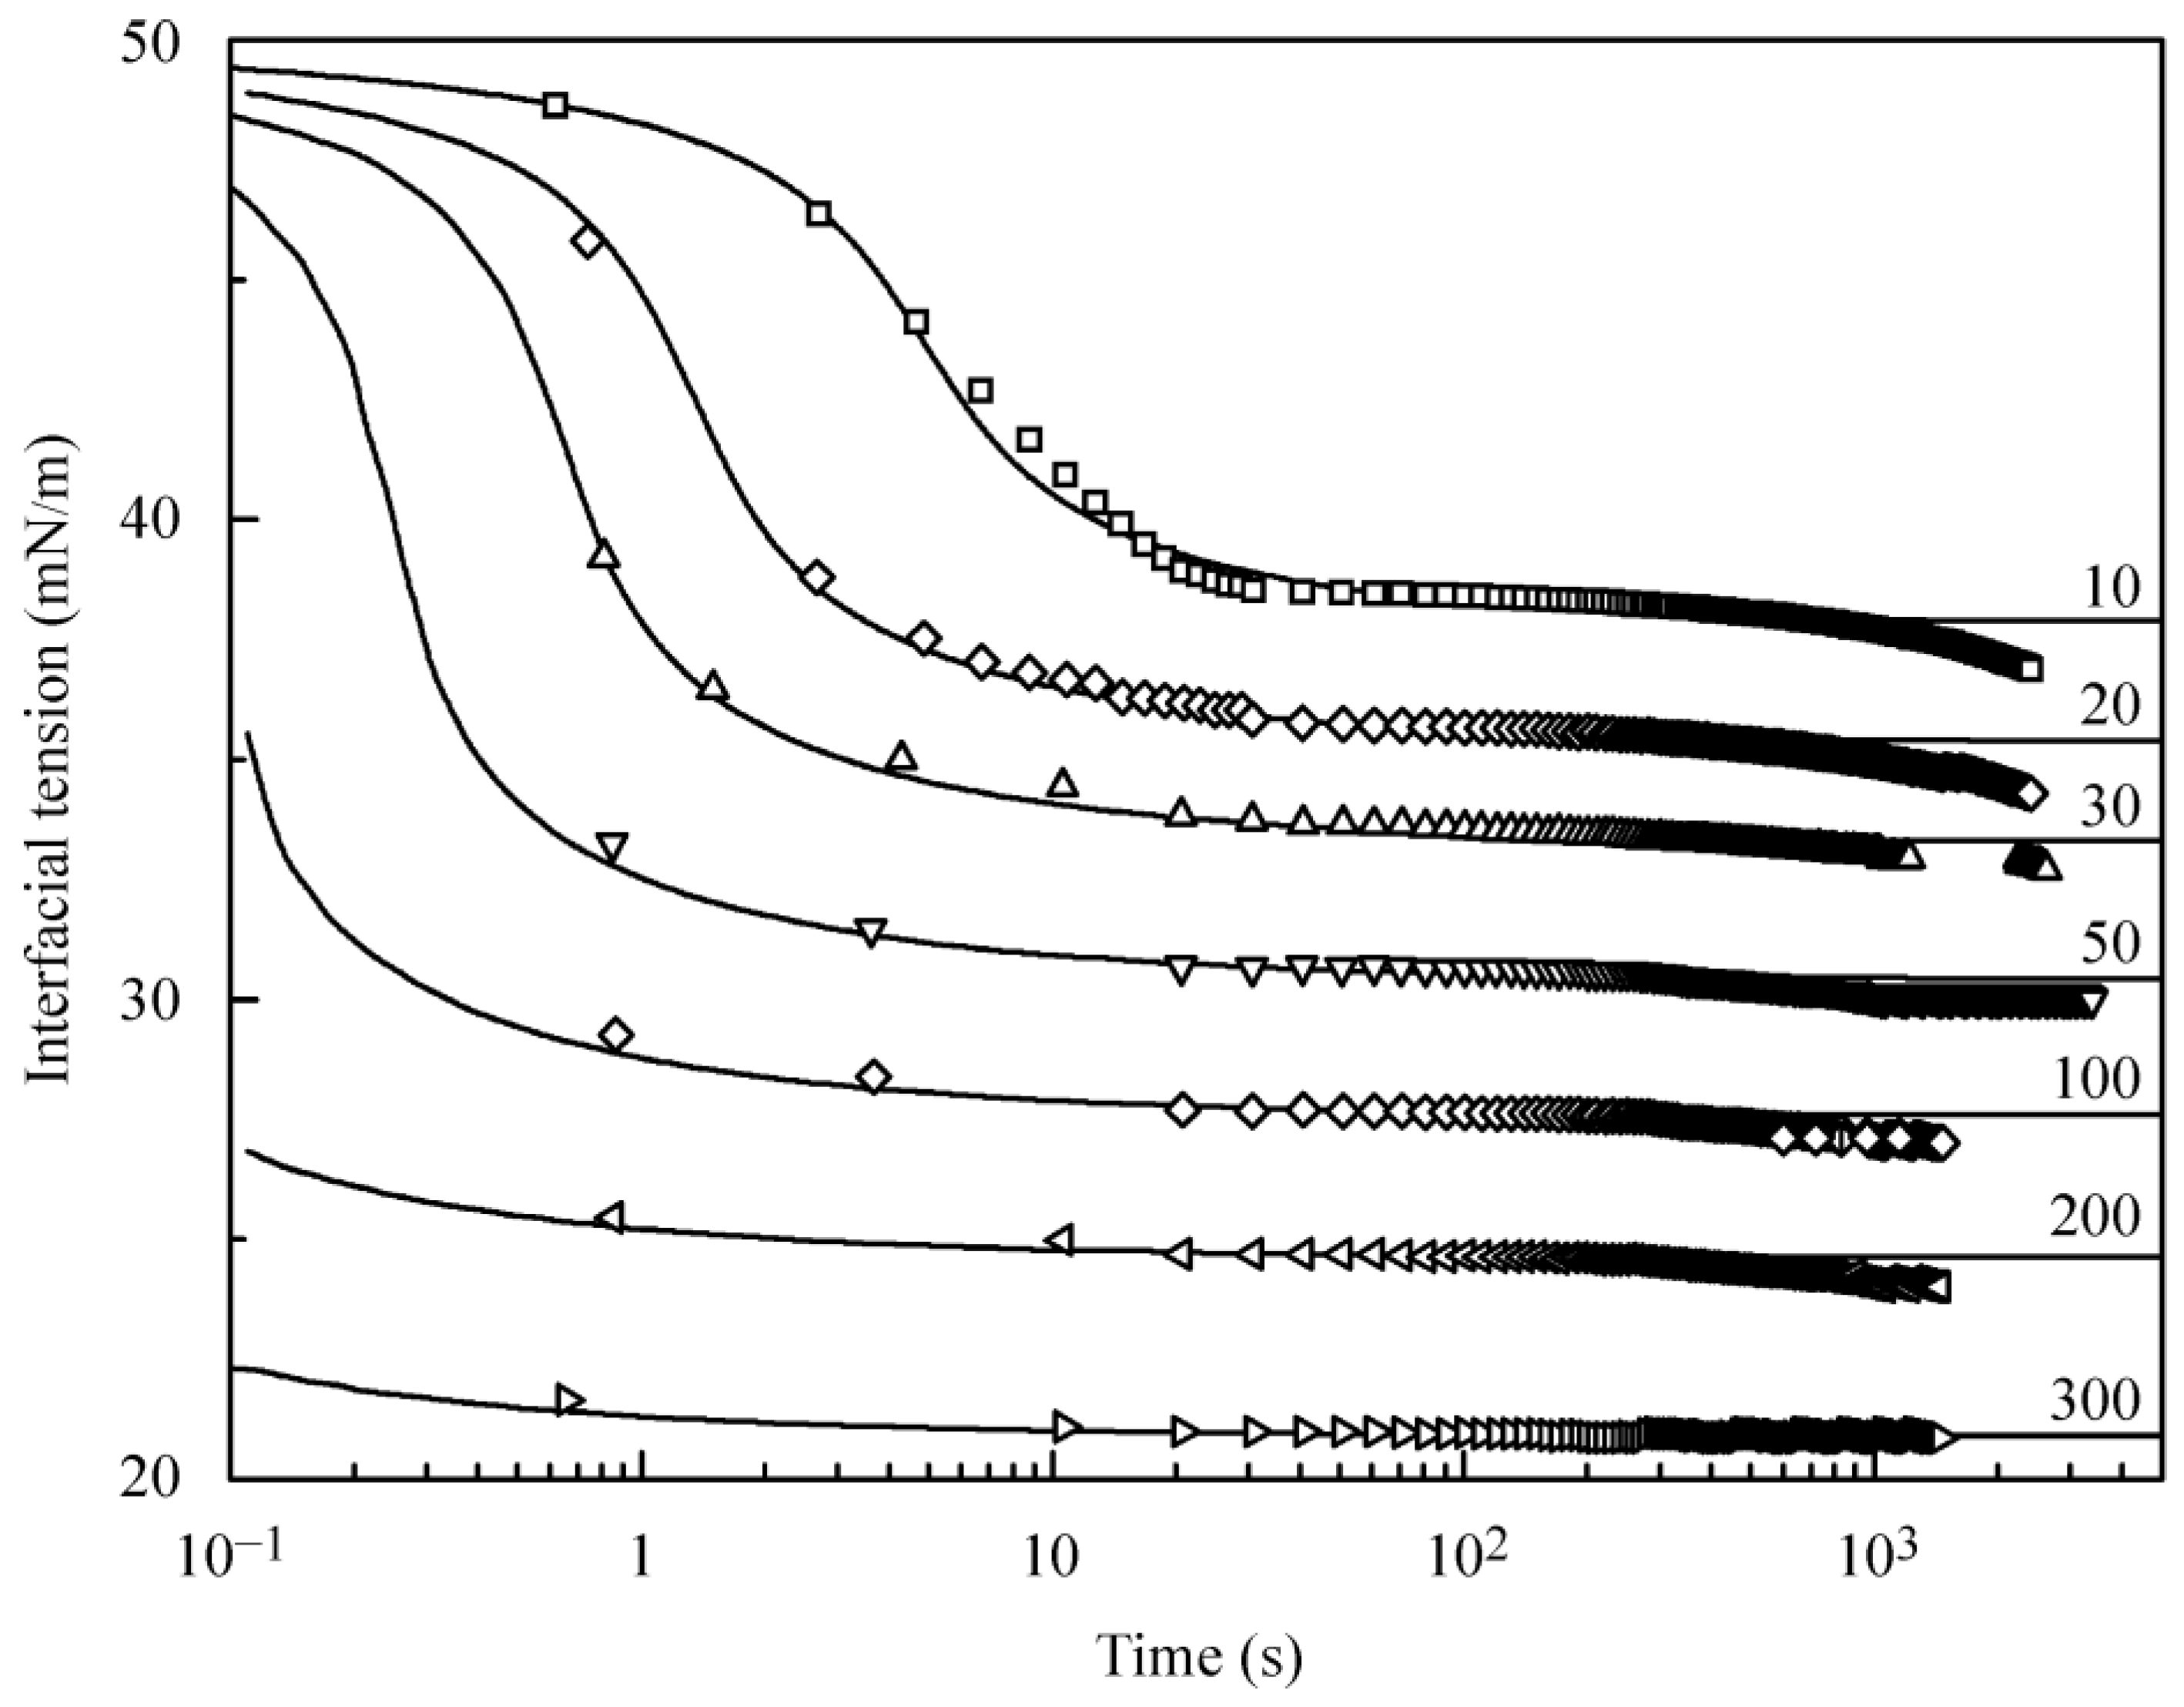
Figure 1 illustrates the dynamic interfacial tension at the interface between water drop and the solution of C
13DMPO in hexane at various concentrations of the surfactant. It is clearly seen that for the solutions with surfactant concentrations of 10 and 20 µmol/L, the dependencies exhibit a plateau at times above 20–30 s, while at times above 500–700 s, some decrease of interfacial tension is observed. For the solutions with higher concentrations, the dependencies turn into a plateau at times below 10 s, while a small decrease of the interfacial tension exists at times beyond 200–300 s and later. This decrease of the surface tension at high times could be obviously attributed to some unknown impurities present in hexane. As the concentration of hexane in the measuring cell is about 8 mol/L, the presence of 1% of impurities would yield a concentration of 0.08 mol/L, which is four orders of magnitude higher than the surfactant concentration for the highest dilution (10 µmol/L) among those shown in
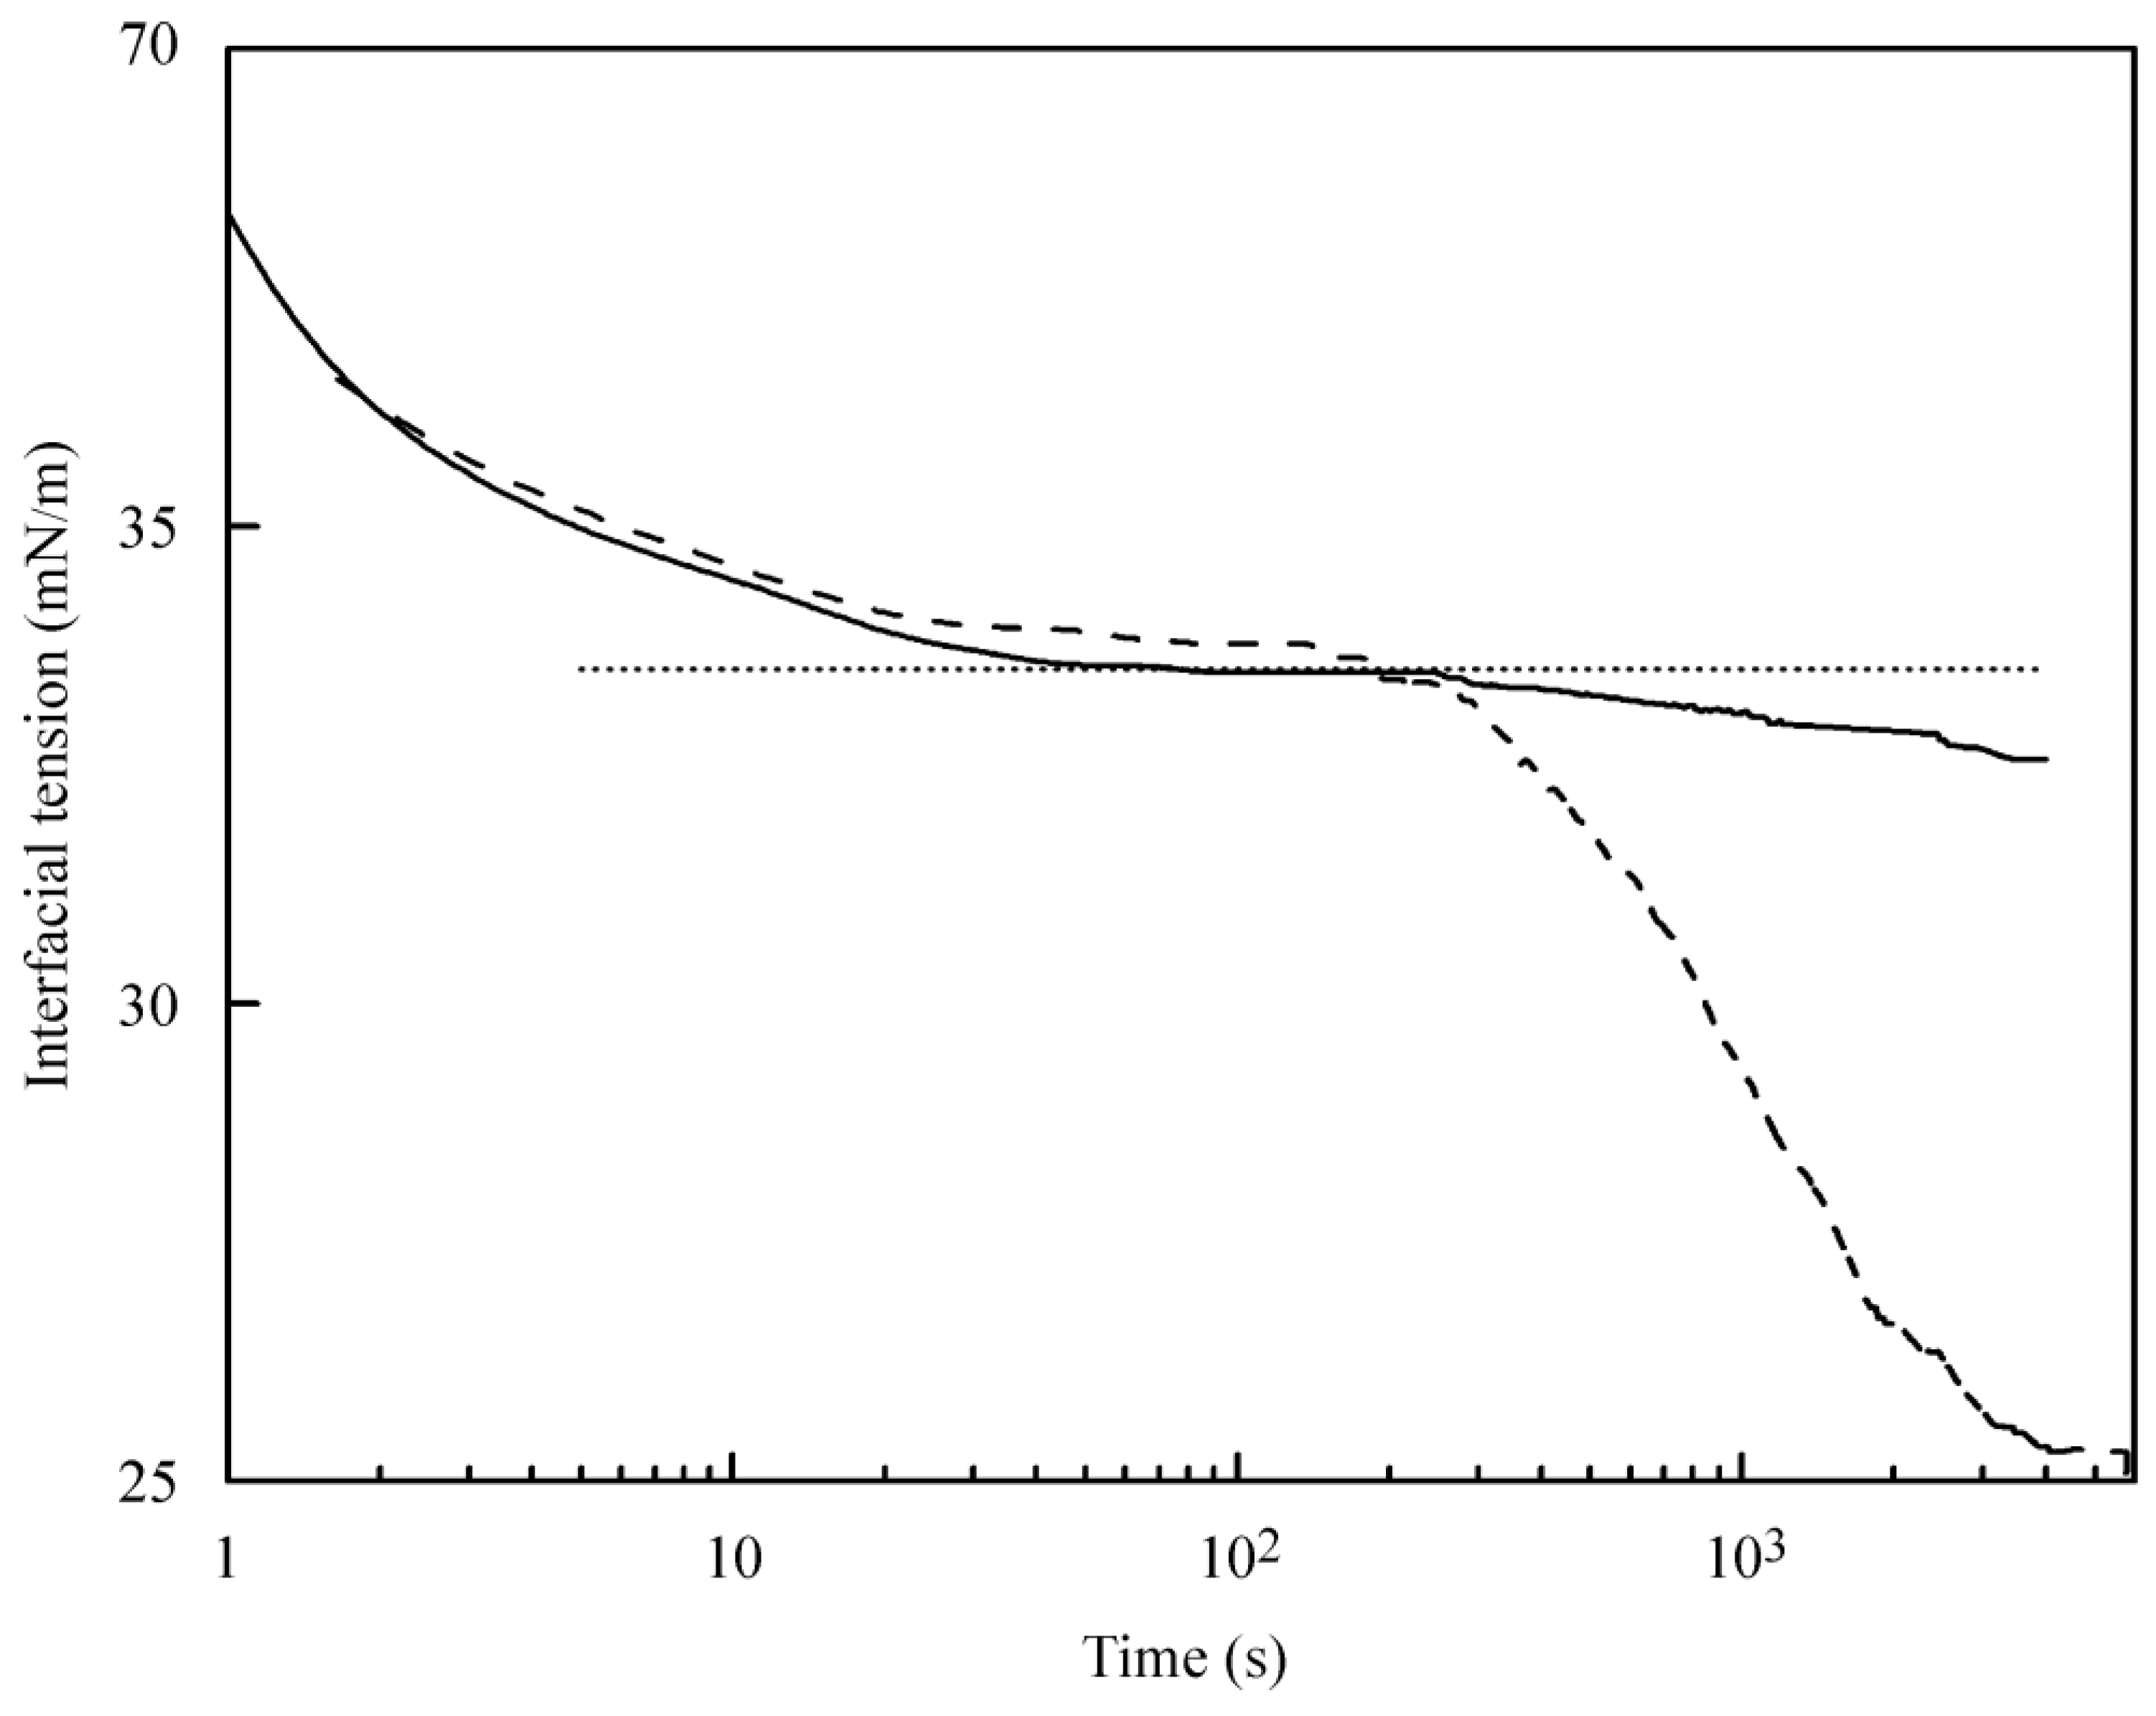
Figure 1. The supposition that the surface tension decrease at high adsorption times is caused by the impurities present in hexane is supported by the data shown in
Figure 2, where the kinetic dependencies for the C
13DMPO concentration of 30 µmol/L in hexane are shown for its solutions in hexane of 99% purity and hexane of 95% purity. It is seen that the surface tension decrease in the solution at times above 300 s for the surfactant solution in the less purified hexane is drastically higher than that in the solution using hexane of high purity.
The theoretical calculations (solid lines in
Figure 1) were performed using the basic Equations (1)–(7), with the adsorption isotherm calculated either via the Frumkin model, Equations (10) and (11), or via the reorientation model, Equations (12)–(14). The equilibrium surface tension values used for the calculations were taken to be those which correspond to the onset of the surface tension decrease due to the presence of impurities. Both these models provide a quite satisfactory correspondence between the observed data and calculated values. This is because for these models, at high C
13DMPO concentrations, the most significant differences would be observed in the initial range of temporal dependencies, where experimental data are not available. The parameters of the reorientation model and the C
13DMPO diffusion coefficient in hexane estimated from the correspondence between the observed data and calculated values of surface tension are: ω
10 = 5.5 × 10
5 m
2/mol; ω
2 = 10.0 × 10
5 m
2/mol; b = (3.5–4.7) × 10
2 m
3/mol; α = 0.0; a = 1.0; ε = 4.0 × 10
−3 m/mN; and D
2 = (3.2–4.5) × 10
−9 m
2/s. The corresponding parameters for the Frumkin model are listed below. The ranges of coefficients b and D
2 listed above correspond to the best fit of the experimental data by the calculated surface tension values for all C
13DMPO concentrations—10–300 µmol/L. As the distribution coefficient of C
13DMPO is high (its solubility in hexane is approximately by a factor of 30 higher than that in water), and the water drop volume is much lower than the cell volume, the calculated temporal dependencies of interfacial tension are almost independent of the variations of the diffusion coefficient of C
13DMPO in water within a quite wide range, i.e., in the range of 10
−9–10
−10 m
2/s. The values of the C
13DMPO diffusion coefficient in hexane are approximately one order of magnitude higher than those in water. This difference is quite reasonable because (i) the viscosity of hexane is three times lower than that of water, and (ii) a convective diffusion of the surfactant towards the drop located in the middle of the cell can possibly occur.
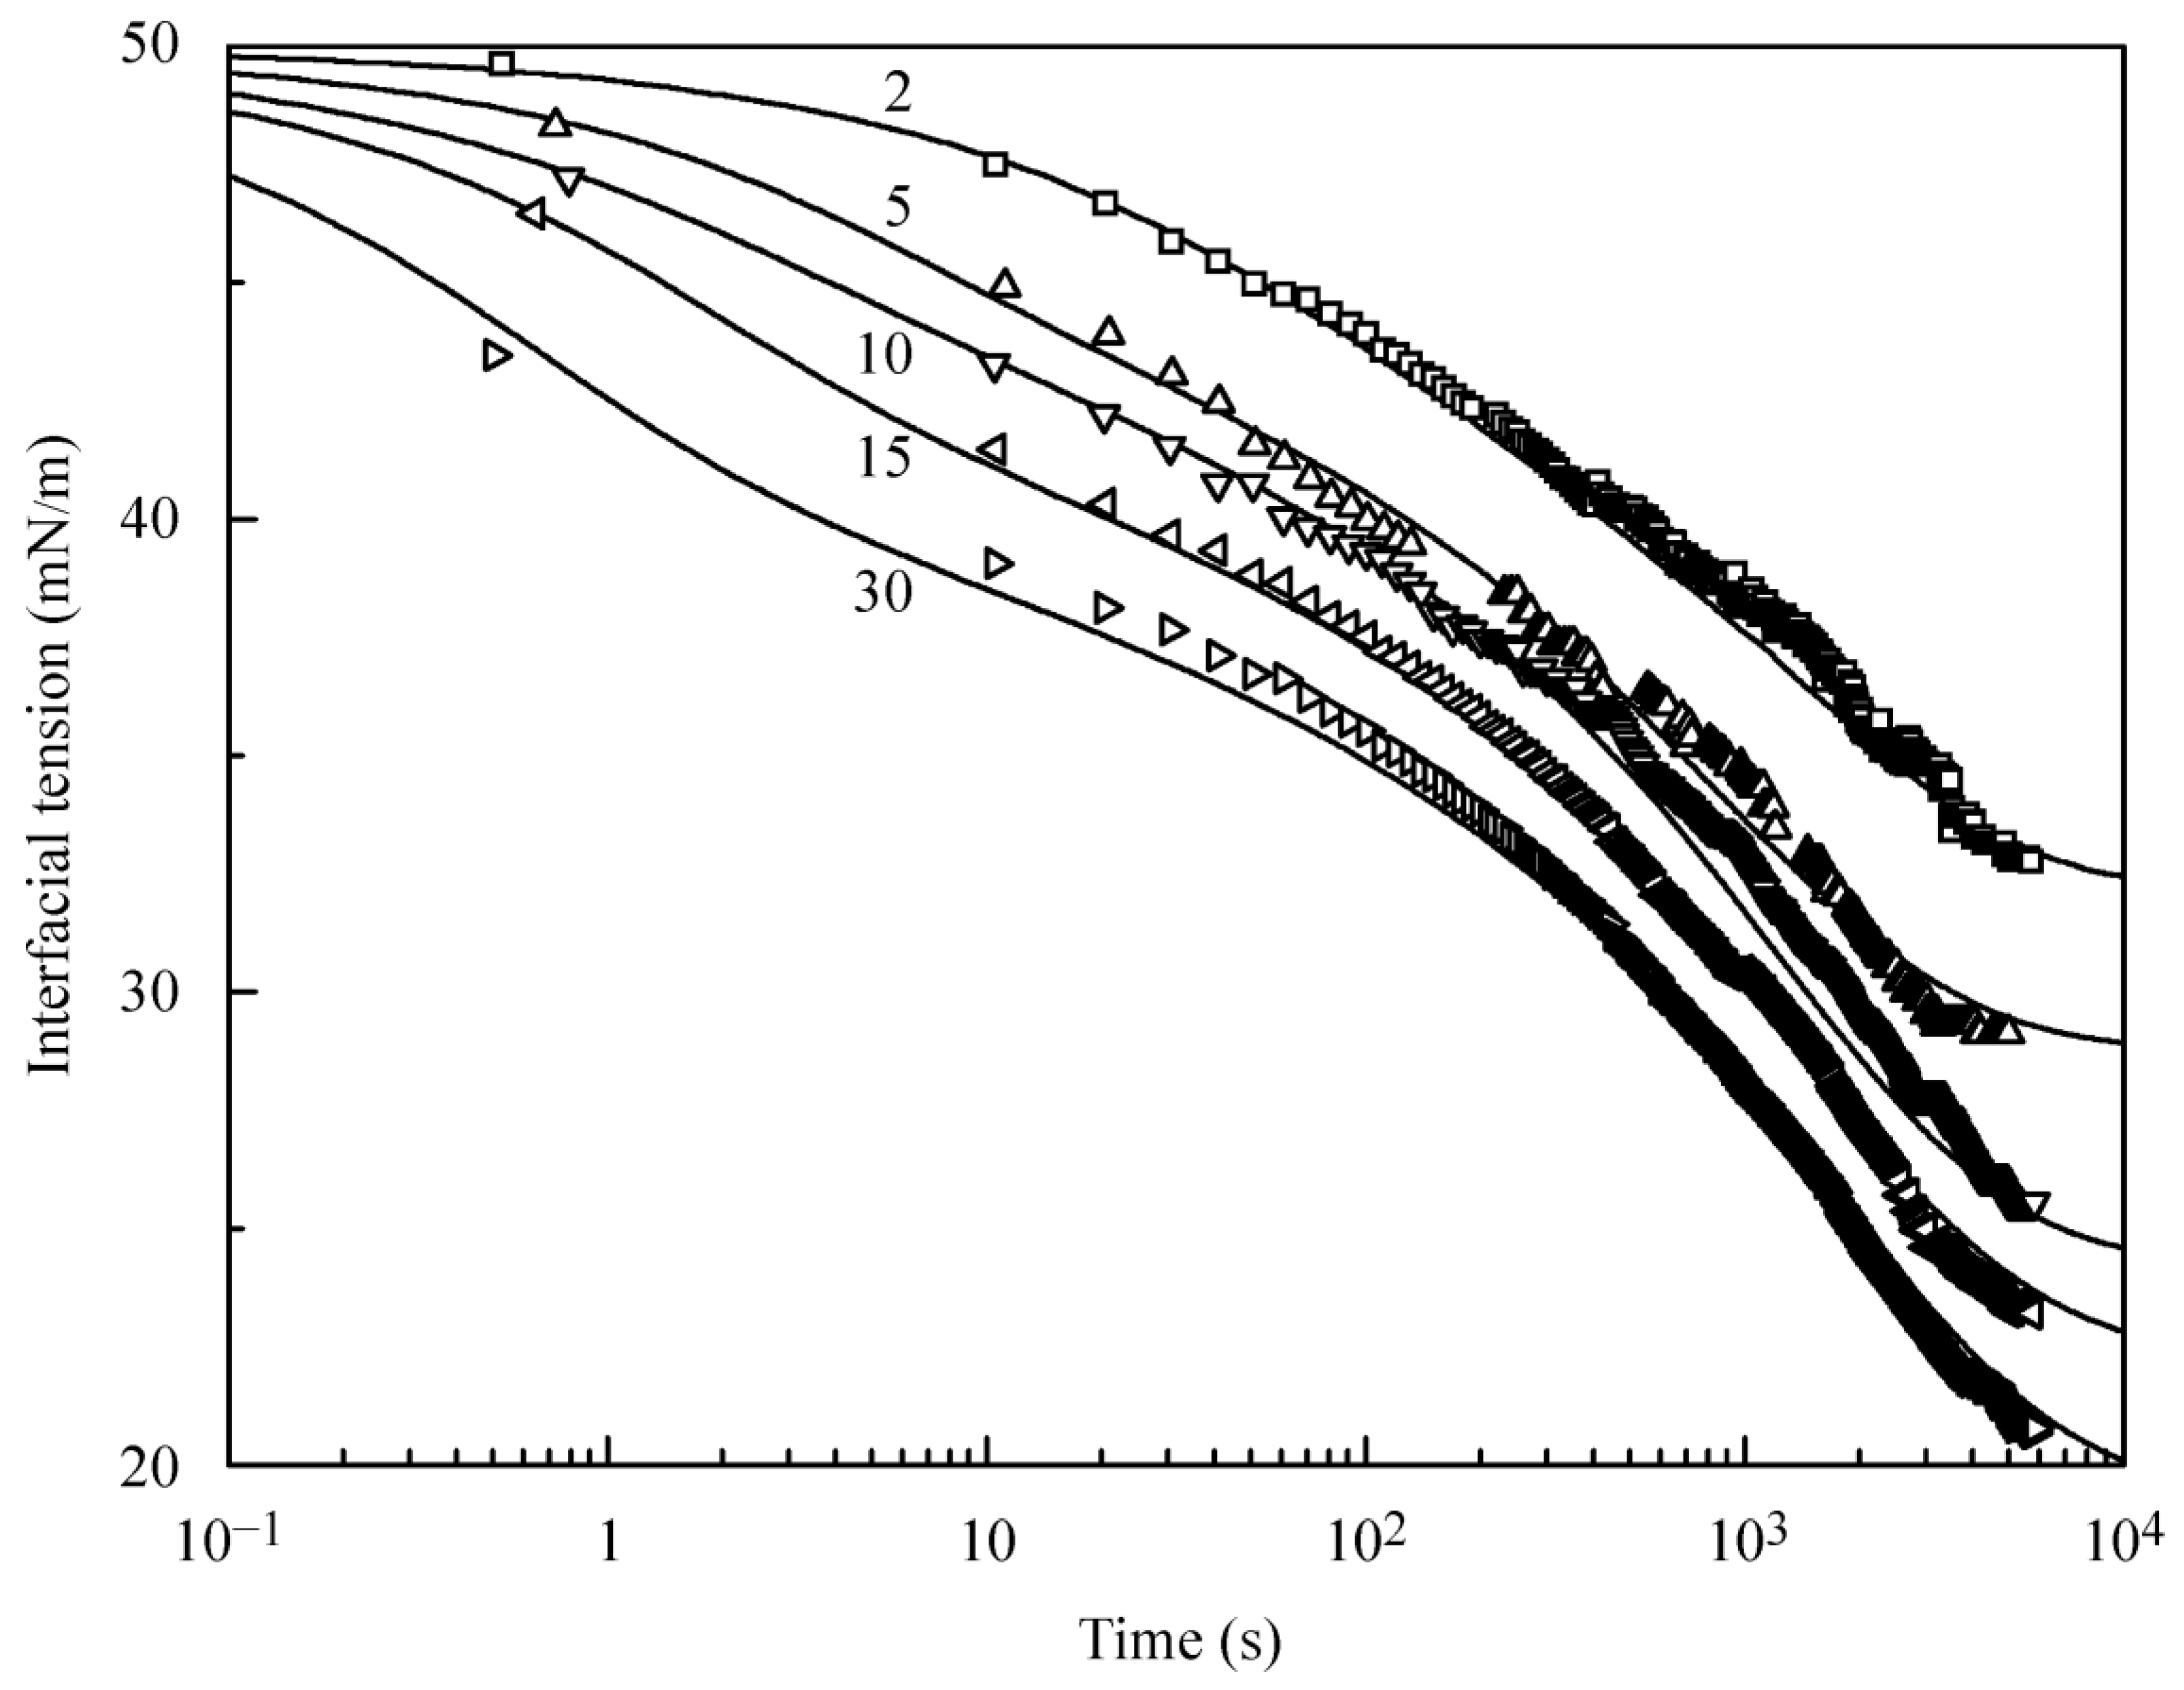
Figure 3 illustrates the dynamic interfacial tension at the interface between a hexane drop and C
13DMPO aqueous solutions at various surfactant concentrations. The shape of curves is essentially different from that shown in
Figure 1. It is seen that, in contrast to the solutions of the surfactant in hexane at its interface with a water drop, where the adsorption process is very fast, the adsorption of C
13DMPO from its aqueous solution onto the hexane drop is slow, and the time of 6000–8000 s is insufficient to attain the adsorption equilibrium. The equilibrium is achieved at the earliest after 20,000 s. This behaviour can be explained by two facts: (i) the concentration for the aqueous surfactant solution having the same interfacial tension as that observed in the hexane solution is very low; and (ii) C
13DMPO passes from the water phase into hexane where its solubility is higher. Note that the surfactant concentration in hexane for both types of experiments is higher (by a factor equal to the distribution coefficient) than in water. Therefore, in the experiments with a water drop immersed into the C
13DMPO solution in hexane, the adsorption rate is correspondingly increased, while for the hexane drop immersed into the C
13DMPO aqueous solution, the adsorption rate is correspondingly decreased. Thus, the difference in the adsorption rates could be estimated approximately as the square of the distribution coefficient. On the other hand, it follows from the experimental curves shown in
Figure 1 and
Figure 2 and the calculations of the interfacial tension dynamics, which yield the equilibration time duration of 10–20 and 10,000–20,000 s, respectively, for the two types of studied solutions, the difference in the adsorption rates is by a factor of about 1000. This agrees rather well with the distribution coefficient value estimated in this work (about 30, see below) and also agrees with the value of 34 reported in [
9].
The calculations for the dynamic curves shown in
Figure 3 were also made with the two models of the surface layer. However, for the reorientation model Equations (12)–(14), to achieve the agreement of theoretical predictions with experimental data, the molar area for each of the two states ought to be decreased by a factor of 2. The most probable explanation for this is that the C
13DMPO molecules do not have sufficient time to undergo reorientation and are rather desorbed from the interface into the hexane drop bulk. Therefore, the calculations using the Frumkin model could be considered as the more adequate approach. The theoretical curves shown in
Figure 3 were obtained with the following model parameters: ω
0 = (2.5–3.0) × 10
5 m
2/mol; b = (2.6–3.8) × 10
3 m
3/mol; a = 0.0; and ε = 3.0 × 10
−3 m/mN. The calculated adsorption dynamics is strongly dependent on the values of the surfactant diffusion coefficient in the hexane drop D
1 because of the relatively high quantity of C
13DMPO passing to the drop. The values of the diffusion coefficients estimated from the best fit throughout the whole range of concentrations were D
1 = (1–2) × 10
−9 m
2/s and D
2 = (4–6) × 10
−9 m
2/s, respectively. The main reason for the high D
2 values is that in the experiments illustrated by
Figure 3, convection plays an essential role. The nature of liquid also contributes to this difference. Comparing the data obtained in the experiments with a water drop immersed in the surfactant solution in hexane (
Figure 1) with the results obtained for a hexane drop immersed in the aqueous solution (
Figure 3), one can see that the coefficient D
1 for the second case is higher than in the first case. It is known that the diffusion coefficient is inversely proportional to the viscosity of liquid. Hence, as the viscosity of hexane is three times lower than that of water, the diffusion coefficient in hexane is three times higher than that in water. Also, the diffusion rate in both phases is higher due to the essential nonsphericity of the oblate hexane drop formed at the vertical capillary. While for spherical drops with a volume characteristic to those in our studies, the surface-area-to-volume ratio is 3/R
1 = 1.62 mm
−1; for the actual drop (with account for the area at the capillary tip) this ratio exceeds 2.0 mm
−1. Among other Frumkin model parameters corresponding to dynamic conditions, one could distinguish the lower area per adsorbed C
13DMPO molecule for the hexane drop immersed into the aqueous surfactant solution. This fact could be ascribed to the partial (incomplete) unfolding of the C
13DMPO molecules due to their desorption into the hexane drop.
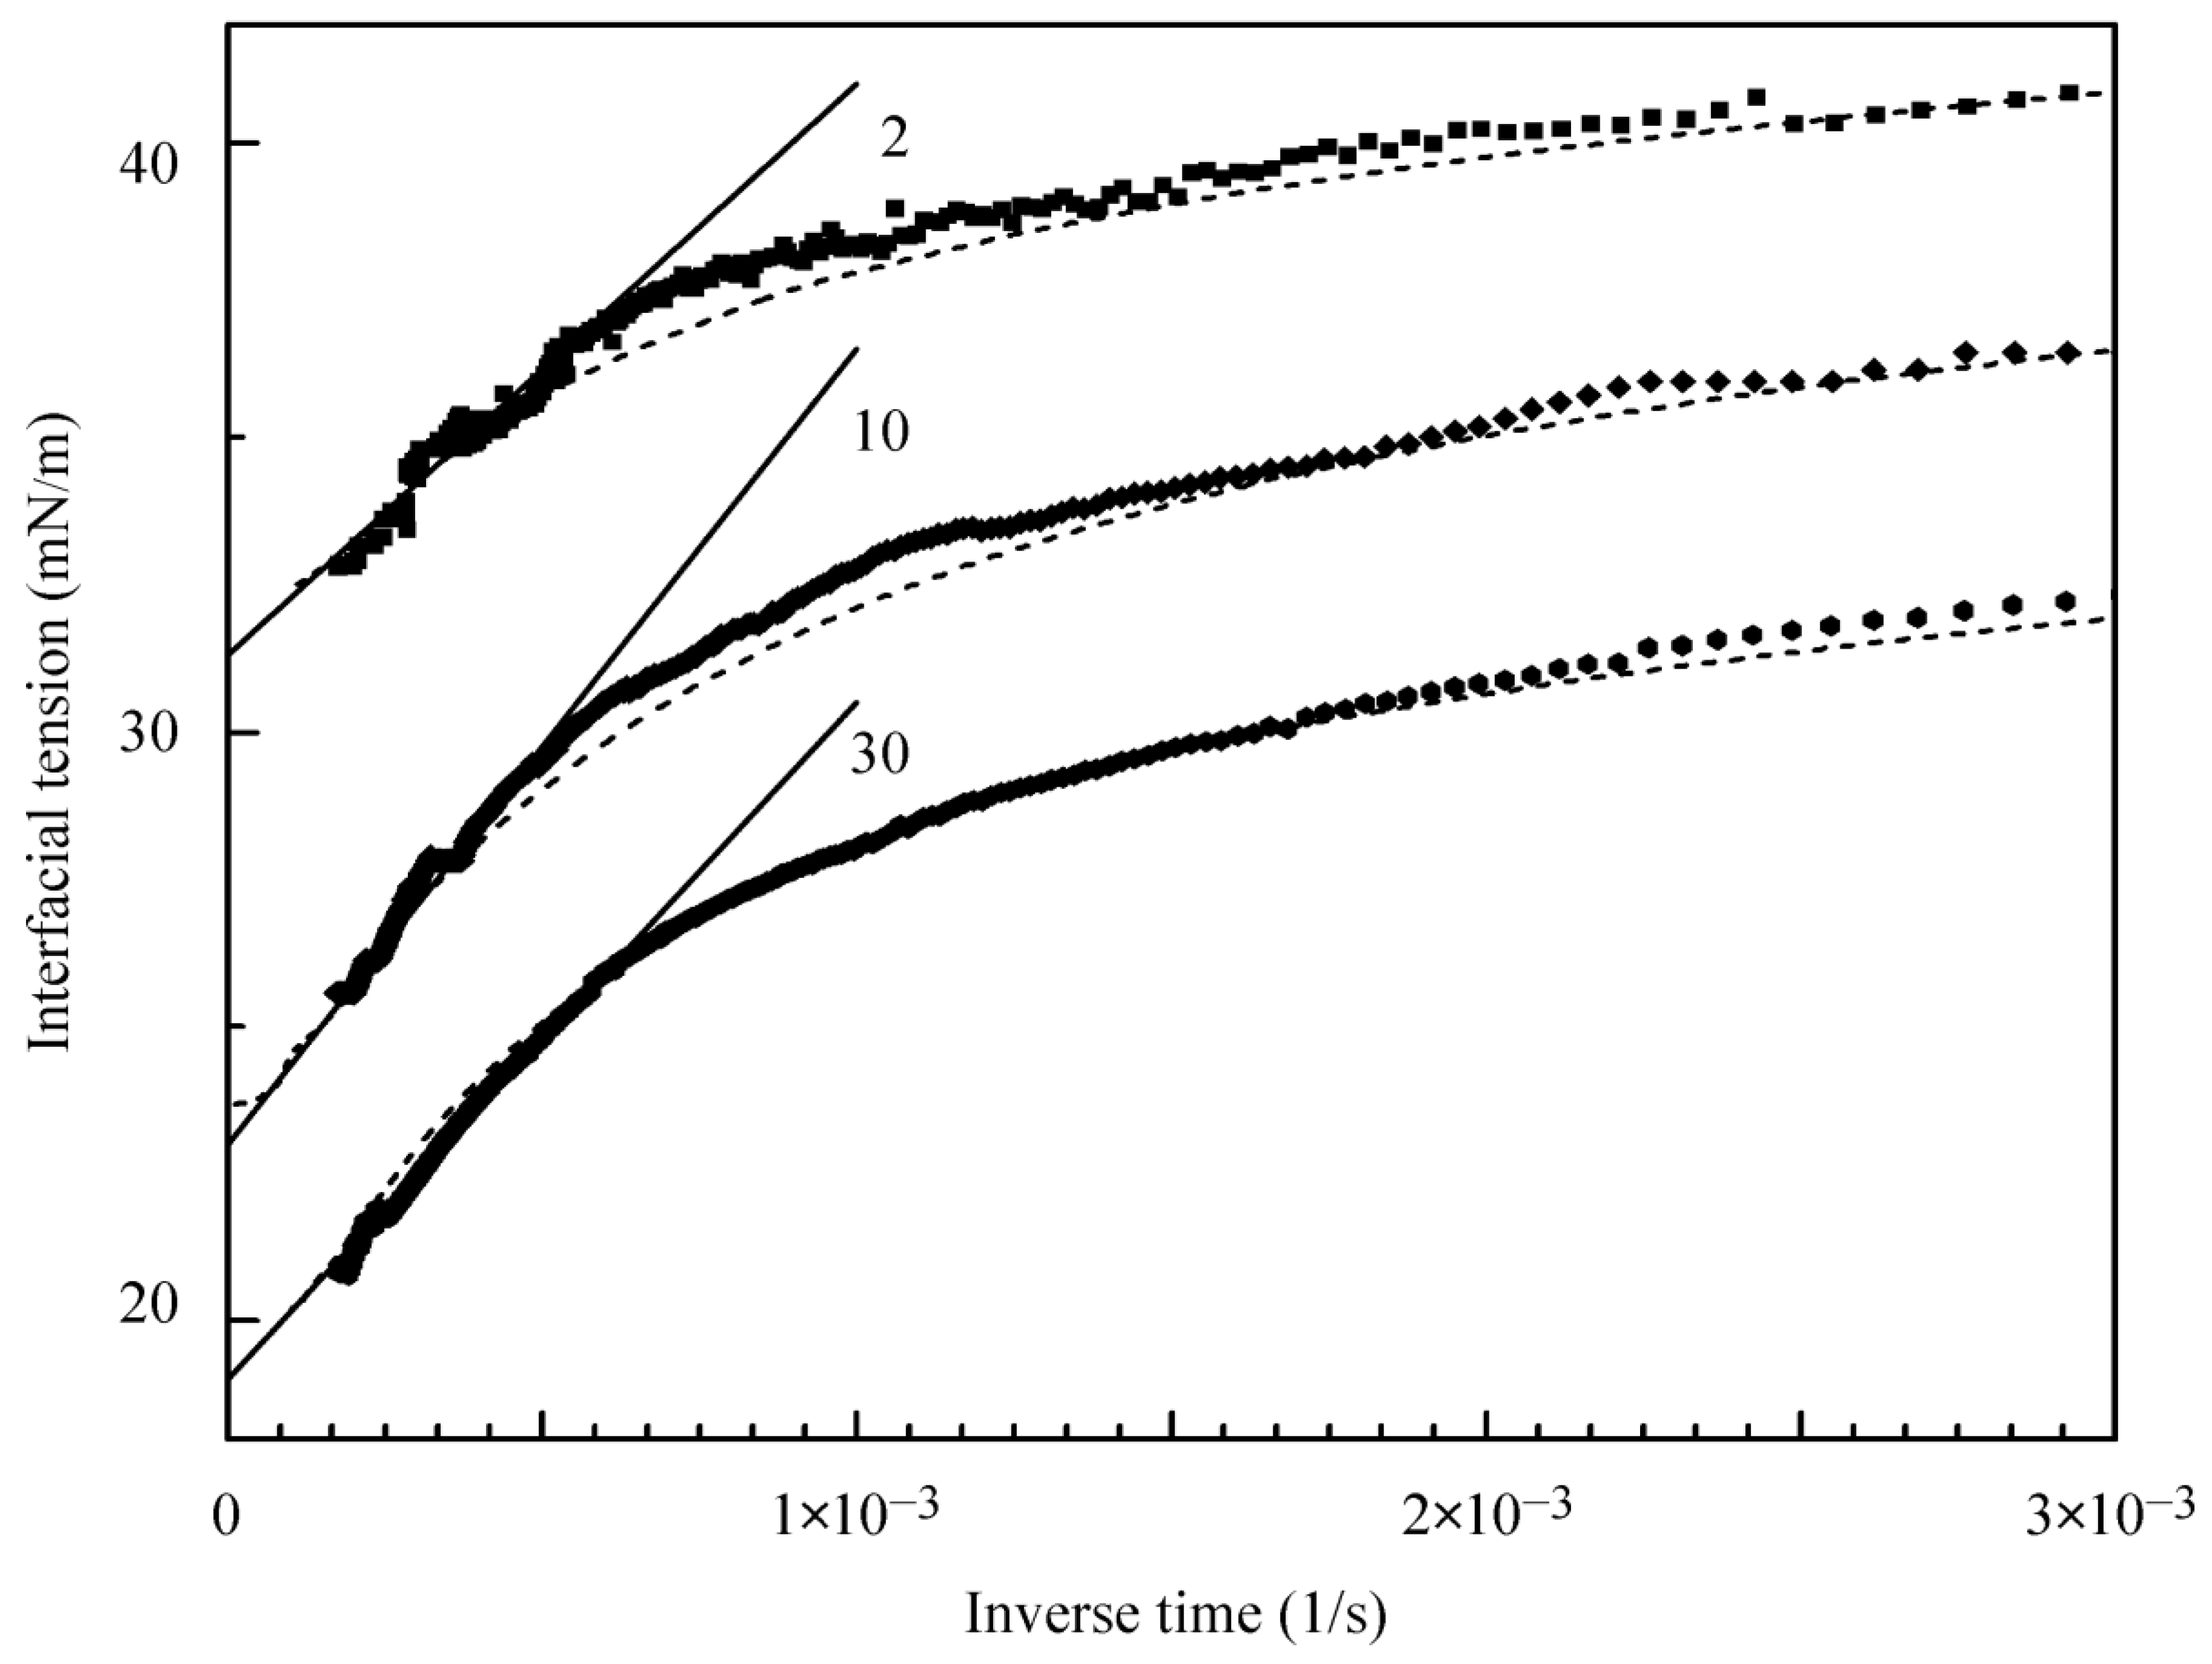
To estimate the equilibrium interfacial tension, the experimental curves shown in
Figure 3 were extrapolated vs. 1/t onto the infinite time. This dependence was found to simulate quite well the complicated mechanism of C
13DMPO adsorption from its aqueous solution onto the hexane drop; some examples are shown in
Figure 4, where the theoretical values recalculated from those presented in
Figure 3 are also plotted by dashed lines. Note that the calculations made for the concentration 10 µmol/L were performed within the time range up to 10
5 s. It is seen that these results agree well with the values obtained by extrapolation of experimental data to the equilibrium as used in
Figure 5. It should be noted that the equilibrium surface tension values estimated in this way are approximately by 1 mN/m lower than the experimental values obtained at adsorption times of 5000–7000 s, and are by 0.6–0.9 mN/m lower than the values reported in [
9]. This latter fact could be caused by the difference in the experimental temperatures—in [
9], the temperature was 20 °C. To verify this, we repeated some experiments at 20 °C and found that the interfacial tension becomes higher by 0.5 mN/m.
In contrast to the isotherm parameters which correspond to the dynamical conditions (calculated assuming diffusional transport and adsorption-related losses), the equilibrium isotherms shown in
Figure 5 were calculated based on the C
13DMPO concentrations in the volume of its solution in hexane or in water into which the water or hexane drop was immersed, respectively. In both cases, the isotherms were fitted by the Frumkin model with the same values of parameters: ω
0 = 5.3 × 10
5 m
2/mol; a = 0.0; and ε = 3.1 × 10
−3 m/mN. However, because the C
13DMPO concentrations in water were different from those in hexane, the values of b also were different; for aqueous solution b = 3.7 × 10
4 m
3/mol, while for the solution in hexane, we have b = 1.3 × 10
3 m
3/mol. It is seen that the thus calculated isotherms are in a good correspondence with the experimental data. In our case, the discrepancy between the experimental and calculated values does not exceed ±0.2 mN/m.
From these results it is straightforward to determine quite precisely the distribution coefficient of C
13DMPO between the studied phases. To do this, one should compare the values of concentrations for the two systems (for two isotherms) at equal values of interface tension. This is illustrated by the data shown in
Table 1; the deviation from the average value of 30 is seen to be quite small (±2). This agrees with the result reported in [
9], where the average value was 34. Note also that the ratio between the b constants corresponding to the C
13DMPO in water and in hexane is 27.5, which almost coincides with the value of the distribution coefficient obtained in this study. Most probably the difference between the values of the distribution coefficients obtained here and in [
9] could be ascribed to the difference in the experimental temperatures: the higher is the temperature, the lower is the value of the distribution coefficient.
