1. Introduction
Various experimental and theoretical studies of adsorption of alkanes from the gas phase on a water surface were previously reported [
1,
2,
3,
4,
5,
6,
7,
8,
9,
10,
11,
12,
13,
14,
15,
16,
17]. The thickness of such adsorbed alkane layers was determined with optical methods being maximum up to 4–5 nm [
6]. This indicates the formation of a bulk alkane phase at the water surface, and that the surface tension of this phase to air should be close to that of the pure alkane/water interface. The increase of the thickness is an extremely slow process: it needs 200 h to attain this value. For the adsorption process during 10 h the layer thickness for heptane was about 1.5 nm.
During last years, a large pool of experimental data was collected, and theoretical models were developed for the adsorption of alkanes from the gas phase on the surface of a water drop [
7,
8,
9,
10,
11,
12,
13,
14,
15,
16,
17]. It was shown, for instance, that the adsorption of alkanes from the gas phase results in a significant decrease of the surface tension of water or aqueous protein (surfactant) solutions. Moreover, measurements and analysis of tensiometric data [
7] demonstrated that the adsorption of alkanes on the surface of water drops can lead to a condensation of the alkane molecules at the surface and to the formation of liquid films. It was shown [
12] that the influence of hexane vapor on the surface tension of water depends also essentially on the air humidity. The dynamic surface tension dependencies for drops of aqueous C
14EO
8 solutions at the interface to air saturated by pentane, hexane, heptane and toluene, respectively, and for drops of water at these interfaces were discussed [
17]. The experimental results were well described by a model which implies a diffusion processes for the C
14EO
8 molecules and the existence of a kinetic barrier for the alkane molecules. The desorption process was shown to be slow for heptane and hexane, however, for pentane vapor the desorption was quite rapid, and after the desorption commences the surface tension became equal to that at the interface with pure air.
In [
18], the influence of temperature (in the range of 20–50 °C) on the dynamic surface tension of water (as measured by drop profile analysis tensiometry) in heptane and pentane vapors was studied, and it was shown that at long times of drop ageing in heptane vapor, a sharp decrease of surface tension (from 55–60 mN m
−1 to 30–40 mN m
−1) occurred. The time at which this sharp decrease started became lower with increasing temperature: 10,000–15,000 s at 20 °C, and 500–700 s at 50 °C. This phenomenon was attributed to the formation of heptane adsorption layers with significant thicknesses. The sharp surface tension decrease was observed with errors in fitting the drop profile coordinates being below 5 µm. Therefore, this phenomenon of a sharp surface tension decrease caused by the formation of polylayers does really exist.
Our previous studies [
17,
18] have shown that the rate of alkane adsorption at an aqueous surface is not limited by diffusion of alkane molecules in a gas (vapor) phase but has a kinetic limitation due to an energy barrier for adsorbing/desorbing molecules. Such a process can be described in terms of kinetic equations. A set of kinetic equations was proposed and applied to analyze experimental data. However, the formation of only two alkane adsorption layers was assumed [
17,
18], whereas the experimental data show that the adsorption films of alkanes at an aqueous solution surface should consist of more than one or two adsorption layers. At later stages of the process one can even observe a transition from adsorption to condensation. Therefore, a more general model is required, which would account for multilayer alkane films formed by adsorption from the vapor phase.
In the present study, we formulated a kinetic model for the formation of multilayer alkane films, which also takes into account such effects as interaction among alkane molecules in the layers and variation of the molar area of alkane molecules with increasing surface tension. The model describes the variation of the measured surface tension with time and constrains the model parameters, in particular, the kinetic coefficients.
2. Theory
The kinetics of formation of a multilayer adsorption film can be described by a set of equations dedicated to the first layer:
and for the subsequent layers:
Here, c is the concentration of alkane in the ambient gas phase,
is the alkane adsorption in the j-th layer, N
j is the number of alkane molecules within the layer, S is the total surface area, ω
j is the molar area of alkane molecule in the j-th layer, and β
j and α
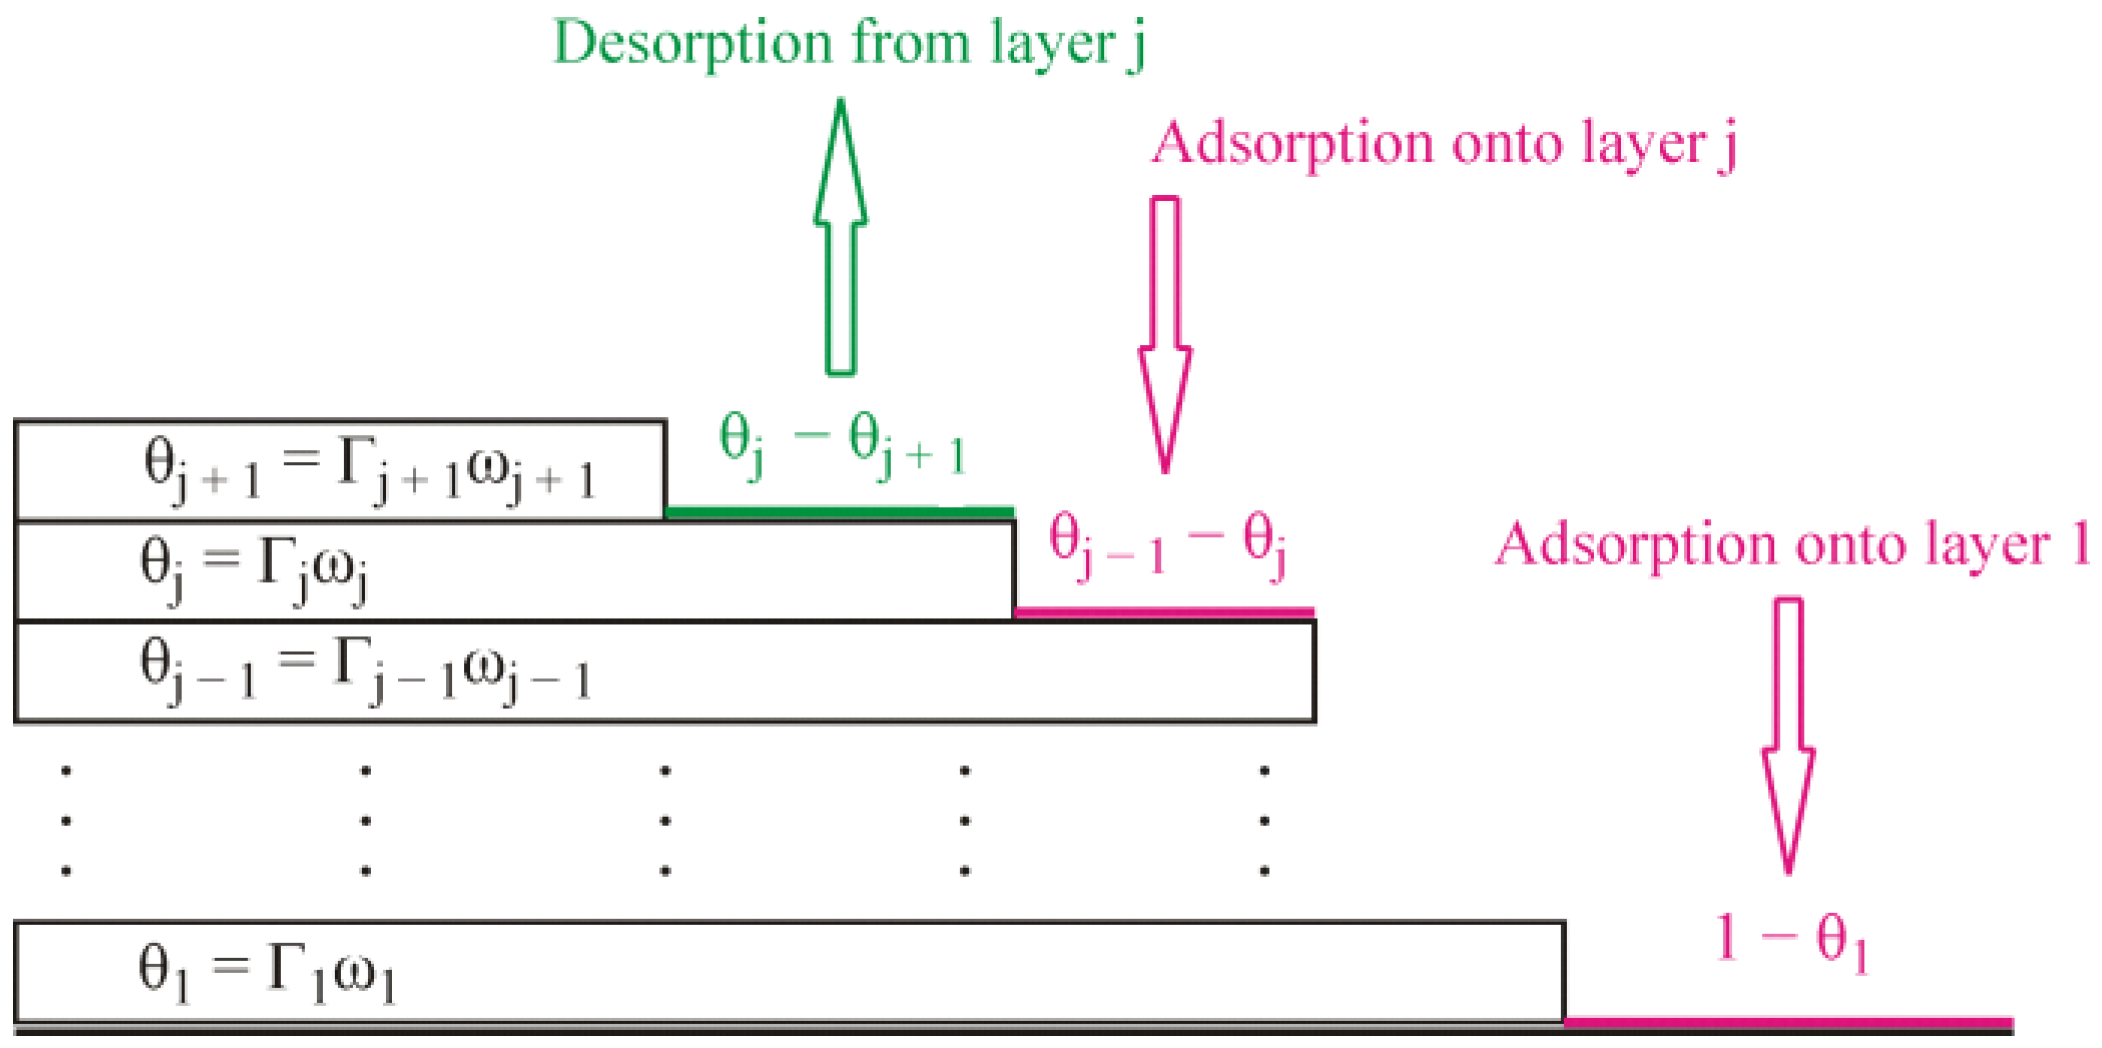
j are the kinetic coefficients for the adsorption and desorption process, respectively, in the first and subsequent layers. The formalism involved in Equations (1) and (2) is illustrated schematically by
Figure 1. In Equation (2), the adsorption terms are proportional to the factors
, because the adsorption in the j-th layer is possible on the part of the surface which is already covered by the previous layer but is not covered yet by the considered layer, while, in Equation (1), the term
corresponds to the adsorption within the first layer. Similarly, the desorption terms are proportional to the factors
, which means the desorption from the j-th layer can occur on the part of the surface already covered by this layer but not blocked yet from the top by the subsequent layer, because the molecules from the subsequent layer prevent desorption from the previous layer. The kinetic equation for the j-th layer, Equation (2), reduces to the standard Langmuir kinetics equation in the particular case when the molecules of the previous layer cover the whole surface
and the subsequent layer has not begun to form yet
. Note that, in the formulation above, it is assumed that the molar area of the adsorbed alkane molecule can be different in different layers; this will allow involving the intrinsic compressibility of the adsorbed molecules, as shown below.
The set of kinetic equations given by Equations (1) and (2) assumes that the main relaxation process is the barrier-limited exchange of molecules with the bulk (vapor) phase, because the diffusion of the gas molecules is very fast [
17,
18]. This means that rearrangements within the adsorbed multilayer film are also very quick, much quicker than the kinetics of adsorption on the top of the film from outside.
Under equilibrium conditions, the time derivatives in the left hand sides of Equations (1) and (2) are zero. The solution of the resulting set of algebraic equations yields the equilibrium adsorptions
in each layer. One usually assumes the kinetic coefficients to be constants and to be the same for the second and subsequent layers: β
j = β and α
j = α for j ≥ 2; also the molar areas in all layers are assumed to be the same and equal to ω. In this particular case the equilibrium adsorptions in the layers can be obtained as:
where
,
with
and
being the equilibrium adsorption constants for the first and subsequent layers, respectively. Then, the total adsorption
can be obtained as:
with
. Equation (5) is just the multilayer adsorption isotherm which follows from the classical Brunauer–Emmett–Teller (BET) theory [
19]. It should be noted, however, that, unlike the case of adsorption on a solid surface, we do not assume here that the molecules adsorb on fixed adsorption sites.
It is important that the alkane molecules adsorbed at an aqueous solution surface are mobile. They freely move over the available space at the surface. The molecules in the next layer freely move over the molecules which form the previous one. If we imagine a momentary picture of the adsorbed molecules, we will see something like patches consisting of different numbers of adsorption layers in different places and the molecules randomly distributed within the layers. The simplified schematic shown in
Figure 1 does not reflect this peculiarity. The lifetime of these patches is very short, and they should change continuously, as the adsorbed molecules proceed to move. Thus, we can only speak about a probability to have certain amounts of molecules in each layer in a certain time moment. Under equilibrium conditions these amounts should not change. However, such a dynamic equilibrium implies a continuous exchange of the molecules between the different layers and between the surface and the bulk (vapor) phase. Under non-equilibrium conditions, i.e., when adsorption process proceeds, the amount of the molecules in each layer increases with time. Similar to the classical Langmuir and Frumkin isotherms, which are applicable for the case of non-localized adsorption at liquid interfaces [
20], we assume that our model can be applied to the case of multilayer adsorption from a vapor phase at liquid interfaces.
The model considered here assumes that the adsorbed alkane molecules are ordered in parallel layers. Such approximation is possible only when we have a small number of adsorption layers, probably up to 3–5 [
18]. For a larger number of layers, the molecules will not be fixed within the strictly parallel layers, but the layers will rather mix, and the system will resemble rather something more similar to a bulk phase of alkane with disordered molecules, i.e., a condensed film. The applicability of the model should be limited in this case, and restricted to the initial stage of the process, when the number of adsorption layers is sufficiently small.
To take into account the interaction among alkane molecules in the layers we assume, similarly to the Frumkin theory, that the kinetic coefficients β
j and α
j in Equations (1) and (2) depend on the surface coverage:
where
,
,
and
are model parameters, and
is the surface coverage in the j-th layer. In line with the adopted BET-like approach, we assume that the values φ
a,j and φ
d,j, and the parameters
and
for the second to the subsequent layers do not change, thus reducing the number of model parameters to eight:
,
,
,
,
,
,
and
, where the subscript 2 refers to the second and further layers. In this case, when the interaction between alkane molecules within the layer is assumed to exist, the equilibrium state cannot be described by the simple Equations (3)–(5), but obeys a more complicated set of transcendent equations which would have to be solved numerically.
At the initial stage the adsorption film only consists of several alkane layers. Therefore, for the numerical solution, only a limited number of layers L should be accounted for, while the contribution of the layers with j > L is neglected. Then, in terms of surface coverages, the set of kinetic equations becomes:
where the kinetic coefficients β
j and α
j as functions of θ
j are given by Equation (6).
The model also allows for a possible variation of the tilt angle of the alkyl chains (alkane molecules) in the layers depending on the surface pressure [
21]. This variation of the tilt angle results in a variation of the molar area of alkane molecules, therefore we will consider the molar area ω
j in Equations (7)–(9) to depend on the surface pressure per j-th layer Π
j:
where ε is the intrinsic compressibility coefficient, and ω
0 is the molar area at the very initial stage of the surface coverage, and, similar to [
17,
18]:
where
are the Frumkin interaction parameters (i = 1,2), and the total surface pressure is calculated as the sum across the first L layers:
Then, the surface tension is calculated as
where γ
0 is the surface tension of the pure solvent (water). Equations (11) and (12) assume a quasi-equilibrium state of the adsorption film, which is determined by the set of surface coverages varying slowly with time: θ
j = θ
j (t) according to Equations (6)–(9). Thus, to describe the multilayer adsorption process, we have to solve numerically the set of ordinary differential equations (Equations (7)–(9)), taking into account the additional equations (Equations (6), and (10)–(13)). The calculation algorithm used for the solution is described in some detail in the
Appendix A.
3. Results and Discussion
The calculations according to the proposed model were compared with the results obtained in [
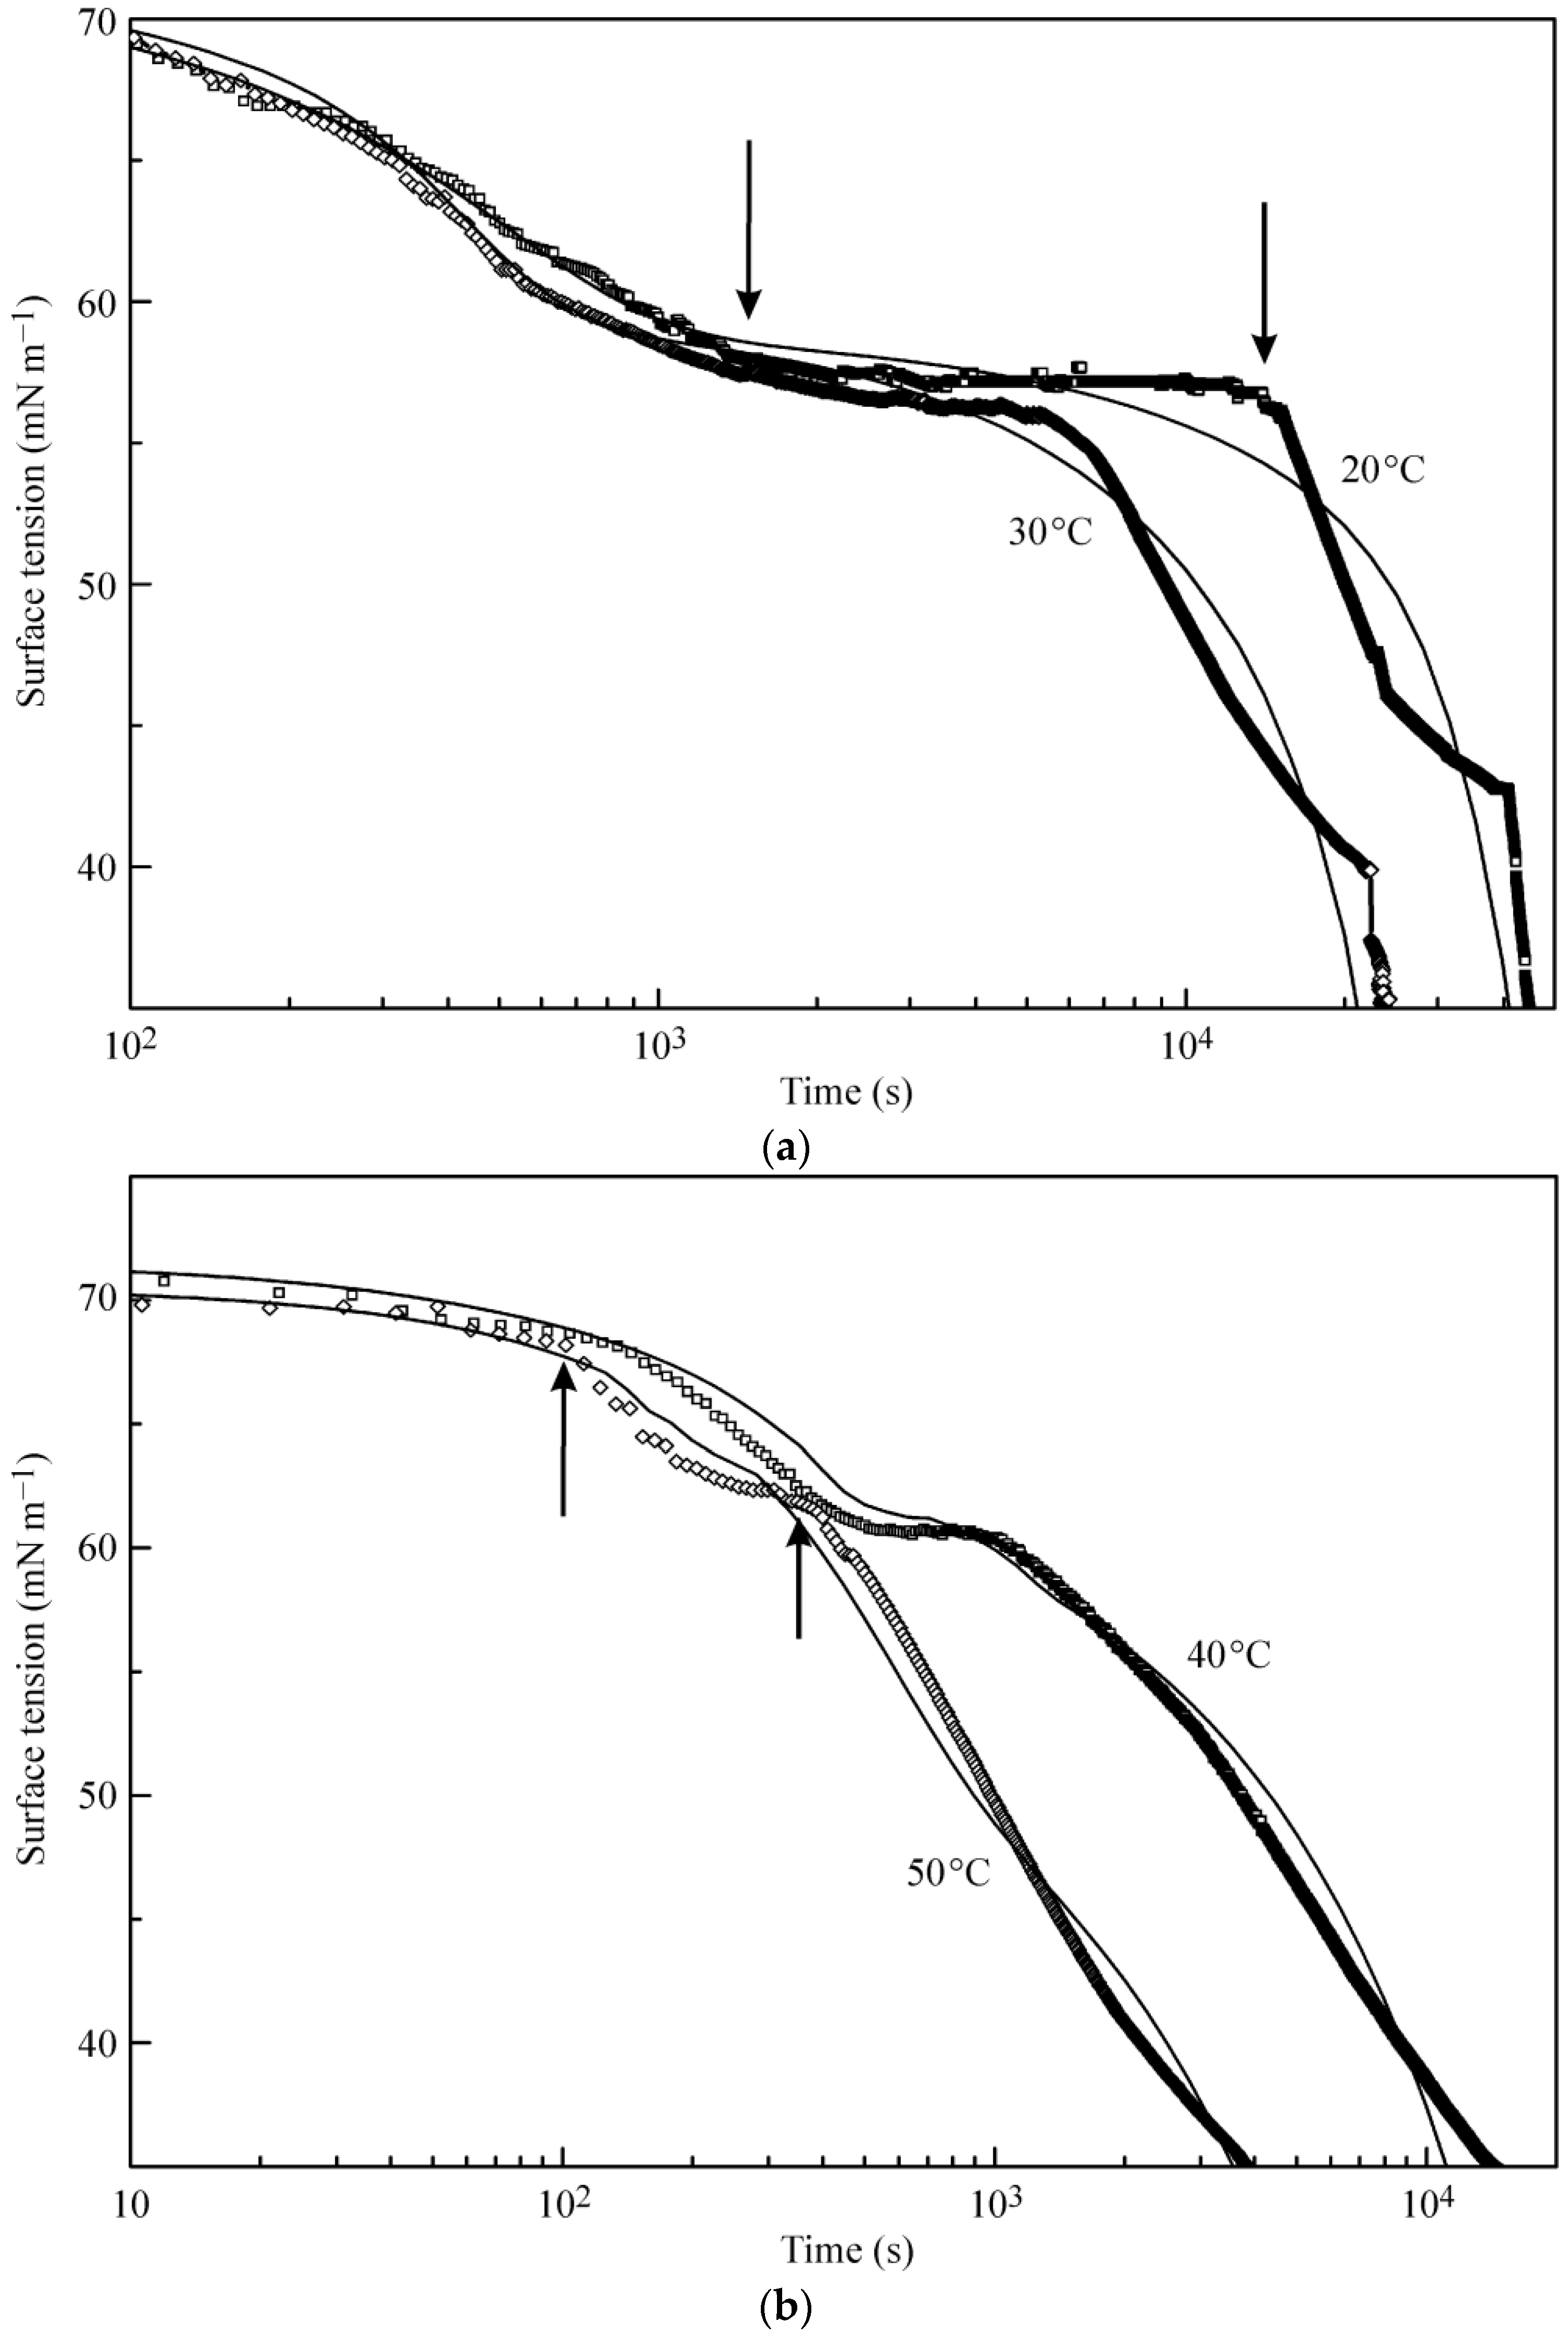
18] for the surface tension measured for water drops in air saturated by heptane vapor.
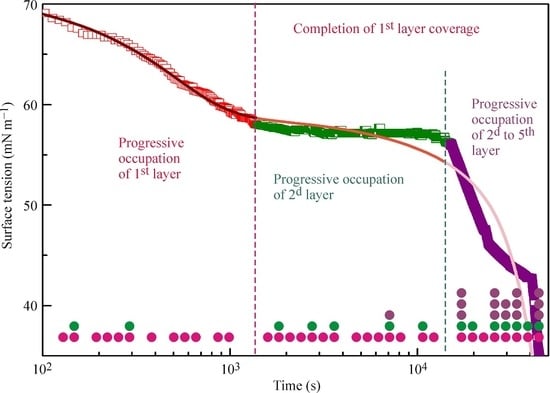
Figure 2a,b illustrates the experimental results reported in [
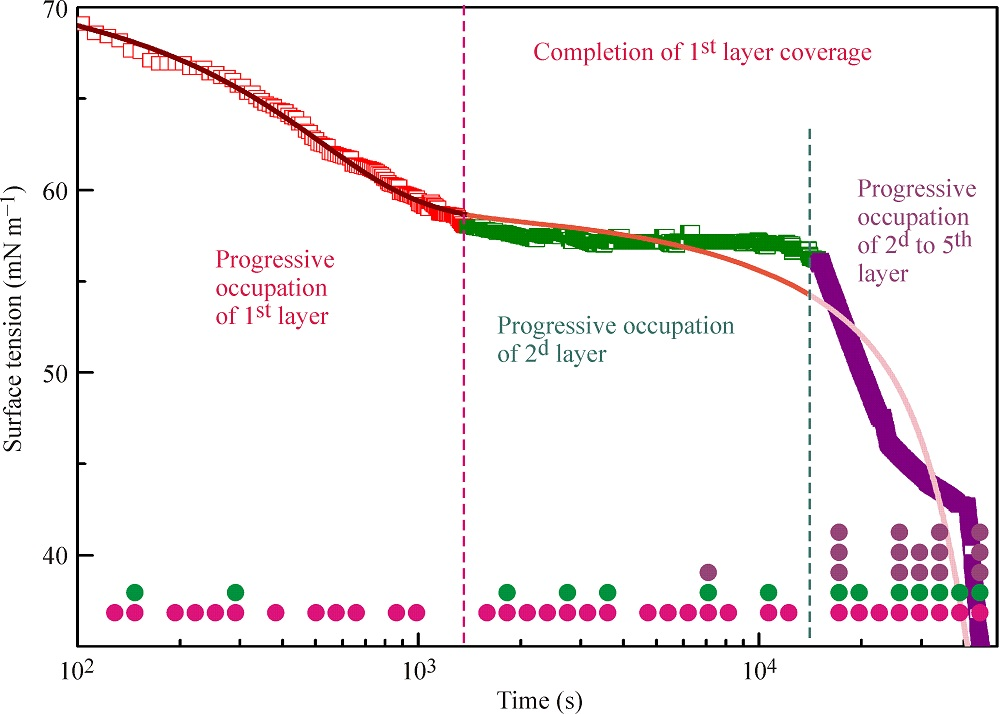
18] and the kinetic curves calculated from the multilayer adsorption model explained above. In the calculations, the number of layers was assumed to be 5, which in the limit of maximum times used in the experiments (from 50,000 s at 20 °C to 5000 s at 50 °C) corresponds to an increase of the adsorbed amount by several times as compared to a monolayer adsorption. It is seen from the experimental data that at the initial stage of adsorption the surface tension exhibits a rapid decrease down to approximately 60 mN m
−1 (first characteristic point shown for 20 °C data at 1400 s by arrow). Subsequently, the surface tension remains almost constant until the second characteristic point at 15,000 s, followed by a sharp decrease.
The location of these characteristic points is different for different temperatures. For example, at 50 °C these points are located at 100 and 350 s. It follows from the model that at times shorter than the second characteristic point the formation of monolayers occurs, while at longer times we expect multilayers to be formed. In our earlier publication [
18] monolayer adsorption was assumed: in the “post-critical” range (above the second characteristic point), we made approximate estimations only, and we found agreement between the experimental values and theoretical predictions only when the molar area was reduced by a factor of 3. However, such an assumption yields adsorption values by a factor of 3–4 higher than that following from the present model at surface tensions between 40 to 30 mN m
−1. It is seen in
Figure 2a,b that the curves calculated using the proposed model agree reasonably well with the experiments.
Please note, the main driving force for the alkane adsorption in all layers is the adsorption energy, which can be quantified by the decrease in surface tension per layer. This value is highest for the first layer (alkane adsorption at the water surface), and it is less for the second and subsequent layers. For a large number of layers (say, larger than 5), this energy is very small, but, since there is some decrease in tension, an increase in the number of layers to 10 appears possible, however, this would be a very slow process [
6].
It is seen in
Table 1 that β
1,0 (first layer) is larger than β
2,0 (second and subsequent layers). With increasing temperature, this difference becomes less pronounced: from two orders of magnitude at 20 °C to one order of magnitude at 50 °C. At the same time, the parameter β
1,0 becomes lower, while the product β
1,0 × c remains approximately constant, i.e., the heptane adsorption rate in the first layer is independent of temperature. On the contrary, for the second and further layers, both the β
2,0 value and the β
2,0 × c product in general increase with temperature: the product value becomes higher at 50 °C by one order of magnitude as compared with its value at 20 °C. In addition, d
2 is essentially higher than d
1 (as shown in
Table 1 after and before the slash (“/”), respectively). It should be noted that the number of layers assumed in the calculations influences not only the adsorbed amount, but also the surface tension. In particular, at 30 °C, for a five-layer adsorption, it takes 28,000 s to decrease the surface tension value down to 30 mN m
−1, while, for a two-layer adsorption, the required time is as high as 40,000 s.
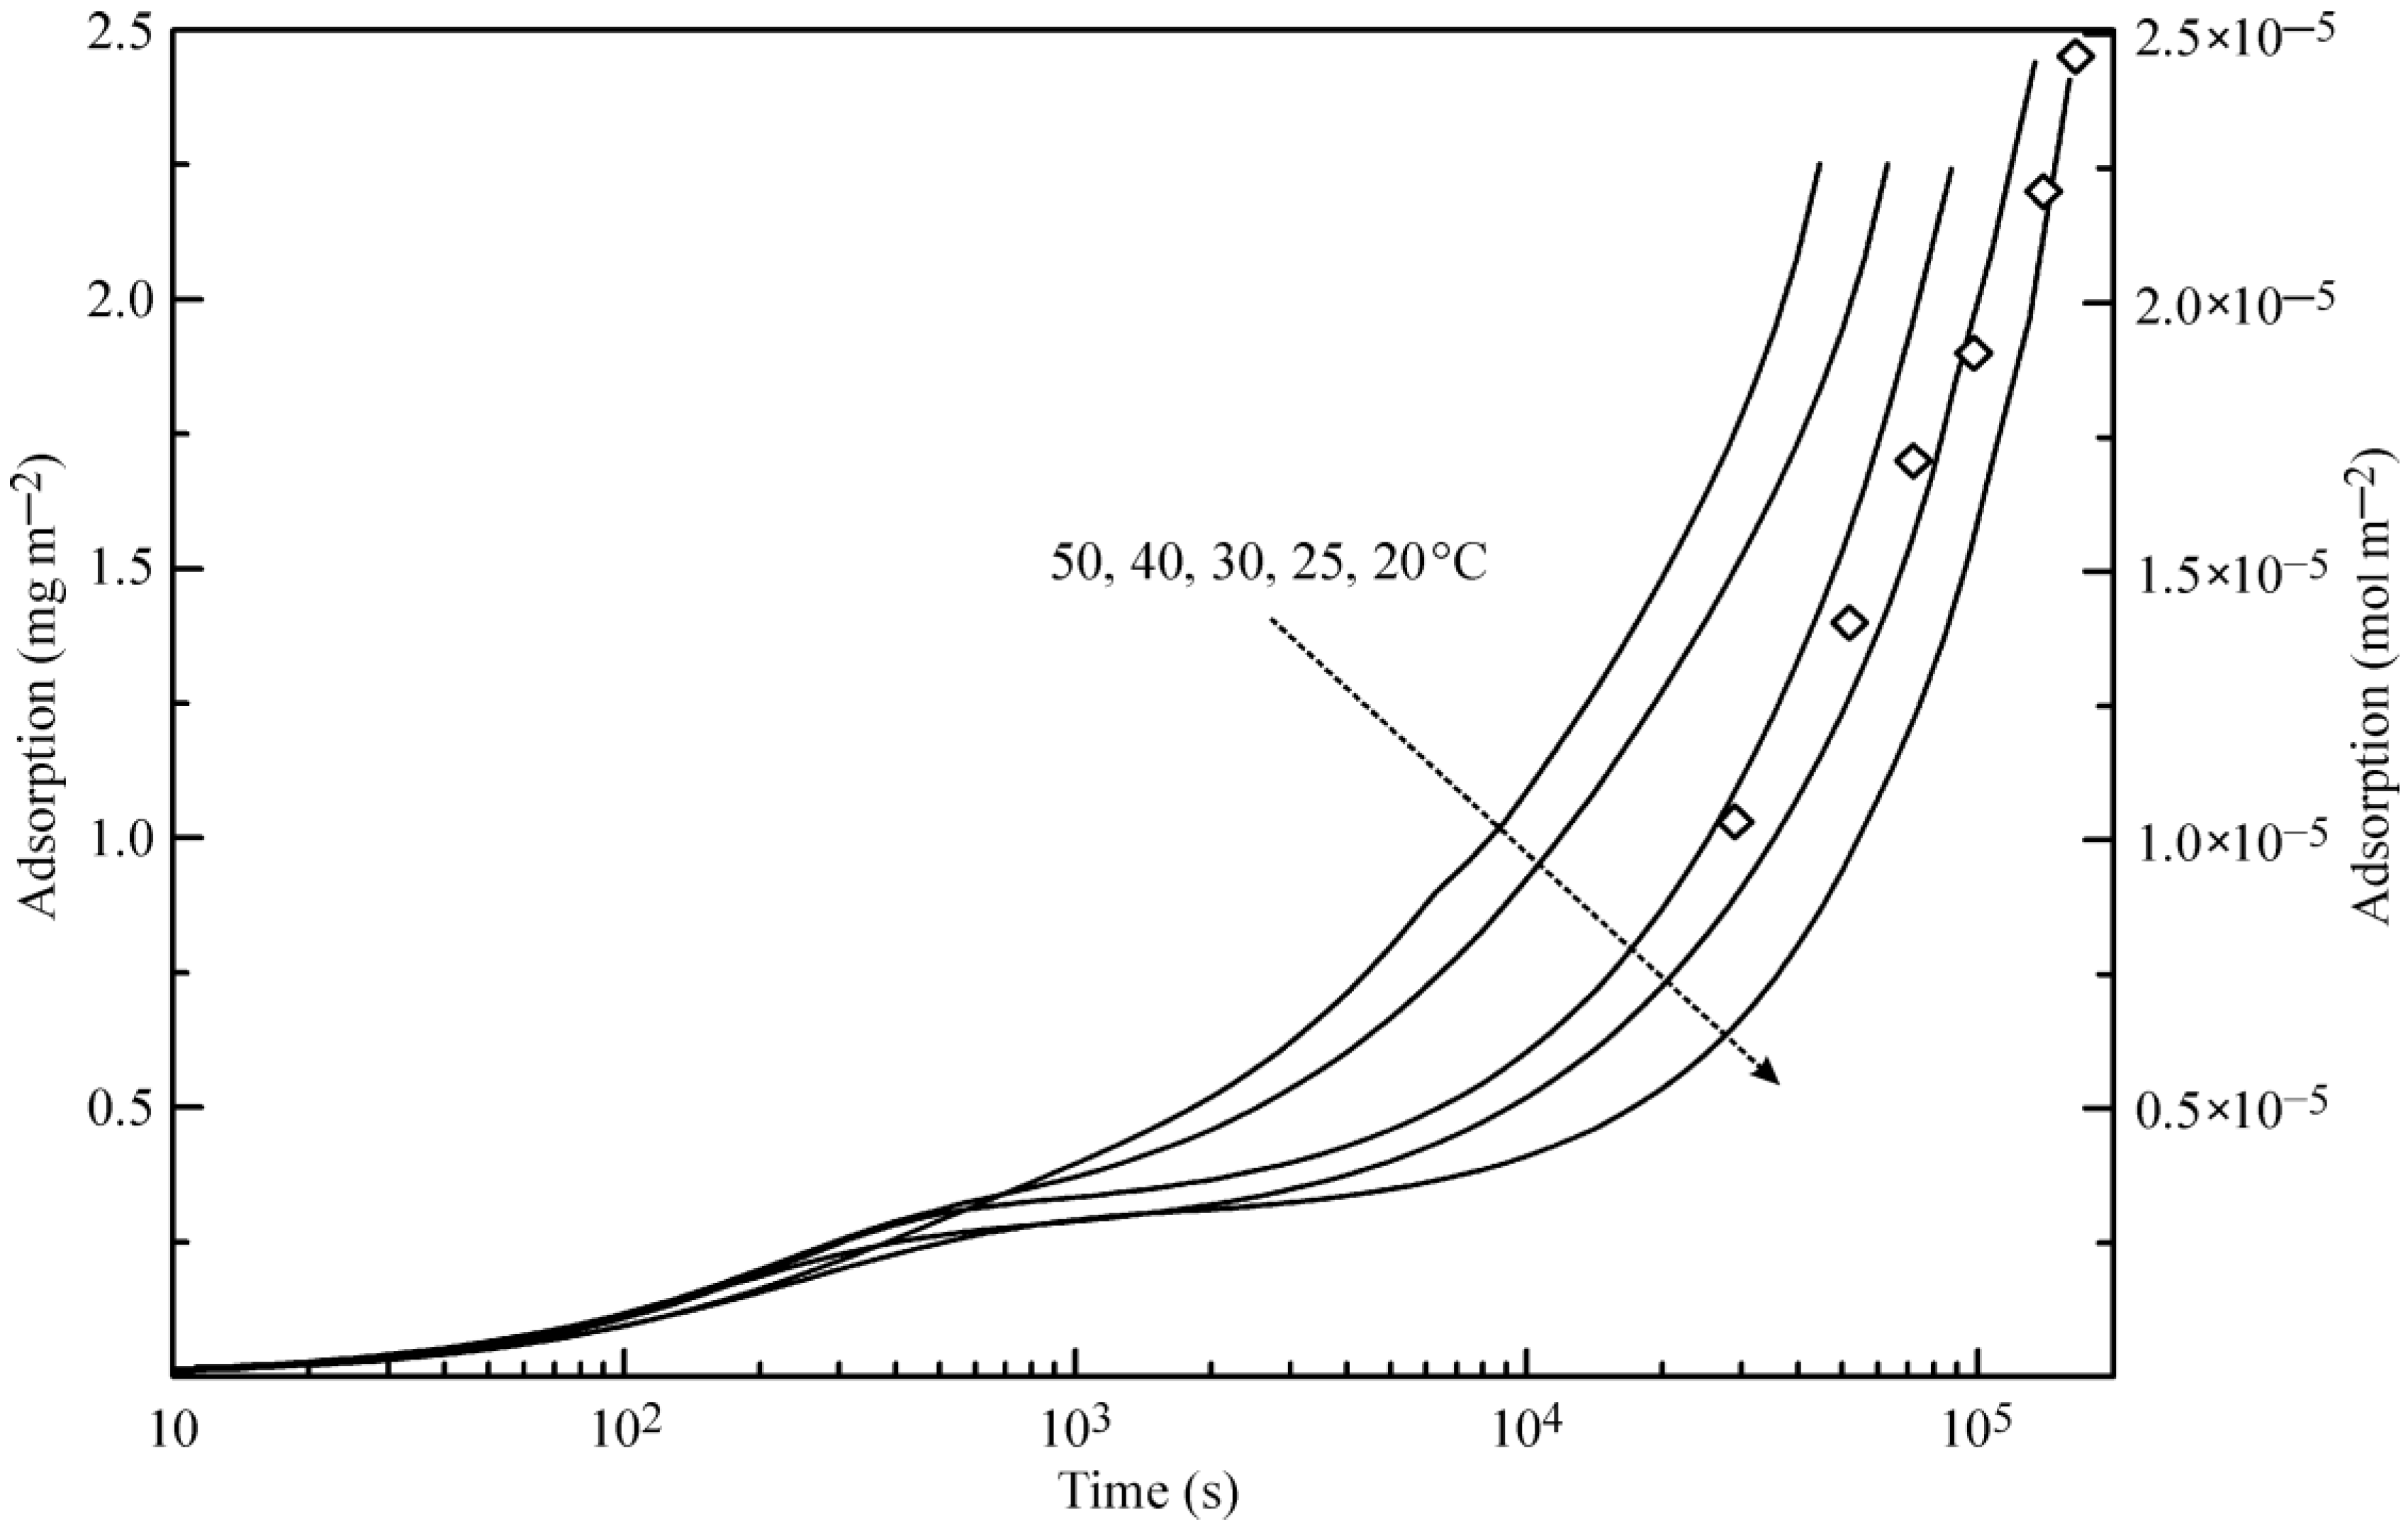
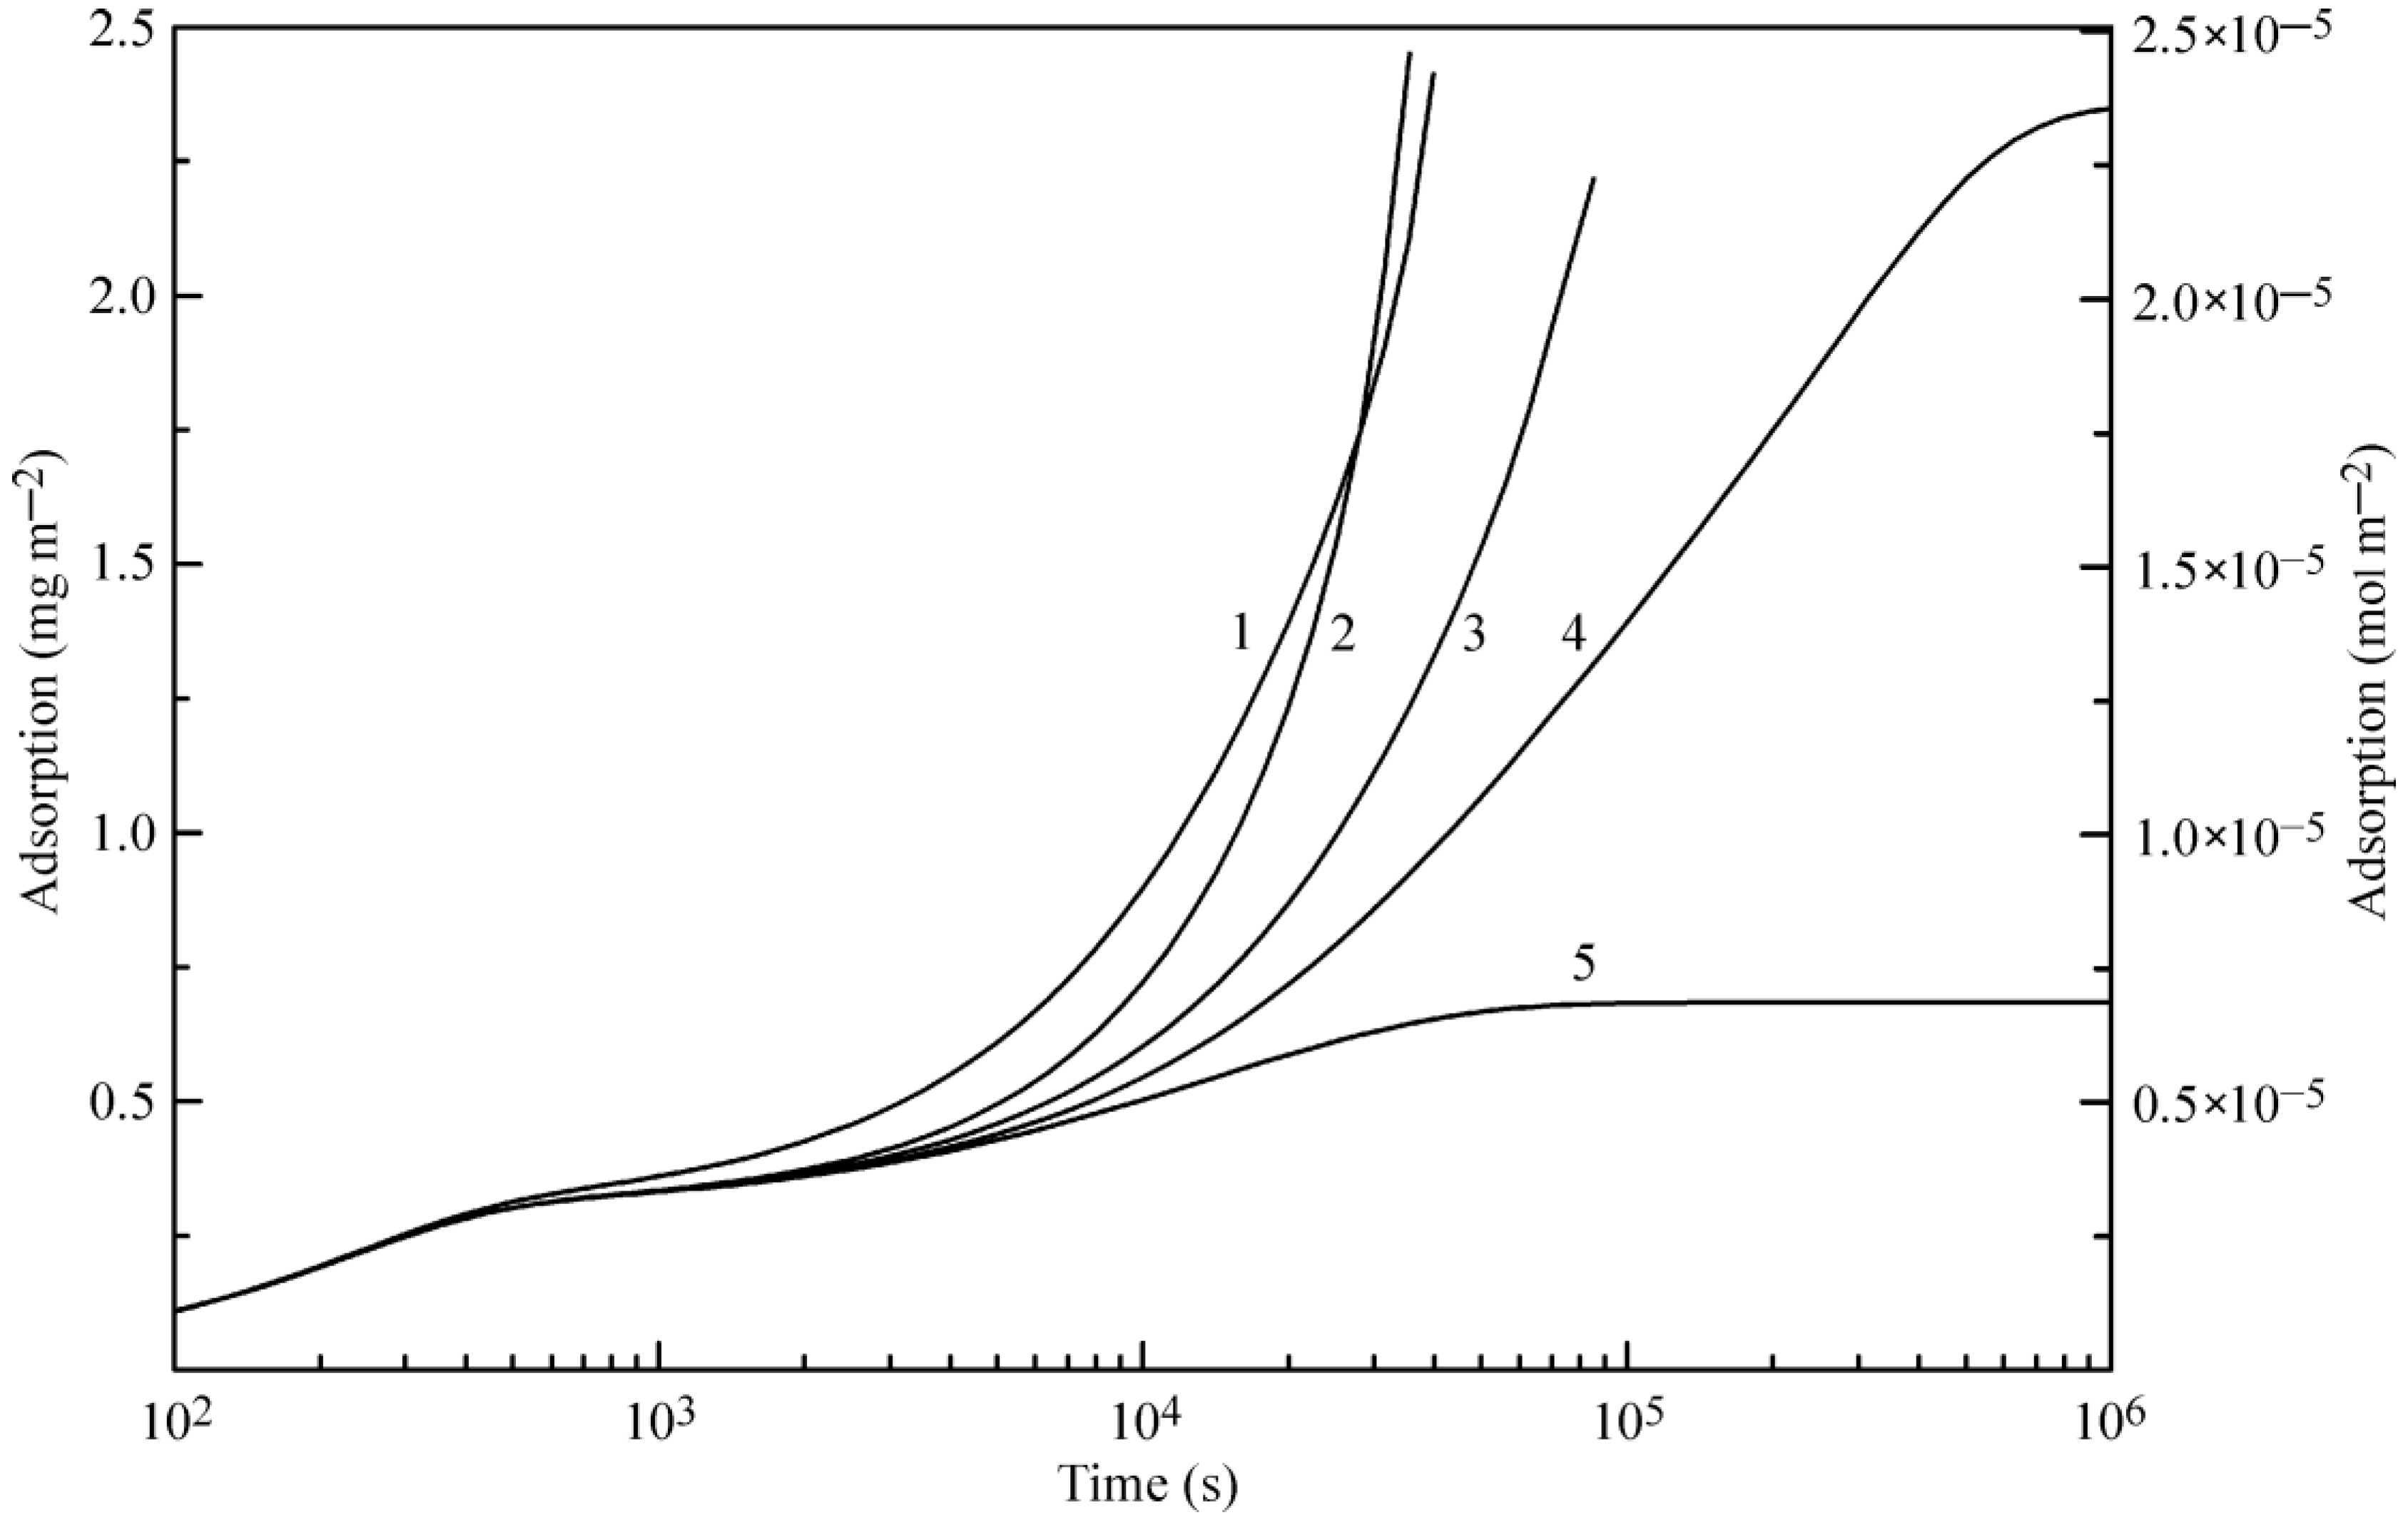
Figure 3 illustrates the theoretical dependence of the adsorption dynamics of heptane at a water drop surface. Similar to the curves shown in
Figure 2, these curves exhibit two characteristic points, which are especially evident at 20 °C.
Figure 3 also shows the experimental data for 25 °C reported in [
6], where the X-ray and neutron reflection methods were used to determine the adsorbed amount of deuterated heptane. Note that the data for the heptane adsorption layer thickness given in [
6] in Angstroms were recalculated here onto the adsorbed heptane mass assuming the value 0.7 kg dm
−3 for the density of liquid heptane. Again, the agreement between the experimental data [
6] and the proposed theory is acceptable.
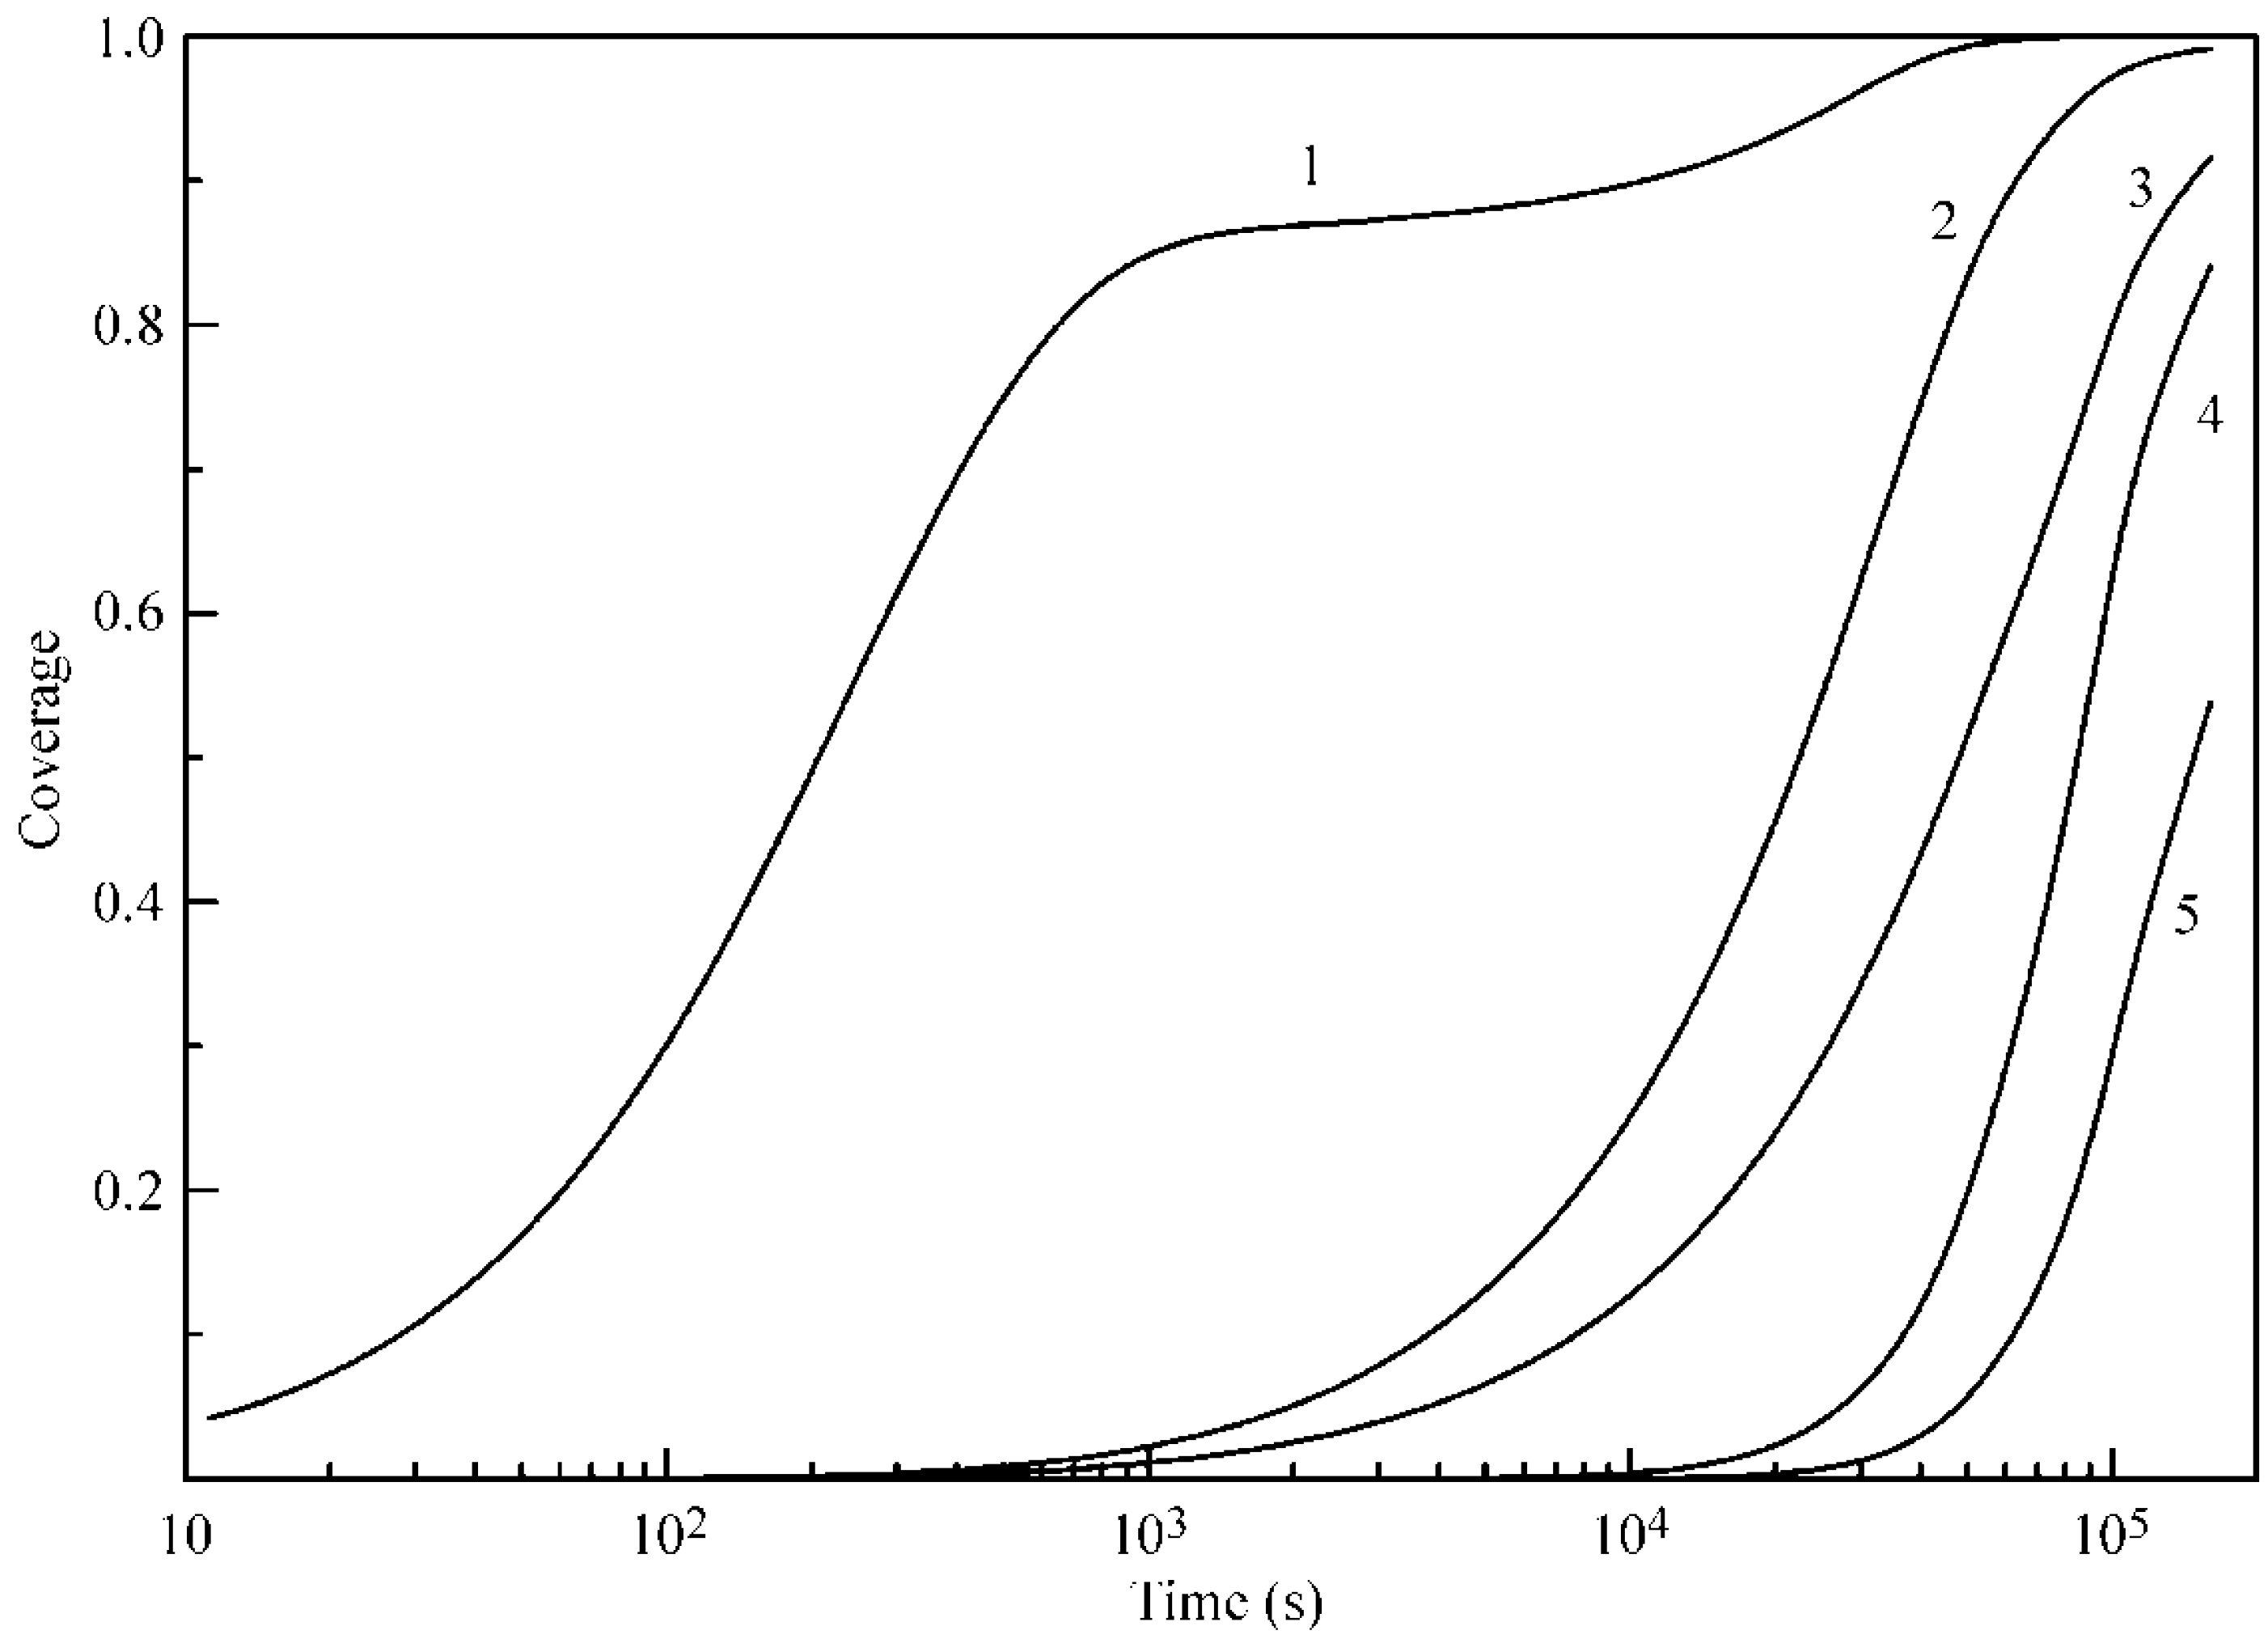
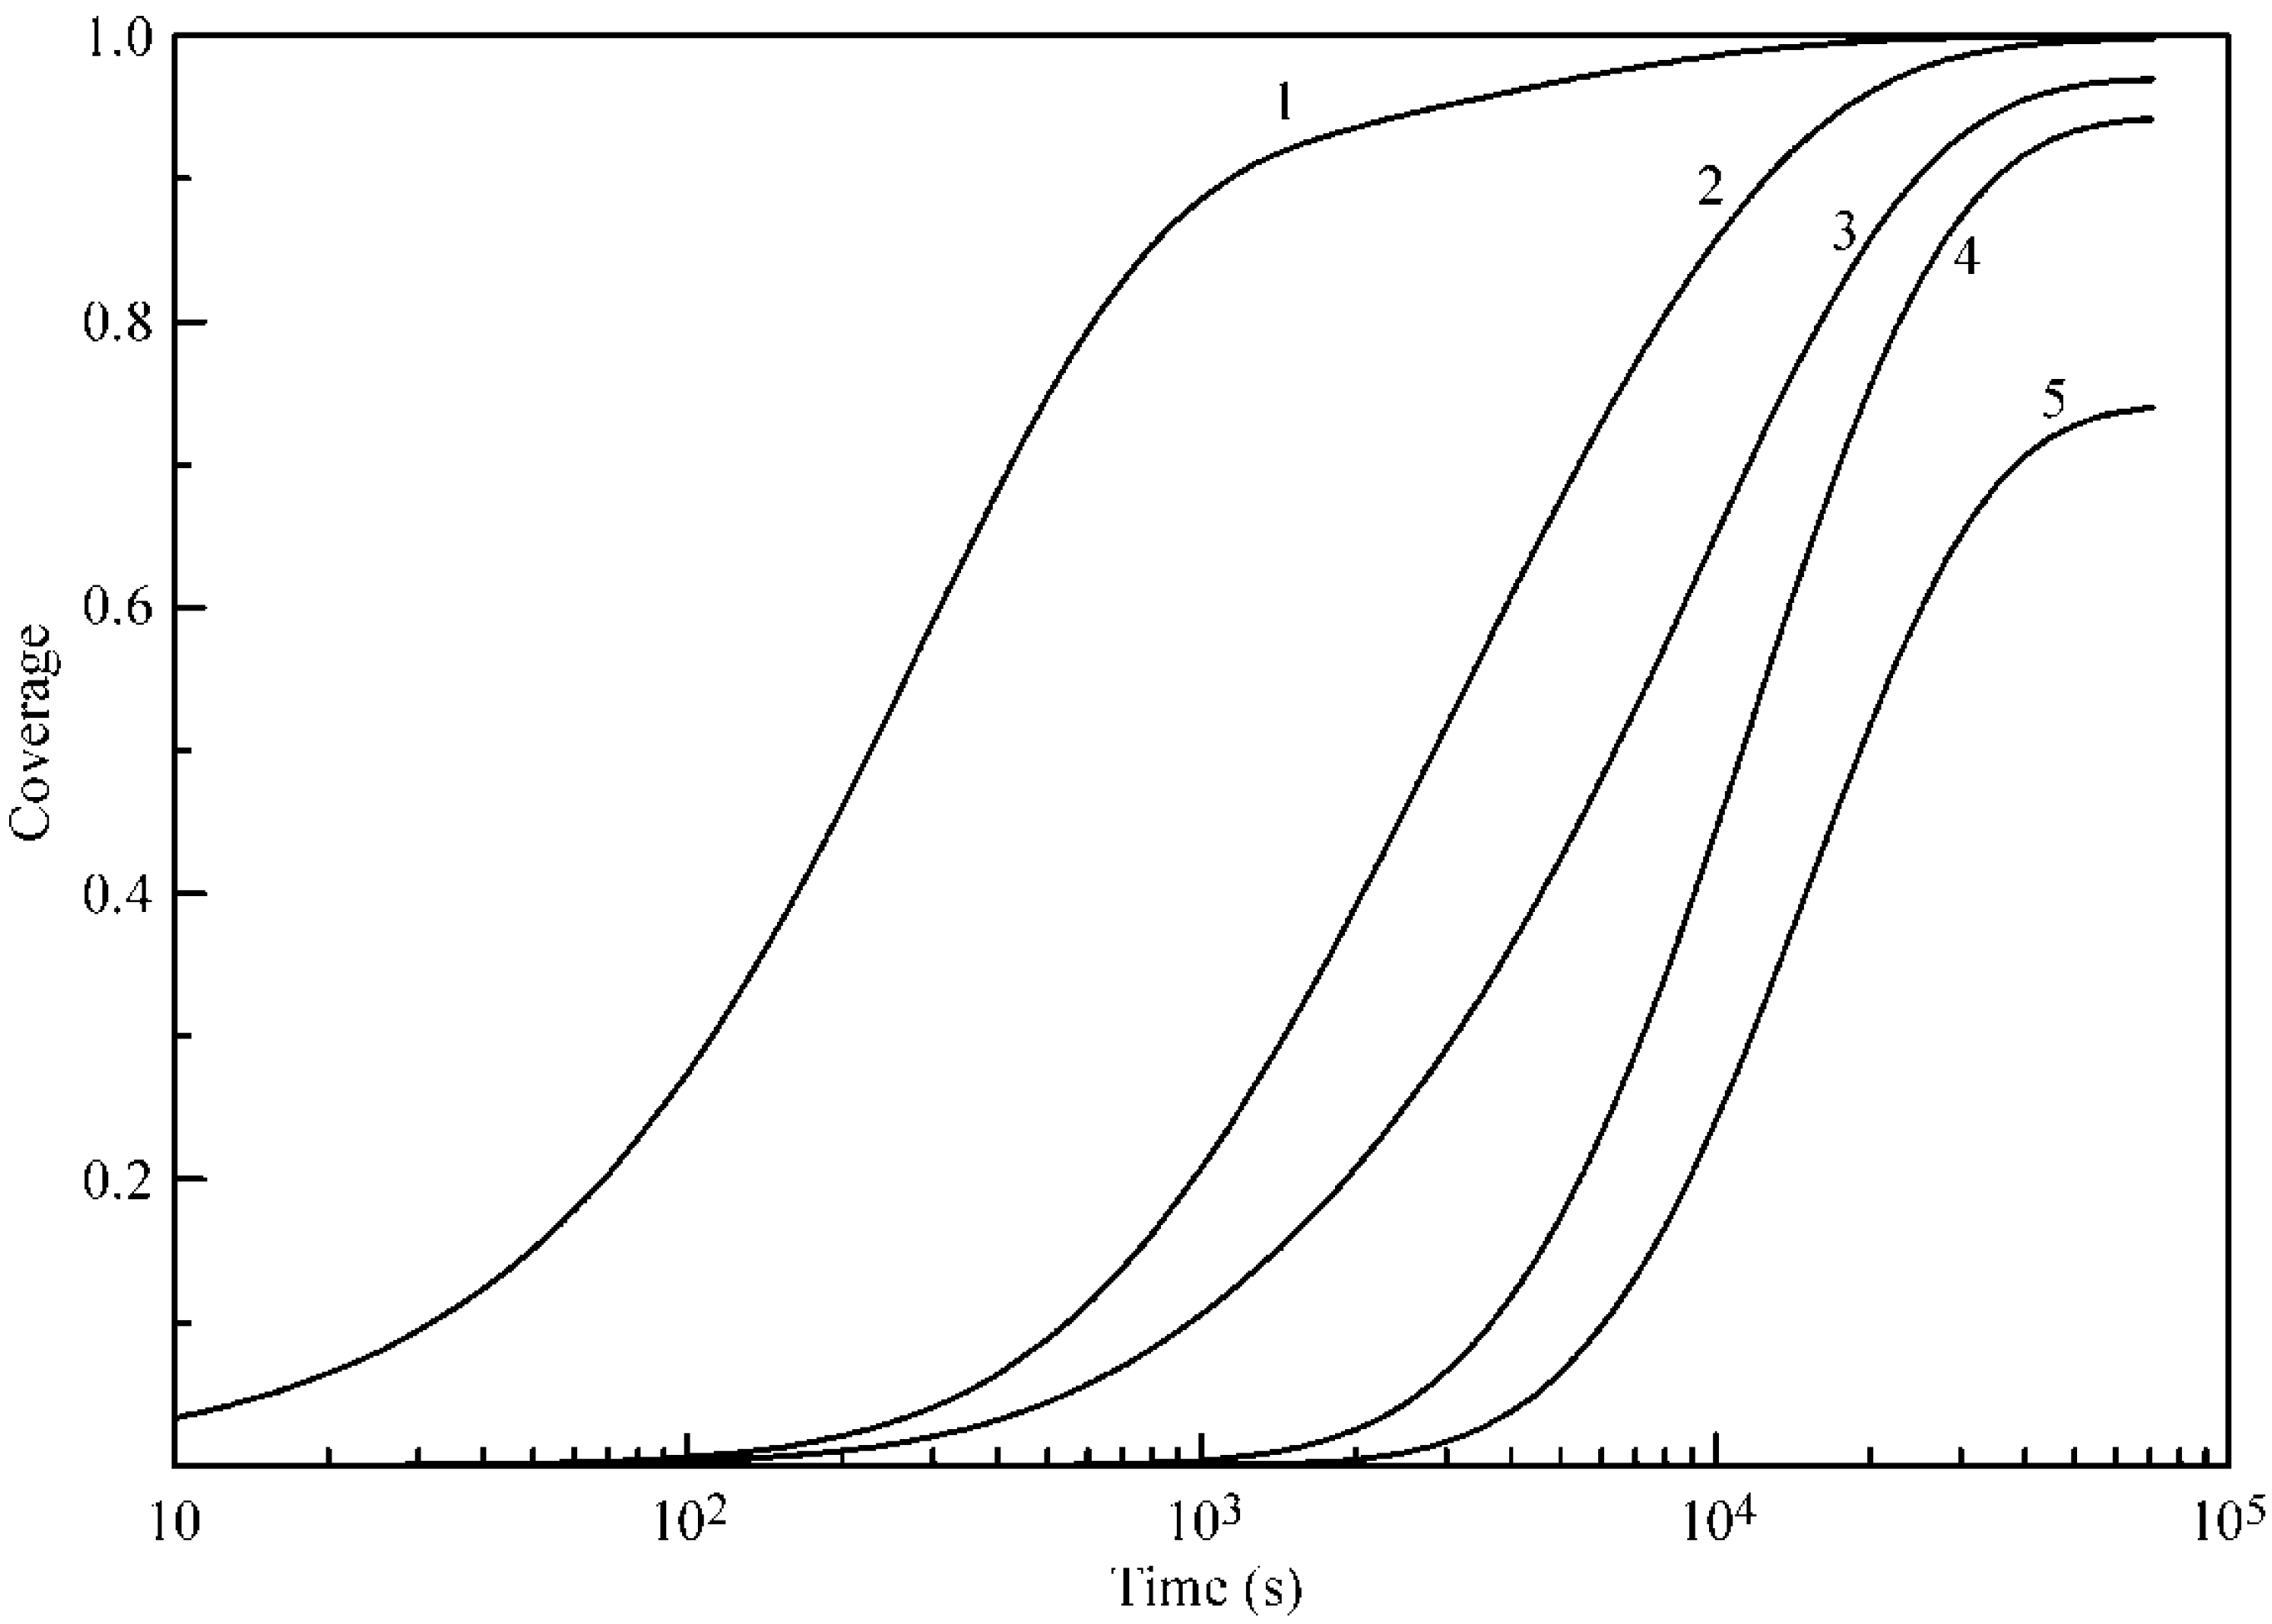
Figure 4 and
Figure 5 illustrate the coverages of the five layers at 20 and 50 °C, respectively. It is seen that, for Layers 2–5, the increase of temperature leads to an increase of coverages, and the difference in the times necessary to attain a certain coverage become shorter. In addition, the coverages of Layers 2–5 are quite high, despite the relatively low b
2 values. We attribute this to the mutual influence of adjacent layers and, in particular, to a decreased desorption rate due to the screening of lower layers by subsequent layers.
The effect of the intrinsic compressibility is quite essential. For example, the calculations for 30 °C and a compressibility coefficient ε = 0.0023 m mN
−1 yield different total adsorption values for the same time of 80,000 s and systems in which different numbers of layers L are assumed: 0.33 × 10
−5, 0.7 × 10
−5, 1.1 × 10
−5, 1.65 × 10
−5 and 2.16 × 10
−5 mol m
−2 for L = 1, 2, 3, 4, and 5, respectively. That is, the increasing number of adsorbed layers in the model system results in an increase of the adsorbed amount in each layer; in particular, for the five-layer model, the adsorbed amount per each layer is 0.44 × 10
−5 mol m
−2. This phenomenon is due to the compressibility effect, i.e., the decrease of the heptane molar area with the increase in surface pressure, cf. Equation (10). Note, however, that a decrease in molar area is accompanied by a respective increase in the thickness of the adsorbed layer, so that the volume per molecule in the layer does not change significantly [
22]. For incompressible adsorbed layers (ε = 0) and L = 5 the calculations yield the total adsorption of 1.65 × 10
−5 mol m
−2, that is, 0.33 × 10
−5 mol m
−2 per each adsorbed layer.
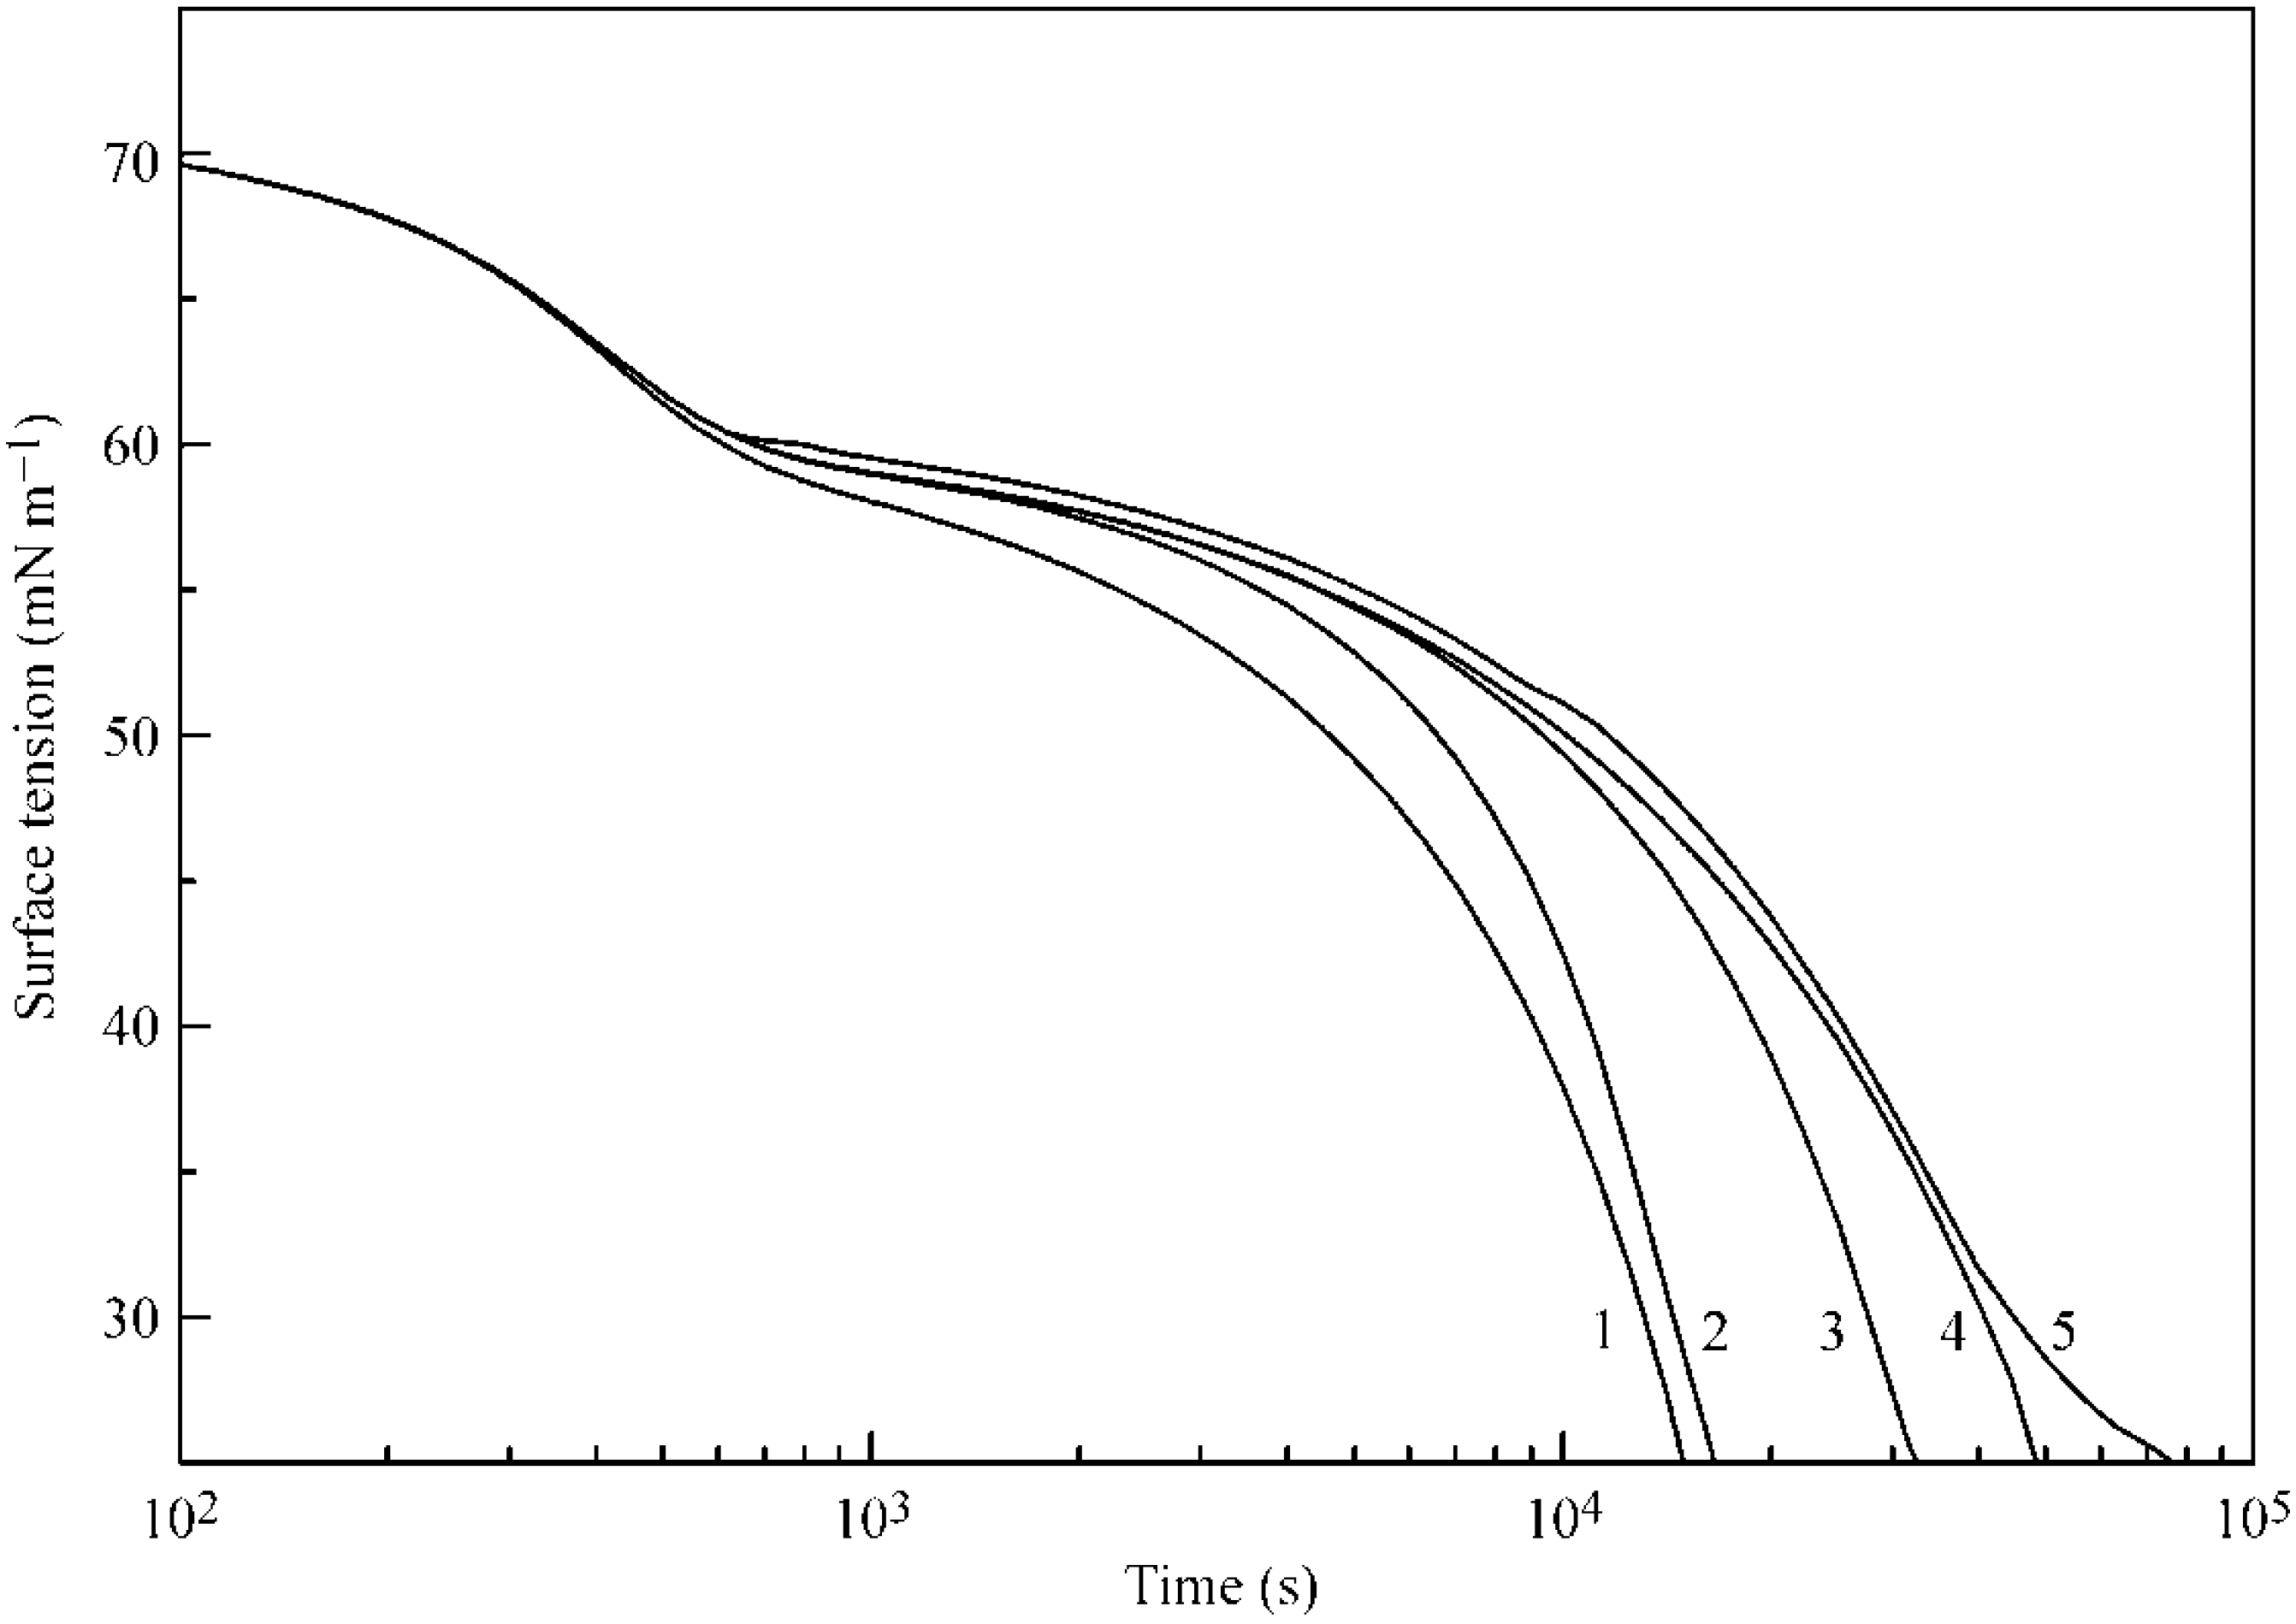
Figure 6 and
Figure 7 illustrate the influence of certain model parameters on the dynamic surface tension and adsorption kinetics, respectively. Curve 3 is reproduced in
Figure 2 and
Figure 3 for 30 °C. Curve 1 was calculated for a b
2 value twice as high as
with
and
listed in
Table 1. Curve 2 was calculated for d
2 = 0 (instead of d
2 = 1.4 as given in
Table 1). Both the increase of b
2 and the decrease of the adsorption and desorption activation energies (related to d
2) quite expectedly result in an increased adsorption rate. Curve 4 corresponds to a
2 = 0 (instead of a
2 = 1.0 as given in
Table 1): this corresponds to the increase of the adsorption activation energy and results in a decreased adsorption rate (note that the decrease of
corresponds to an increase of
, i.e., to the increase of the adsorption activation energy at the same values of other parameters). Curve 5, which was calculated for systems with only two layers instead of five, shows higher surface tension, and not only a slower kinetics, but also very low adsorption value, as was already discussed above.
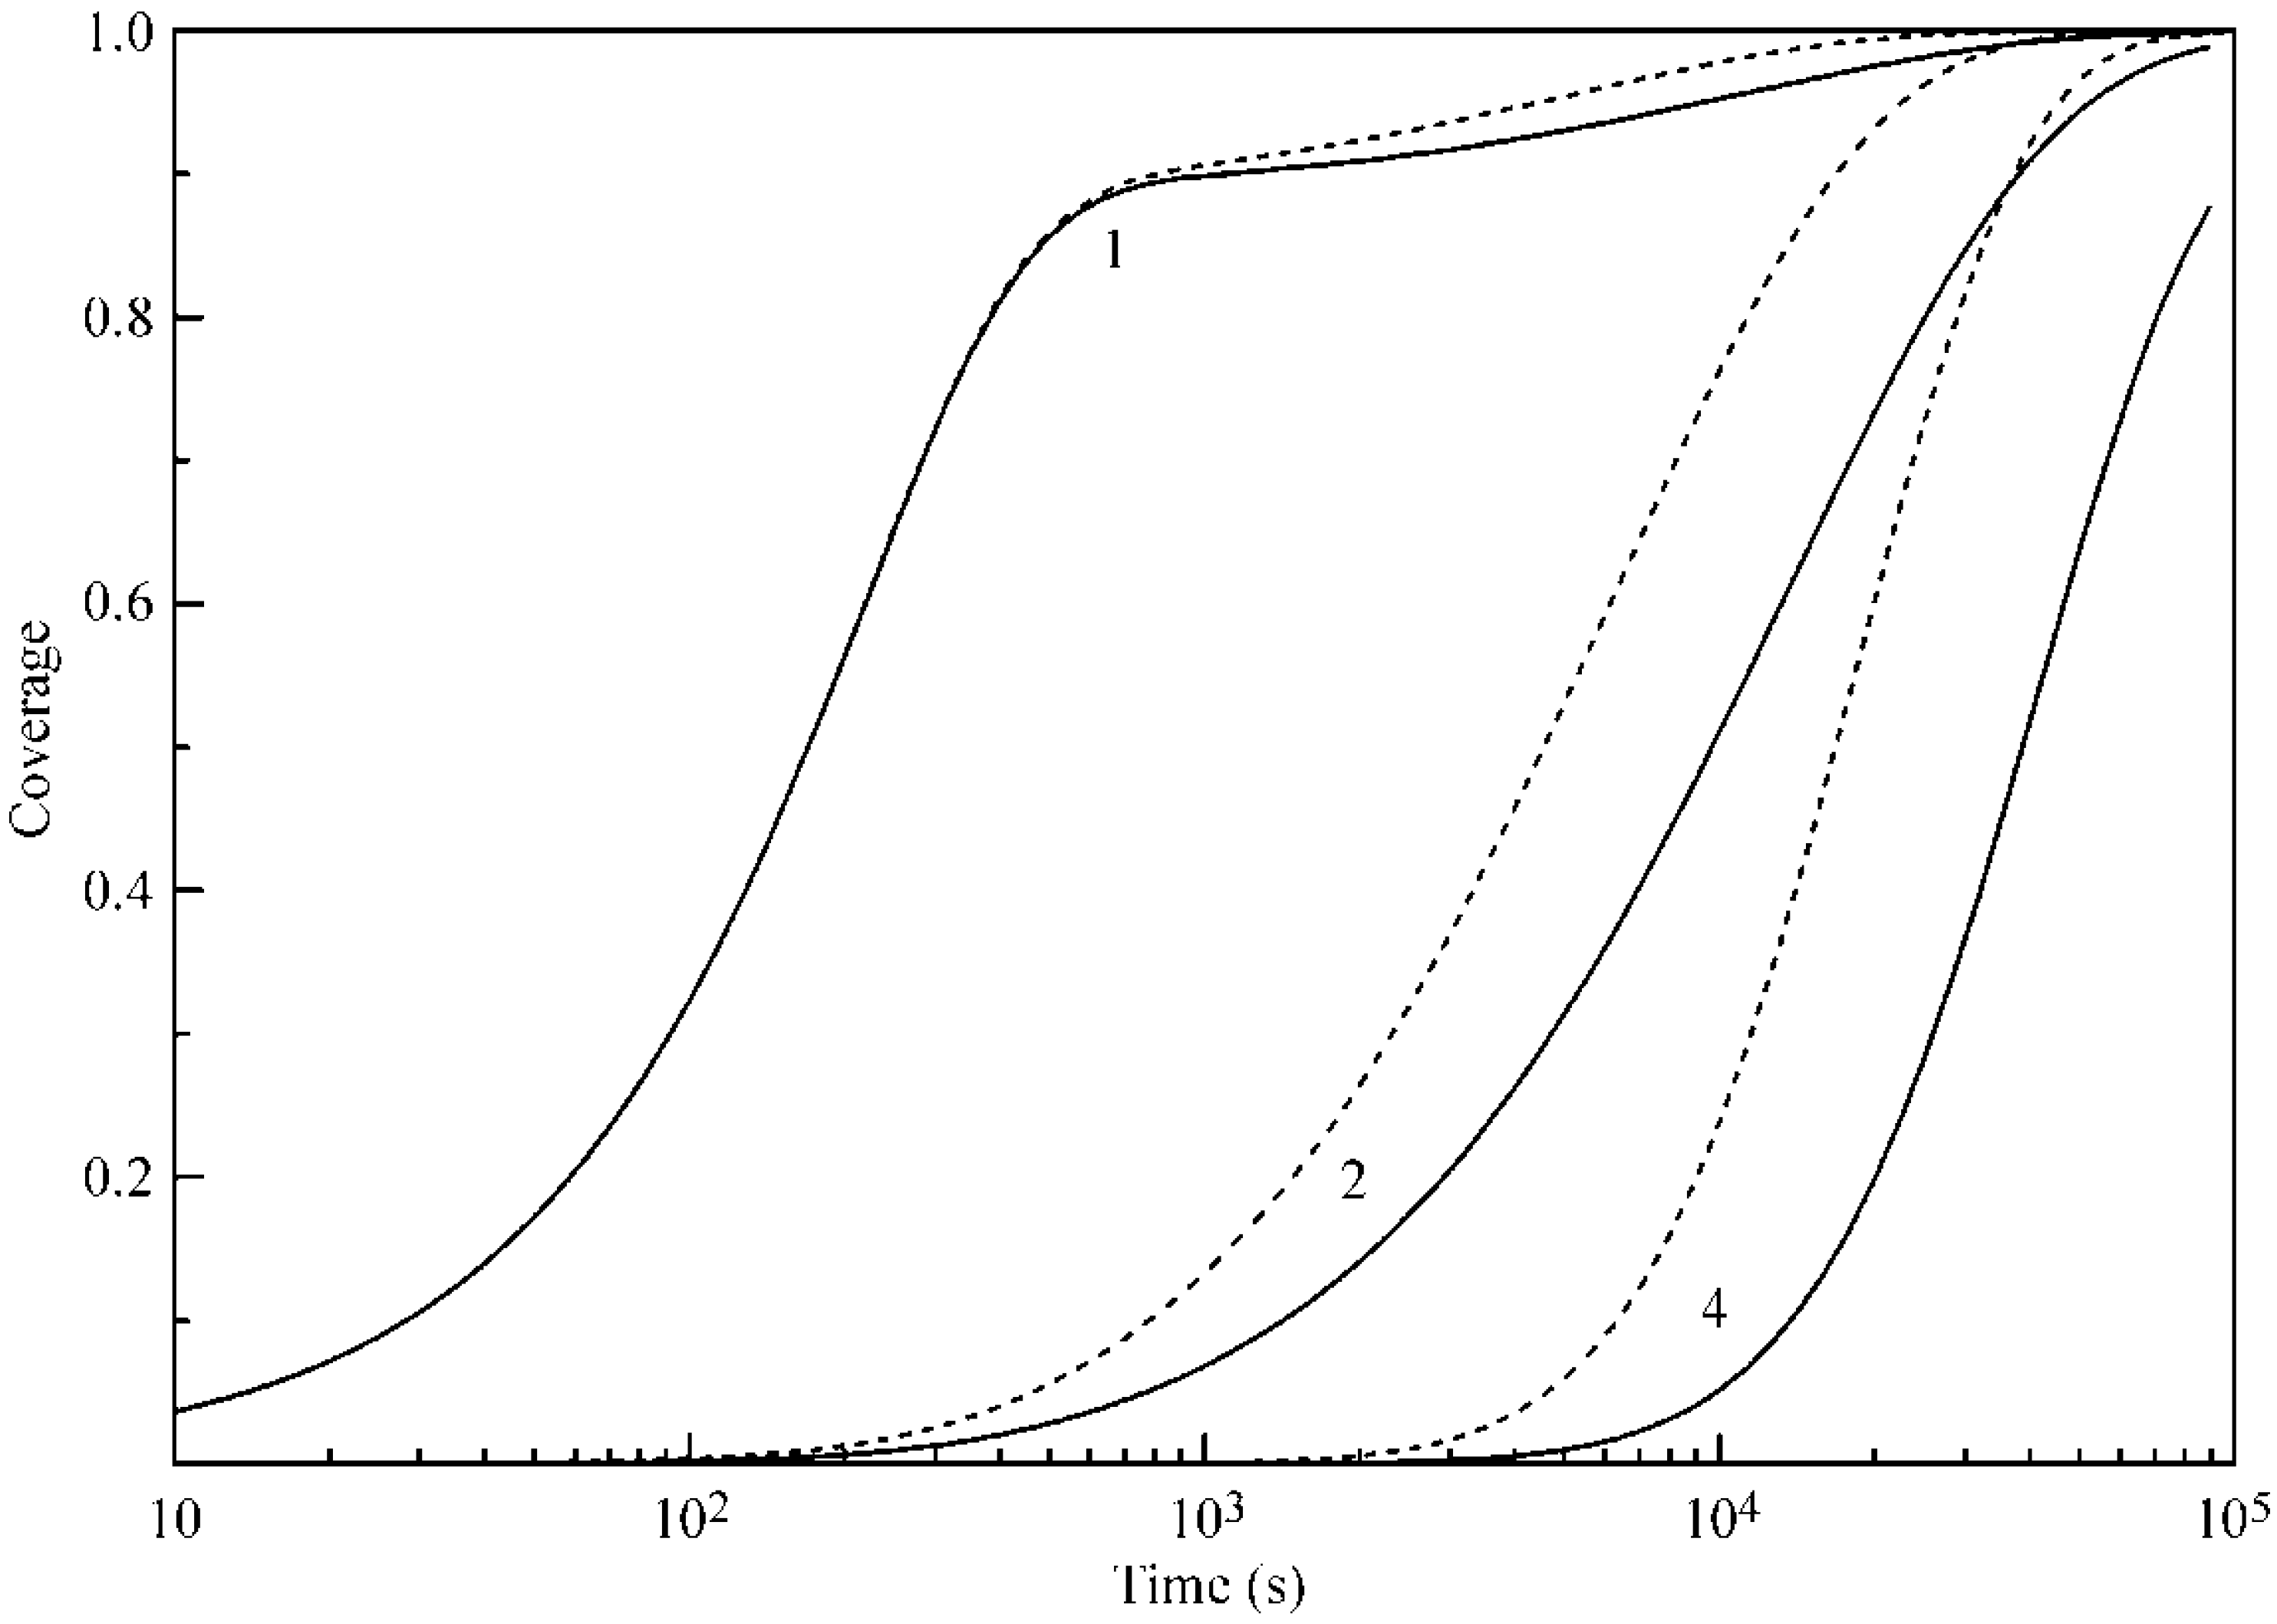
In
Figure 8, the time dependencies of the coverages of Layers 1, 2 and 4 at 30 °C are shown. Solid curves correspond to the values calculated with the parameters listed in
Table 1, while, for the calculations shown by the dashed curve, the parameter b
2 was twice increased as compared to that in
Table 1. It is essential that the increase of b
2 value not only leads to an acceleration and increase of adsorption in the second and further layers, but also enhances the adsorption in the first layer. This phenomenon, as was already mentioned above, is due to the hampering of the desorption from the first layer because of the enhanced formation of the second (and further) layers.


