1. Introduction
Predicting company bankruptcy has become increasingly vital in today’s volatile financial landscape, where timely interventions can significantly mitigate risks for investors and stakeholders. The traditional methods of bankruptcy prediction often rely on financial ratios and statistical models, which may not fully capture the complexities of modern financial data. Corporate bankruptcy prediction represents a crucial domain in financial risk management and economic stability research. The ability to accurately forecast potential financial distress enables stakeholders—including investors, creditors, and regulatory bodies—to make informed decisions that mitigate losses and maintain market confidence (Mai et al., 2019) [
1]. As economic landscapes become increasingly complex, traditional statistical methods for bankruptcy prediction face limitations in capturing the multidimensional nature of financial distress indicators.
The importance of bankruptcy prediction extends beyond individual stakeholders to broader economic systems. As Zięba et al. (2023) [
2] emphasize, accurate bankruptcy forecasting serves as an early warning system that can prevent cascading failures within interconnected financial networks. This predictive capability becomes particularly vital during periods of economic uncertainty, where undetected financial vulnerabilities can rapidly transform into systemic crises.
Recent research highlights that effective bankruptcy prediction models can potentially save billions in economic losses by providing timely signals for intervention. Their findings demonstrate that even marginal improvements in predictive accuracy translate to substantial financial benefits for both private institutions and regulatory bodies. Furthermore, Alaminos et al. (2022) [
3] establish that the growing complexity of global financial systems has increased the urgency for more sophisticated and accurate bankruptcy prediction mechanisms, particularly as cross-border financial integration intensifies the potential for contagion effects.
Despite the significant advancements in predictive modelling techniques, bankruptcy prediction continues to present substantial challenges. Financial data often exhibits non-linear relationships and temporal dependencies that traditional models struggle to capture effectively. Additionally, the inherent class imbalance in bankruptcy datasets—where solvent companies typically outnumber bankrupt ones—creates methodological hurdles for conventional classification approaches (Alaka et al.) [
4].
The recent advancements in machine learning and deep learning techniques present new opportunities to enhance prediction accuracy by leveraging vast datasets. This study introduces a novel approach that combines Convolutional Neural Networks (CNNs) and Generative Adversarial Networks (GANs) to convert financial statements into grayscale images, enabling a more detailed analysis of company performance. To address the limitations of existing datasets, GAN-based data augmentation is employed to generate synthetic financial data that closely replicates real-world patterns, thereby expanding the training dataset. This innovative methodology aims to improve classifier performance, providing a robust framework for predicting bankruptcy among a diverse dataset of 6249 companies, comprising both active and bankrupt firms.
Furthermore, GAN-generated synthetic data for augmenting small datasets can significantly enhance classifier performance. This approach exploits the ability of GANs to produce high-quality and diverse synthetic data that closely mimics real data, thereby expanding the training dataset. In the context of limited data, such augmentation has the potential to improve both classifier accuracy and generalization. However, the quality of synthetic data and the computational resources required to train GANs are important considerations. The potential benefits make this a promising strategy for improving machine learning models when real data is limited.
While synthetic data offers significant advantages for training due to its flexibility, it is crucial to recognize its limitations when used for evaluation purposes. A balanced approach that employs synthetic data for training and validation, combined with real data for testing, may provide a more comprehensive framework to ensure robust and reliable model performance in real-world applications. In this context, synthetic data are utilized exclusively for training and validation, whereas testing is conducted on real data.
The prediction of bankruptcy using a customized model of a CNN trained on a combination of real data and synthetic data obtained from a GAN results in a higher performance than other proposed models.
The choice of CNNs was made mainly to exploit a different approach, shifting away from traditional numerical tabular analysis to a vision-based perspective capable of capturing hidden relationships within the structural composition of financial statements. CNNs, owing to their proficiency in processing image-based data, excel in feature extraction, spatial hierarchy comprehension, and automated pattern recognition. CNNs are also widely employed for similarity recognition, allowing them to identify and compare patterns across various dataset. These properties allow CNNs to uncover complex dependencies within financial statements that might be overlooked in traditional models. Moreover, CNNs demonstrate high efficacy in handling noisy financial data and detecting subtle variations indicative of financial distress, making them suitable for bankruptcy prediction. Beyond the domain of financial analysis, CNNs have been extensively employed in fields such as medical imaging, satellite image analysis, and facial recognition, where similarity detection and image transformation play a crucial role in extracting meaningful patterns from visual data. Additionally, CNNs play an important role in anomaly detection, contributing to cybersecurity applications and fraud detection by identifying irregularities within transactional data.
GANs complement CNNs by addressing data limitations, particularly those associated with small or imbalanced datasets. In financial datasets, bankruptcy cases are often underrepresented, which can result in biased predictive models. GANs mitigate this issue by generating realistic synthetic financial data, mitigating class imbalance and enhancing model generalization. This data augmentation not only improves classifier accuracy but also helps CNNs recognize a wider spectrum of financial distress patterns. By training CNNs on a combination of real and synthetic data, the resulting model exhibits increased robustness, reducing the risk of overfitting while improving predictive performance. Crucially, synthetic data is employed exclusively for training and validation purposes, ensuring that model evaluation is conducted on real-world data to maintain the reliability of performance assessments.
This study integrates advantaged and reliable methodologies for predicting corporate bankruptcy, emphasizing the practical applications and benefits of CNNs and GANs in financial risk assessment.
Distinct from much of the existing literature, this research focuses on small and medium-sized enterprises (SMEs), a segment less frequently examined compared with publicly listed companies. By focusing on SMEs, which are often underrepresented in financial research, this study offers valuable insights into an important segment of the economy. SMEs are critical to economic growth and innovation; however, their financial health has received comparatively limited analytical attention relative to larger, listed firms. This research aims to fill that gap by providing a robust methodological framework to predict bankruptcy within SMEs, thereby contributing to a more comprehensive understanding of financial risk in this important economic segment.
2. Related Work and Research Objectives
In recent years, the field of data-driven prediction and detection systems has witnessed substantial advancements, particularly through the integration of deep learning techniques. A foundational contribution in this area is presented by Hosaka (2019) [
5], who introduced a novel approach by applying CNNs to the domain of bankruptcy prediction. By converting financial ratios from companies’ balance sheets into grayscale images and training a CNN based on the GoogLeNet architecture, Hosaka (2019) [
5] demonstrated that this image-based representation significantly outperformed a range of classical models, including decision trees, support vector machines, and Altman’s Z-score. The study provided early empirical evidence of CNNs’ superior predictive capabilities when applied to financial datasets structured in unconventional formats.
Building directly on this concept, Dzik-Walczak and Odziemczyk (2021) [
6] extended the application of CNNs to the Polish corporate sector. Rather than using time series data, they reformatted cross-sectional tabular data to be CNN-compatible, offering a further validation of CNNs’ versatility. Their study also emphasized the crucial role of data preprocessing, a common bottleneck in financial machine learning, and benchmarked CNN performance against traditional classifiers such as logit models, random forests, and XGBoost. While their findings confirmed CNNs’ competitiveness, they also underscored that preprocessing strategies significantly affect model performance, suggesting that data representation remains a critical design choice in financial prediction pipelines.
However, both studies relied on datasets of moderate size (thousands of records), raising questions about the scalability and transferability to domains where data is inherently scarce, such as early-stage firms or niche financial sectors. This limitation is explicitly addressed in the recent comprehensive review by [
7], which provides a systematic exploration of deep learning techniques designed for small datasets. Using a PRISMA-based methodology, the review analyses over 175 publications, mapping the evolution of approaches such as few-shot learning, meta-learning, and lightweight GAN-based augmenters. In doing so, it reframes the small data context not as a constraint, but as an opportunity to develop models that are both computationally efficient and strategically impactful.
The added value of [
7] is threefold. First, it advocates a “quality over quantity” paradigm, illustrating how models tailored to small data can offer faster and more precise insights in sensitive domains like medical diagnostics or small-scale industrial forecasting. Second, it raises a critical equity concern in the AI research ecosystem: by quantifying the dependence of much of today’s deep learning progress on MAANG-scale datasets, it exposes a growing disparity between resource-rich institutions and smaller actors. Finally, it provides a forward-looking research agenda, identifying open problems such as generalization under severe domain shifts and suggesting novel hybrid strategies (e.g., combining symbolic AI with neural architectures) to address them.
In line with this trajectory, the work of Ben Jabeur, Sami, and Vanessa Serret [
8] presents another meaningful advancement by proposing a Fuzzy Convolutional Neural Network (FCNN) architecture. Their model integrates fuzzy logic—particularly effective for handling uncertainty and imprecision in financial indicators—with the hierarchical feature learning of CNNs. By applying this hybrid approach to a diverse dataset of financial statements from SMEs obtained from the Orbis database, the study contributes a robust method for bankruptcy prediction under real-world, noisy conditions. Importantly, this work also reinforces the broader narrative initiated by [
7], namely, the need to develop adaptable, explainable, and high-performance models for data-constrained settings.
Together, these studies form a coherent research arc. Hosaka [
5] and Dzik-Walczak & Odziemczyk [
6] validate the applicability and performance of CNNs in bankruptcy prediction, setting a strong empirical foundation. The meta-review in [
7] critically situates this research within the broader challenge of data inequality and proposes methodologies for scaling deep learning to low-resource contexts. Finally, ref. [
8] exemplifies one such approach through the novel use of fuzzy logic, expanding the toolkit for tackling financial risk analysis under uncertainty.
In the realm of generative models, the seminal work by Goodfellow et al. (2020) [
9] introduced GANs, a groundbreaking framework for data generation through adversarial training. This architecture, composed of a generator and a discriminator trained in a minimax game, demonstrated the capability to generate high-fidelity synthetic images. Goodfellow’s contribution catalyzed a significant shift in machine learning research, providing the foundation for subsequent advancements in image synthesis, data augmentation, and adversarial modelling.
Expanding on this foundation, Nayak and Rout (2024) [
10] applied GANs to address data imbalance in the financial domain, specifically for bankruptcy prediction. Their study compared the performance of two data augmentation techniques, SMOTE-Tomek and GANs, across three predictive models (ANN, CNN, and LSTM). The superior results achieved with GAN-augmented data across all models underscore the adaptability and effectiveness of adversarial frameworks in enhancing prediction accuracy where real-world data availability is limited.
Pushing the boundaries of synthetic data generation, a more recent study introduces the GAN-ST model [
11], which innovatively combines the Deep Convolutional GAN (DCGAN) and Conditional GAN (CGAN) architectures. By training two GANs independently, the GAN-ST model captures the diverse facets of the data distribution, thereby producing richer synthetic datasets. Notably, this model achieves 99.38% accuracy on MNIST, just 0.05% below the baseline using real data, and outperforms single-GAN models by 0.66% and 7.06% on MNIST and CIFAR-10, respectively. These results highlight two critical contributions: (1) improved coverage of the data manifold through architectural enhancements, (2) superior generalization via distributional diversity, both pivotal in contexts characterized by data scarcity.
The practical utility of CNNs, particularly when augmented with synthetic data, is further exemplified in the work of Nalayini et al. (2023) [
12], who address the challenges of credit card fraud detection. By integrating CNNs with a smart matrix-based feature selection strategy and balancing the dataset through random undersampling, the authors achieve superior accuracy compared with traditional models. This study underscores CNNs’ potential to detect nuanced patterns in high-risk financial environments.
Demonstrating their cross-domain adaptability, CNNs have also been effectively employed in cybersecurity. Akhtar and Feng (2022) [
13] propose a hybrid deep learning model combining CNNs and LSTMs to capture spatial and temporal features for real-time malware detection. Their strategy involves transforming malware binaries into grayscale images, further emphasizing the viability of image-based deep learning in pattern recognition beyond financial contexts.
Complementing this trend, Chen et al. (2023) [
14] incorporate textual variables from corporate annual reports into bankruptcy prediction models. Through the implementation of Random Forest, XGBoost, and other classifiers, they find that the inclusion of qualitative communicative data significantly improves predictive performance, especially in reducing Type II errors. Similarly, Mai, Tian, and Lee (2019) [
1] demonstrate that deep learning models trained on textual disclosures outperform traditional approaches, revealing the untapped predictive value of narrative financial reporting. These findings collectively point to the importance of multimodal inputs—both structured and unstructured—in enhancing the robustness of predictive models.
Building upon structured data transformation, Du Jardin (2022) [
15] presents a novel topological encoding of financial data to improve CNN performance. By reconfiguring financial ratios into topological representations, the study shows that CNNs can better capture latent structural patterns. This contribution is particularly relevant for financial distress prediction where traditional numerical formats may obscure critical relationships among indicators.
Wyrobek (2019) [
16] offers a comparative evaluation of bankruptcy prediction models applied to Polish companies. The study assesses a variety of algorithms, including discriminant analysis, logit, random forest, and CNNs, highlighting that deep learning models, particularly CNNs, can extract complex relationships in financial data, thus outperforming more classical approaches under certain conditions. This reinforces the trend that advanced neural networks provide value through their ability to model non-linear, high-dimensional interactions.
Further integrating optimization techniques, Elhoseny et al. (2022) [
17] propose a financial distress model that combines a deep neural network with the Adaptive Whale Optimization Algorithm (AWOA). Their hybrid AWOA-DNN architecture achieves a high predictive accuracy by fine tuning hyperparameters through bio-inspired optimization, marking an important step toward explainable and tunable AI models in financial forecasting.
In parallel, deep learning has been at the forefront of innovations in cybersecurity, particularly in ransomware and malware detection. Homayoun et al. (2019) [
18] introduced DRTHIS, a deep learning system that leverages CNNs and LSTMs to classify ransomware families based on behavioural patterns. The efficacy of CNNs in learning complex malicious behaviours is further validated by Almomani et al. (2023) [
19], whose E2E-RDS system uses the visual analysis of binary files and CNN-based architectures to achieve a high classification accuracy.
Yang et al. [
20] reinforce the effectiveness of static feature analysis through CNNs in ransomware classification. Their model achieves near-perfect detection rates (99.77%) across a wide range of ransomware variants, proving that even shallow convolutional structures can yield remarkable results when coupled with carefully engineered feature representations.
The use of CNNs for malware detection continues in Singh et al. [
21], where malware binaries are converted into images and classified using ResNet-50 and dense CNNs. Their method attains accuracy scores above 98%, showcasing the power of visual deep learning approaches in circumventing traditional static and dynamic analysis limitations.
Building on this, Omar [
22] optimizes a CNN architecture from the ground up, achieving 99.18% accuracy by targeting model compactness and generalizability, which are crucial features for deployment in fast-evolving malware environments. His findings confirm that CNNs, when properly optimized, can exceed the limitations of legacy detection models.
Finally, Atitallah et al. [
23] apply ensemble learning and transfer learning to the IoT domain for malware classification. By integrating ResNet18, MobileNetV2, and DenseNet161 within a random forest voting framework, they achieve a 98.68% classification accuracy on the MaleVis dataset. Their ensemble approach confirms the viability of CNNs in constrained domains like the IoT, where training new models from scratch may be computationally infeasible.
While the works cited above focus on cybersecurity, our research pivots toward an equally high-stakes application: bankruptcy prediction. By transforming tabular financial data into image-like matrices and augmenting the training set with synthetic data from enhanced GAN architectures, our approach extends the proven efficacy of CNNs from digital threat detection to economic risk modelling. This cross-domain translation affirms the flexibility and power of CNNs in identifying complex patterns in both financial and cyber domains.
The originality and added value of this project lie in its approach to data augmentation and evaluation within the framework of CNNs. Traditional datasets available online, such as those provided by Bureau van Dijk, were insufficient in size to achieve robust results. To address this limitation, the dataset was expanded using synthetic data, a strategic enhancement that not only increased its volume but also introduced greater diversity and complexity. This methodology enabled a more comprehensive assessment of the CNN’s performance, offering insights into how synthetic data can improve model generalization and predictive accuracy. This research strengthens the connection between real and synthetic datasets, enhancing machine learning capabilities in environments with limited data availability. By doing so, it fosters the development of more scalable and flexible AI solutions.
This research establishes a novel approach to bankruptcy prediction by transforming financial data into image-based representations and leveraging deep learning techniques. The objectives of this study are centred around enhancing the predictive accuracy and expanding the applicability of CNNs in financial risk assessment. The main goals of this research include the following:
Develop an innovative methodology to predict corporate bankruptcy by utilizing deep learning techniques, specifically CNNs, to analyze financial data in an entirely new format. Instead of relying on conventional numerical processing methods, this approach converts financial statements into structured grayscale images, allowing for enhanced pattern recognition and deeper insights into financial stability.
Transform numerical financial variables into visual representations through a rescaling process that maps each data point to a pixel value within a defined grayscale range (0–255). This transformation enables the structured encoding of financial information, making it possible for CNNs to identify intricate relationships between variables that might remain undetected when using traditional analysis techniques.
Leverage GAN-based data augmentation to improve model training and generalization in cases of data scarcity.
Make accessible predictive analytics for SMEs by creating a scalable methodology for firms with limited data availability or resources. Unlike traditional bankruptcy prediction models, which primarily focus on listed companies influenced by stock market fluctuations, this approach is tailored to SMEs, a segment often overlooked in financial research, helping them assess financial distress with AI technology.
Position CNN-based financial risk assessment as an AI innovation, integrating deep learning into business decision making and risk management. By reshaping how financial information is processed and understood, this research establishes a foundation for future developments in AI-driven financial analysis, encouraging organizations to adopt data-driven strategies for proactive risk mitigation.
3. System Description
This project adopts an innovative approach to predicting company bankruptcy by integrating the strengths of CNNs and GANs. The underlying methodology begins with converting financial statements, typically composed of numerical and textual data, into grayscale images. This transformation enables the application of image-based deep learning techniques to a domain that is conventionally non-visual, unlocking new possibilities for feature extraction and analysis.
The next step leverages GANs to address critical challenges in financial data, such as limited sample size and class imbalance. By generating synthetic financial data that closely replicates real-world patterns, GANs enhance the dataset’s comprehensiveness and representativeness. This augmented dataset, consisting of both real and synthetic samples, is subsequently utilized to train a CNN classifier. CNNs are particularly adept at capturing intricate patterns and hierarchical features within data, making them well suited for identifying subtle trends or anomalies in the grayscale images that may indicate financial distress.
This entire pipeline is implemented in Python 3.12, employing a suite of powerful libraries to streamline the workflow. Data manipulation and preprocessing are conducted using Pandas and NumPy, ensuring that the financial data is clean and well structured. The core deep learning components are developed by TensorFlow/Keras, which provides an extensive suite of tools for constructing and training both CNNs and GANs.
Hence the system description has been designed as follows:
3.1. Data Preprocessing
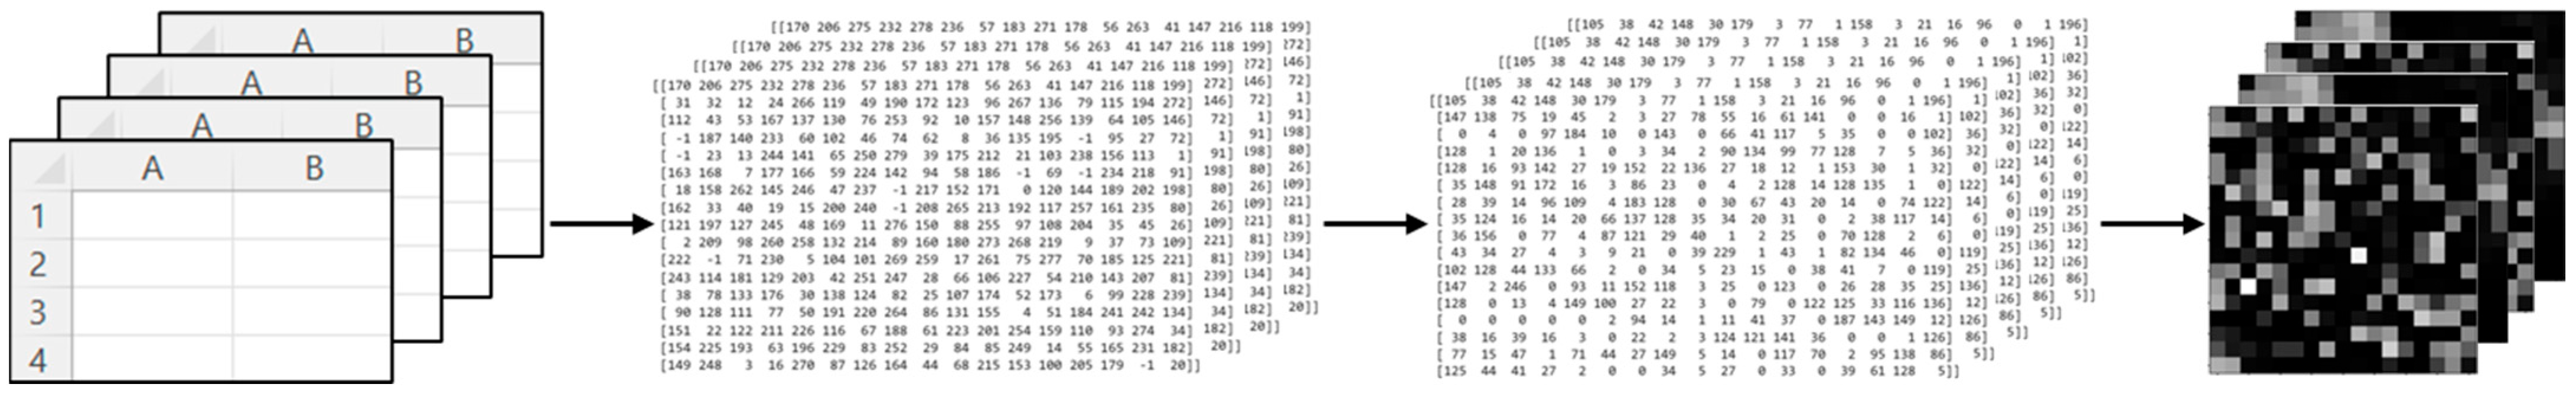
As illustrated in
Figure 1, the data preprocessing involves:
Input: Financial statement data (stored in CSV or similar format) for 6249 companies (3256 active, 2993 bankrupt). An example of a table is, for instance, one with columns A and B representing financial features, and rows 1 to 4 representing data samples such as companies.
Transformation: Convert numerical financial data into 2D grayscale images. This involves cleaning and normalizing data, transforming it into matrices, mapping values to pixel intensities, and resizing the images to a consistent dimension for CNN compatibility.
Output: A set of grayscale images, representing the financial profiles of companies, is produced. These images form the input for the deep learning pipeline, enabling feature extraction and bankruptcy classification through advanced CNN models.
Figure 1.
Data preprocessing.
Figure 1.
Data preprocessing.
3.2. Synthetic Data Generation
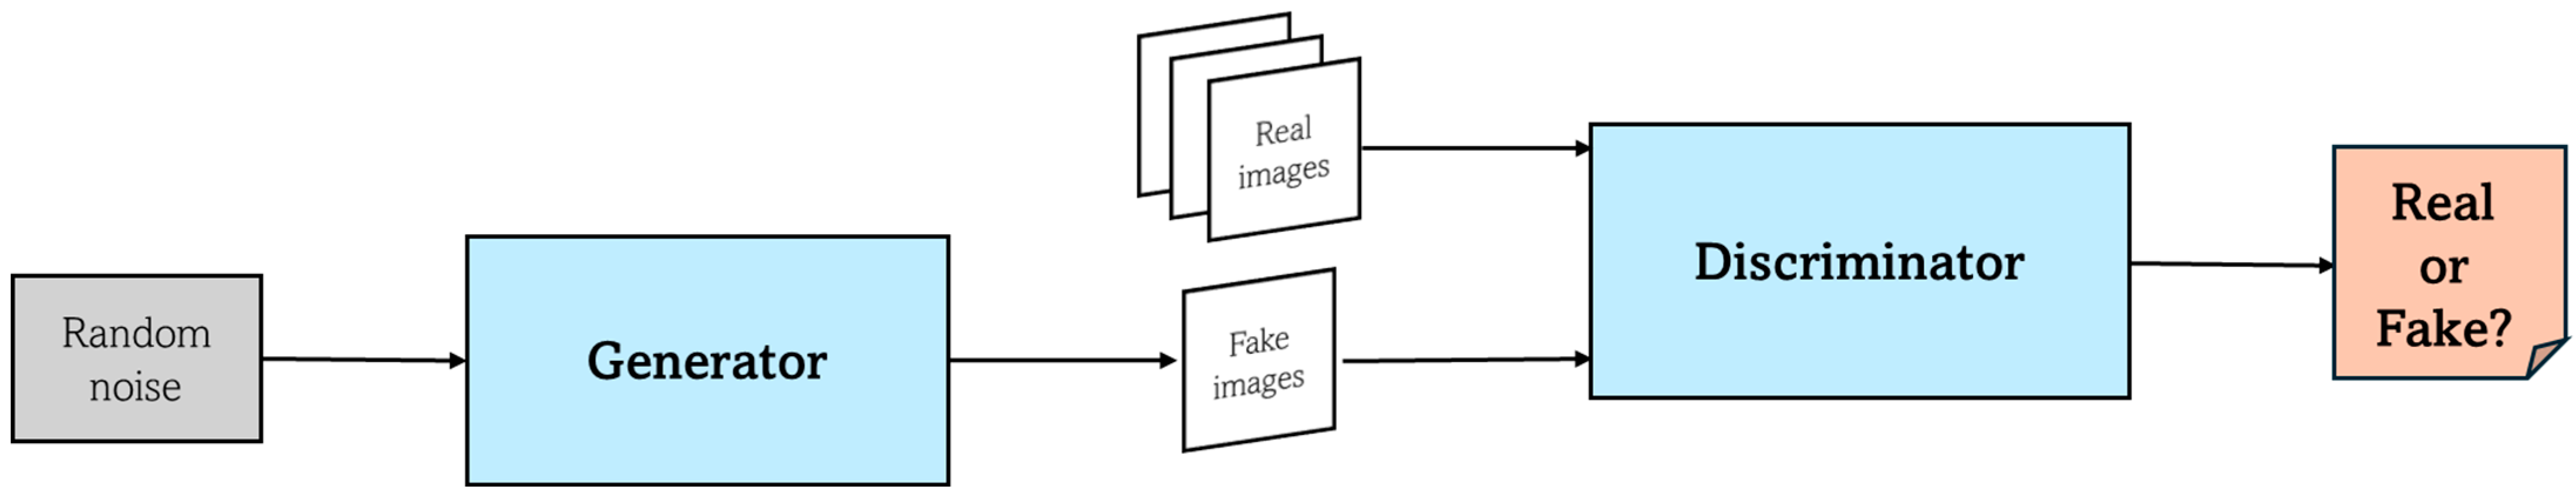
Objective: Augment the dataset to address critical challenges such as insufficient data volume and imbalanced class distribution between active and bankrupt companies. By expanding the dataset through synthetic data generation, the learning algorithm is exposed to diverse scenarios, enhancing its generalizability and predictive accuracy.
Method: This step involves training a GAN (
Figure 2) on the existing set of grayscale financial images. The GAN comprises two networks, the generator and the discriminator, that work to create synthetic data. The generator learns to produce realistic financial images by capturing underlying patterns and structures in the real data, while the discriminator evaluates the authenticity of the generated images. Through an iterative adversarial training process, the generator gradually improves its ability to create synthetic samples that closely mimic the original financial data. This ensures that the augmented dataset remains representative of real-world patterns.
Tools: TensorFlow/Keras for building and training both the generator and discriminator networks.
3.3. CNN-Based Bankruptcy Prediction
Input: A hybrid dataset consisting of real financial data converted into visual representations and synthetic images generated using GANs. This approach enriches the training dataset, addressing challenges such as limited data availability and imbalanced class distributions.
Model: The CNN is designed for the binary classification of images, distinguishing between active and bankrupt companies (
Table 1).
Training: The training process is conducted on a carefully split dataset, where training and validation subsets are used for model optimization, while an independent testing set ensures reliable evaluation and prevents overfitting.
Output: The result is a bankruptcy prediction classifier with enhanced accuracy, achieved through data augmentation using GAN-generated images. This tool can provide critical insights for financial institutions, investors, and policymakers, enabling proactive risk assessment and informed decision making. Its flexibility also allows for potential adaptation to other financial prediction problems.
3.4. Evaluation and Deployment
Metrics: The effectiveness of the model is rigorously evaluated using key performance metrics, including accuracy, precision, recall, and F1 score. These metrics provide comprehensive insights into the model’s ability to make reliable and balanced predictions, especially in situations where the dataset contains an imbalanced distribution of classes. The evaluation process ensures that the model is not only accurate but also minimizes false positives and false negatives, which is critical for practical applications.
Deployment: Once trained and evaluated, the model is prepared for integration into a financial risk assessment pipeline, where it can deliver real-time predictions. This deployment allows stakeholders, such as financial analysts and institutions, to utilize the model for proactive decision making.
4. Dataset Description
The dataset to be used for the analysis was organized using company balance sheet data collected in ORBIS, a database containing economic and financial information on companies all over the world.
The ORBIS database belongs to the Bureau Van Dijk company (Brussels, Belgium), which allows for the search, consultation, analysis, and processing of the main master and economic–financial information of all listed and unlisted companies operating in the world.
The data collected concern Italian companies with between 10 and 500 employees, in the period from 2016 to 2020, without distinction of sector. All these items are shown in
Table 2 below.
To gain a deeper understanding of how the items listed in
Table 2 may serve as predictors of future bankruptcy, we identify, for the sake of clarity, three possible critical financial indicators that embody well-established markers of financial distress. These indicators are particularly suitable for pattern recognition through deep learning techniques, especially when structured as image-like input matrices for CNNs.
A significant and sustained reduction in working capital, defined as the difference between current assets and current liabilities, can serve as a leading indicator of impending financial instability. Negative working capital values or a consistent year-over-year decline suggest deteriorating liquidity and reduced operational flexibility, which may compromise a firm’s ability to meet short-term obligations. When embedded in a CNN-compatible image matrix, temporal patterns associated with diminishing liquidity can be captured effectively, enabling the model to identify the early signs of financial distress.
- 2.
High and Rising Debt-to-Equity Ratio
The debt-to-equity (D/E) ratio, which measures the relative proportion of debt and shareholder equity used to finance a company’s assets, is a critical leverage indicator. A D/E ratio substantially exceeding normative thresholds (e.g., greater than 2:1) or showing a rapid escalation over time is indicative of overleveraging. An excessive reliance on debt increases a firm’s exposure to interest rate fluctuations, cash flow volatility, and refinancing risks, all of which are commonly observed precursors to bankruptcy. The inclusion of GAN-generated synthetic data exhibiting a spectrum of leverage conditions can enhance the CNN’s ability to distinguish between stable and financially vulnerable entities.
- 3.
Profitability Deterioration Amidst Stable Revenue
A discrepancy between revenue stability and declining net income or operating margin is a noteworthy signal of underlying inefficiencies or structural vulnerabilities.
Firms exhibiting consistent or increasing revenues while simultaneously experiencing sharp drops in profitability may be encountering issues related to cost management, the misallocation of resources, or operational inefficiencies. Such divergence is often a precursor to insolvency, as it reflects an erosion of financial viability despite nominal market performance. When structured as a spatially coherent feature map within a CNN input matrix, this divergence can be effectively recognized and leveraged as a predictive signal.
Collectively, these three probes, liquidity erosion, unsustainable leverage, and profitability collapse, represent salient financial patterns that can be systematically encoded and analyzed within a deep learning framework. The integration of these indicators into CNN–GAN models, particularly through data augmentation techniques that generate synthetic yet realistic financial scenarios, enhances the generalizability and predictive accuracy of bankruptcy classification systems. This approach not only addresses the challenge of limited data availability but also reinforces model robustness by exposing it to a broader distribution of plausible financial conditions.
The initial dataset consisted of a balanced distribution between active and dissolved companies, totalling 6249 observations. This balanced nature ensured a robust foundation for subsequent tasks. To facilitate this analysis, the dataset was randomly partitioned into three subsets: training, validation, and test. These subsets contained 65.6%, 14.4%, and 20% of the data, respectively. This stratified division aimed to optimize model performance. At the following step, GANs were applied to augment the dataset. Initially, conditional GANs (cGANs) were employed to synthesize realistic observations based on the original data distribution. Subsequently, deep convolutional conditional GANs (cDCGANs) were used to generate an even more refined set of synthetic data. The use of these GAN variants allowed for an expansion of the dataset by preserving its intrinsic characteristics. With this enriched dataset, a similar partitioning strategy was adopted to ensure consistency across different models and experiments. Following augmentation, the newly expanded dataset was once again divided into training, validation, and test subsets. This methodological consistency enabled direct comparisons between models trained on real and synthetic data, allowing the evaluation of the efficacy of data augmentation techniques in improving prediction accuracy. By ensuring a stable and well-distributed dataset, this approach aims to enhance generalizability and reduce potential biases in predictive analytics related to company survival and dissolution.
5. Proposed Method
In classification tasks, such as the prediction of corporate bankruptcy, the input data consist of unordered numerical columns representing a company’s financial status measured at a given point in time. Such tabular data lack the inherent spatial structure required for effective processing by CNNs, which are designed to exploit local spatial coherence in data.
To overcome this limitation, this study proposes a data organization technique that restructures financial data into a format suitable for CNN training.
5.1. Correspondence Between Financial Statements and Pixels
In CNNs, which operate on image inputs, a fundamental preprocessing step involves transforming raw data into image representations encoded in a numerical format compatible with CNN architectures. This transformation entails converting visual information into a structured array of numerical values that accurately capture pixel intensities, thereby enabling the model to detect spatial patterns and extract hierarchical features effectively.
Each image is numerically represented through its pixel composition, where individual pixel values range from 0 to 255, corresponding to grayscale intensity, with 0 denoting black and 255 denoting white. An image of dimensions m by n is thus expressed as a two-dimensional matrix of size m × n, with each matrix element reflecting the intensity value of the corresponding pixel.
In the context of this study, a novel methodological step involves mapping the column indices of the dataset onto the structure of the image matrix. Each cell in the image corresponds to a specific feature (column) from the dataset. For each company and for each observed year, the values of these features were scaled to the [0, 255] range, ensuring compatibility with image representation standards and facilitating the encoding of financial records into grayscale image format suitable for CNN input.
The dataset employed in this study comprises 56 variables observed over a time span of five years, resulting in a total of 280 feature values per company. To render this data compatible with the CNN input requirements, each individual observation (i.e., each row of the dataset) was transformed into a two-dimensional matrix representation of size 17 × 17. This structure yields 289 elements, which exceeds the number of available features by 9; these surplus positions were assigned a placeholder value of −1, deliberately chosen as it lies outside the valid grayscale pixel range [0, 255], ensuring no interference with actual feature encoding.
Two distinct strategies were adopted to determine the spatial arrangement of dataset features within the image grid. The first approach employed a random mapping of features to grid positions, while the second leveraged a systematic optimization technique aimed at enhancing spatial coherence within the image representation. Specifically, this optimization strategy utilized a covariance-based placement function designed to maximize the sum of covariances among adjacent elements in the grid.
The optimization function operates by taking the covariance matrix of the input features and embedding it within a larger working matrix. It then iteratively assigns feature values to grid positions, prioritizing locations that yield the highest cumulative covariance with neighbouring elements already placed. During this process, the function maintains a record of assigned features and their corresponding positions. Once all features are placed, the function fills any remaining unoccupied cells in the grid with the designated placeholder value (−1), thereby producing a structured matrix in which spatial proximity between features reflects their statistical interdependence. This approach is intended to enhance the CNN’s ability to detect meaningful local patterns by encoding feature similarity through spatial adjacency.
The results of the two procedures just explained are illustrated as an example in
Figure 3a,b. These figures represent matrices showing the arrangement of variable indices in the dataset, using both random and structured configurations.
The values in the matrix are then matched with the values in the dataset corresponding to each company. If the value in the matrix is −1, it will be replaced with 128 in that specific position of the matrix, because, when a pixel has a value of 128, it is exactly halfway between black and white, representing a medium grey. This value indicates that the pixel has a moderate level of brightness, neither too dark nor too light. The result of this step is shown in
Figure 3c,d, which display the arrangement of values at the variables indices in the dataset using both random and structured arrangements.
Figure 3e,f below represent matrices of
Figure 3c,d visually depicted as an image, with each pixel value corresponding to colour information.
5.2. The CNN Model
The CNN model architecture integrates multiple convolutional layers that extract hierarchical features from the input data. Max pooling layers are incorporated to reduce spatial dimensions while preserving essential information, enhancing computational efficiency and feature selection. By systematically reducing the size of feature maps, max pooling ensures the most salient features and mitigates unnecessary complexity within the network. Fully connected layers were utilized to refine learned features, with dropout mechanisms ensuring improved generalization. These dense layers act as the classifier, consolidating extracted features into meaningful representations that drive final predictions. The training process employed the Adam optimizer, chosen for its ability to dynamically adjust learning rates, which contribute to both training stability and the rapid convergence of the model. The Adam optimizer offers the advantage of using adaptive learning rate adjustments, leading to more efficient updates in parameter space. The binary cross-entropy loss function was utilized due to its suitability to binary classification tasks. By calculating the difference between the actual and predicted probability distributions, binary cross-entropy ensures the model learns accurate class separations. The model was trained for 50 epochs, with mini batch updates regulated by a predefined batch size of 64, ensuring a balance between computational efficiency and generalization capabilities. Each epoch represents a complete pass through the training dataset, allowing the incremental refinement of model weights over time. To mitigate overfitting, early stopping was implemented with validation accuracy used as the monitoring metric. If no improvement was observed over five consecutive epochs, training was terminated, and the best-performing weights were restored to ensure optimal performance. This strategy prevents excessive training iterations from compromising the model’s generalization ability, ensuring that the validation accuracy remains a reliable indicator of optimal model performance. Dropout layers were strategically placed within the fully connected layers to further reduce the dependency on specific neurons, promoting robustness across varying data inputs. For evaluation, accuracy was employed as the primary metric to measure classification performance. Validation accuracy was consistently tracked throughout the training process to assess generalization. Following training, the model was tested on an independent dataset to compute test loss and test accuracy, providing insight into its ability to classify unseen data. The CNN model exhibits a well-balanced training approach, combining optimization techniques, regularization strategies, and evaluation metrics.
The CNN model designed for this binary classification task begins with a convolutional layer that uses 64 filters of size 5 × 5 to process grayscale input images of shape 17 × 17 with a single channel. Grayscale images reduce the computational complexity while preserving the essential contrast-based feature information necessary for classification. The padding is set to “SAME”, preserving spatial dimensions across the convolutional operations. This is followed by a max pooling layer to reduce the spatial dimensions by a factor of 2, thereby decreasing the computational load and highlighting the most prominent features. The model then adds two more convolutional layers with 128 and 256 filters, respectively, both utilizing the default 3 × 3 kernel size and ReLU activation, enabling hierarchical feature extraction. ReLU activation ensures non-linearity within the network, allowing it to model complex feature representations effectively. Each was followed by max pooling layers to further downsample the feature maps. After the convolutional and pooling stages, the model flattens the 3D output into a 1D vector. The model then introduces two fully connected layers with 128 and 64 neurons, respectively, each using the ReLu activation function. To prevent overfitting, dropout layers with a 50% dropout rate are applied for both dense layers. Dropout functions as a regularization technique, preventing neurons from having dependence on features and enhancing the model’s ability to generalize to unseen data. By introducing randomness into neuron activations, dropout ensures that the network learns robust representations rather than memorizing specific patterns. The final layer of the model is a dense layer with a single neuron and a sigmoid activation function, producing an output probability score between 0 and 1, making the model well suited for binary classification tasks. This architecture leverages convolutional layers to extract features and fully connected layers to make predictions, with dropout layers enhancing its generalization capability.
6. Results and Discussion
During the training and validation phases, all the models consistently exhibited a strong and positive learning trajectory, as evidenced by a progressive increase in accuracy and a concurrent decrease in loss. These results indicate that the models effectively assimilated patterns from the data and refined their predictive capabilities over time. The upward trend in accuracy underscores the growing proficiency of the models in making correct predictions, while the steady reduction in loss reflects the enhanced optimization and alignment with the target outcomes. This consistency in performance across both training and validation processes highlights the robustness of the models.
Considering the model trained on data augmented by cDCGAN: as the loss decreases, it signifies that the model’s predictions are becoming more refined, minimizing the discrepancy between predicted and actual outcomes. This trend indicates that the neural network is learning effectively, adjusting its parameters to better capture patterns in the data. Looking at the training process across multiple epochs, the initial loss starts relatively high at 0.7, but it rapidly declines, reaching 0.34 by the second epoch and further dropping to 0.27 by the third. This suggests that early in the training, the model is making significant progress in optimizing its weights. At the same time, the rising accuracy highlights the model’s improved ability to classify data correctly. The accuracy begins at 56% in the first epoch, surpassing 90% within just a few iterations. This upward trend is a strong indicator that the model is generalizing well to the data. Additionally, monitoring the validation metrics helps assess how well the model generalizes beyond the training data. The validation accuracy starts relatively high at 66% in the first epoch. However, as training progresses, validation accuracy continues to improve, peaking above 94%, while validation loss simultaneously decreases. This suggests a well-performing model with a strong ability to classify unseen data correctly. The final test evaluation yields 98% accuracy and 0.08 loss, demonstrating that the model can maintain a high accuracy even on unseen test data. This confirms that the CNN has successfully learned useful patterns without excessive overfitting.
To evaluate the efficacy of the results achieved, it is necessary to conduct a comparative analysis with alternative methodologies.
Such comparisons offer deeper insights into the performance and reliability of each model, enabling us to determine which one provides best results in our situation.
By examining the performance metrics of various models side by side, we can better assess their strengths and limitations, ensuring a comprehensive evaluation of their effectiveness.
Table 3 compares the performance metrics of five different models: a CNN trained and tested on the original dataset with the addition of data generated using a cDCGAN, the Gradient Boosting classifier, Random Forest classifier, Adaboost classifier, and CNN trained and tested on the original dataset with the addition of data generated using cGAN.
The CNN_cDCGAN model achieves the highest accuracy, 0.98, and a balanced performance across all metrics, with a high recall, 0.99. The GradientBoostingClassifier also performs well, with a high recall, 0.996, and competitive F-beta scores, indicating its robustness in identifying positive instances. The RandomForestClassifier and CNN_cGAN models show similar performances, with a slightly lower accuracy but still strong precision and recall values. The AdaBoostClassifier, while having the lowest accuracy, 0.976, maintains high recall, 0.996, and competitive F-beta scores, suggesting it is effective in minimizing false negatives. Overall, each model demonstrates strong performance, with slight variations in their strengths across different metrics.
Choosing the CNN_cDCGAN model is advantageous because it offers the highest accuracy and F1 score among the models, indicating that it is the most reliable in correctly classifying instances. Its high recall of 0.99 suggests that it is particularly effective at identifying positive instances, which is crucial in scenarios where missing a positive instance is costly.
The F1 score provides a single, comprehensive measure of a model’s performance, which is particularly useful when comparing different models, but sometimes it can be useful to use the F-beta which is a generalization of the F1 score that allows for the adjustment of the balance between precision and recall.
It is also useful to check values of the score with because in this way it is prioritizing recall and minimizing false negatives, and this can be important if missing a bankruptcy prediction can be more costly. Otherwise, it is useful to check values of the score with because in this way it is prioritizing precision and minimizing false positives, and this can be helpful if predicting bankruptcy incorrectly has significant consequences.
For example, if a false negative is found, missing a bankruptcy case could lead to significant financial losses. If a false positive is found, incorrectly predicting bankruptcy could harm a company’s reputation and lead to unnecessary actions.
It is important to underline that the metrics of the proposed CNN model, despite being a model composed of few layers and which requires few epochs to be trained, are comparable, if not superior, to the performance of more classic models that have been optimized to obtain the highest performance score.
7. Conclusions
The primary objective of this research was to develop and evaluate an innovative methodology for predicting corporate bankruptcy by leveraging image-based representations of financial data and applying deep learning techniques, specifically CNNs. This study addresses key limitations associated with traditional numerical approaches, particularly their inability to capture complex, non-linear interdependencies within financial variables, and their limited effectiveness when applied to imbalanced or small datasets.
To this end, the financial statements of companies were transformed into grayscale images by rescaling each variable into a defined range (0–255), thus enabling their representation as structured pixel values within two-dimensional matrices. A central focus of this research was to assess the impact of the spatial arrangement of these pixels, comparing random distribution with a covariance-optimized placement strategy designed to enhance local feature correlation. The findings indicate that a structured pixel arrangement significantly improves the CNN’s classification performance, underscoring the importance of meaningful spatial encoding in the transformation process.
One of the distinctive contributions of this work lies in its methodological novelty. By reframing financial data as images and training CNNs on both real and GAN-augmented datasets, this study demonstrates a new direction for bankruptcy prediction models, departing from the dominant focus on market-sensitive listed firms. This innovation contributes to democratizing advanced predictive analytics by offering a scalable and accessible solution for firms with limited data availability or resources.
The choice to use a CNN is motivated by its unique ability to capture spatial hierarchies and local dependencies. Unlike traditional fully connected neural networks, which treat all input features uniformly, CNNs leverage convolutional layers to focus on localized patterns and hierarchical structures within the data. This makes CNNs particularly effective for identifying correlations and trends that exhibit spatial relationships, which may not be easily detected by other models. Through the progressive refinement of feature maps across multiple layers, CNNs extract increasingly complex representations of the data, enabling a deeper understanding and improving pattern recognition capabilities. Max pooling layers further enhance CNNs’ efficiency by reducing redundancy and emphasizing dominant features, allowing for better generalization. CNNs require fewer parameters than fully connected models when processing large datasets, making them computationally efficient while maintaining strong performance. Their ability to automatically learn hierarchical patterns renders them suitable for numerical datasets transformed into image representations, enabling more effective classification modelling in financial applications. The decision to use CNNs was primarily driven by the intention to exploit a distinct approach to pattern recognition and feature extraction. Instead of relying on traditional statistical correlations or manually engineered features, CNNs allow for the automatic discovery of complex spatial relationships, improving adaptability and robustness in diverse applications. This makes CNNs particularly advantageous when handling unstructured or high-dimensional data, as they can efficiently navigate dependencies without requiring extensive feature engineering.
Another key advantage of CNNs is their robustness to noise and variations in data. Traditional models depend on engineered features and statistical assumptions, which can be sensitive to slight changes in input distributions. CNNs, with their deep architectures and pooling mechanisms, effectively filter irrelevant details and focus on dominant characteristics. CNNs reduce overfitting and enhance their ability to generalize across different datasets, even when variations exist between samples. This characteristic ensures a consistent classification performance and enables CNNs to remain effective across various domains, including financial forecasting. While CNNs are typically used for image processing, their ability to capture local dependencies and patterns makes them well suited for numerical data organized in grid-like structures, such as time series data and financial records. CNN-based models have demonstrated a strong performance in analyzing structured numerical data and detecting trends. This versatility highlights the broad applicability of CNNs beyond their conventional role in computer vision, reinforcing their effectiveness in numerous fields that demand complex feature extraction and representation learning.
One of the main problems with this model is that, compared with classical approaches, it is challenging to know which variable most impacted the model classification decisions. Consequently, this model is less suitable for analyses aimed at identifying the causal factors underlying business failure.
Distinct from much of the existing literature, which predominantly focuses on publicly listed companies, this study adopts a novel perspective by concentrating on SMEs. SMEs represent a less frequently studied segment that is generally less influenced by market values and indices, thereby offering unique insights into financial distress within this important economic sector.
This approach is versatile and can be applied across various contexts, involving both numerical and textual data, finding application in different aspects of data science. This approach offers a solid methodological framework for accurate and meaningful results.
Overall, converting numerical data into images and using CNNs present a different way of organizing and representing data, leading to more powerful and versatile classification models.
In summary, this research offers a novel and effective framework for bankruptcy prediction, combining image-based data transformation, deep convolutional architectures, and advanced data augmentation. The approach not only enhances prediction accuracy but also promotes the use of deep learning in domains where data scarcity and class imbalance pose significant challenges. Its demonstrated applicability to SMEs and potential extension to other structured datasets position this methodology as a valuable contribution to the growing field of AI-driven financial risk assessment.


