1. Introduction
Sample size calculation is a crucial aspect of planning clinical trials, as it ensures that there are enough subjects to provide accurate and reliable assessments of drug products with a certain level of statistical assurance [
1]. Appropriately sized samples are essential for making confident inferences that reflect the underlying population parameters. The required sample size to reject or accept a study hypothesis is determined by the statistical power of the utilized test. Studies with insufficient power often lead to unrealistic assumptions about treatment effectiveness, misjudgment of parameter variability, incorrect follow-up period estimates, the inability to predict compliance issues, high dropout rates, and failure to account for multiple endpoints. These errors result in wasted resources and potential harm to participants due to unwarranted expectations of therapeutic benefits. Adequate sample sizes and high-quality data collection contribute to more reliable, valid, and generalizable findings, ultimately saving resources and ensuring ethical integrity in clinical research [
2,
3].
Similar issues arise in bioequivalence (BE) studies as in any clinical trial, particularly when comparing a generic pharmaceutical product (Test, T) with a reference product (R). These pharmaceutical products are considered bioequivalent if they contain the same active ingredient in the same molar dose, and this equivalence is confirmed through comparative pharmacokinetic studies, known as bioequivalence trials. When bioequivalence is demonstrated in these trials, the products can be regarded as therapeutically equivalent [
4,
5]. Determining an appropriate sample size for BE studies typically depends on five key study design parameters: the difference between the T and R formulation, the estimated residual variability, the desired statistical power (typically at least 80%), and the significance level (5%). In addition, when planning a BE study, the researcher should consider the possibility of dropouts and therefore plan to recruit an additional number of volunteers.
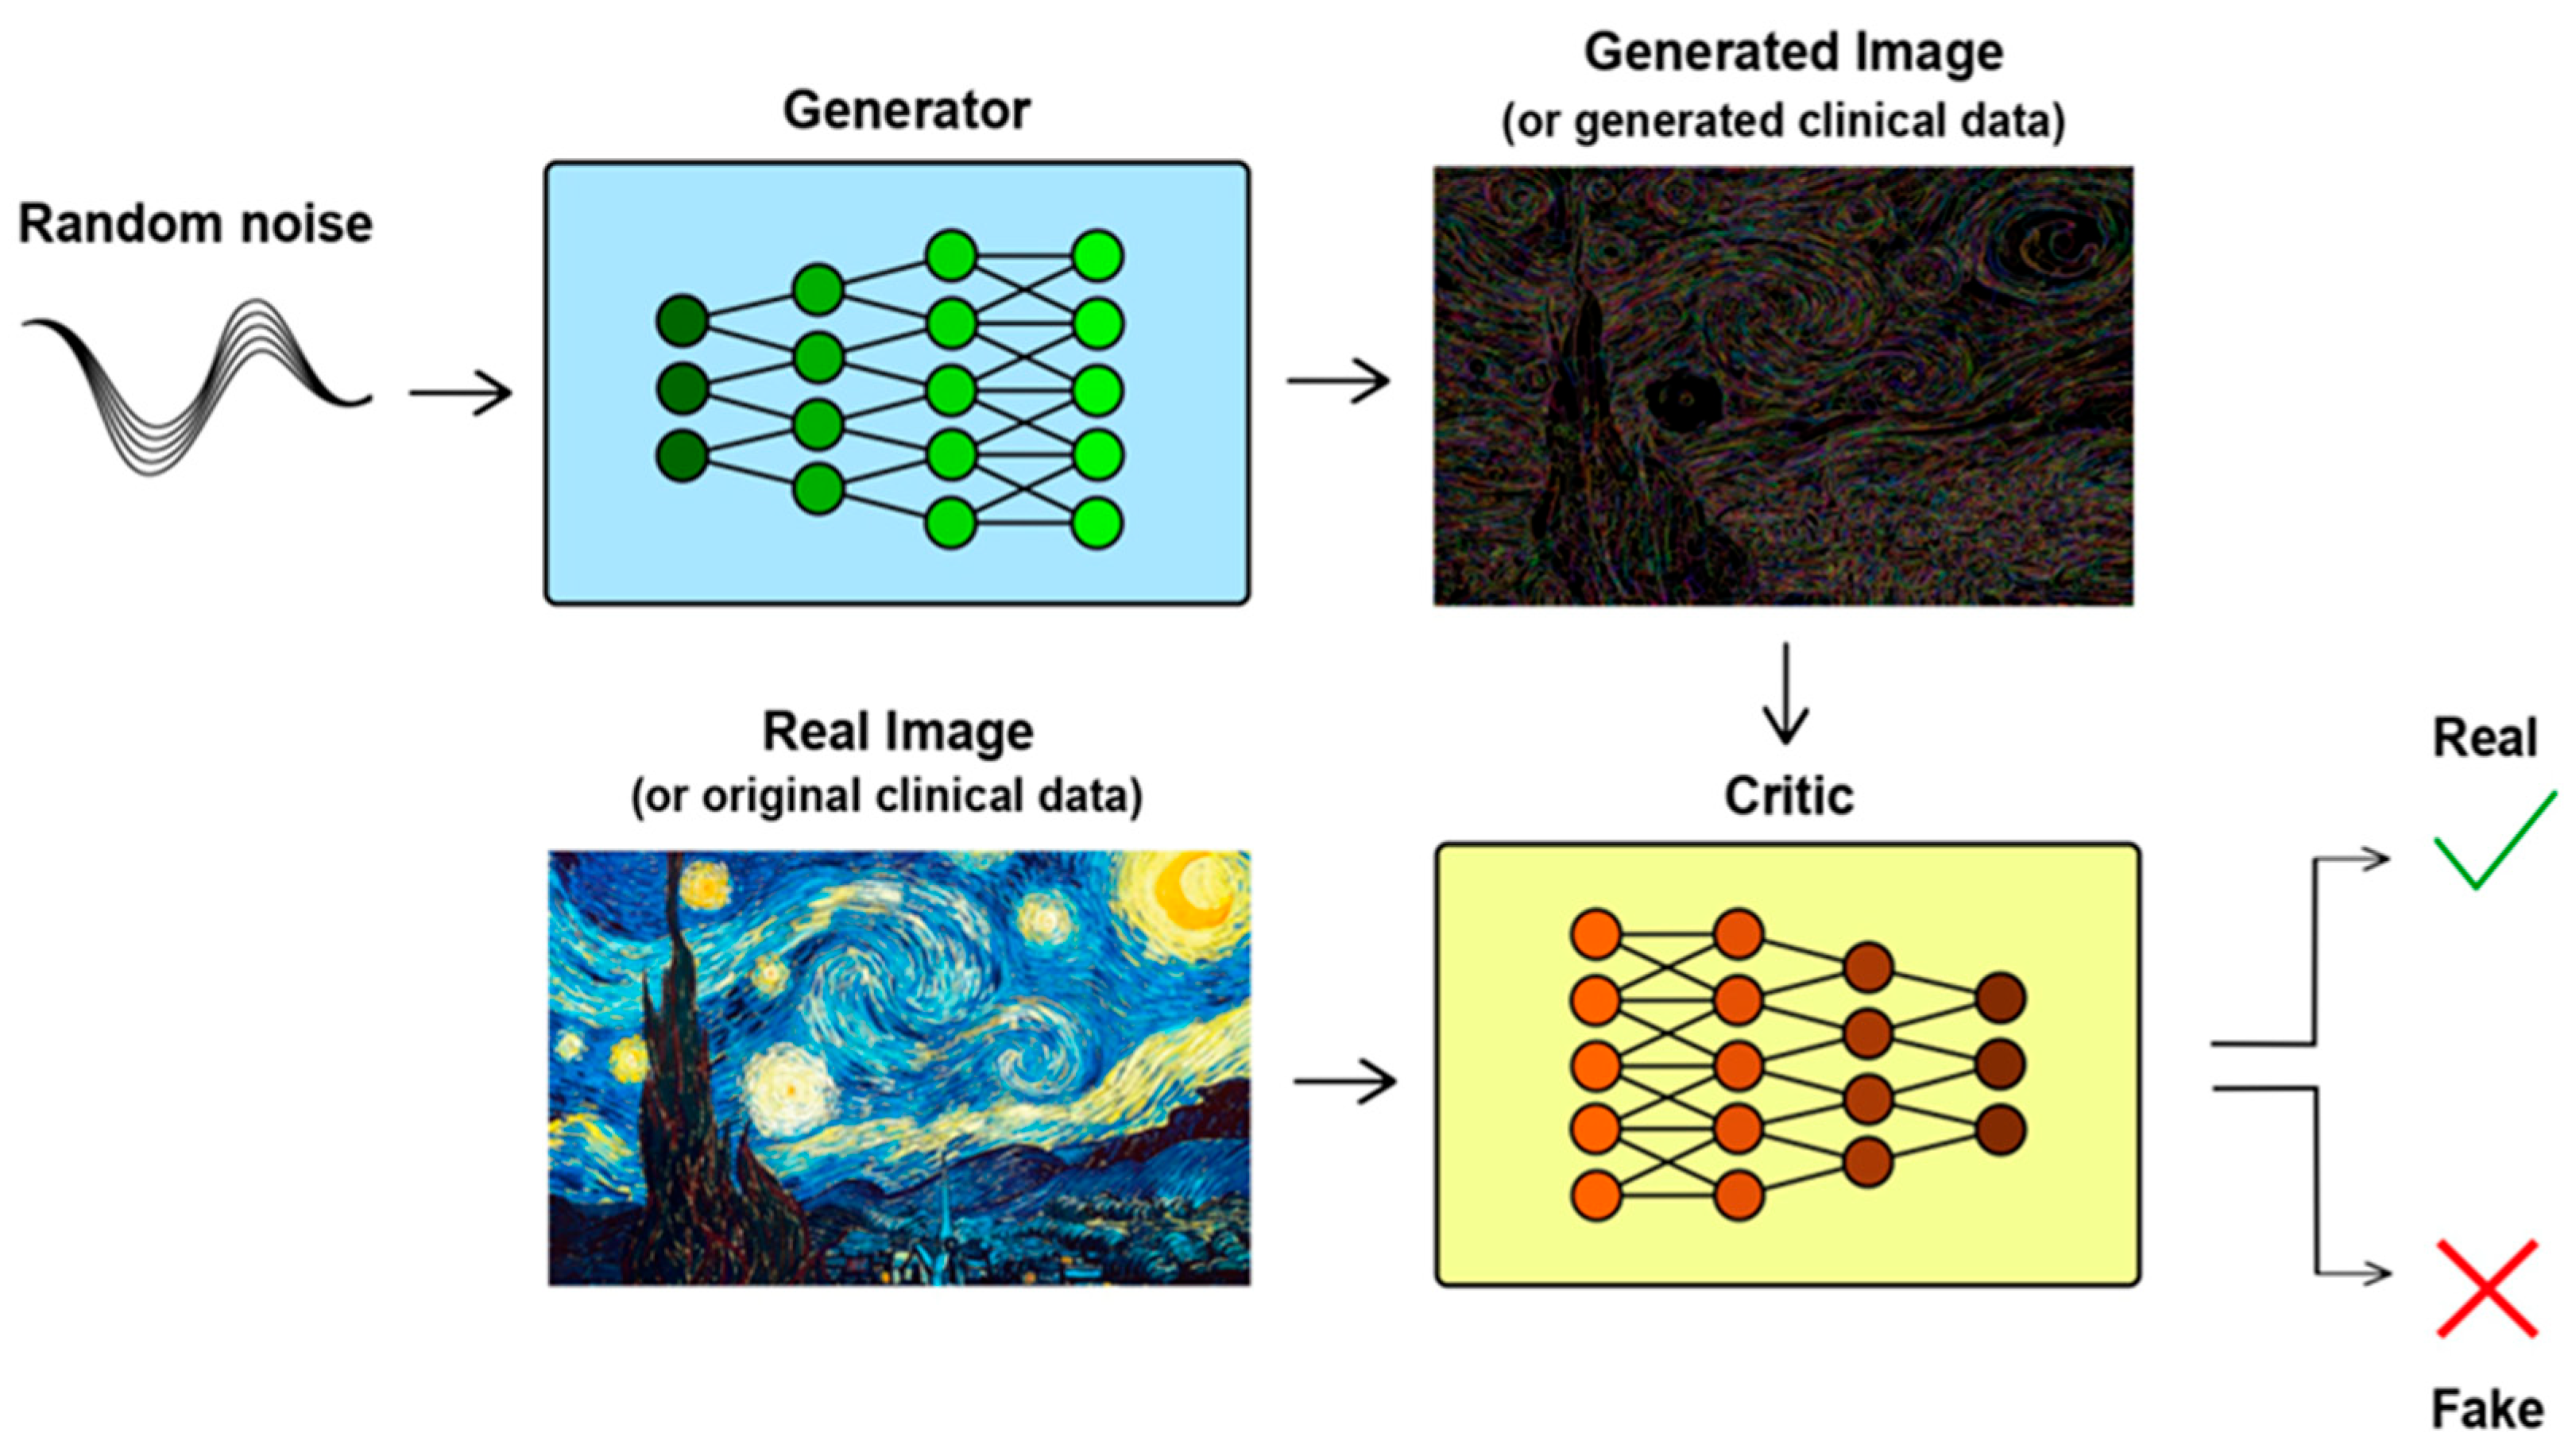
An in-depth analysis of BE studies underscores the pivotal role of statistics and computational methods. Pharmacokinetic modeling and simulation are indispensable in BE, often guiding significant regulatory guidelines [
4,
5]. The emergence of artificial intelligence (AI) has brought transformative capabilities to clinical research, using big data, machine learning algorithms, and neural networks to advance diagnosis, prognosis, monitoring, and treatment across diverse medical domains [
6]. AI has notably revolutionized clinical trial automation, enhancing efficiency through the robust handling of extensive datasets and the generation of highly precise outcomes, and is increasingly integrated into healthcare, offering substantial benefits in patient monitoring, diagnosis, and treatment [
7]. Modern AI techniques have significantly matured over the past five years, proving their potential to enhance clinical trial efficiency and patient care by optimizing early-stage trial processes and setting best practices [
8,
9]. AI has, also, the capability to identify patients who qualify for clinical trials, forecast which individuals are more likely to participate, and, at the same time, extract relevant features from electronic health records [
10]. In medical imaging, AI technologies excel in analyzing complex data, such as distinguishing cell types in tumor samples with high accuracy, often surpassing traditional methods [
11,
12,
13]. This capability extends to improving diagnostic precision and streamlining workflows through automated image analysis and predictive algorithms for medical emergencies [
14]. However, integrating AI into healthcare presents challenges due to the industry’s high regulation and risk aversion [
8]. To address these, a stepwise approach is necessary, focusing on well-defined tasks where AI can offer clear improvements and thorough testing alongside existing technologies [
15]. International guidelines like SPIRIT-AI and CONSORT-AI are crucial for ensuring a transparent and effective evaluation of AI systems in clinical trials, facilitating their safe and ethical use [
16]. Despite the rapid development of AI, ongoing evaluation and adherence to best practices are essential to ensure its effective integration into clinical decision support [
17,
18,
19]. While AI has the potential to revolutionize healthcare by enhancing trial efficiency, reducing costs, and improving patient care, achieving these benefits will require careful, incremental integration, rigorous evaluation, and robust regulatory frameworks [
20,
21,
22]. Additionally, data augmentation techniques such as flipping, rotation, noise addition, shifting, cropping, PCA jittering, and Generative Adversarial Networks (GANs), including Wasserstein GANs (WGANs), play a crucial role. Notably, WGANs have demonstrated exceptional efficacy in this regard [
20].
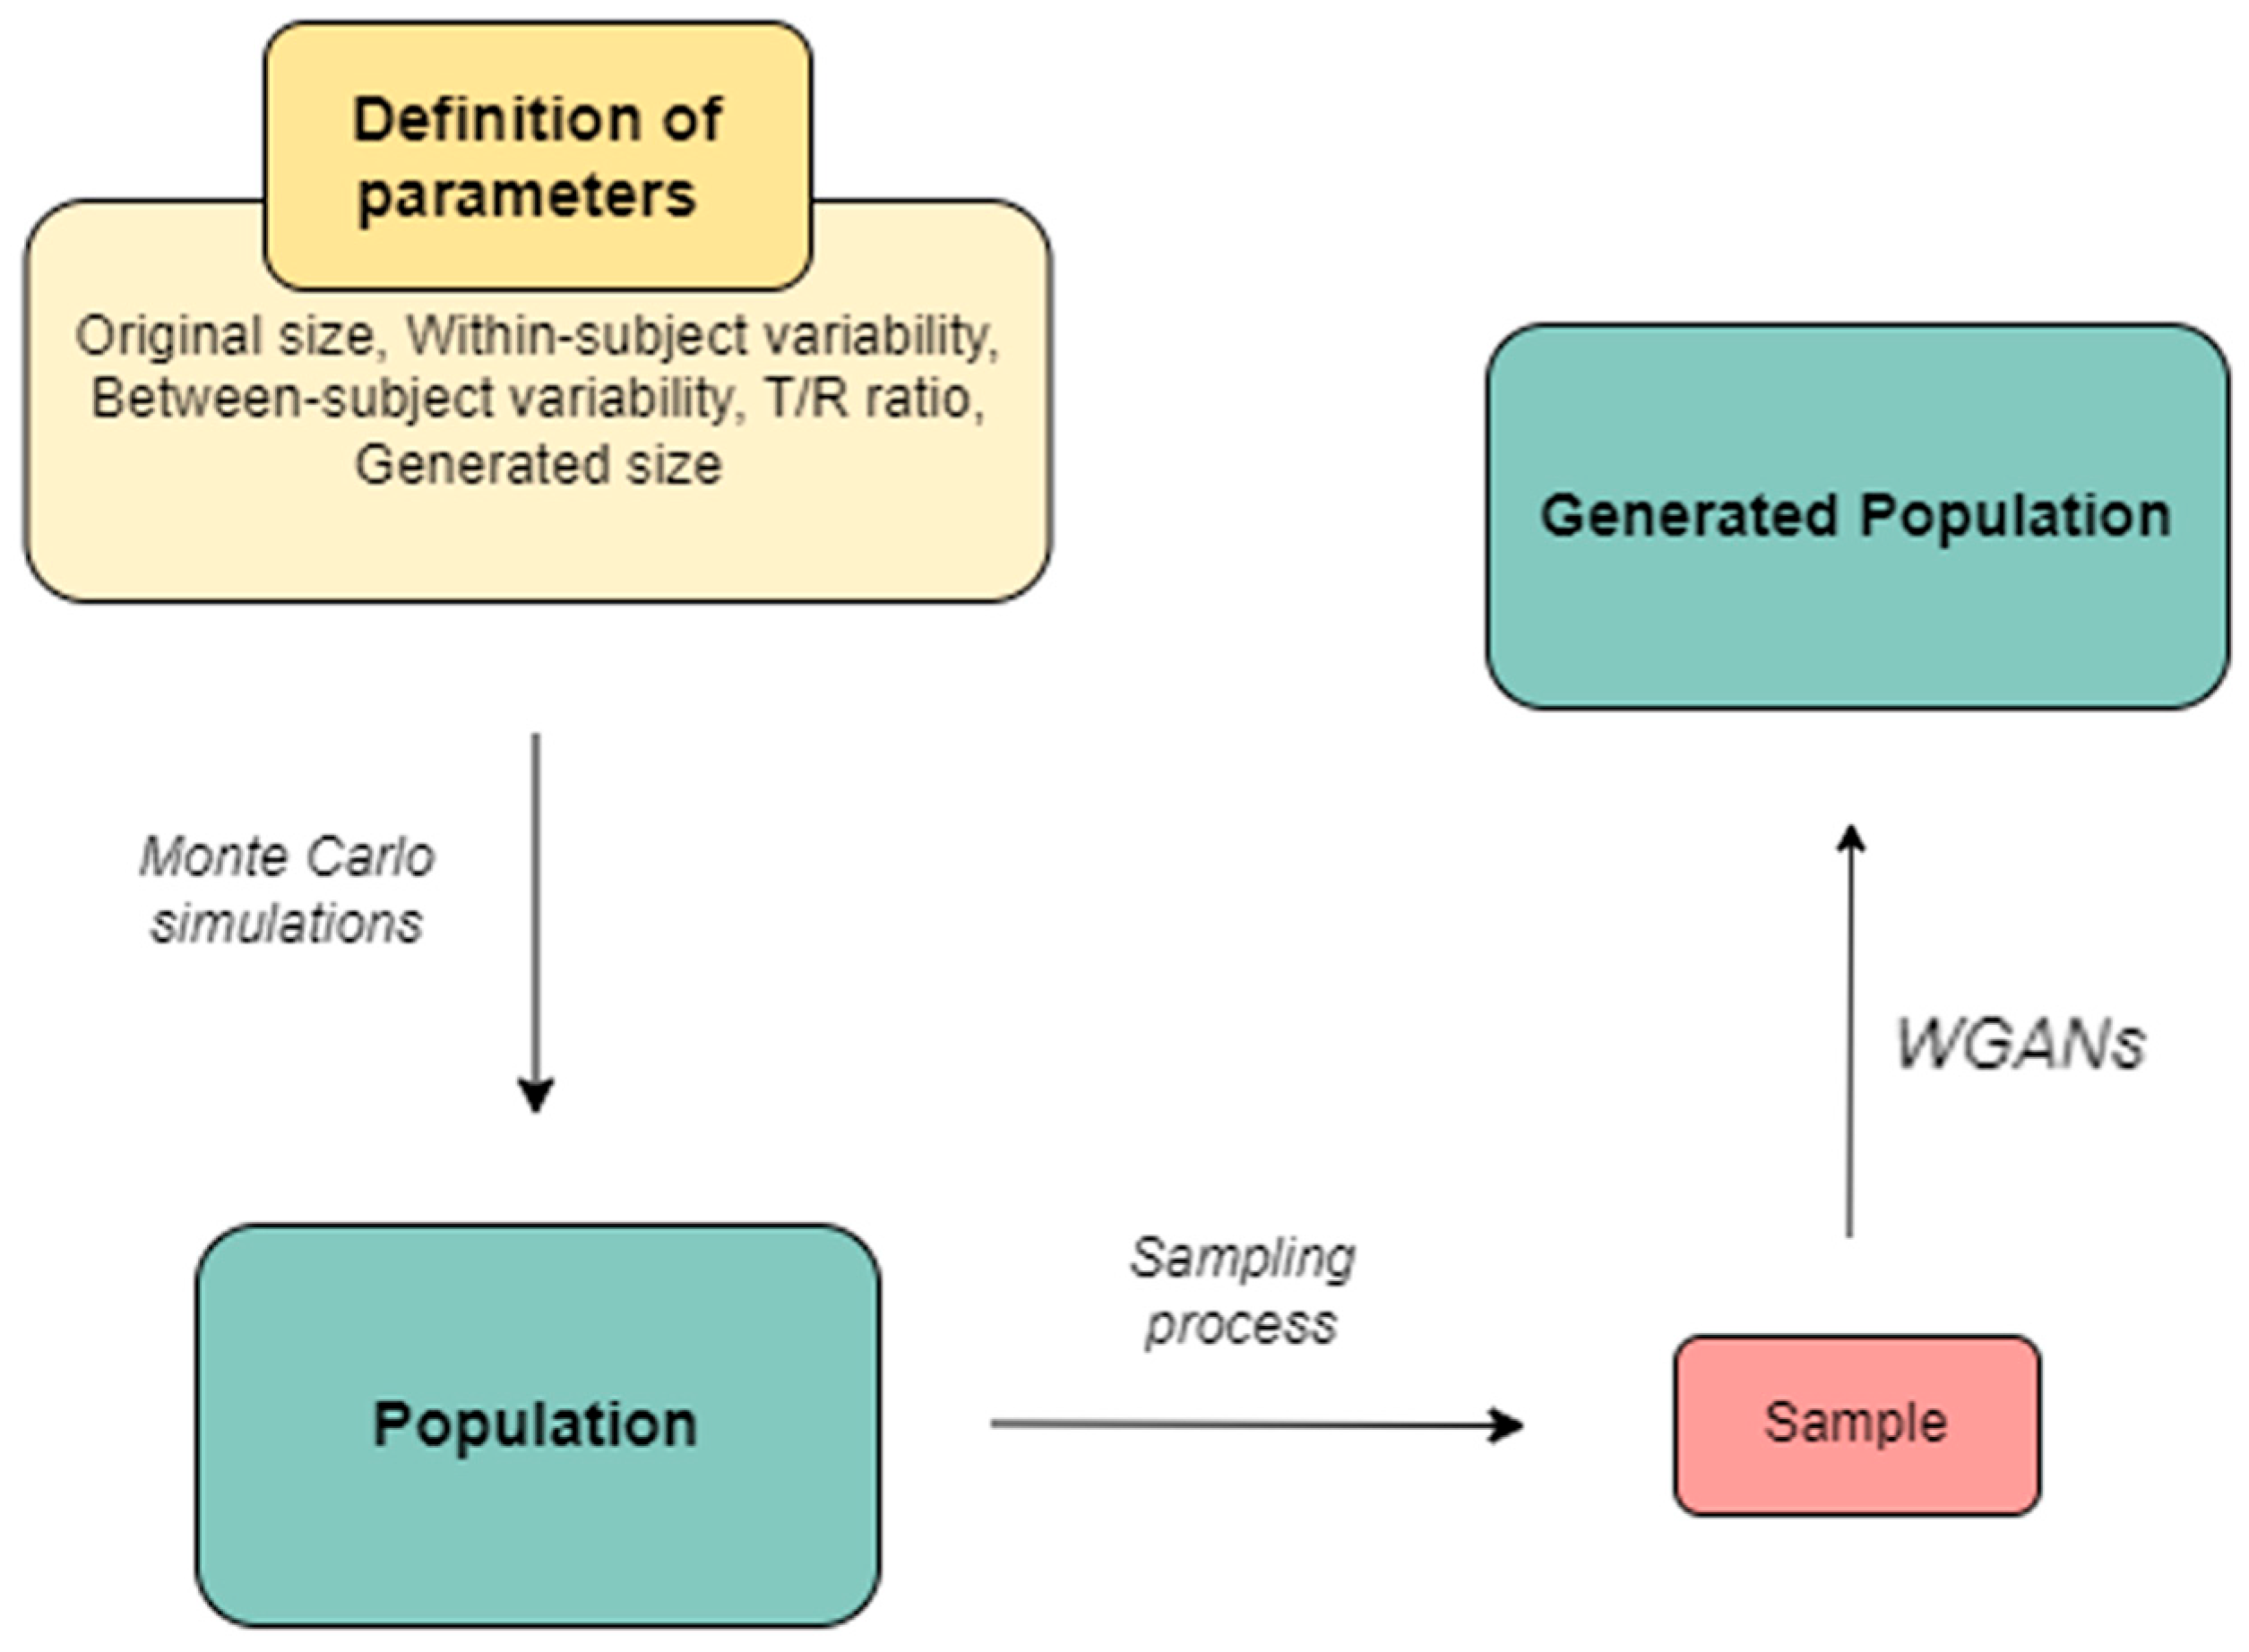
Our recent research explored the application of WGANs in clinical studies. This approach involved training a WGAN on a limited dataset, referred to as the “sample”, and then using it to generate virtual subjects that represent a larger population. Unlike traditional GANs, WGANs ensure stability and convergence through techniques such as weight clipping, which help the generated data to closely match real-world distributions. In Monte Carlo simulations of clinical trials, we compared the performance of WGAN-generated virtual subjects with both the entire population (referred to as the “original” distribution) and a subset (the “sample”). The results demonstrated that WGANs can effectively create a virtual population from a small subset of data, producing outcomes comparable to those obtained from the entire population [
21].
The aim of this study is to explore the applicability and performance of using WGANs as a tool to virtually increase the sample size in the assessment of generics, namely, the case of bioequivalence studies. In our previous study [
21], we used very large original sample sizes (e.g., 10,000) to apply WGANs. However, in the current study, an intriguing challenge is that WGANs are applied to low sample sizes (e.g., 12, 24, 48, or 72), since bioequivalence studies are typically conducted with limited samples. Also, the conditions of most usually used 2 × 2 crossover trials are simulated in the current work and the statistical analysis follows the official requirements for BE trials, as imposed by the regulatory authorities (FDA, EMA). Additionally, several scenarios are explored to investigate as many aspects of BE as possible.
3. Results
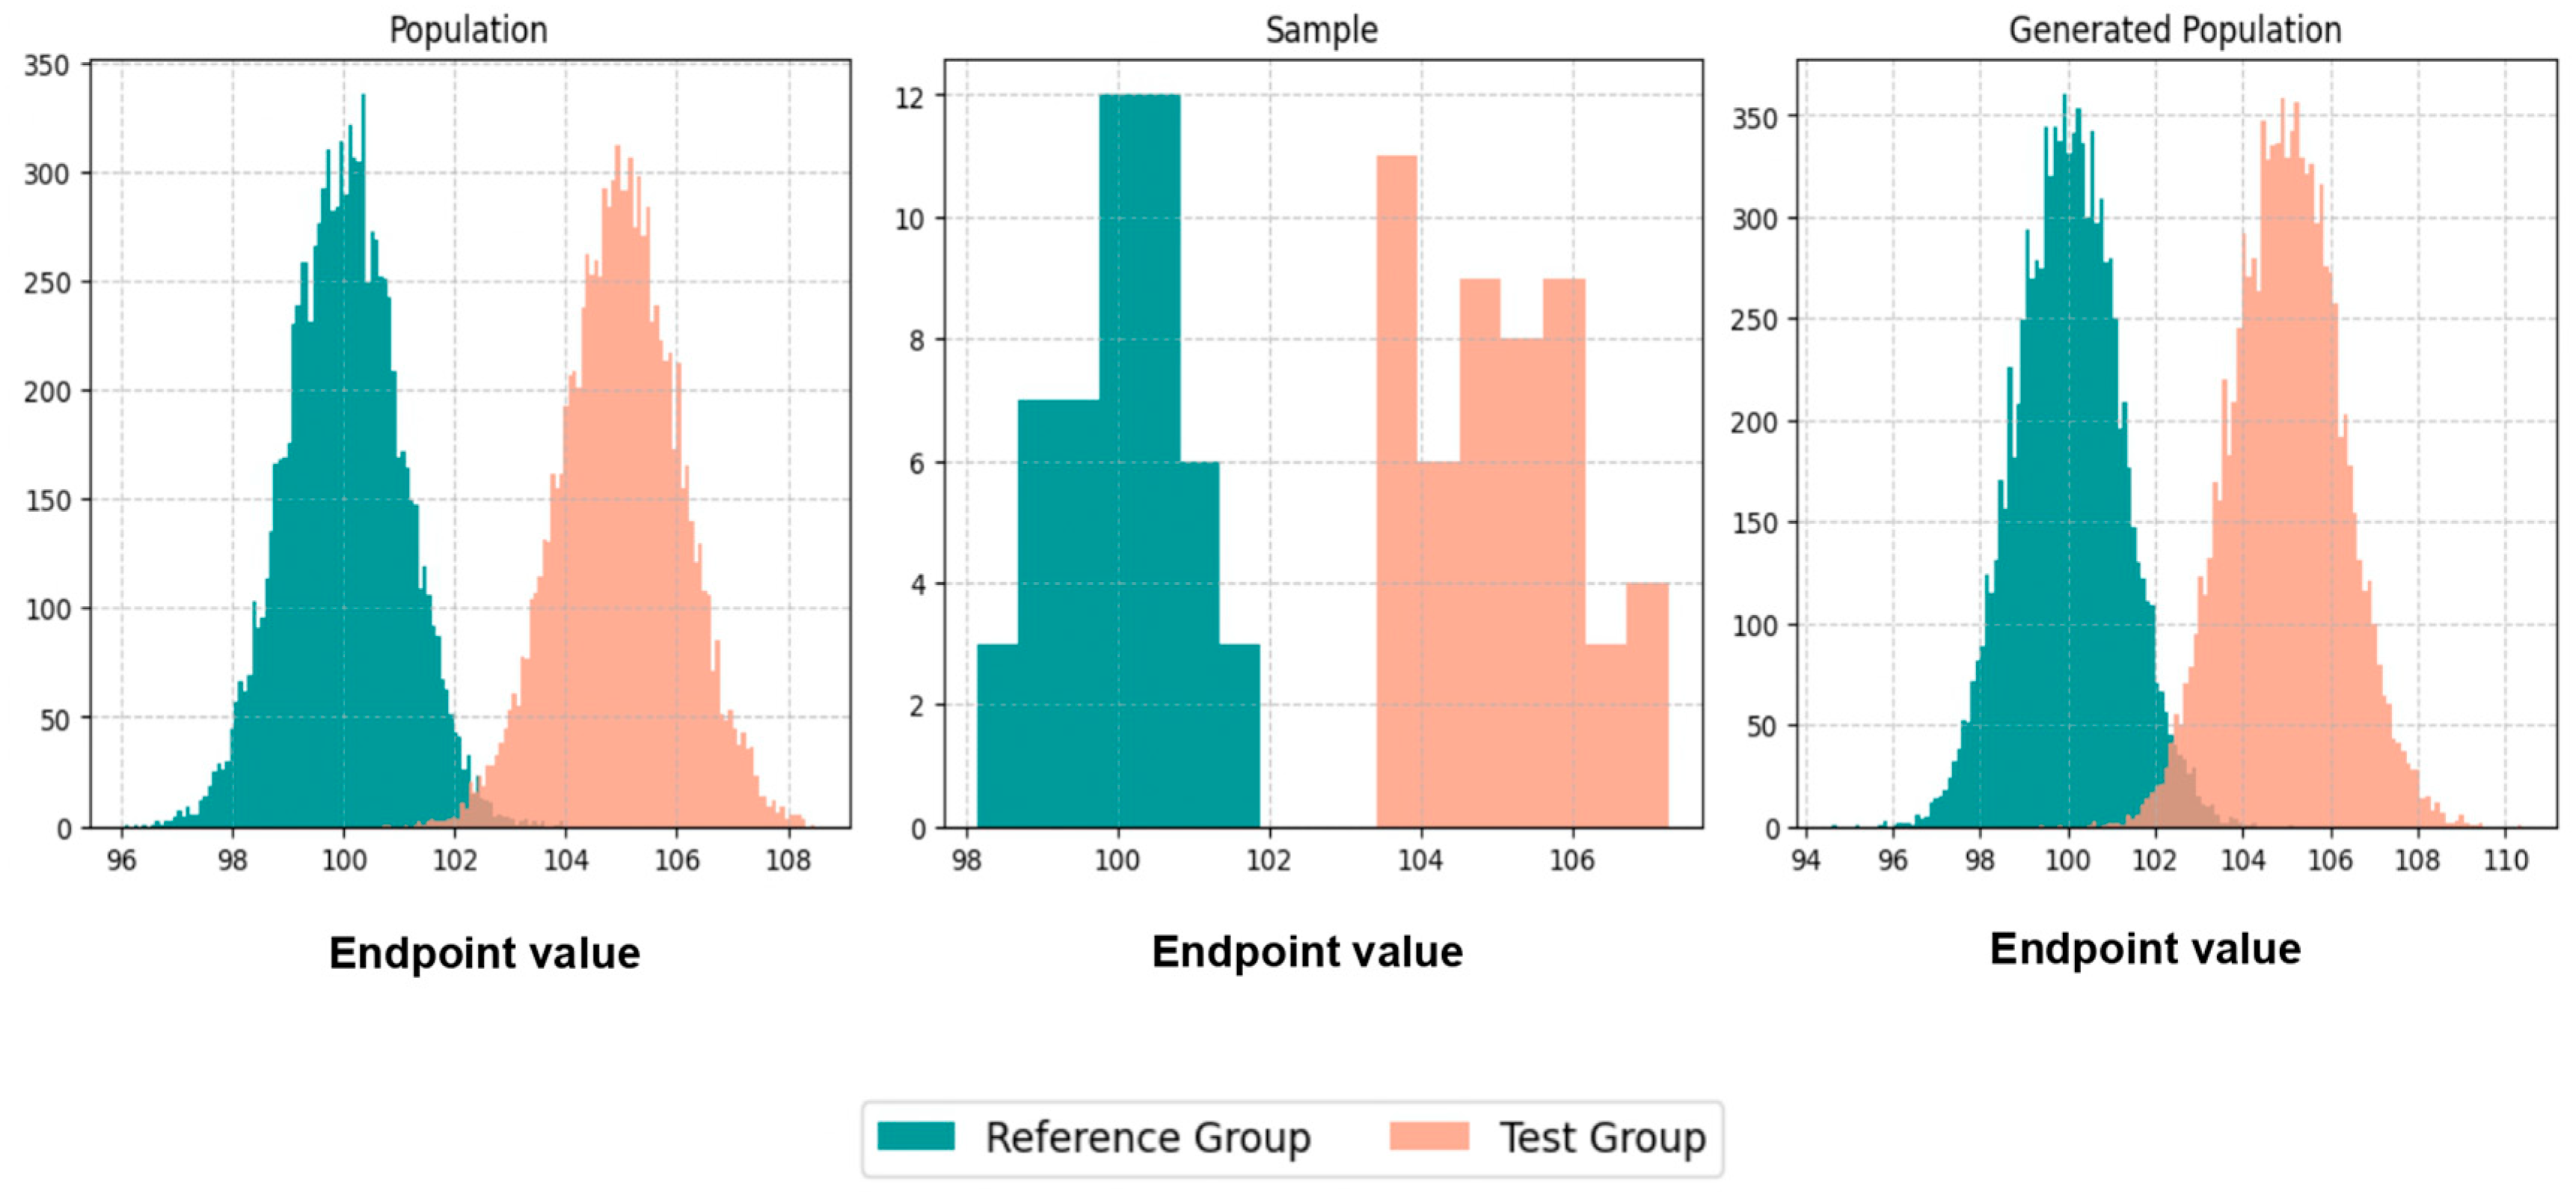
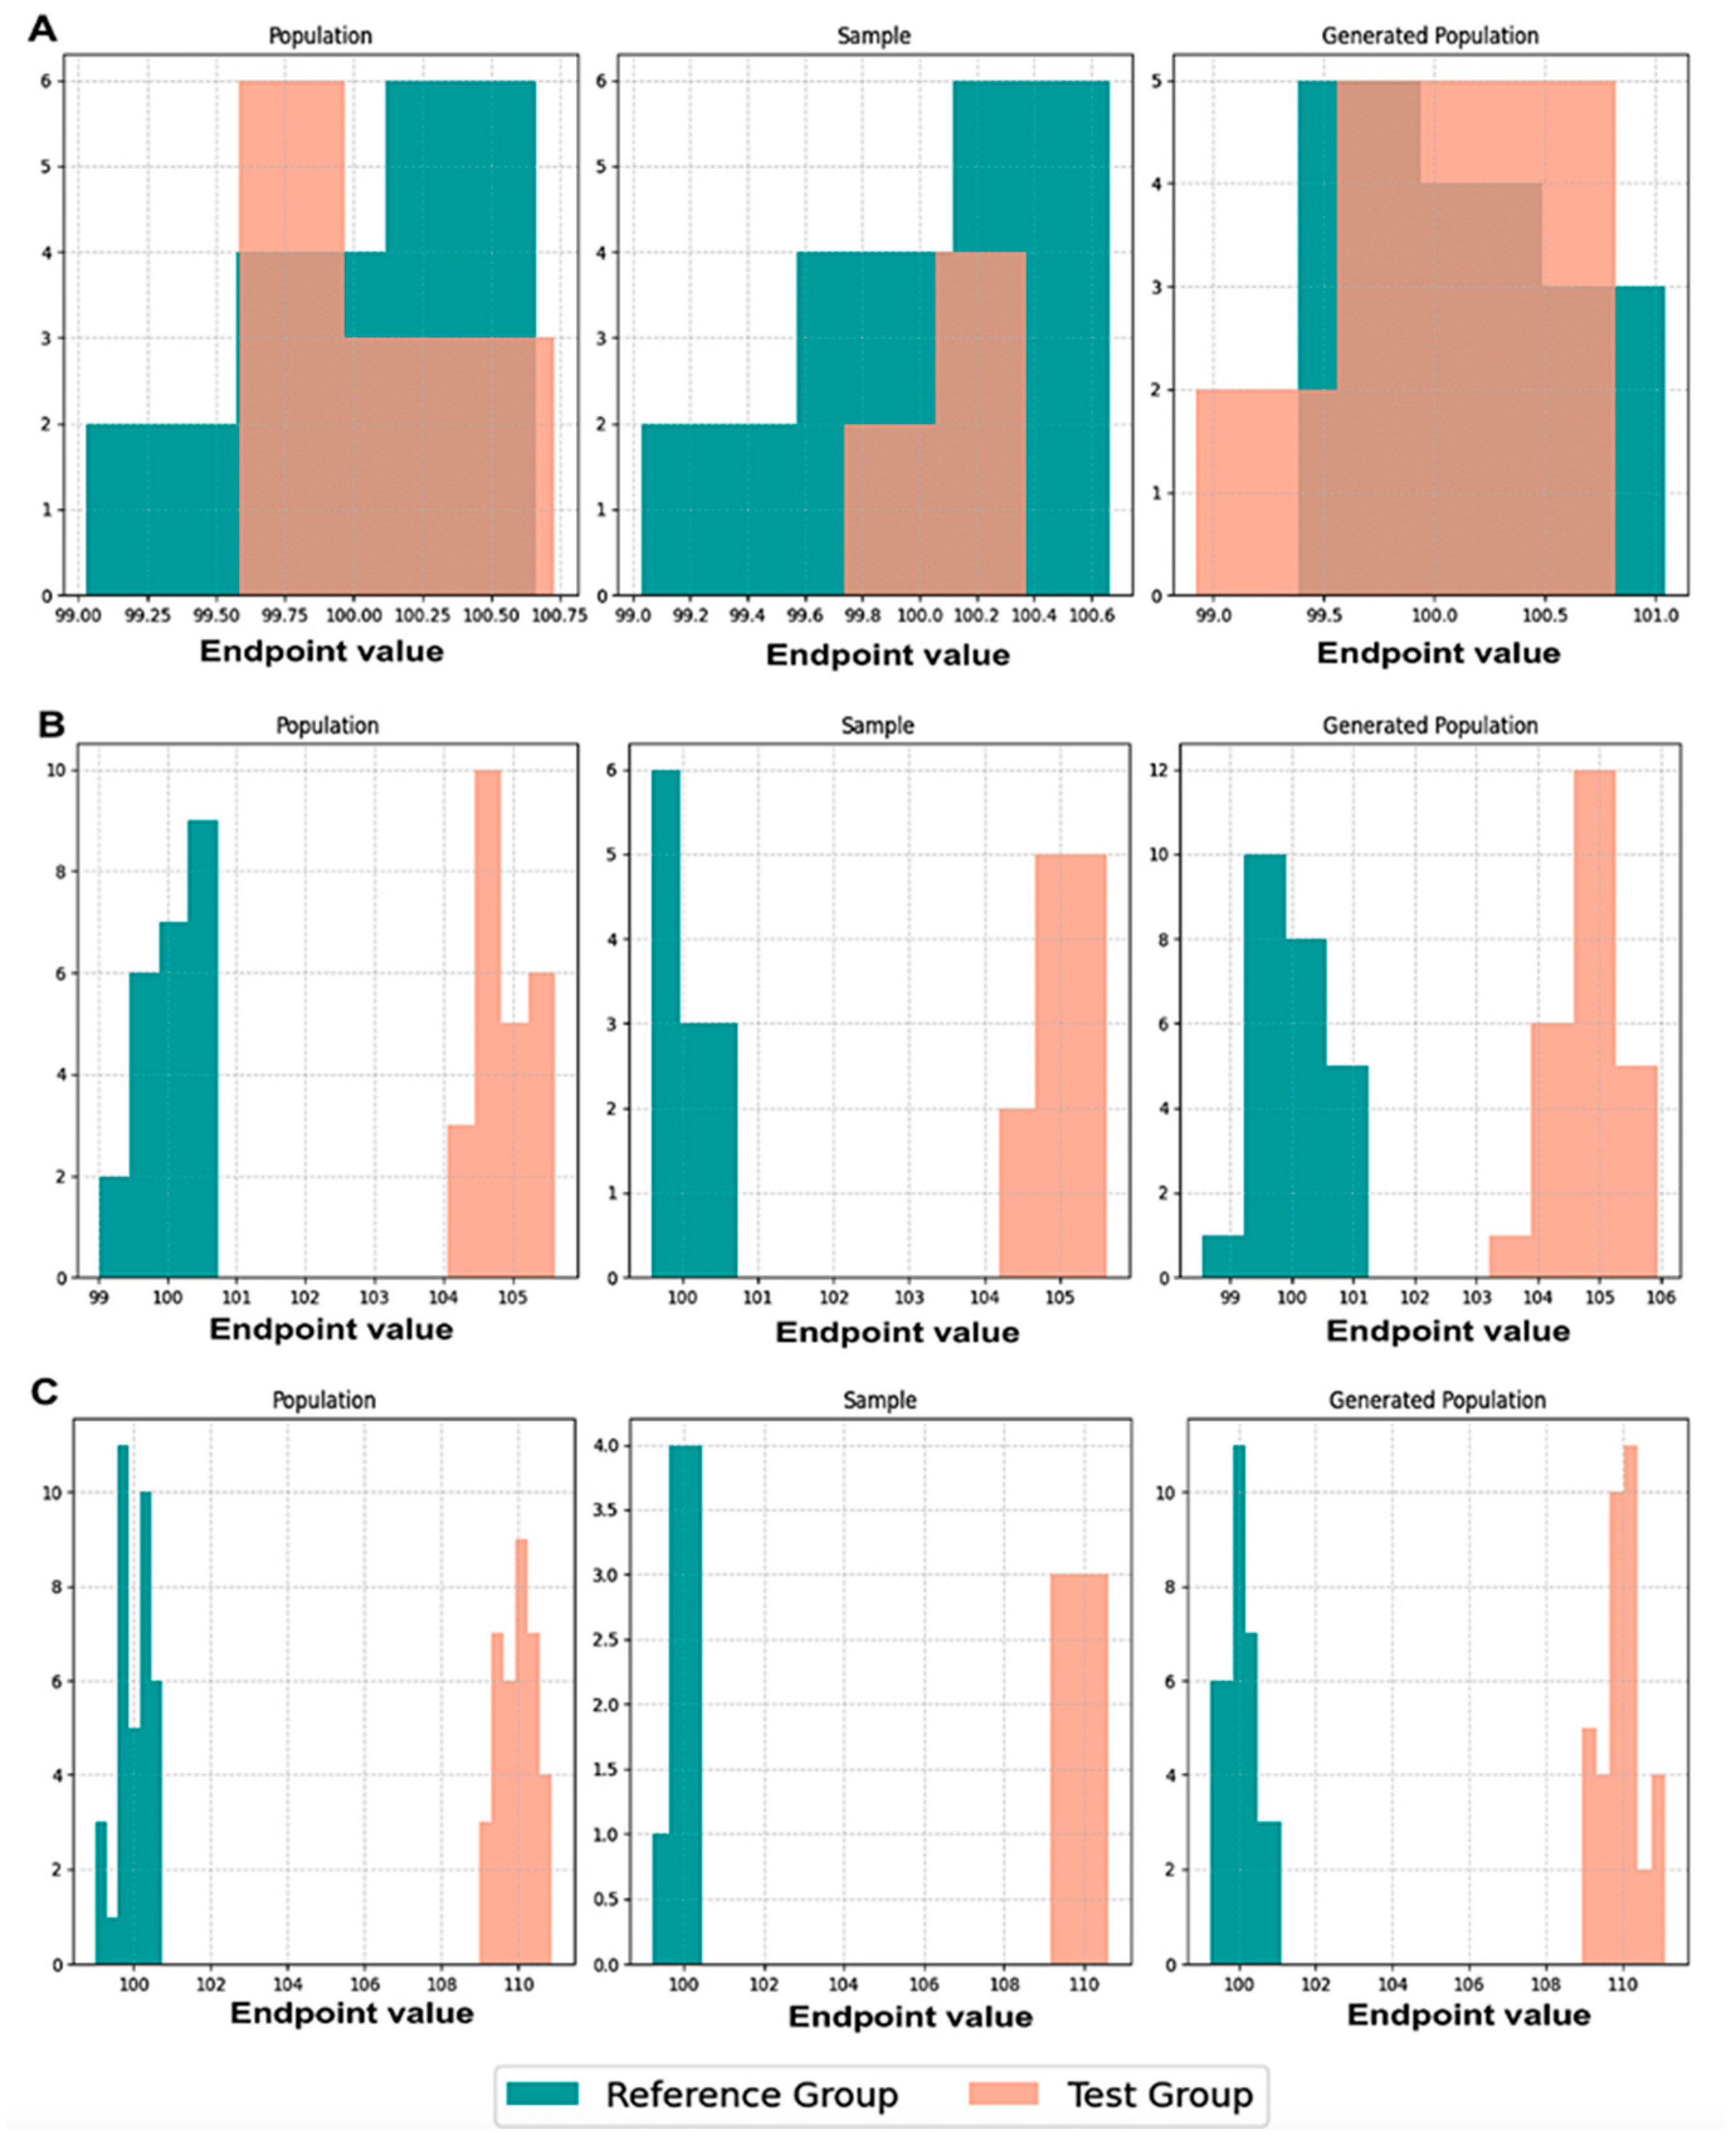
Initially, we executed scenarios to evaluate BE acceptance and similarity percentages, maintaining an equal number of patients, N, in both the population and the generated population across various values of CVw, T/R ratios, and sampling percentages. The results were visualized through average histograms for each distribution: population, sample, and generated population. As illustrated in
Figure 3, across three distinct scenarios, the generated distribution successfully captured values closely resembling those of the population. However, the relatively small N values pose a challenge in demonstrating the true resemblance of the distributions.
The true likeness of the population and generated distributions can further be seen in
Figure A1, where the WGANs can resemble a population of 10,000 patients with just 50 of them as an input.
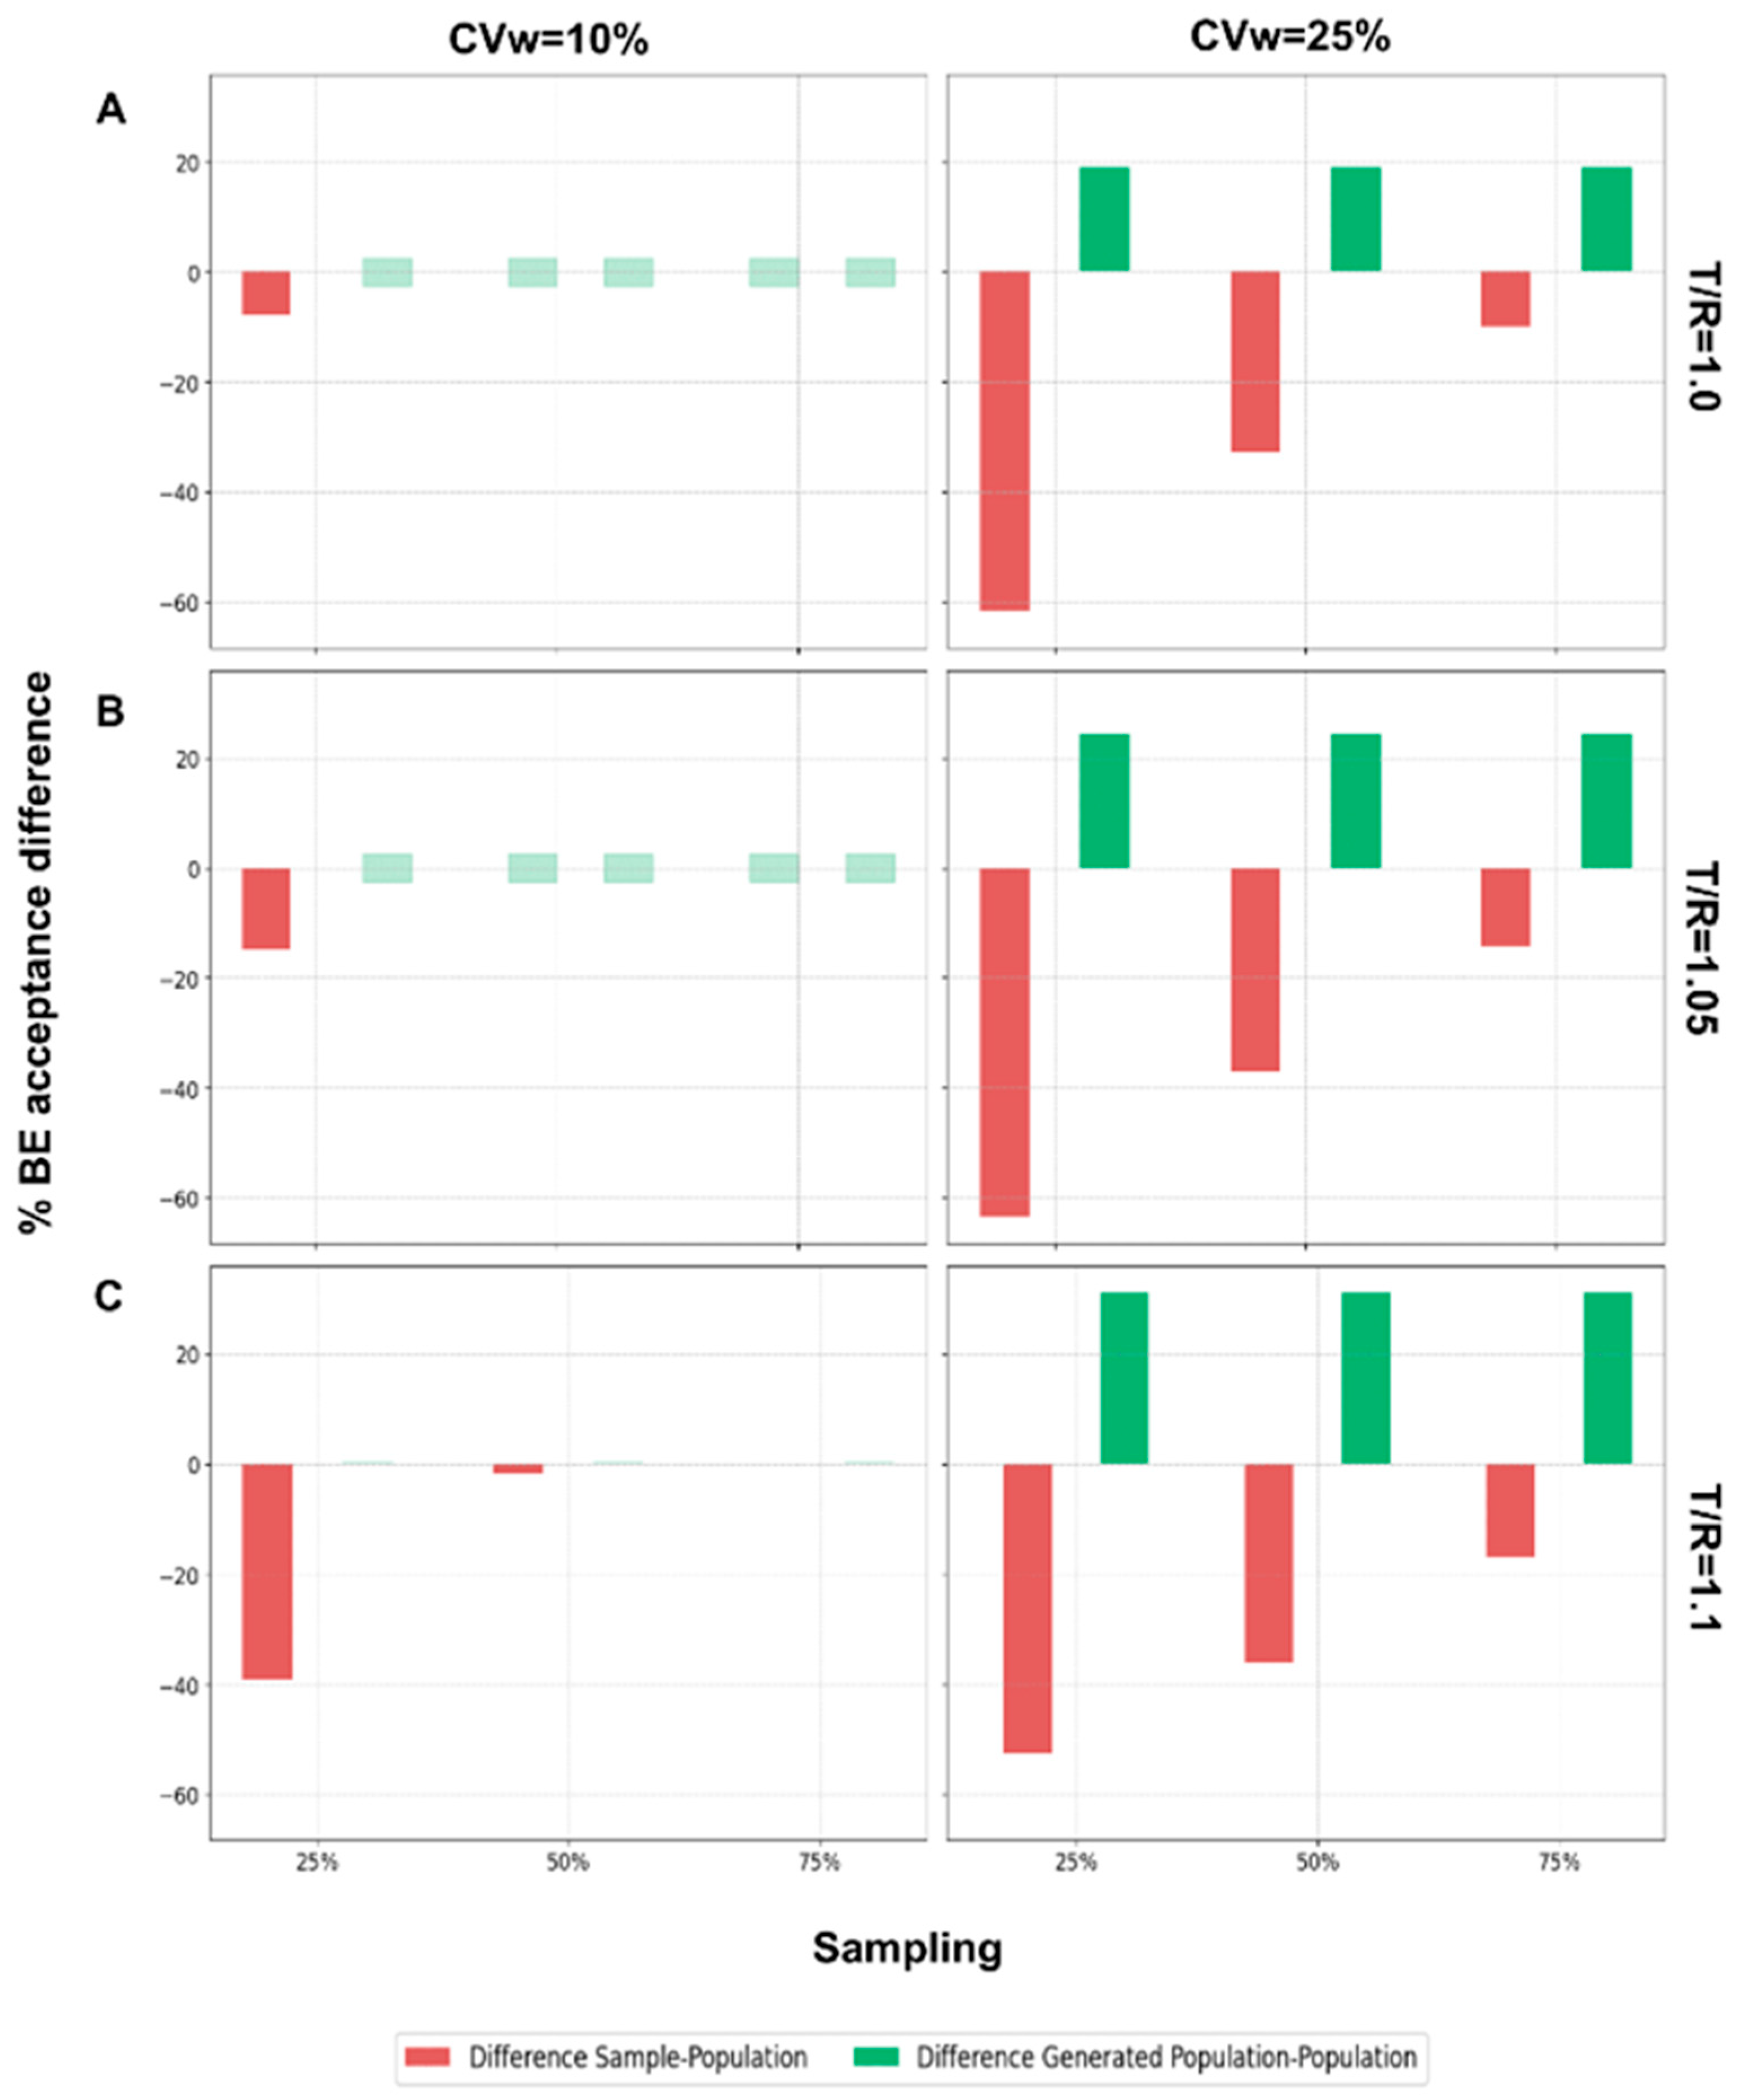
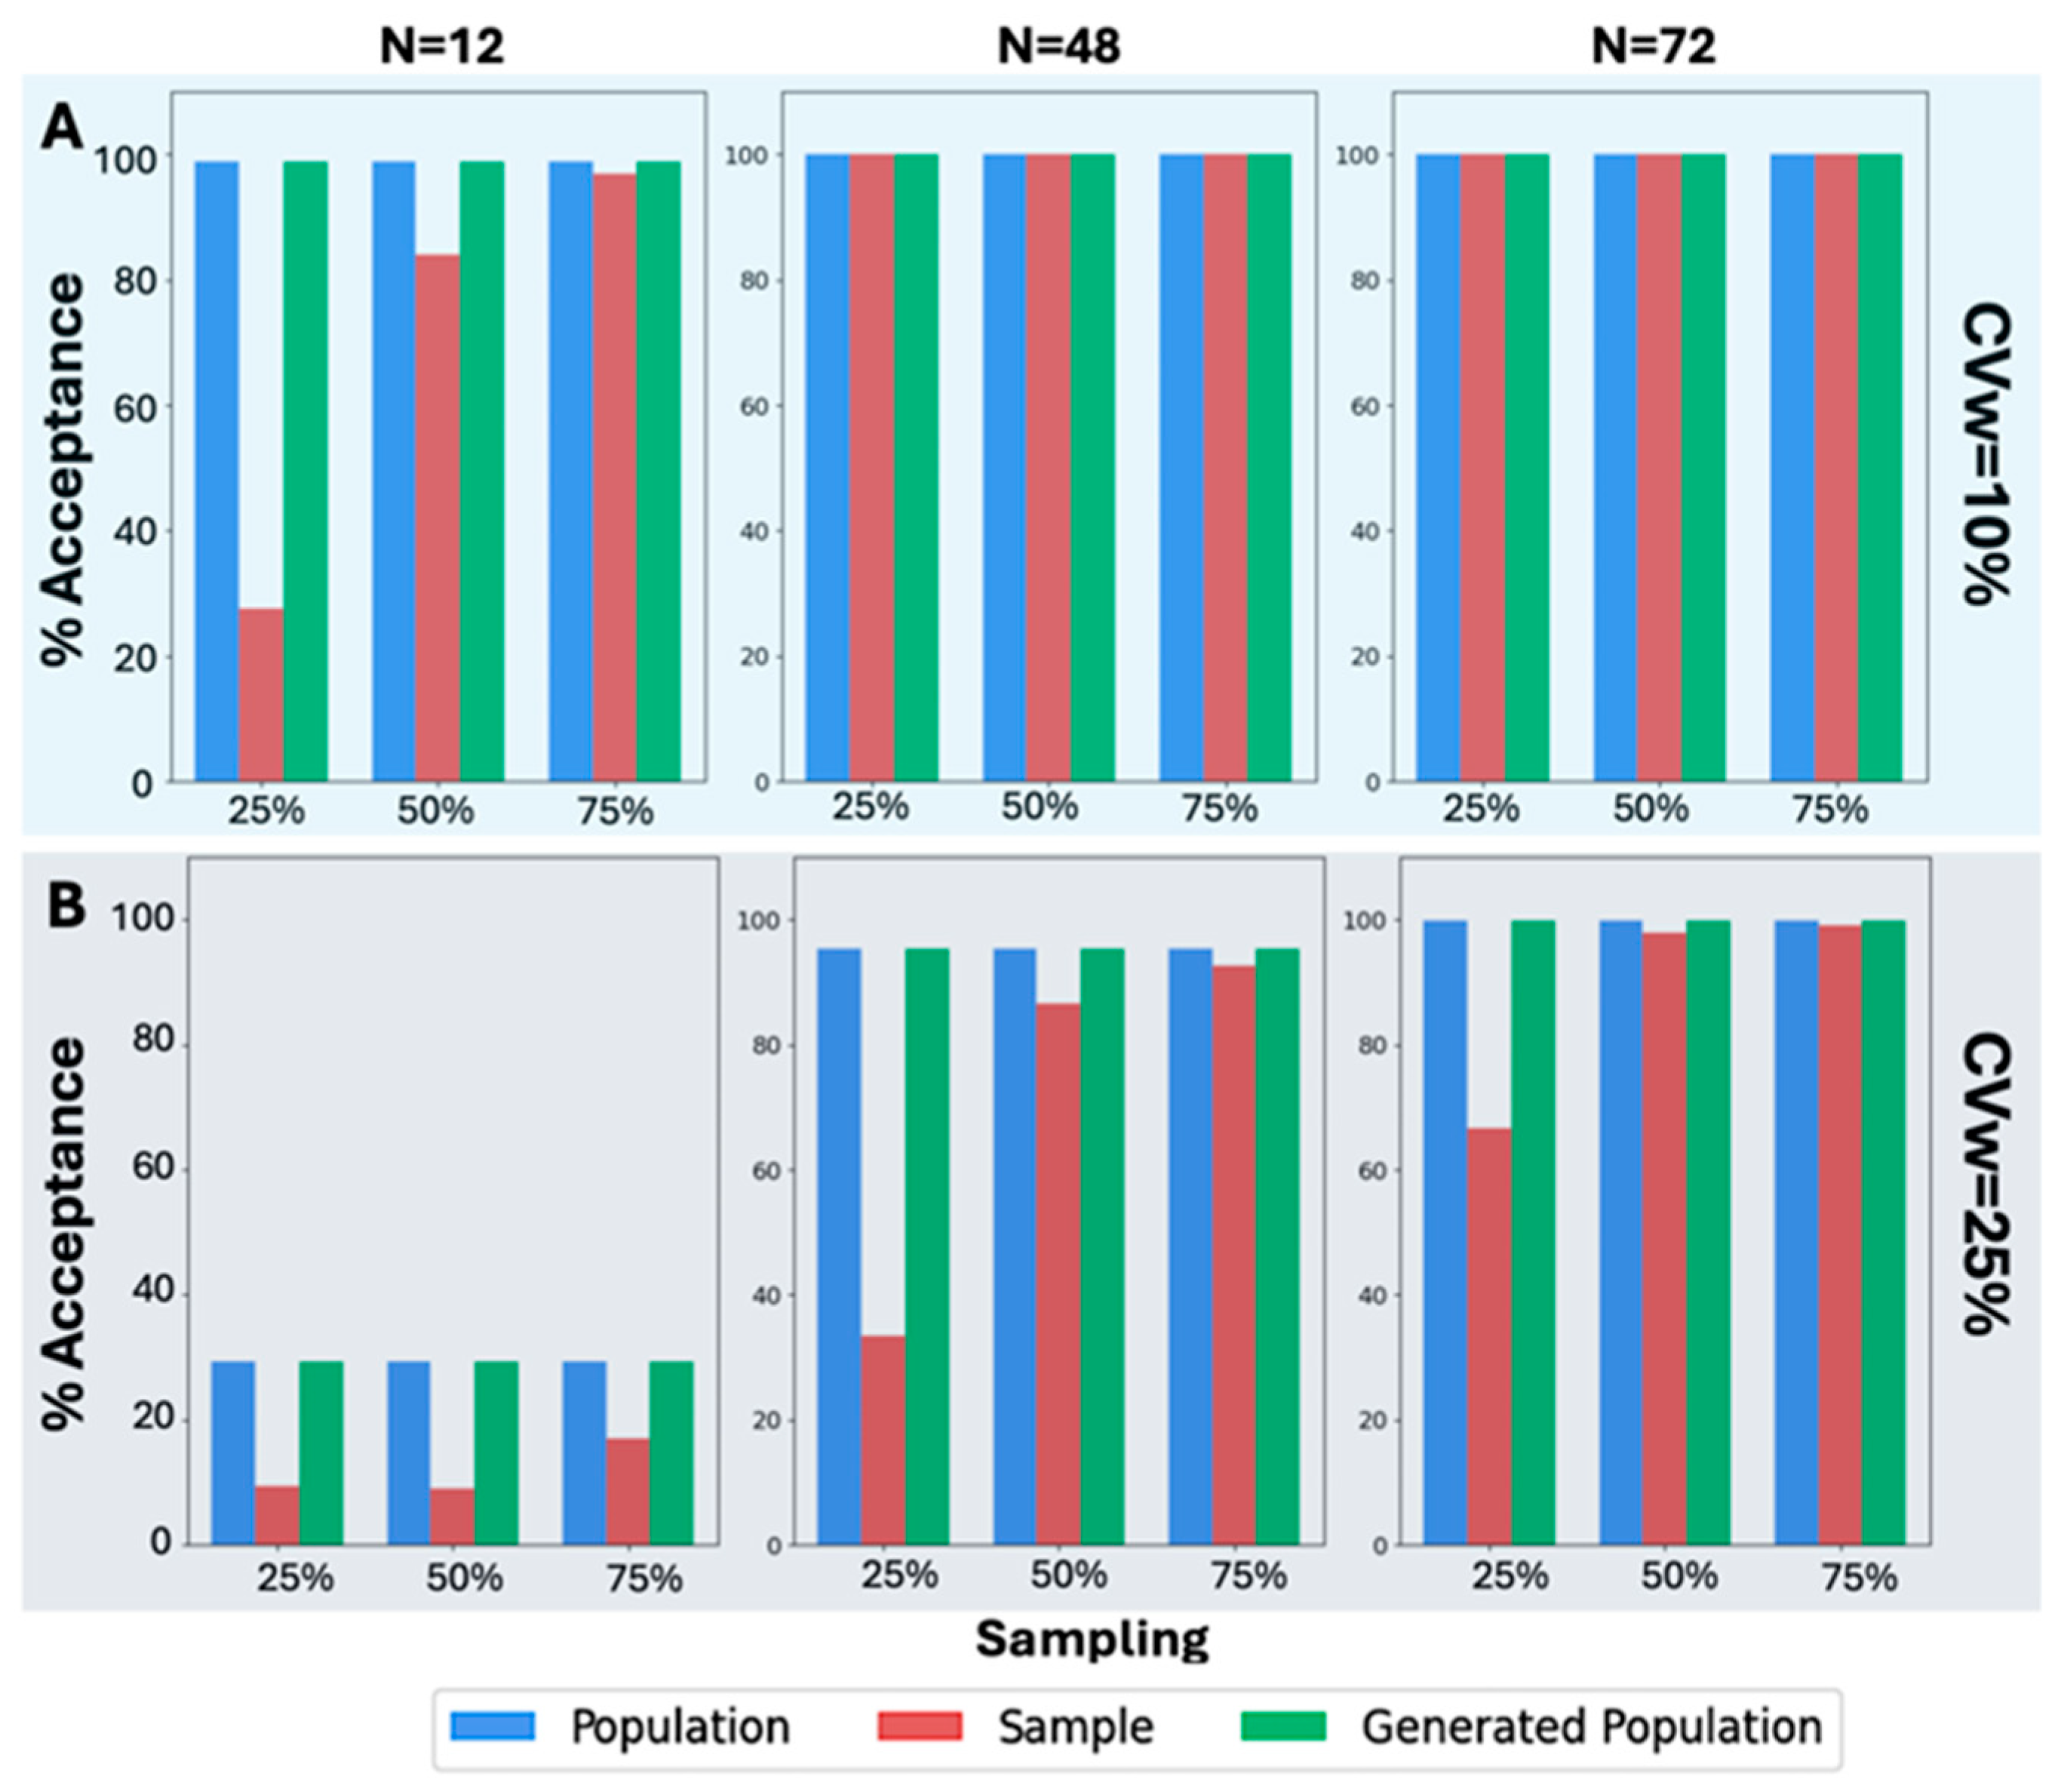
However, focusing on the scenarios where N = 24 for the results on the percentage of BE acceptance, it is evident that in all scenarios, across various values of CVw, T/R ratios, and sampling percentages, the generated population resembled the original population. In
Figure 4, the WGANs were able to produce distributions that not only resembled the original population but also had identical BE acceptance percentages. To ensure accuracy, the values from the generated distributions were examined to avoid replication of the original distribution. This indicates that the WGANs created an entirely new distribution that mirrored the BE acceptance of the original, even when the input was as small as six patients.
A similar analysis was also performed (
Figure 5) in the case of the other original sample size values, namely, 12, 48, and 72. A visual inspection of
Figure 5A reveals that the BE acceptance percentages, specifically for CVw = 10%, exhibit the same pattern as in
Figure 4. The BE acceptance percentages for the generated population consistently match those of the original population. This trend continues in all scenarios where CVw = 25%, as shown in
Figure 5B. Despite the increased CVw, the WGANs consistently produced identical BE acceptance percentages to those of the original population, while the sample failed in most scenarios to resemble the original. Notably, the WGANs achieved statistical resemblance even in challenging scenarios, such as 25% sampling of N = 12, which corresponds to only three patients. Remarkably, only three patients were sufficient for the WGANs’ algorithm to generate a distribution resembling the original, demonstrating the efficacy of this generative algorithm in very small sample sizes.
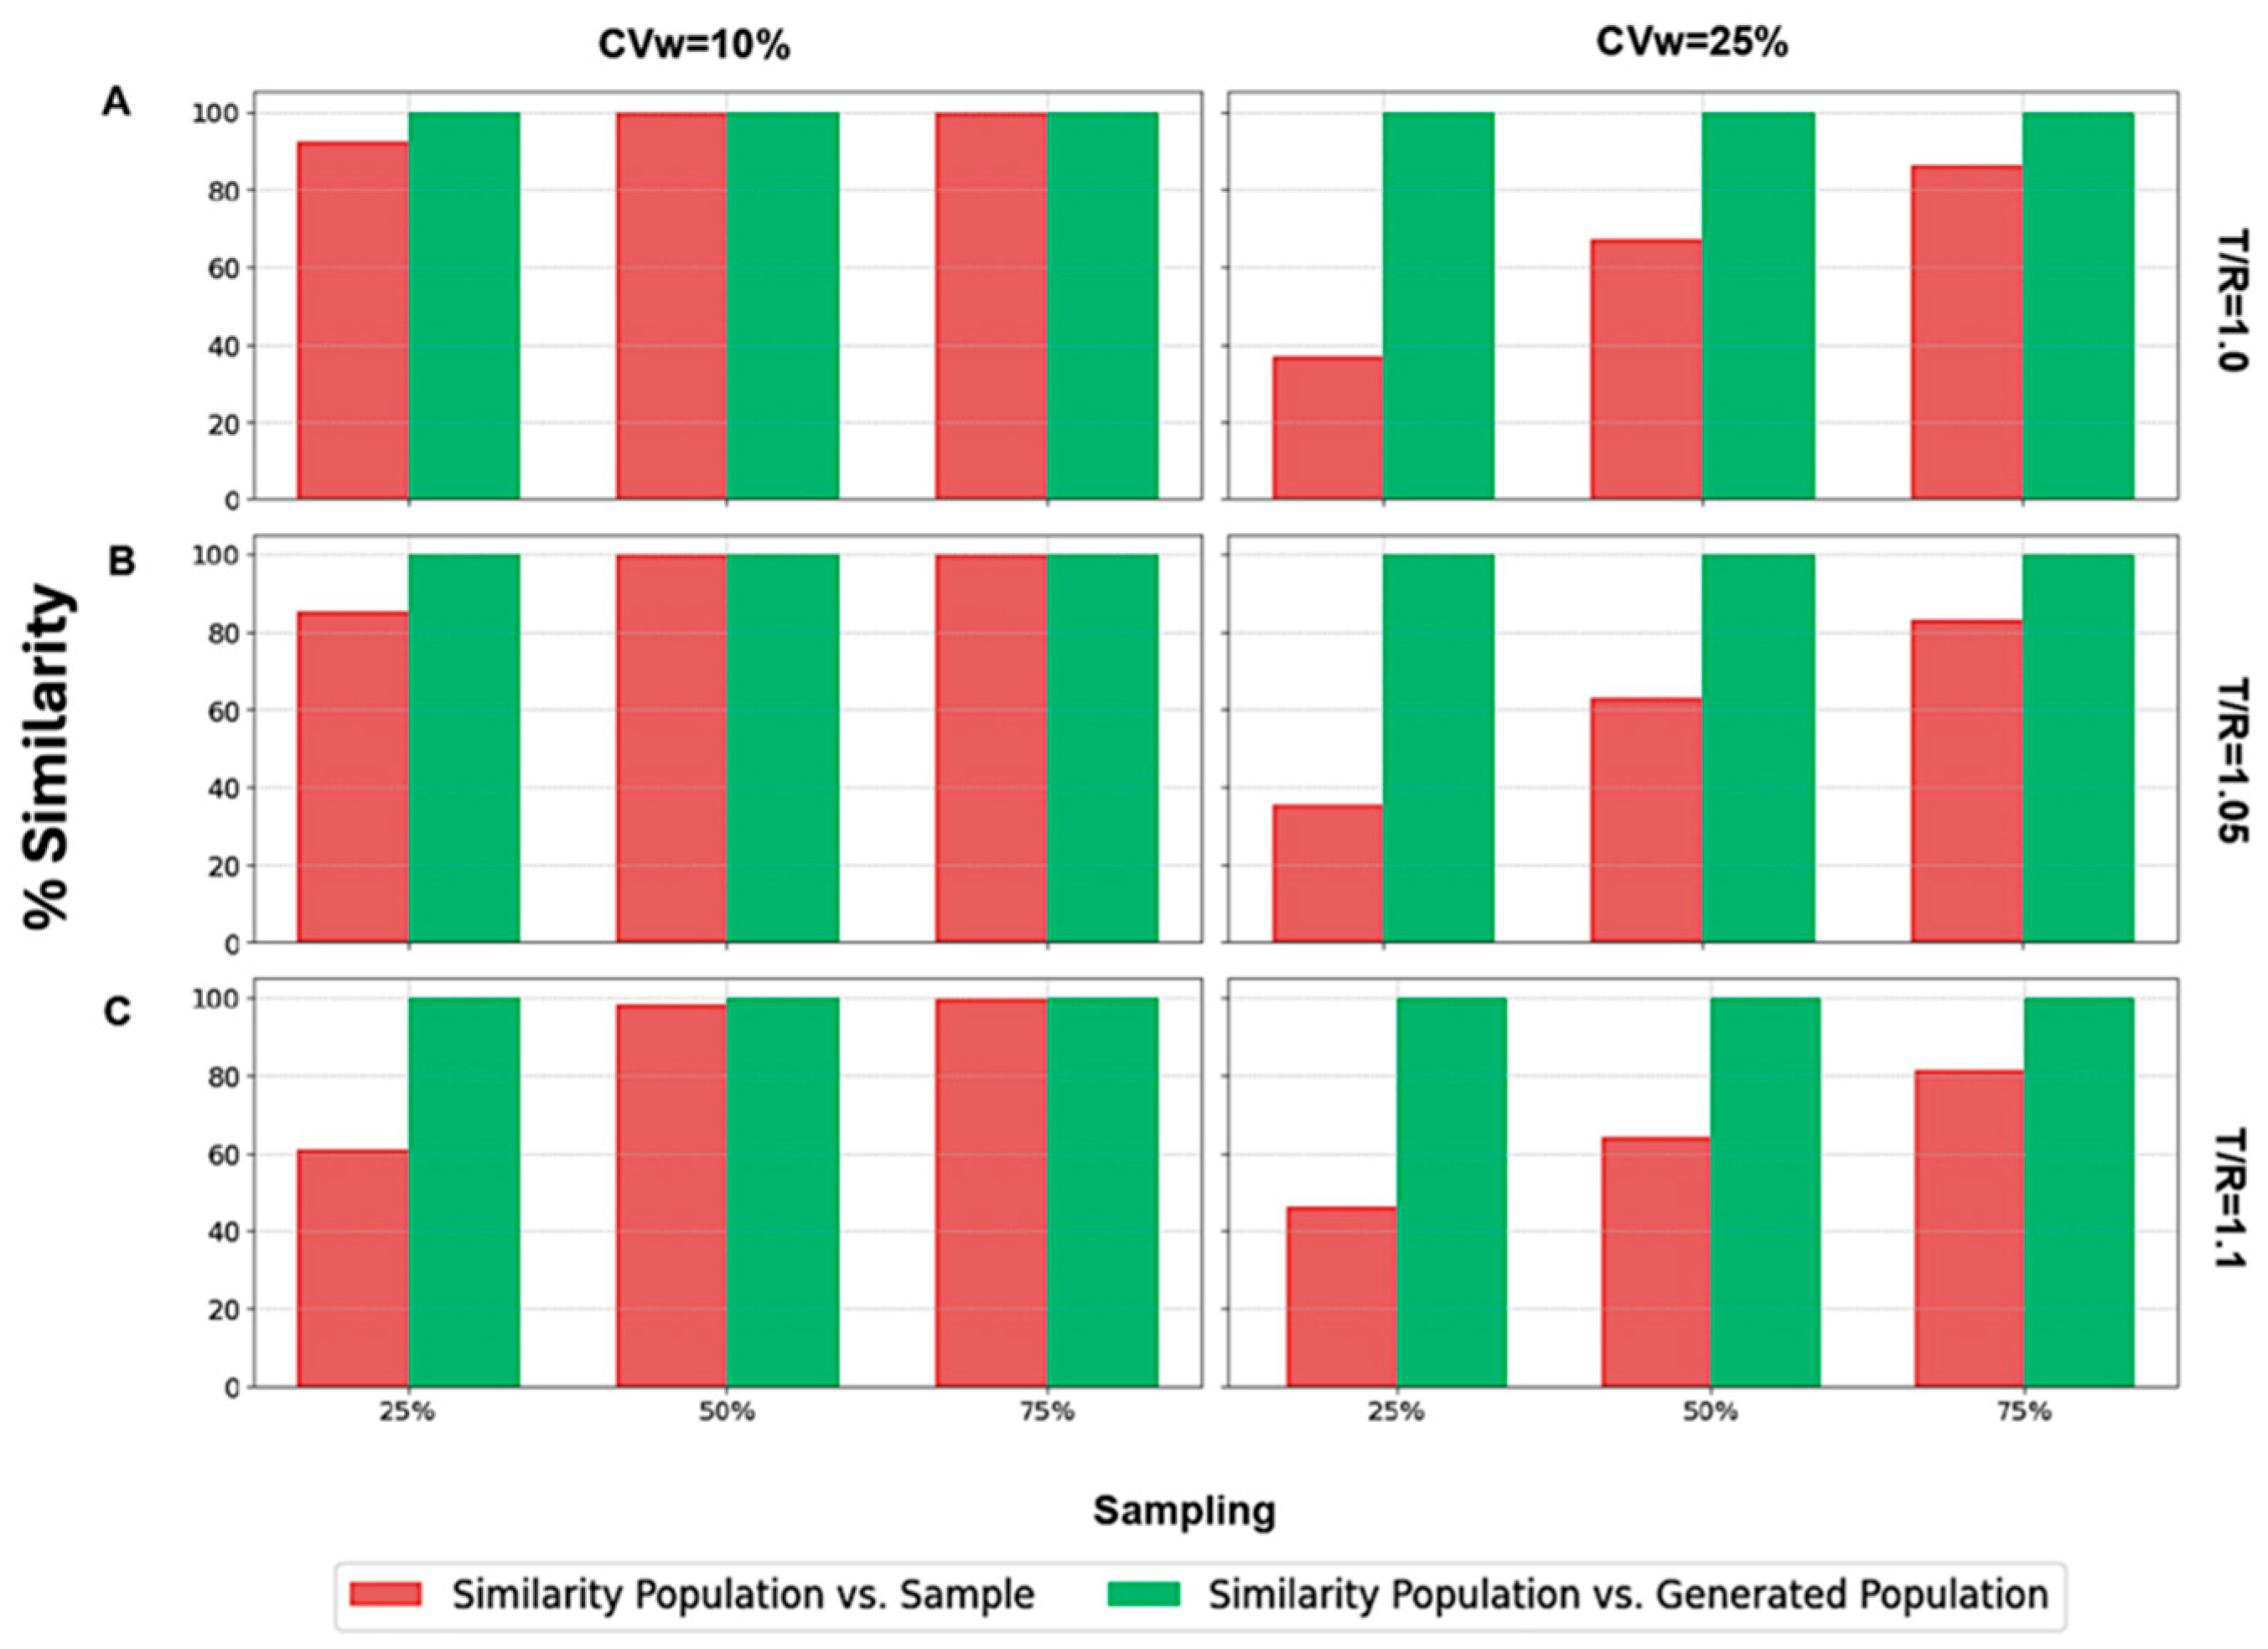
Focusing on scenarios where N = 24,
Figure 6 illustrates the two types of similarity measured: (a) between the population and the sample (in red color), and (b) between the population and the generated subjects (in green color). It is worth mentioning that identical BE acceptance percentages resulted in 100% similarity across all scenarios, irrespective of the sampling percentage, CVw value, or T/R ratio (
Figure 6).
On the contrary, only a few scenarios exhibited 100% similarity between the population and the sample. These instances occurred with a 75% sampling percentage and in two cases with a 50% sampling percentage (when T/R = 1.0 and T/R = 1.05). When the sampling percentage was as low as 25%, the sample consistently showed dissimilarity from the population, demonstrating that the sample did not resemble the population as closely as the generated population did. A similar analysis (
Figure 7) was performed for the other three sample sizes (i.e., 12, 48, and 72).
A visual inspection of
Figure 7 shows that the same behavior was observed across all the scenarios examined. In particular, the similarity between the population and the generated subjects consistently was 100%, reflecting identical BE acceptance percentages. On the contrary, the similarity between the population and the sample was 100% only for large N values (namely, 48 and 72) and for sampling percentages of 50% and 75%. As the T/R ratio increased and the N value decreased, the sample became less similar to the population. In challenging scenarios, it is evident that only the generated population could accurately resemble the original population. The right part
Figure 7 shows the similarity results for CVw = 25%. In this case, no scenario achieved 100% similarity between the population and the sample, while WGANs consistently demonstrated 100% similarity with the population.
The final step of this analysis was to evaluate the performance of the WGANs in scenarios where the generated population was twice the size of the original population.
Figure A2 illustrates the results for N = 24 across different T/R ratios, comparing BE acceptance percentages between the sample and the population, and between the generated population and the population. When the generated population was twice as large as the original, the WGANs exhibited a positive difference in BE acceptance, indicating that the BE acceptance percentage of the generated population was equal to or greater than that of the original population. For CVw = 10% and T/R values of 1.0 and 1.05, there was no difference between the generated population and the original. However, for T/R = 1.1 and CVw = 25%, the difference was consistently positive. As T/R and CVw increased, the generated population showed improved BE acceptance percentages relative to the original population. Conversely, the difference between the sample and the population in terms of BE acceptance percentages was consistently negative, indicating that the sample had a lower acceptance percentage compared to the original population.
Continuing for the other N values,
Figure A3 displays the same differences as
Figure A2 but for the N values 12, 48, and 72, when CVw = 25%. Similar behavior is observed, with the difference between the BE acceptance of the generated population and the original population being consistently positive. As the number of patients decreases, the positive difference tends to increase, highlighting that WGANs perform better with smaller samples. Conversely, the sample consistently showed lower BE acceptance percentages compared to the population, suggesting that the sample may not adequately resemble the population. Both BE acceptance percentage and similarity are crucial for assessing the resemblance of distributions, for the scenarios where WGANs generated twice as many patients as the population.
Figure A4 illustrates how the similarity percentage changes with increasing T/R ratios and CVw values for N = 12 and 75% sampling. For CVw = 10%, the similarity between the population and the generated population was consistently higher across all T/R ratios. However, for CVw = 25%, the similarity tended to decrease as the T/R ratio increased, remaining lower than the similarity between the population and the sample.
Finally, it is important to note again that the hyperparameters of the WGANs were kept constant across all scenarios to evaluate their performance. This consistency underscores the robustness of the WGAN architecture in handling diverse input data profiles, highlighting its adaptability and reliability across various clinical study settings.
4. Discussion
In our previous study, we introduced the idea of using WGANs in clinical studies to increase sample sizes by creating “virtual patients” [
21]. WGANs, a variant of GANs, utilize the Wasserstein loss function to overcome the training challenges typically associated with GANs. Our study demonstrated that distributions generated by WGANs can effectively replicate the characteristics of the population, even with a sample size percentage as small as 0.5% of a population of 10,000. Moreover, it was found that traditional sampling methods could not accurately mirror the population, whereas the similarity between the generated population and the actual population was consistently greater than or equal to that of the sample to the population [
21].
In our current study, a key challenge is the application of WGANs to significantly smaller sample sizes (e.g., 12, 24, 48, or 72), because BE studies are commonly conducted with limited participant numbers. To address this, we simulate the conditions typically seen in 2 × 2 crossover trials, the most frequently used design for BE studies. Furthermore, our statistical analyses are rigorously aligned with the official requirements set forth by regulatory authorities, such as the FDA and EMA, ensuring compliance with the established standards for BE trials. This approach allows us to evaluate the robustness of WGANs under realistic BE study constraints, potentially advancing their application in regulatory science. In this work a comparison is made among the population, sample, and generated subjects in two ways: (a) BE acceptance (statistical power) and (b) similarity with the performance of the actual population. The ultimate purpose of this study is to show how the incorporation of data augmentation techniques, such as generative AI algorithms, in clinical research can minimize costs and study durations, as well as reduce human exposure by substituting part of the actual volunteers with “virtual subjects”.
In bioequivalence studies, regulatory agencies typically require at least 80% statistical power to detect true differences between formulations. Meeting this standard often necessitates large sample sizes, driving up costs, extending timelines, and raising ethical concerns due to increased drug exposure. A promising alternative, supported by advances in generative AI, is the use of AI-synthesized virtual subjects that replicate human pharmacokinetic behavior. The aim is not to exceed the 80% power threshold but to maintain it while reducing the need for real participants. By integrating virtual subjects into study designs, researchers can minimize human exposure, lower costs, and accelerate timelines—without compromising statistical or regulatory standards.
It is important to clarify that the purpose of incorporating AI-synthesized virtual subjects is to partially substitute, not entirely replace, the need for human participants in bioequivalence or clinical studies. Our proposed approach involves enrolling a limited number of human subjects and using their pharmacokinetic data to train a generative adversarial network, specifically a Wasserstein GAN, to simulate virtual counterparts. This method is designed for application in clinical and BE trials, where regulatory power requirements must be met efficiently. It should be emphasized that this approach is not intended for use during the earlier stages of drug development, such as formulation design or lot selection. In those contexts, other modeling techniques are more appropriate [
28]. For instance, in generic drug development, the In Vitro–In Vivo Simulation (IVIVS) approach has been proposed as a semiphysiological tool [
29]. IVIVS can guide R&D efforts by linking dissolution properties to expected in vivo performance, enabling predictions of bioequivalence outcomes based solely on in vitro dissolution data. Nevertheless, formulation optimization conducted with a limited number of subjects during the early stages of product development may generate sufficient PK data to support the subsequent application of a WGAN model, which, once implemented, could facilitate the progression of the development program.
Methodologically, Monte Carlo simulations were applied to generate subjects categorized into Test or Reference groups. Random sampling was conducted at 25%, 50%, and 75% levels, with the sampled subjects serving as input for the WGANs. To ensure robust results, this procedure was repeated 1000 times for each scenario, with varying parameters such as within-subject variability (i.e., the CVw), the ratio of average endpoint values between Test and Reference groups (i.e., the T/R ratio), sampling percentages, and the size of the generated distributions (either 1× or 2× the original size).
In our study, the WGAN loss function and the similarity criterion served distinct but complementary roles. The WGAN loss function was used during the training phase to ensure stable and effective learning of the generative model. By minimizing the Wasserstein distance between real and generated data distributions, it provided smoother gradients and mitigated issues such as mode collapse, which is especially critical in BE trials that typically involve small sample sizes. This loss function guided the generator in producing virtual subjects whose statistical properties closely mirrored those of actual participants. In contrast, the similarity criterion was applied after training as an evaluation measure to determine how well the synthetic populations replicated the functional outcomes of real BE trials. Specifically, it involved comparing the results of Monte Carlo–simulated 2 × 2 crossover BE studies using real and generated subjects, focusing on the simultaneous BE acceptance of PK parameters like AUC and Cmax. Rather than merely assessing distributional similarity, this criterion evaluated whether the AI-generated populations could achieve comparable regulatory decisions, thereby validating their utility in BE assessments.
The exhaustive approach followed in this work aimed to replicate real-life conditions while evaluating the WGANs’ performance in challenging scenarios. A T/R ratio of 1.0 indicates identical performance between the groups, resulting in a relatively high BE acceptance percentage. Conversely, a larger T/R ratio, such as 1.1, indicates a 10% average difference between the groups, leading to reduced BE acceptance percentages. It was selected CVw values of 10% (small variability) and 25% (moderate variability) to test the algorithm under different conditions. Our results showed that WGANs performed well even in scenarios with relatively high T/R ratios (i.e., T/R = 1.1) or increased CVw (25%), demonstrating their capability to generate distributions like the original under challenging conditions. However, further studies on drugs with high variability are needed to evaluate WGANs’ performance in extreme scenarios. Lastly, extensive hyperparameter tuning was conducted to optimize the WGANs’ performance.
Across all scenarios where the size of the generated subjects matched the size of the original population, the generated distributions consistently exhibited identical BE acceptance percentages to those of the original distributions. This consistency is shown in
Figure 4 and
Figure 5, which show that even in challenging scenarios, the generated subjects closely resembled the original ones. It is also worth mentioning that this performance was consistent in all cases regardless of the original population size (i.e., the N).
Moreover, the abovementioned attribute is translated into a 100% similarity between the original population and the generated subjects.
Figure 6 and
Figure 7 further illustrate this point. The similarity percentages reveal that the samples could not match the original population as effectively as the generated subjects, emphasizing the potential risks of using small samples in BE studies. Notably, WGANs were able to generate distributions resembling the original with just a 25% sampling percentage. This underscores the capability of WGANs to work well with small sample sizes, capture the underlying statistical characteristics, and generate distributions that closely mirror the originals.
Regarding scenarios where the generated population was twice the size of the original, the WGAN-generated distributions achieved either a positive or zero difference in BE acceptance percentage compared to the original distribution (
Figure A2 and
Figure A3). This indicates that the generated population consistently had equal or higher BE acceptance percentages compared to the original population. Conversely, the sample consistently showed a negative or zero difference in BE acceptance percentages compared to the original distribution. WGANs demonstrated superior performance in scenarios with smaller N values, regardless of the T/R ratio, CVw, or sampling percentages, by achieving a higher percentage of BE acceptance. When comparing similarities (
Figure A4), the similarity between the population and the generated population tended to decrease as the T/R ratio and CVw increased to 25%. When CVw was 10%, the similarity between the population and the generated population was consistently higher in all scenarios compared to the similarity between the population and the sample. Conversely, when CVw was 25%, the similarity between the population and the generated population decreased as the size of the population, N, decreased.
In our WGAN-based framework for generating virtual patients in BE studies, the primary input to the model is a sampled set of PK data derived from simulated 2 × 2 crossover BE studies. Our simulations focused on a single PK parameter (i.e., AUC, Cmax) under the common assumption of a log-normal distribution. To mimic the conditions of actual BE trials, inter-subject and within-subject variability were incorporated into the simulations. The WGAN outputs a synthetic population of virtual patients whose PK profiles preserve the key statistical characteristics of the original sampled population. The model learns distributional patterns in the training data, including variability and correlations, and generates new, realistic data points suitable for further BE simulations. Key features learned by the WGAN include the shape, scale, and variability structure of the PK parameter within the simulated BE design. As a result, the generated virtual patients exhibit pharmacokinetic behavior that is statistically consistent with that of real subjects under similar trial conditions, supporting meaningful BE analysis based on synthetic data. One of the advantages of using WGANs in our approach is that there are no restrictions on the type of input data of the model, because the output will reflect the input distribution. These data can be pharmacokinetic or a variety of different endpoints, thus enhancing the applicability of our approach in different types of data.
Since in this study we proposed a new idea in the field, it is important to avoid any misunderstanding. The proposed WGAN method is designed to be applied directly to a limited, underpowered sample of actual human subjects from a specific clinical/BE study. The key idea is to use the available data from this small sample to train the WGAN, which then synthesizes virtual subjects that reflect the observed variability and structure of the real trial participants. We deliberately avoid using external sources of population PK parameters, as doing so would be both impractical and potentially introduce significant bias. This is because the WGAN is intended for use in the context of BE studies, which involve a head-to-head comparison of two specific pharmaceutical products (typically a reference and a test formulation). While some PK data might exist for the reference product, such information is typically unavailable for the test product, especially when it is a new or generic formulation. Thus, drawing from external data sources or the literature (including Bayesian methods) would not accurately represent the unique characteristics of the test product under investigation. Importantly, the objective of this approach is not to reconstruct missing data for a known drug but rather to model the comparative performance of two formulations within the specific context of the BE trial. Relying on external data would undermine this aim and compromise the integrity of the virtual population.
It is important to address some limitations of this research. The execution time for each scenario required a significant amount of time and substantial computational resources. While more advanced systems could provide faster training and quicker results, the computational resources available to us were sufficient to successfully execute the scenarios in our research. In bioequivalence studies, while WGANs can improve the quality of data generation and support more robust statistical analyses, careful training of the model is essential to avoid biases that may be amplified during data generation [
30]. This is particularly critical when assessing drug side effects. Additionally, the importance of generating “virtual patients” from a limited pool of real patient data should not be overlooked.
In addition, to further advance the application of AI-generated subjects in BE studies, it is essential to expand the current framework beyond low-to-moderate variability cases (e.g., 10% and 25%) and explore scenarios involving highly variable drugs. These drugs, often characterized by an intra-subject variability exceeding 30%, present significant challenges in BE assessment and require more sophisticated modeling of distributional extremes, including outliers and skewed data. Additionally, future research should examine cases where the GMR exceeds the conventional BE acceptance limits (e.g., GMR > 1.25) to explicitly evaluate the model behavior under non-bioequivalent conditions and assess type II error rates. This will help determine whether the virtual population approach maintains appropriate sensitivity and specificity in detecting true differences between formulations.
It is important to note that while our approach increases statistical power by augmenting datasets with “virtual patients”, the evidence for demonstrating BE must continue to originate from real human subjects. The integrity of BE assessments depends on data derived from actual clinical trial participants, and this remains a non-negotiable standard for regulatory acceptance. In this context, it is also essential that the enrolled human subjects constitute a representative sample, in accordance with general statistical sampling principles, to ensure the external validity and applicability of the study findings. Our method is not intended to replace human-based evidence, but rather to enhance the efficiency, robustness, and ethical conduct of BE studies. By incorporating AI-generated virtual subjects, researchers can reduce the number of real participants required, lower study costs, minimize unnecessary human exposure, and shorten timelines—while still meeting statistical and regulatory standards.
Given that generated data must undergo extensive validation, regulatory acceptance remains limited, and the applicability of such algorithms must be carefully examined in real-world scenarios. This study is the first to introduce the use of WGANs in BE research, offering a foundational proof-of-concept for leveraging generative AI to create virtual patients within the context of generic drug evaluation. While our approach generates virtual subjects based on the distributional characteristics of the underlying population, we acknowledge that real-world BE studies often present complexities such as extreme values, outliers, and deviations from lognormality. This issue can be addressed in several ways. For example, in the study of Burger et al., it was proposed a robust Bayesian method using skew-t distributions to assess the average BE in crossover studies [
31]. The proposed approach effectively handled outliers and skewed data to improve inference accuracy and statistical power. Thus, a possible solution could be the incorporation of similar Bayesian methods in the WGAN model. A similar approach has recently been proposed in the form of BayesT, which is a non-informative Bayesian method designed to assess BE as an alternative to the traditional Two One-Sided t-Tests. BayesT offers greater robustness in datasets with deviations from lognormality or extreme values, where it showed more consistent and potentially less conservative results. Additionally, its ability to be pre-specified for regulatory use provides a structured and reliable alternative for evaluating BE in challenging scenarios [
32].
Another way is to rely on the WGAN itself, because it is feasible to train a WGAN model on data that deviate from normality or lognormality. WGANs are particularly well suited for modeling complex, non-Gaussian distributions due to their use of the Wasserstein distance, which provides more stable training dynamics and meaningful loss metrics than traditional GANs [
33]. However, outliers can negatively impact training by destabilizing the critic, distorting gradient updates, and biasing the generator toward anomalous regions of the data space. To address these effects, preprocessing steps such as normalization, robust scaling, or outlier-handling techniques (e.g., clipping or statistical detection) can be used. Additionally, using the gradient penalty variant (WGAN-GP) instead of weight clipping has been shown to improve convergence and stability, especially in datasets with heavy-tailed distributions or significant outlier presence [
34,
35,
36,
37,
38]. These measures help ensure the model remains robust and capable of generating high-quality synthetic data that accurately reflect the underlying distribution. Nevertheless, it should be mentioned that this study represents an initial step in a broader and rapidly evolving field. Substantial work remains, including ongoing and future efforts to validate these approaches—particularly in addressing non-normal distributions and the impact of outliers. Progress in this area will also require close collaboration with regulatory bodies to define clear, acceptable pathways for integrating AI-generated data into regulatory decision-making. In parallel, related challenges such as high variability are being investigated by our research team [
39].
By generating synthetic data based on existing datasets, AI-driven augmentation methods expand sample sizes, improve model performance, and help mitigate biases in the data. Among these, the implementation of diffusion models has recently emerged. For example, these models have recently been shown to enhance both performance and fairness in tabular data tasks by generating synthetic samples that better capture the variability of underrepresented groups [
40]. Similarly, in natural language processing, AI-based augmentation techniques including paraphrasing and back-translation have been used to increase data diversity and reduce model bias, particularly in low-resource scenarios [
41]. Finally, Variational Autoencoders have been thoroughly examined in different scenarios in the field of clinical and BE studies, highlighting their advantages in recent research [
42]. These developments illustrate the broader applicability of AI in augmenting datasets to improve robustness and generalizability [
43]. In the context of BE and pharmacokinetic studies, such approaches offer an opportunity to simulate larger and more diverse virtual populations, which can enhance the statistical power of studies without additional human recruitment.
The aim of this study was to introduce the concept of using generative AI algorithms in the assessment of generics, where limited numbers of healthy volunteers are utilized. This is a major challenge in clinical research, as we aim to minimize actual human exposure in clinical trials while still achieving the desired statistical power and ensuring that the study performance (with AI-synthesized volunteers) matches that of a study with a large sample size. Our proposed approach does not intend to suggest that current regulatory standards call for higher BE power, but rather to highlight that increasing power beyond the standard threshold can offer practical benefits, such as reducing sample sizes, improving the robustness of the study, and addressing challenging cases (e.g., extreme scenarios of highly variable drugs). Our research aims to enhance study efficiency while remaining fully compliant with existing regulatory standards. The ultimate purpose is thereby reducing the need for human exposure in BE trials. Generative AI algorithms, such as WGANs, offer significant advantages in generating distributions that closely resemble the original population. These algorithms achieve better performance with small sample sizes, whereas traditional samples often fail to capture the population characteristics.
It should be emphasized that this study is the first to introduce the use of WGANs in BE assessment. This study represents only a novel and early-stage concept in applying artificial intelligence to regulatory science. As such, we anticipate that initial regulatory feedback will focus on understanding the foundational principles of this approach, particularly the processes involved in generating and validating virtual patient data. Regulatory agencies will require time to fully evaluate the methodology and its implications and will likely seek a clearly defined, step-by-step framework detailing how generative models are trained, validated, and applied in BE contexts. A key area of regulatory interest will be the reproducibility of results, namely, whether AI-generated virtual populations can consistently produce trial outcomes that align with those derived from real human subjects. Moreover, regulators will expect robust evidence demonstrating that synthetic data can preserve BE acceptance decisions across a range of study scenarios, including those with real-world complexities such as outliers, non-normal distributions, and high inter-subject variability. For this new approach to gain regulatory acceptance, it must be accompanied by transparent methodology, rigorous statistical validation, and a clearly articulated roadmap for integration into current regulatory pathways. Our future work will focus on collaborating with regulatory authorities to co-develop such frameworks and address core concerns related to scientific rigor, ethical standards, and practical implementation.


