1. Introduction
Currently, the recognition of people and their associated emotional states from thermal facial images using algorithms and specific methods of machine learning and deep learning has shown promising progress. A variety of techniques have been explored in this field, with some focusing on extracting features from thermal images and applying different machine learning algorithms such as support vector machines (SVM) or random forests (RF) for classification tasks. However, the advancement in deep learning has also played a significant role in this area, with convolutional neural networks (CNNs) being commonly used for feature extraction and classification from facial thermal data [
1]. Researchers are continually developing and fine-tuning neural network architectures to improve the accuracy and robustness of emotion recognition from thermal facial images. Challenges still exist, such as the limited availability of large-scale labeled thermal facial datasets, the need for domain adaptation techniques to handle variations in environmental conditions, and the ethical considerations surrounding privacy and surveillance. Nevertheless, the ongoing research and development in this field hold great potential for applications in various fields, including healthcare, security and human–computer interaction [
2,
3].
In the process of recognizing people and their associated emotional states from facial thermal images, a comparison between different machine learning algorithms and deep learning methods reveals notable distinctions. Conventional machine learning algorithms such as support vector machines (SVM) and random forests (RF) rely on handcrafted feature extraction from thermal images, which may limit their ability to capture complex patterns and nuances in emotional expressions accurately. On the other hand, deep learning methods, particularly convolutional neural networks (CNNs), have demonstrated to be more suitable for certain types of tasks (superior performance), i.e., for example in automatically learning relevant features directly from the raw data, allowing for more robust and nuanced emotion recognition. CNNs excel in capturing spatial dependencies in thermal facial images, enabling them to discern subtle details that general/conventional algorithms may overlook [
3]. However, deep learning approaches typically require large amounts of labeled data for training, which can be a limitation in domains where annotated datasets are scarce, and their higher computational requirements can make them impractical for certain low-power or real-time applications (e.g., wearable health monitoring devices); however, in recent years, DL data limitations have been mitigated in some cases by transfer learning, pre-trained models and augmentation. Additionally, deep learning models may be computationally intensive and complex to train compared to traditional machine learning algorithms. General machine learning (ML) approaches (RF, SVM, KNN) work well usually for structured, lower-dimensional datasets; on the other hand, deep learning (DL) models (CNNs) are powerful for high-dimensional, unstructured data but require larger datasets and more computational power. For small datasets, ML can generalize well without overfitting, but for larger datasets, CNNs can learn more complex features. Machine learning (ML) and deep learning (DL) are complementary rather than contrasting techniques, with each excelling under different conditions. Despite these challenges, the remarkable precision and adaptability of deep learning methods in handling complex emotional states from thermal facial images make them usually a preferred choice in many applications where the classification accuracy is essential [
4,
5].
CNNs excel in capturing spatial patterns and hierarchical features from images, making them well suited for analyzing facial thermal images. While CNNs are more computationally intensive compared to traditional machine learning algorithms, advancements in GPU acceleration and frameworks like TensorFlow have significantly improved their training efficiency. CNNs offer high feasibility for classifying emotional states from facial thermal images due to their ability to automatically extract features at different levels of abstraction. They can learn complex and different patterns in the data, potentially improving classification accuracy. Transfer learning with pre-trained CNN models can further enhance the feasibility by leveraging knowledge from large datasets.
Machine learning is a branch of artificial intelligence that involves developing algorithms and statistical models to allow computer systems to improve their performance on a specific task without being explicitly programmed. It relies on patterns and features, allowing machines to learn from data and make predictions or decisions based on it. Machine learning can be in general categorized into supervised, unsupervised and reinforcement learning techniques [
5].
In the field of thermal imaging, numerous applications are emerging as advancements in image quality and affordability continue to progress. Paper [
6] discusses how the increasing image quality and decreasing costs are driving the growth of thermal imaging applications. These applications span across various fields and categories, including industry [
7], medical [
8], military [
9], personal use [
10] and security [
11].
Over the past few decades, artificial intelligence has transformed the field of emotion recognition, with machine learning (ML) and deep learning (DL) emerging as two complementary yet distinct approaches. Traditional ML methods, such as support vector machines (SVM), random forest (RF) and k-nearest neighbors (KNN), have long been used for thermal image classification, relying on handcrafted features like temperature gradients and facial region segmentation. However, while effective for structured datasets, ML methods require extensive feature engineering and manual optimization, making them sensitive to variations in thermal imaging conditions. The rise of deep learning, particularly convolutional neural networks (CNNs), revolutionized this field by enabling automatic feature extraction, reducing the reliance on manually designed descriptors. Unlike ML, CNNs can learn spatial and intensity-based patterns directly from raw thermal images, improving classification accuracy, especially with large datasets. Despite this, deep learning models remain computationally demanding and often require substantial labeled datasets, making them less practical for real-time applications or resource-constrained environments. As a result, both ML and DL remain relevant today, each excelling under different conditions—ML providing efficiency and interpretability for smaller datasets, while DL offers superior feature learning capabilities when computational resources and data are abundant. By bridging these two paradigms, this study aims to evaluate their respective strengths and limitations in thermal image-based emotion recognition, offering insights into optimal model selection for real-world applications.
The paper is organized into five sections, as follows. In the
Section 2, the thermal image databases used in this paper are introduced, followed by the database expansion techniques, the preprocessing chain for the thermal images, the artificial intelligence methods used, the classification metrics and the classification and feature extraction method. In the
Section 3, the experimental results obtained in this work with the four classification algorithms (CNN, SVM, RF and KNN) and the two augmented categories of thermal images (i.e., thermal images with Gaussian noise and thermal images with “salt and pepper” type noise) are presented. In the
Section 4, a series of general conclusions and discussions is presented regarding the obtained results. In the
Section 5, a series of concrete conclusions and contributions drawn from the study is presented.
1.1. Research Problem and Objectives
The field of emotion recognition from facial thermal images presents a unique set of challenges that differ significantly from traditional visible-light-based emotion classification. Unlike standard RGB image datasets, thermal imaging provides a non-intrusive way to analyze emotional states by detecting variations in heat distribution across facial regions. However, this approach introduces several key challenges, including limited dataset availability, susceptibility to noise, and the computational complexity of deep learning models.
This paper addresses the problem of multiclass classification of human emotions using facial thermal images, with a focus on determining the most suitable machine learning approach for accurate classification. The key scientific challenges in this domain include
Limited availability of large-scale labeled thermal datasets: Unlike visible-light facial recognition, thermal imaging lacks publicly available, extensive datasets for emotion classification, making it harder to train complex models.
Noise sensitivity in thermal imaging: Environmental conditions and inherent thermal sensor noise can degrade classification performance.
Algorithmic trade-offs: Traditional machine learning approaches require extensive feature engineering, while deep learning methods demand significant computational resources and large datasets, with some exceptions.
The pain point of current research is achieving high accuracy in emotion classification from thermal images despite the challenges of dataset size, noise interference, and computational constraints. This paper introduces a comparative analysis of machine learning vs. deep learning models to identify the most effective method in this context, filling a gap in the literature where previous studies have either focused solely on deep learning or relied on basic machine learning techniques without augmentation strategies.
The innovation in this work is reflected in the following:
A comparative study of different AI-based classification methods (SVM, RF, KNN, CNN) for thermal facial emotion recognition.
The use of database augmentation with Gaussian and “salt and pepper” noise to enhance generalizability.
A systematic evaluation of algorithm performance under varied noise conditions, highlighting practical applications in real-world noisy environments.
While deep learning, especially attention mechanisms, has demonstrated strong classification performance in various tasks, the decision to use both traditional machine learning (RF, SVM, KNN) and CNN in this study is based on several factors:
Data limitations: Deep learning methods require large-scale, labeled datasets, which are scarce in thermal imaging. Traditional machine learning algorithms can still yield competitive results with smaller datasets and carefully extracted features. Unlike standard image datasets, thermal facial image datasets are relatively small, making it difficult to train deep models effectively. Machine learning models can still achieve high accuracy without requiring massive labeled datasets.
Comparative perspective: The goal was to assess and compare classical and deep learning approaches. The findings show that CNN achieves superior accuracy (up to 100%), but certain machine learning models (e.g., RF) also perform exceptionally well under specific configurations.
Practical deployment considerations: While deep learning (CNN) is integrated in the study, machine learning approaches offer advantages for scenarios where hardware limitations prevent the use of complex neural networks.
Computational efficiency: Machine learning models are less resource intensive, making them viable for real-time or embedded applications where deep learning might be computationally prohibitive. Deep learning models often require high-end GPUs and extensive training time. Machine learning models like random forest and SVM are much faster and can be deployed on low-power devices, making them more suitable for real-time applications. In resource-constrained environments (e.g., IoT, mobile devices or medical monitoring systems), RF and SVM could be preferred over CNNs due to their faster inference times and lower hardware requirements.
Noise handling and generalization: Our study involves dataset augmentation with Gaussian and “salt and pepper” noise to simulate real-world conditions. Machine learning methods, when combined with proper preprocessing, can achieve robust classification despite added noise.
Fair benchmarking: Many studies emphasize deep learning without comparing their performance to traditional models. Our work provides a comprehensive benchmark that can guide researchers in selecting the appropriate model based on available resources and application requirements.
Although this study focuses on machine learning vs. CNN-based deep learning, the field has rapidly evolved with more advanced techniques, such as those presented below.
Attention mechanisms (e.g., SE-Net, CBAM):
Vision Transformers (ViTs) and Swin Transformers:
Graph Attention Networks (GATs):
While these techniques were beyond the scope of this work due to dataset and computational constraints, they present valuable directions for future exploration.
1.2. Thermal Image vs. Visual Image
Emotion recognition using thermal imaging is an emerging field that differs significantly from traditional RGB-based (visual images) facial analysis. While CNNs have proven to be highly effective in standard image classification, the unique properties of thermal images necessitate a deeper understanding of how features are extracted and classified. This section provides a clearer scientific justification for the approach taken, the relevance of comparing machine learning (ML) and deep learning (DL) methods and the contextual differences in research findings. Emotion detection using thermal images is motivated by physiological and environmental factors that make it distinct from traditional visible-light image processing, like those presented below.
Physiological Basis of Emotion Recognition in Thermal Imaging:
Unlike visual images that rely on facial muscle movements and geometry, thermal imaging captures heat variations on the skin, which correspond to changes in blood flow caused by emotional states.
For example, stress, fear and excitement can cause temperature changes in the forehead, periorbital (eye) region and nose due to increased or decreased blood circulation, which are not visible in standard RGB (visual) images.
This provides a non-intrusive, contactless way to detect emotions without requiring facial expressions, which may not always be clearly visible (e.g., for individuals wearing masks or with facial paralysis).
Robustness to External Factors:
Lighting conditions: Unlike RGB-based methods, thermal imaging does not require controlled lighting, making it useful in low-light or night-time environments.
Facial occlusions: Thermal images are less affected by makeup, facial hair or head coverings, which can obscure important features in visible-light images.
Privacy-friendly applications: Since thermal images do not reveal detailed facial features, they are better suited for ethical emotion monitoring, where anonymity is needed.
Relevance to Real-World Applications:
Medical applications: Stress detection, mental health monitoring, lie detection and fatigue monitoring (e.g., for drivers).
Security and surveillance: Unlike RGB cameras, thermal cameras can operate in complete darkness, making them useful for unobtrusive emotion monitoring.
Privacy advantages: Unlike visible-light cameras, thermal imaging does not capture identifiable facial features, making it a privacy-friendly approach for applications like emotion-aware AI.
Scientific Relevance of Comparing ML and DL Models:
CNNs have outperformed ML models in most image-based tasks since about 2014. However, thermal images are fundamentally different from RGB (visual) images because they do not rely primarily on geometric facial structures.
Unlike in RGB (visual) images, where CNNs learn complex spatial hierarchies of edges, textures and shapes, thermal images contain temperature gradients rather than distinct shapes.
Temperature distribution (color) in thermal images is more important than facial structure, ML models like SVM and RF, which focus on feature-based classification, are still effective in this case.
1.3. Software Applications
The experimental software environment consists of the Google Colab version 1.2.0 cloud-based platform for implementing the hybrid model, i.e., CNN for deep feature extraction and classification and three other algorithms that were used only for classifying emotional states from thermal facial images (i.e., neutral, happy and sad). Google Colab is a cloud-based platform that provides free access to GPUs (Graphics Processing Units) and TPUs (Tensor Processing Units) for running machine learning and deep learning workflows. It allows users to write and execute Python 3.10 codes in a browser-based environment without the need for any setup or installation.
For the preprocessing of the images and the development of the two augmented databases with added noise (Gaussian and “salt and pepper” with 100 levels of added noise) the MATLAB R2020a program was used together with the Image Processing Toolbox. MATLAB R2020a, together with the following versions, combined with the Image Processing Toolbox, provides a powerful framework for thermal facial image processing, making it a valuable tool for emotion recognition and human classification. This software version includes enhanced deep learning integration, GPU acceleration and advanced image filtering techniques, all of which are crucial for extracting meaningful features from infrared facial data. The Image Processing Toolbox offers essential functions for image enhancement, segmentation and feature extraction, allowing researchers to preprocess thermal images effectively by removing noise, enhancing contrast and detecting key facial regions. Additionally, MATLAB R2020a supports machine learning and deep learning models, enabling seamless training and deployment of support vector machines (SVMs), random forests (RFs), convolutional neural networks (CNNs), and even Vision Transformers (ViTs) for classifying emotional states based on temperature variations in the face. The toolbox also facilitates edge detection, morphological operations and histogram-based analysis, all of which are critical for improving the accuracy and robustness of thermal-based emotion recognition systems in real-world applications such as security, healthcare and human–computer interactions.
1.4. Previous Work
1.4.1. General and Advanced Methods
In the field that deals with the process of recognition and classification of facial thermal images using conventional extraction and classification methods (excluding artificial intelligence techniques), researchers have explored various approaches based on similarity or dissimilarity metrics. These methods are utilized to process thermal images of human faces and classify them, for example based on predefined emotional states [
12]. Some of the works from the non-AI field are presented below, which address thermal images and different conventional classification methods and techniques, as well as different methods of feature extraction.
A technique for analyzing facial thermal images (depicting human faces) for classification purposes was introduced in the research paper [
13]. The primary objective was to identify appropriate representations and descriptors/features that would lead to high accuracy in recognition. Various transformations of the data were evaluated for image processing, including information-based transformations like the transformed Renyi method. The classification process relied on pattern similarity. The results obtained from classifying emotional states (e.g., neutral, happy, sad) using different distance metrics such as Euclidean (E), Manhattan (M), Canberra (C) and Pearson (P) have shown promise. The study considered three classes, each with seven images. The most successful distance metric was found to be Canberra with a maximum accuracy of 100%, achieved with a minimum of 400 coefficients (20 × 20 grid).
The analysis of informational content conducted by evaluating two informational measures, namely, Renyi entropy and Renyi divergence, among various available methods and discriminant functions was addressed in research paper [
14]. The estimation of probability distributions was approached in two distinct methods, with a specific focus on implementing the simpler one in customizable programmable hardware like FPGA (Field Programmable Logic Arrays). The numerical findings corresponding to four different areas of interest denoted as M (mouth), M + N (mouth plus nose), E (eyes) and M + N + E (mouth plus nose plus eyes) displayed promising outcomes, with each area comprising four distinct cases. The study highlighted the mouth (M) and eyes (E) regions of the face as the most significant for emotional state recognition, achieving a maximum accuracy of approximately 71%. Furthermore, experiments were conducted with more intricate regions such as the mouth area plus nose area (M + N) which yielded a maximum accuracy of around 76%, and the mouth area plus nose area plus eyes area (M + N + E) with a maximum accuracy of approximately 72%. Notably, the most favorable outcomes were observed for the combination of the mouth area and nose area (M + N). For each region of interest, the Renyi divergence (RD) emerged as the most effective measure, leading to the highest recognition rates. The statistical distribution was estimated by normalizing the images. Conversely, the results obtained with the Renyi entropy (RH) were deemed unsatisfactory, irrespective of the estimation method, falling below the 50% threshold.
The research conducted in the paper [
15] suggested utilizing thermal imaging technology as a non-intrusive method for analyzing physiological signals linked to affective states. The study postulated that changes in cutaneous temperatures resulting from blood circulation in the facial blood vessels, as captured by thermal imaging from the frontal face area, could directly correlate with various affective states in autistic children. To investigate this hypothesis, a meticulously planned experimental setup was established to capture thermal imaging data during the display of different affective states induced by varied audio–visual stimuli. A wavelet-based approach was implemented for detecting patterns in the time-series data obtained from the specified region of interest. In this study, a model representing the affective states of typically developing children aged 5 to 9 served as a benchmark for assessing the performance of the affective state classifier designed for autistic children. The classifier’s outcomes demonstrated the efficacy of the methodology, showcasing an encouraging classification accuracy of 88% in accurately identifying the affective states of autistic children. These findings were significant as they successfully differentiated between fundamental affective states and offered valuable insights that could enhance social–emotional interactions among autistic children.
A novel approach aimed at addressing the challenge of analyzing human facial features using infrared imagery, particularly in cases where the presence of eyeglasses renders the eye regions dark and hinders the capture of thermal information, was introduced in the research presented in paper [
16]. To overcome this limitation, the study proposed a temperature space technique that leverages the surrounding facial regions’ thermal data to correct for the effects of eyeglasses. Subsequently, the research employed various methodologies, including Principal Component Analysis (PCA), the Eigenspace method based on class-features (EMC), and a combined PCA-EMC approach, to classify human emotions based on the refined thermal images. The study utilized the Kotani thermal facial emotion (KTFE) database for data collection and conducted experiments to evaluate the proposed methods’ effectiveness. The experimental results indicated a notable enhancement in the accuracy rate of estimating human emotions using the corrective temperature space method in conjunction with PCA, EMC and PCA-EMC techniques. This signifies a promising development in the field of thermal imaging-based emotion classification, showcasing improved performance and reliability in emotion recognition tasks. The results regarding the accuracy of the classification process were between approximately 60% and 90%.
The distribution of facial skin temperature across a range of mixed thermal facial expressions sourced from a custom-built face database was investigated in the study outlined in paper [
17]. Within this database, six expressions were identified as basic, while the remaining 12 were combinations of these fundamental facial expressions. An intricate analysis of temperature patterns was conducted across three specific facial regions of interest (ROIs)—the periorbital, supraorbital and mouth areas. Various statistical parameters were utilized to measure the temperature variability within these ROIs across different expressions. This analysis yielded temperature variation metrics within ROIs for each specific expression, creating a unique vector representation for subsequent recognition of mixed facial expressions. The investigation revealed that mixed facial expressions exhibit discernible features linked to positive and negative emotions. Notably, the supraorbital region emerged as a significant facial area capable of distinguishing between basic and mixed expressions. Further exploration and interpretation of mixed expressions were facilitated through the application of box and whisker plots, highlighting that regions showcasing a blend of two expressions generally exhibit lower temperature variations compared to regions dominated by basic expressions. The results regarding the accuracy of the classification process were very low; the maximum accuracy value obtained was approximately 50%.
A novel method known as human emotion recognition based on block patterns of image and wavelet transform (HER-BP-DWT) was introduced in the research detailed in paper [
18]. The paper presented a distinct approach that integrates block patterns and discrete wavelet transform for emotion recognition. The methodology involved splitting test images into horizontal and vertical block patterns, which were further segregated into sub-blocks. Each block underwent decomposition into different frequency sub-bands using discrete wavelet transform, allowing for the calculation of energy within these sub-bands. The core objective of this novel method was to accurately recognize emotional expressions using a simple parameter—the energy of sub-bands derived from discrete wavelet transform, thereby enhancing face image recognition accuracy. The proposed HER-BP-DWT method demonstrated effectiveness in identifying a range of emotions, including happiness, sadness and anger, by leveraging block patterns. The experimental analysis revealed good results for the HER-BP-DWT method, obtaining an accuracy rate of 99.55%, sensitivity of 85.93%, precision of 92.43% and specificity of 90.74%.
Previous works in the field of the AI (artificial intelligence) paradigm that deals with the process of recognizing and classification (advanced methods) of people and their associated emotional states from facial thermal images have explored a variety of algorithms and methods from machine learning, including deep learning domains. Research studies have investigated the application of support vector machines (SVM), random forests (RF), and k-nearest neighbors (KNN) for emotion recognition based on thermal facial data, highlighting the importance of feature extraction and selection in improving classification accuracy. Deep learning approaches, particularly convolutional neural networks (CNNs) and recurrent neural networks (RNNs), have been employed to automatically learn complex spatial and temporal patterns in facial thermal images for emotion recognition tasks. Transfer learning techniques have also been leveraged to enhance model generalization and performance on smaller datasets. Additionally, recent advancements in graph neural networks and attention mechanisms (graph attention networks—GATs) have shown promising results in capturing fine emotional cues from thermal images. While these studies have demonstrated significant progress in accurately identifying emotions from facial thermal data, challenges remain in addressing data shortage, model interpretability and cross-cultural emotion recognition discrepancies, pointing towards the need for further research and innovation in this field [
19]. A series of papers that address these methods and algorithms are presented below.
Important features identified through random forest (RF) and different architectures of Feedforward Backpropagation Neural Network (FFBPN) were evaluated in paper [
20]. The study involved a dataset of 231 thermal facial images that were divided into training, validation and testing sets. Notably, the FFBPN tests with 400 neurons in the hidden layer showcased good results, demonstrating a classification accuracy of over 80% with a low MSE (mean squared error) of 0.052.
A method utilizing first-order features extracted from image histograms and the k-nearest neighbor algorithm (K-NN) for binary classification was introduced in paper [
21]. The approach evaluated various input datasets independently, initially achieving a high accuracy of approximately 93% by extracting features from unprocessed images with the help of the reliable K-NN algorithm. However, accuracy dropped to approximately 71% when features were extracted from noisy, corrupted images.
A convolutional neural network (CNN) architecture designed for recognizing thermal facial images was presented in paper [
22]. Comparative experiments against traditional methods like LBP (local binary patterns), HOG (histogram of oriented gradients) and MI (moment invariant) were conducted on the RGB-D-T database. Notably, the proposed CNN architecture achieved a superior recognition rate compared to conventional methods (LBP, HOG and MI), excelling in scenarios involving head rotation, expression and illumination conditions/factors. The worst result was obtained for the method involving moment invariant and the factor for head rotation, that is, approximately 59%. The best result was obtained for the proposed CNN method and the factors for expression/illumination, i.e., approximately 99–100%.
A deep neural network (CNN) algorithm introduced with a focus on object localization by preserving spatial feature distribution in the classification network was approached in paper [
23]. While the architectural changes were confined to the inference phase, the approach effectively balances simplicity and efficiency in dataset preparation while yielding results comparable to traditional detection models. The study also demonstrates the adaptability of pre-trained RGB networks for facial feature detection in low-resolution thermal images, maintaining precision levels above 99% accuracy. The proposed system, suitable for integration with wearable technology, can transmit data for in-depth analysis like respiratory rate calculation, showcasing real-time performance and minimal resource consumption ideal for multi-patient monitoring without latency issues, such as centralized home healthcare monitoring. This fusion of wearables with advanced machine learning on robust platforms possibly has the potential to transform healthcare globally.
Performing facial recognition using infrared (IR) images, efficiently with convolutional neural networks (CNNs), was the objective of the research paper [
24]. The proposed model is supposed to have several advantages such as the automatic feature extraction using convolutional and pooling layers and the ability to distinguish between faces without visual details. The model, comprised five convolutional layers in addition to five max-pooling layers, is introduced for the process of recognition (IR faces). Both the feature extraction and classification tasks are incorporated into this model. The problems of low contrast and absence of details in IR images is supposed to be overcome with this proposed model. The recognition rate reaches approximately 100% accuracy, in experiments on the Terravic Facial IR Database (TFIRDB).
A novel non-invasive technique to classify human emotion through facial thermal images was presented in paper [
25]. Hu’s moment invariants of different patches have been fused with histogram statistical features and used as robust features in multiclass support vector machine (SVM)-based classification. It was found that emotions from thermal image can be classified by the proposed method with a satisfactory performance. The percentage of accuracy in the case of all emotional states addressed (anger, fear, happy, sad and normal) was between approximately 86–88%.
A method for diagnosing breast cancer based on thermal image processing was proposed in research paper [
26]. The study utilized three different image analysis techniques including convolutional neural networks (CNNs), extreme learning machines (ELMs) and support vector machines (SVMs). The accuracy achieved for all features was approximately 80%.
Finally, in paper [
1], a robust emotion recognition system named TERNet that utilizes thermal images was introduced. This system uses customized convolutional neural networks (CNNs) with strong generalization abilities. The architecture incorporates features obtained through transfer learning from the VGG face CNN model and is further refined using thermal expression face data from the TUFTS face database [
27,
28]. Computer simulations showed that this approach achieved an accuracy of 96.2%, outperforming state-of-the-art models.
1.4.2. Historical Development of Thermal Emotion Recognition
The development of thermal image-based emotion recognition has been driven by advancements in biomedical engineering, affective computing and AI, particularly in machine learning (ML) and deep learning (DL). While early studies relied on manual feature extraction and statistical models, modern approaches leverage artificial intelligence to automate feature learning and improve classification accuracy. This subsection and those that follow provide a comprehensive overview of the evolution of thermal image-based emotion recognition, highlighting key technological advancements, methodological shifts and real-world applications that have shaped the field.
Thermal imaging has been studied in biomedical and affective computing research since the early 1990s, when researchers first explored the relationship between thermal facial signatures and emotional states. One of the pioneering studies by [
29] demonstrated that thermal cameras could detect stress-induced changes in forehead temperature, laying the foundation for emotion recognition using infrared thermography. Early experiments primarily focused on stress and deception detection, as periorbital (eye region) thermal variations were found to correlate with autonomic nervous system responses to emotional stimuli.
During the 2000s, the use of thermal imaging expanded into security, forensic investigations and human behavior analysis. Studies by [
30,
31] investigated how thermal cameras could distinguish between neutral, stressed and deceptive states, paving the way for law enforcement applications. Meanwhile, researchers in medical imaging explored the use of thermal imaging for diagnosing stress-related conditions and monitoring anxiety in patients. These early works were instrumental in validating the physiological basis of thermal image-based emotion recognition, proving that heat distribution changes on the face provide meaningful insights into human affective states.
The integration of artificial intelligence (AI) techniques around 2010 significantly enhanced the accuracy and efficiency of thermal emotion classification. For example, paper [
32] explored the integration of artificial intelligence techniques for feature extraction and classification of facial thermal images. The researchers proposed a method that fused visual and thermal face images to enhance the performance of face recognition systems, particularly under varying illumination conditions. By projecting these fused images into an Eigenspace, they extracted salient features and subsequently classified them using a multilayer perceptron (MLP) neural network. Their experiments, conducted on the OTCBVS database, demonstrated a recognition success rate of 95.07%, highlighting the efficacy of combining thermal imaging with AI-driven feature extraction and classification techniques.
Before the emergence of deep learning, researchers primarily relied on machine learning models such as support vector machines (SVM) and random forest (RF) for classification. However, with the advancement of convolutional neural networks (CNNs), AI-driven methods became dominant, enabling automatic feature extraction and eliminating the need for manual preprocessing. This shift marked the beginning of modern affective computing, where thermal-based AI systems are now used in medical diagnostics, security and adaptive human–computer interactions.
1.4.3. Machine Learning and Deep Learning Approaches in Thermal-Based Emotion Recognition
Before the widespread adoption of deep learning, researchers used traditional machine learning techniques to classify emotions based on thermal features extracted from facial regions. These methods relied on feature engineering, where relevant attributes such as forehead temperature, periorbital heat distribution and nose temperature fluctuations were manually selected to distinguish between different emotional states.
One of the earliest studies in this domain by [
33] employed support vector machines (SVM) to classify emotions based on forehead thermal variations, achieving promising accuracy.
The study [
34] proposes a thermal face recognition system that enhances biometric authentication using advanced feature extraction and selection techniques. The approach involves segmenting facial regions, extracting features using curvelet and wavelet transforms and optimizing feature selection using bio-inspired algorithms like Grey Wolf Optimizer (GWO), Particle Swarm Optimization (PSO) and Genetic Algorithm (GA). The random forest (RF) classifier achieved the highest accuracy (99.5%) when using curvelet-based features. The study demonstrates that thermal face recognition can be both highly accurate and computationally efficient, making it suitable for IoT-based security applications.
The research [
35] focuses on thermal facial recognition in scenarios where individuals may be disguised, a challenge for visible-light facial recognition systems. The authors propose a fusion-based classification model, integrating linear SVM, kernel SVM and sparse representation classifier (SRC) to improve recognition accuracy. By leveraging thermal imaging, the system effectively detects facial heat patterns, even when traditional features are obstructed. The results indicate that model fusion enhances recognition performance, proving its effectiveness for security and surveillance applications in challenging conditions.
The introduction of deep learning (DL) revolutionized thermal image-based emotion recognition by automating feature extraction and learning complex spatial patterns. Convolutional neural networks (CNNs) became the preferred approach, as they could identify temperature-based features without the need for manual preprocessing. One of the first studies to apply CNNs to thermal emotion recognition demonstrated that CNN-based models outperformed traditional ML methods by 10–30% in classification accuracy. Since then, researchers have explored various CNN architectures, including ResNet, EfficientNet and Inception, to improve thermal image processing capabilities.
More recently, Vision Transformers (ViTs) and attention mechanisms have been applied to thermal imaging. In study [
36], the authors propose a novel architecture that combines Generative Adversarial Networks (GANs) with Vision Transformers to enhance the quality of thermal images. The approach leverages the strengths of GANs in generating high-fidelity images and the capability of Vision Transformers to capture global contextual information through self-attention mechanisms. By introducing a specific thermal loss feature and fine-tuning based on visible images, the model effectively improves the visual quality of thermal images, which is crucial for accurate facial recognition. The enhanced thermal images exhibit improved clarity and detail, facilitating more reliable identification in security and surveillance applications.
In study [
37], the authors developed a real-time emotion detection system leveraging a convolutional neural network (CNN) architecture. The proposed model is designed to predict human emotions from images efficiently, making it suitable for real-time applications. The CNN architecture utilized in this research significantly reduces the number of parameters, enhancing computational efficiency without compromising accuracy. The system was evaluated on standard emotion recognition datasets, demonstrating its effectiveness in accurately classifying various emotional states.
The research [
38] presents a hybrid approach combining convolutional neural networks (CNNs) and support vector machines (SVMs) for human emotion recognition. The methodology involves extracting regions of interest (ROI) from facial images, followed by feature extraction using techniques like local binary patterns (LBP) and Gabor filters. These features are then fused and fed into the hybrid CNN-SVM classifier. The integration of CNNs for feature extraction and SVMs for classification aims to enhance the accuracy of emotion recognition systems. The proposed approach was tested on publicly available datasets, showing improved performance compared to traditional methods.
Study [
39] address privacy concerns in emotion recognition systems that utilize multimodal data, such as text and audio. They demonstrate that neural representations trained for emotion recognition can inadvertently leak demographic information, potentially compromising user privacy. To mitigate this, the authors employ an adversarial learning framework to “unlearn” demographic attributes from the representations, thereby enhancing privacy without significantly affecting emotion recognition performance. Their approach is evaluated across multiple datasets, highlighting its effectiveness in balancing privacy preservation with task accuracy.
1.4.4. Real-World Applications of Thermal Image-Based Emotion Recognition
Study [
40] explores the use of thermal infrared imaging to assess the emotional competencies of nursing students. By monitoring facial temperature changes in response to various emotional stimuli, the researchers aimed to provide a non-invasive method for evaluating and enhancing emotional skills crucial for patient care. The findings suggest that thermography can serve as an effective tool in nursing education to monitor and improve emotional competencies.
In research [
41], the authors integrated remote photoplethysmography (r-PPG) with thermal imaging to detect subtle emotional changes. By analyzing cardiovascular data and facial temperature variations, they developed a method to uncover concealed emotions, which is vital for psychological assessments and various healthcare applications. The study demonstrates the potential of combining r-PPG and thermal imaging to enhance the prediction of mental states.
Paper [
42] presents DeepBreath, a deep learning model designed to recognize psychological stress levels by analyzing breathing patterns captured through low-cost thermal cameras. The approach transforms breathing signals into respiration variability spectrograms, which are then analyzed using a convolutional neural network (CNN). The study highlights the feasibility of using thermal imaging for stress recognition in real-world healthcare settings.
Study [
43] addresses the challenges of facial recognition in low-light conditions, where traditional visible-light imaging systems often falter. The authors propose a method that leverages deep autoencoders to bridge the gap between thermal and visible facial images. By learning a mapping technique from thermal imagery to the visible spectrum, their approach enhances the performance of facial recognition systems in nighttime surveillance scenarios. The methodology was extensively tested on publicly available datasets, demonstrating significant improvements over existing techniques.
In research paper [
44], the authors tackle the issue of illumination variability affecting facial recognition accuracy. They introduce a novel algorithm that fuses thermal and visual images using a gradient transfer technique to achieve illumination-invariant face recognition. By combining information from both modalities, the proposed method enhances recognition performance under challenging lighting conditions. The study also presents a new dataset comprising aligned thermal and visual facial images, which was utilized to validate the effectiveness of their approach.
Paper [
45] presents a comprehensive analysis of various electroencephalography (EEG) feature extraction methods for emotion recognition, categorized into four key perspectives: time-domain, frequency-domain, time-frequency and nonlinear features. It also provides an overview of the commonly used pattern recognition techniques in related studies. Given the growing interest in deep learning (DL) within this field, special emphasis is placed on DL-based approaches, including their characteristics, strengths, limitations and suitable applications. Lastly, the paper highlights existing challenges and explores potential future research directions. This study serves as a valuable resource for new researchers, offering a structured understanding of the current landscape of EEG-based emotion recognition and inspiring further advancements in this area.
The experimental findings across various studies, utilizing conventional classification methods, such as wavelet transform, entropy and Renyi divergence and advanced classification methods (AI domain), such as CNN, KNN and SVM, reveal promising outcomes in processing facial thermal images for detecting and classifying people and their associated emotional states.
2. Materials and Methods
2.1. Thermal Image Databases
At the moment there is a small number of databases with facial thermal images, divided into different categories corresponding to predefined emotional states (for example neutral, happy and sad), which meet the requirements necessary to carry out research studies regarding the recognition and classification of people and associated emotional states. An example of a freely available thermal image database is the Tufts database [
27] (Tufts University); this contains a very extensive dataset with over ten thousand images from about 15 countries, with an age range for subjects between 4 and 70 years. An example with images from this database is presented in
Figure 1.
In the process of creating this database, as well as the databases used in this work, each participant was positioned in front of a certain type of background that does not create disturbances, and is also in close proximity to the thermal camera. The cameras were mounted on tripods and the height of each camera was adjusted manually for a proper central framing of the images. For a good standardization/uniformity of the results, the distance to the participant was strictly controlled during the acquisition process. The lighting condition was maintained using constant diffused lights. The images were captured using an FLIR Vue Pro [
46] thermal camera for the Tufts database and Chauvin Arnoux CA 1950 [
47] for the databases used in this paper.
Figure 1 shows a series of acronyms for each highlighted facial image, the first acronyms TD_IR refer to the fact that we work with thermal images/infrared images, i.e., thermal data; the acronyms E_N_1…15 highlight that we have images with emotional states/expressions (E), more precisely neutral emotional state (N); other examples of expressions from the database are smile, sleepy and shock, the last information is given by the number corresponding to each image presented in the database (1…15).
For the experiments addressed in this work, two augmented databases (databases with added noise) were created and used, which belong to the CCETIC [
12] research center (only 50% of the total thermal images were used from both databases). For the development of the two augmented databases, an initial/original dataset which consists of cropped RGB thermal facial images (preprocessed images), belonging to the CCETIC research center was used, which captures three emotional states (i.e., neutral, happy and sad). This dataset contains approximately 480 thermal images (161 × 3 = 483 thermal facial images). A series of images from this dataset are presented in
Figure 2.
In
Figure 2,
Figure 3 and
Figure 4, a series of acronyms are highlighted for each image, as follows: S1…S161 represents the number assigned to the person/subject from the database, N—represents neutral state, V—represents happy state, T—represents sad state, xxxxxx_IR—indicates the code and the image type (thermal image), related to each image in the databases, haar1…100—indicates the noise level for each image and haar—indicates cropped images.
The first augmented database [
12] used in this paper contains sample images from the initial dataset with cropped images, in gray tones and with different levels of added noise, i.e., Gaussian noise (with PSNR (Peak Signal-to-Noise Ratio) from inf (infinite) to 19 dB). This database includes approximately forty-eight thousand facial thermal images. Certain images from the database are presented in
Figure 3.
The second augmented database [
12] used in this paper also contains sample images from the dataset with cropped images, in gray tones and with different levels of added noise, i.e., this time with “salt and pepper” type noise. Just like the previous one, this database also includes approximately forty-eight thousand facial thermal images. A series of images from the database are presented in
Figure 4.
The databases from the research center of CCETIC [
12] highlighted in this work have some minor imperfections in terms of execution and design. These imperfections refer to the equalization of the size and the orientation of the face in the case of some thermal images from the databases, problems that can be corrected or solved by applying specific methods and techniques. These imperfections can negatively affect the process of extracting features and also the selection of the ROIs (regions of interest) from target images and can also affect the classification accuracy.
2.2. Database Expansion
Due to the fact that the initial datasets from the CCETIC research center have a relatively small to average size, and in line with the requirement of the deep learning general approach, it was considered necessary to increase the number of images in the datasets. This was achieved by proposing a database expansion technique, i.e., implementing an image augmentation process by applying different types and levels (one hundred levels) of noise to each thermal image; the types of noise implemented were gaussian and “salt and pepper”. The two types of noise were chosen because they are easy to implement and are frequently encountered in image processing. The maximum number of resulting images was determined based on a qualitative assessment, i.e., if the resulting images became blurry, the process was stopped.
The image processing algorithm starts with reading three datasets Ah (happy images), As (sad images) and An (neutral images). Initially, the images were converted into gray scale, and then, all images dataset were affected by Gaussian noise and “salt and pepper” type noise, thus two new datasets were created. For each dataset, four procedures were used:
procedure_gray(I) convert color image into grayscale image.
procedure_noise1(x, y, z) returns a matrix containing pseudorandom integer values drawn from (x, y, z) and converts the elements of the array into unsigned 8-bit integers.
procedure_mean(noise) returns the mean values of the files/elements in “noise” and converts the elements of the array into unsigned 8-bit integers.
procedure_noise2 (Igray, ‘salt & pepper’, i/10,000) adding a certain type of noise (“salt and pepper”) on images in Igray, the noise level is given by i/10,000.
The procedures procedure_noise1(x, y, z) and procedure_noise2(gray, ‘salt and pepper’, i/10,000) run separately because two types of images with noise were obtained: Gaussian and “salt and pepper”.
2.3. The Preprocessing Chain
The main preprocessing blocks and their links, involved in thermal image processing, from acquisition to database generation, are shown in
Figure 5. The first block performs a conversion from RGB format to gray levels. The second processing block adapts/adjusts the images by temperature scaling (e.g., in the dynamic range between 20 and 35 °C). The third block performs the image registration operation. The fourth block performs the operation of scaling the size and cropping the images (useful for the automatic selection of interest/important areas). The last processing block performs the operation of adding different types and levels of noise (for example Gaussian and “salt and pepper” noise). This general preprocessing structure was used to develop the two databases with added noise, approached in this paper. A thermal image processing software toolbox could contribute to all these steps, as described in [
13].
For technical reasons, only 50% of the two augmented databases with added noise (approximately 8000 × 3 = 24,000 thermal images from each database) were used in this paper. In both cases, that is, for both databases, the second upper half of the database was selected and used, i.e., with a noise level between 50% and 100%. The motivation for using the second half of the database is due to the fact that the images contain a higher level of noise, compared to the first half of the database. The higher the noise level, the more the quality of the images decreases, that is, the level of detail is considerably reduced and this can contribute negatively to the process of classifying the emotional states associated with different people. In the present case, the most unfavorable half was selected, if positive results are obtained with this portion of the database, then positive results will certainly be obtained with the first half of the database, as it contains a lower noise level and the images are basically the same, only the noise level differs. The first half of the database was also partially tested (noise level between 1% and 50%) and comparable results were obtained.
2.4. Artificial Intelligence Based Methods
In this work, two subsets of methods belonging to the field of artificial intelligence (AI) were addressed, i.e., machine learning with random forest (RF), K-nearest neighbors (KNN) and support vector machine (SVM) algorithms, represent the first category, and deep learning with the convolutional neural network (CNN) algorithm, represents the second category.
The random forest (RF) algorithm is used for classification, regression and other tasks. The essence of this algorithm is to use a large number of decision trees to build a robust and accurate model. This ensemble of trees, called a “forest”, works on the principle that lots of simple models combined together can provide better performance than a single complex model. In practice, it works by constructing multiple decision trees during training and outputting the mode of the classes (classification) or average prediction (regression) of individual trees [
48]. Random forest is known for its ability to handle large datasets with high dimensionality and to mitigate overfitting [
49,
50].
The K-nearest neighbors (KNN) algorithm is used in both classification and regression tasks. It classifies objects based on the majority vote of their k-nearest neighbors in feature space. It does not involve explicit model training, instead it memorizes the entire training dataset and makes predictions based on the similarity of new instances to the existing data points. The essence of this algorithm is based on the idea that similar instances tend to belong to the same class or have similar values. More precisely, k-NN makes predictions for new data by identifying the nearest “neighbors” in a multidimensional space and analyzing their characteristics [
49,
51].
The support vector machine (SVM) algorithm works by finding the hyperplane that best separates data points into different classes, with the largest margin between classes. More precisely, SVM has the ability to create classification models that maximize the separation between different classes by identifying an optimal boundary in the feature space [
52]. It is effective in high-dimensional spaces, allowing for complex decision boundaries and handling nonlinear data through kernel functions [
5,
49].
Deep learning utilizes artificial neural networks with multiple layers to model and extract high-level features from complex data. These deep neural networks can learn representations of data through a hierarchical structure of interconnected nodes. Deep learning algorithms are capable of automatically learning intricate patterns from large amounts of data, making them highly effective for tasks such as image and speech recognition, natural language processing and facial and emotional recognition/classification [
53,
54]. The deep learning model consists of multiple layers, including convolutional layers, pooling layers and dense layers which automatically learn features from the input images. These features are high-order features (deep features) typically associated with complex patterns found in images, such as edges, textures and shapes. For instance, the Conv2D layers will typically learn to recognize edges and textures, while subsequent layers capture more intricate patterns, including combinations of edges that form shapes. After passing through the convolutional layers and pooling layers, the output is flattened in the model. This means that the hierarchical feature representations learned by the convolutional network are converted into a one-dimensional array for the subsequent dense layer.
The convolutional neural network (CNN) is a deep learning model specifically designed for processing structured grid-like data, such as images. More precisely, CNN is a specialized type of artificial neural network designed to process and analyze structured data in the form of images or sequences, but it can also be applied to other types of data that have a similar structure. CNNs are extremely effective at recognizing patterns and identifying important and essential features in images, making them fundamental to tasks such as image classification, object detection, facial recognition/classification and emotional recognition/classification. CNNs consist of multiple layers, including convolutional layers, pooling layers and fully connected layers. The convolutional layers use filters to convolve across the input image, capturing spatial hierarchies of features [
55]. Pooling layers downsample the feature maps to reduce computational complexity. Fully connected layers integrate the extracted features for classification [
53,
56].
In the context of classifying emotional states associated with people from facial thermal images, CNNs play a crucial role due to their ability to automatically learn spatial hierarchies of features from images. CNNs excel at capturing intricate patterns in visual data, making them well suited for tasks that involve extracting emotional cues from facial expressions. By training a CNN on a dataset of facial thermal images labeled with corresponding emotional states, the model can learn to classify new images based on the extracted features. When applied to emotional state classification in thermal images, CNNs can effectively analyze facial features that may not be apparent to the human eye but are crucial for identifying different emotional states. Through training and fine-tuning the CNN architecture with thermal image data, the model can learn to distinguish subtle variations in facial temperature and patterns associated with various emotions, providing a powerful tool for automated emotional state analysis based on thermal imagery [
53,
57].
These four algorithms, random forest, K-nearest neighbors, support vector machine and convolutional neural network, can be utilized in the classification process of emotional states from facial thermal images, associated with individuals. Each algorithm offers unique advantages and may perform differently based on the characteristics of the data and the specific requirements of the classification task.
Table 1 shows all the convolutional layers involved in the convolutional neural network (CNN), developed and tested in this paper. At the bottom of the figure are presented the total number of parameters, trainable parameters and non-trainable parameters which are 0; this indicates that all involved parameters have been trained [
58]. Another example of setting up and adjusting a CNN network is presented in paper [
59], in which the ReLu (rectified linear unit) activation function was used on all the layers except the last one, which has a sigmoid function instead. Stochastic gradient descents with a learning rate of 0.001 as an optimizer and a validation set containing 30% of the training data were also used.
Rescaling Layer (rescaling_5) rescales the input data before passing it to the Conv2D layer. It normalizes the input values to a specific range, often between 0 and 1 or −1 and 1. This helps in stabilizing and improving the training process of the CNN.
Conv2D Layer (conv2d_15) applies a set of filters to the input data to detect features such as edges, shapes and patterns. Each filter slides over the input data, performing convolution operations to create feature maps. The number of filters in this layer determines the depth of the output feature maps.
MaxPooling2D Layer (max_pooling2d_15) reduces the spatial dimensions of the feature maps obtained from the Conv2D layer. It retains the most significant information from each region by selecting the maximum value within a pooling window. This helps in reducing computational complexity and overfitting.
Dropout Layer (dropout_15) consists of a regularization technique that randomly sets a fraction of input units to zero during training. This helps in preventing overfitting by encouraging the network to learn more robust features and reduces interdependency among neurons.
For additional Conv2D, MaxPooling2D and Dropout Layers (conv2d_16, max_pooling2d_16, dropout_16; conv2d_17, max_pooling2d_17, dropout_17), these sets of layers follow a similar pattern as described above, extracting more complex features from the input data, reducing spatial dimensions, and introducing regularization via dropout.
Flatten Layer (flatten_5) reshapes the multidimensional output from the previous layers into a one-dimensional array. This prepares the extracted features to be fed into the following Dense layers.
Dense Layers (dense_10, dense_11) are fully connected layers where each neuron is connected to every neuron in the previous layer. These layers perform the final classification or regression tasks based on the features extracted by the preceding convolutional and pooling layers. The output layer (dense_11) typically uses a SoftMax activation function for classification tasks to output class probabilities.
In order to obtain better and more accurate results, a series of supplementary augmentation methods were applied to the processed images from the two already augmented databases used in the paper, i.e., rotation, reflection, translation and scaling. This process was included in the application corresponding to the implementation stage of the classification methods/algorithms (SVM, RF and KNN) and the developed neural network (CNN), for this paper. An example of augmented images used in the process of classifying emotional states (for example, neutral, happy and sad), through the CNN algorithm, is presented in
Figure 6.
Figure 7 shows the general processing blocks addressed in this paper, highlighting all the stages, techniques and methods used.
The block on the left “Image Acquisition” approaches the image acquisition process (the images stored in the databases of CCETIC), highlighting the three emotional states addressed, i.e., neutral, happy and sad.
The top block “Image Preprocessing” addresses the image augmentation process, using the two types of noise presented, i.e., Gaussian and “salt and pepper”.
The block in the center “Artificial Intelligent Tools” tackles the two subsets/categories of general artificial intelligence methods, i.e., deep learning with the convolutional neural network (CNN) algorithm, representing the first subset, and machine learning with random forest (RF), K-nearest neighbors (KNN) and support vector machine (SVM) algorithms, represent the second subset.
The block on the right “Performance Metrics” approaches the performance metrics highlighted in this work, namely Accuracy (ACC), Macro_F1_score, Macro_Specificity, F1_Score, Specificity and Area Under the Curve.
2.5. Classification Metrics
In the case of machine learning, i.e., random forest (RF), K-nearest neighbors (KNN) and support vector machine (SVM) algorithms, in order to assess the performance of a classification model, it is essential to analyze key metrics such as accuracy (ACC), precision, recall, F1_Score, specificity, Macro_Specificity and Macro_F1_Score which can be derived from the confusion matrix, as detailed in Equations (1)–(17). The confusion matrix provides a tabular representation of the performance of a classification model by displaying the counts of True Positives (TP), True Negatives (TN), False Positives (FP) and False Negatives (FN). These metrics play a crucial role in assessing the model’s performance. ACC measures the overall accuracy of the predictions made by the model. It is calculated as the ratio of correctly predicted instances to the total number of instances. Precision indicates the proportion of correctly identified positive samples from all samples that were predicted as positive. It assesses the quality of positive predictions. Recall, also known as sensitivity, measures the ability of the model to correctly identify positive samples. It quantifies the correct predictions of positive classes. F1_Score combines precision and recall, providing a balance between the two metrics. It gives a comprehensive assessment of the model’s performance. Macro_F1_Score calculates the average F1_score across all classes, providing a global assessment of the model’s performance across different classes [
20].
In the classification of emotional states, specificity measures the model’s effectiveness in correctly identifying samples that do not belong to a particular category/class. Specificity measures the proportion of true negative results that are correctly identified in a binary classification task. A higher specificity implies that the model excels at reducing false positives, thereby improving its ability to differentiate between various emotional expressions and enhancing the accuracy of emotional state classification [
60]. Macro_Specificity calculates the average specificity across all classes, providing a global assessment of the model’s performance.
where
n represents the associated class number. We can also use the metrics called specificity and
Macro_Specificity to highlight the effects of the negative cases [
61]. These are defined as
Considering the fact that in this paper a multiclass classification task is approached and the developed application provides 3 × 3 confusion matrices, i.e., a matrix that includes the results of all the three classes involved, corresponding to the three emotional states addressed, it is necessary to break them down into individual classes/matrix, i.e., matrices of type C
1 vs. C
2 and C
3, C
2 vs. C
1 and C
3, and C
3 vs. C
1 and C
2. Practically, from each 3 × 3 matrix, three 2 × 2 matrices results (one for each emotional state/class). To determine
Macro_F1_Score, the
precision,
recall and
F1_Score are calculated individually for each class, i.e., a 2 × 2 matrix. At the end, the
Macro_F1_Score is calculated for each 3 × 3 matrix, that is, three 2 × 2 matrices corresponding to the selected 3 × 3 matrix. To determine
Macro_Specificity the
specificity is also calculated individually for each class, and the final calculation process (averaging) is similar to that of
Macro_F1_Score. An example of a three-class confusion matrix is presented in Equation (8).
In Equations (9)–(11), a series of calculation formulas are presented that can be used to determine the precision metric of the three classes involved (C
1, C
2 and C
3), starting from the initial 3 × 3 confusion matrix.
In Equations (12)–(14), the calculation formulas for determining the recall metric of the three classes involved, starting from the same initial 3 × 3 confusion matrix, are presented.
In Equations (15)–(17), the calculation formulas for determining the specificity metric of the three classes involved are presented (same initial 3 × 3 confusion matrix).
In the case of deep learning, i.e., convolutional neural network (CNN) algorithm in addition to the accuracy measure (ACC), in order to evaluate the classification process, only the graphs which determine the accuracy and loss of the training and validation process were included, and presented in the experimental results section.
2.6. Classification and Feature Extraction Method
2.6.1. Preprocessing and Feature Extraction
The preprocessing and model training pipeline in this study involves structured steps for preparing thermal facial images, feature extraction and classification using deep learning and machine learning techniques.
The dataset is first preprocessed by resizing images to 80 × 80 pixels and normalizing pixel values to improve model stability. Data augmentation techniques, such as rotation, reflection, translation and scaling, are applied to enhance variability and improve generalization. The features are extracted using a convolutional neural network (CNN), specifically a sequential model with three convolutional layers using ReLU activation, max-pooling layers and dropout layers (20%) to prevent overfitting. The extracted deep features from the CNN model are then flattened and used for classification.
2.6.2. Model Training and Parameters
The study trains multiple models, including CNN, support vector machine (SVM), random forest (RF) and k-nearest neighbors (KNN). The CNN model is trained with a maximum of 20 epochs, using the Adam optimizer and Sparse Categorical Crossentropy loss function, with accuracy as the main evaluation metric. To improve computational efficiency, AUTOTUNE caching and prefetching are applied to accelerate data loading. After training the CNN, deep features are extracted and used to train conventional ML classifiers:
SVM is trained with a linear kernel.
Random forest uses 100 estimators.
KNN is configured with 5 neighbors.
2.6.3. Evaluation
The models are tested on a separate dataset with accuracy, confusion matrices and loss curves as performance indicators. The CNN alone achieves high validation accuracy, and ML classifiers trained on CNN-extracted features further refine classification performance. This hybrid approach leverages deep learning for feature extraction while using ML classifiers for efficient classification, demonstrating strong performance in recognizing emotional states in thermal facial images.
2.6.4. Deep Features (High-Order Features)
Deep features, also known as high-order features, are the complex representations extracted from raw sensor data (facial thermal images in the case of this work) by deep networks, for example, by means of convolutional neural networks (CNNs) through multiple layers of processing, where each layer captures increasingly abstract patterns and structures [
62]. In this method, the CNN learns to automatically identify relevant features from raw input, such as images, by applying convolutional operations followed by nonlinear activation functions and pooling layers. As the data progress through the network, the early layers might focus on low-level details like edges and textures, while deeper layers combine these features to recognize higher-level concepts such as objects, patterns or scene characteristics. This hierarchical feature extraction enables deep learning models to generalize effectively across various tasks, enhancing their performance in applications like image classification and object detection [
63]. Other examples of deep learning algorithms are Recurrent Neural Networks (RNNs); Long Short-Term Memory Networks (LSTMs); Generative Adversarial Networks (GANs); Transformer Networks; Deep Belief Networks (DBNs) and Deep Q-Networks (DQNs).
Deep features, first-order features and second-order features represent different levels of abstraction in data representation, particularly in the context of machine learning and computer vision. First-order features typically involve basic attributes directly extracted from the input data, such as pixel intensity values in images or individual measurements in a dataset, providing a foundational view of the data without any relationships among them [
64]. Second-order features build upon first-order features by capturing interactions or relationships between multiple first-order attributes, such as textures formed by combinations of pixel values or co-occurrence matrices that describe how often pairs of pixel values appear together. In contrast, deep features, or high-order features, emerge from multiple layers of transformation in deep learning models like CNNs, where the network learns to identify intricate patterns and hierarchical structures that can model complex relationships among high-dimensional data [
62]. These deep features encapsulate richer representations, allowing models to generalize better and recognize higher-level concepts, making them particularly powerful for tasks like image classification, where nuanced variations matter significantly [
63]. Thus, while first-order and second-order features lay the groundwork, deep features unlock advanced capabilities through their ability to encapsulate abstraction and detail in one cohesive representation [
65].
3. Results
This section presents the experimental results, empirical findings and observation obtained with the help of the previously presented categories of artificial intelligence methods and algorithms for the classification of emotional states from thermal facial images, i.e., neutral, happy and sad states. These images come from the two databases presented above and correspond to certain categories of images, i.e., images with Gaussian noise and images with “salt and pepper” type noise.
Both with the first subset of artificial intelligence methods, i.e., random forest (RF), K-nearest neighbors (KNN) and support vector machine (SVM) algorithms, as well as with the second subset of methods, i.e., deep learning with the convolutional neural network (CNN), superior classification accuracy (ACC) results were obtained with the two categories of images, i.e., images with Gaussian noise and images with “salt and pepper” type noise (the two augmented databases). The results regarding the classification accuracy (ACC) of the two categories of images were very good, ranging between approximately 99% and 100%.
Although the images from the two databases contain two types and different levels of added noise (images with Gaussian and “salt and pepper” with 50 levels of added noise), but a much larger number of images compared to those from the standard/original dataset (cropped RGB thermal facial images) that was used to develop the two databases with added noise, very good results were obtained with both (DB). Practically, considering the obtained results, the use of a larger number of images, even if they contain different types and levels of added noise, apparently will directly improve the accuracy (ACC), regarding the process of classifying the images into the three categories corresponding to the emotional states addressed in the paper, i.e., neutral, happy and sad. Using a large number of images provides sufficient variability and generality, which is seen in the classification accuracy results.
Table 2 and
Table 3 show the
accuracy,
Macro_F1_Score and
Macro_Specificity results obtained with the two thermal image categories, i.e., 50% of the total thermal images from the two augmented databases used in this paper. For technical and application design reasons, when implementing the CNN algorithm in the application, the processing and display of the confusion matrix (CM),
Macro_F1_Score and
Macro_Specificity were not included, but we have included the graphs which determines the accuracy and loss of the training and validation process.
The best results obtained with the first category of images, i.e., the first augmented database (
Table 2—images with Gaussian noise), with an accuracy (ACC) of 100%, were obtained through the CNN and RF algorithms. The software application was configured with 15–20 epochs and a batch size of 15. In the case of the RF algorithm, it seems to be sufficient to configure the application with 15 epochs and a batch size of 15, to obtain an accuracy percentage (ACC) of 100%.
The best results obtained with the second category of images, i.e., the second augmented database (
Table 3—images with “salt and pepper” type noise), with an accuracy (ACC) of 100%, were obtained through the CNN, SVM and RF algorithms. The software application was configured with 20 epochs and a batch size of 20. In the present case, it was strictly necessary to configure the application with the maximum number of epochs and batch size, implemented and tested in the paper, to obtain an accuracy (ACC) of 100%.
Figure 8 and
Figure 9 show two graphs which determines the accuracy and loss of the training and validation process, with the CNN (convolutional neural network), for the two categories of augmented thermal images used in the paper, and mentioned above.
Figure 8 shows the best results for the first category of thermal images (augmented images with Gaussian noise), i.e., 100% and
Figure 9 shows the best results for the second category of thermal images (augmented images with “salt and pepper” type noise), i.e., also 100%. In
Figure 8 and
Figure 9, the phenomenon of overfitting of the two graphic representations does not appear, indicating that there are no problems in the training and validation process (no overfitting of the model), which is also reflected in the accuracy result (ACC).
For the configuration of the classifiers in the software application (CNN, SVM, RF and KNN), the databases used were divided into 70% images for training and 30% images for testing. The reason for splitting the dataset as presented above is based on the fact that we wanted to divide the database into approximately three parts, two parts for training and one part for testing. Another reason is due to the fact that other variants of its division were tested in the past, and the best results were obtained with the presented values from above.
In the training and testing/validation processes of the models corresponding to the four machine learning methods CNN, SVM, RF and KNN (for the two categories of images, i.e., the two augmented databases), the Google Colab software was used [
66]. Within this tool, some parameters were configured. The number of epochs was 10, 15 or 20, and the batch size was 15 or 20. Within the software application, a deep learning model based on a convolutional neural network (CNN) was implemented for feature extraction/analysis and image classification. The deep features (high-order features) extracted through the model are further used for training other classifiers, i.e., SVM, RF and KNN. These features are learned throughout the model training process and are then utilized by the classical machine learning algorithms (SVM, RF and KNN) after being standardized. This standardization normalizes the feature values, which can help improve the performance of traditional machine learning models like SVM, RF and KNN.
Users can leverage Colab’s integration with Google Drive to store and share notebooks, making collaboration seamless. The databases used in this paper were stored and accessed from Google Drive. The hardware used for this paper was a computer with the following specifications: Intel (R) Core (TM) i5-8250U CPU @ 3.40 GHz Max Turbo Frequency; Memory (RAM) 12 GB DDR4; Intel(R) UHD Graphics 620; SSD 256 GB.
The costs of the computational process, in terms of the required execution time, of the training and classification process are approximately 7200–9000 s (2–2.5 h) for the two categories of images with added noise, considering the hardware and the databases used in this work as input.
In the context of a convolutional neural network (CNN) and classification algorithms like random forest (RF), support vector machine (SVM) and K-nearest neighbors (KNN), the number of epochs and batch size play crucial roles in model training and performance evaluation. Increasing the number of epochs can potentially improve the model’s ability to learn complex patterns in the data. However, setting an excessively high number of epochs may lead to overfitting, where the model memorizes the training data but fails to generalize well on unseen data. Adjusting the batch size impacts the efficiency of model training. A smaller batch size allows for more frequent updates to the model weights but may result in slower convergence. On the other hand, a larger batch size speeds up training but can lead to less stable learning dynamics. Practically, a medium to high number, but not excessive, of epochs and a sufficient batch size will apparently improve the general accuracy of the process of classifying emotional states from thermal images. For the experiments in this paper, different values were selected for epochs, i.e., 10, 15 and 20 and for batch size, i.e., 15 and 20. The best results were obtained when we set 15 to 20 epochs, in the software application (Google Colab).
In the case of classifying emotional states from facial thermal images using the algorithms presented above, optimizing the number of epochs and batch size is crucial for achieving high classification accuracy. Experimenting with different combinations of epochs and batch sizes, along with fine-tuning other hyperparameters, can help improve the models’ performance in accurately identifying emotional states from the facial thermal images. By utilizing Google Colab’s cloud resources, researchers can efficiently experiment with various configurations of CNNs and classification algorithms, reducing computational costs and accelerating the development of accurate emotion recognition models based on facial thermal images.
To be able to understand the behavior of the classes (emotional states), i.e., neutral, happy and sad, used in the process of multiclass classification and binary classification (three 2 × 2 matrices from one 3 × 3 matrix resulting from the software application), with the first subset of artificial intelligence methods, i.e., machine learning with random forest (RF), K-nearest neighbors (KNN) and support vector machine (SVM) algorithms, we analyzed the confusion matrices (CM) and present them in Equations (18) and (19) for the best accuracy (ACC) results in the case of the first image category (50% of the images from the first augmented database with Gaussian noise) and the second image category (50% of the images from the second augmented database with “salt and pepper” type noise). Due to the fact that the percentage of accuracy (ACC) was 100% in both cases, corresponding to the two categories of images, from Equations (18) and (19), the structure and values of the confusion matrices are the same, both for the initial 3 × 3 matrix and for the three matrices resulting from the decomposition process of the initial 3 × 3 matrix.
In the case of the 3 × 3 confusion matrix from Equation (18), the values from top to bottom (true labels) and from left to right (predicted labels) are represented by the three emotional states addressed (happy, neutral and sad). In the case of the 2 × 2 confusion matrix from Equation (19), the values from top to bottom (true values) and from left to right (predicted values) are represented by the positive and negative indicators.
Equation (18) presents a 3 × 3 confusion matrix and Equation (19) presents a 2 × 2 confusion matrix resulting from the decomposition of the initial 3 × 3 matrix (all three 2 × 2 matrices have the same structure/values), corresponding to the three classes/emotional states addressed, for the best result with the first and second category of images (augmented images with Gaussian and “salt and pepper” noise, GAUS − RF − ACC = 100% and SP − SVM, RF − ACC = 100%).
By analyzing the matrices from Equations (18) and (19), i.e., CM0 and CM123, corresponding to the two categories of images with added noise from the augmented databases, i.e., images with Gaussian noise and “salt and pepper” type noise, we can conclude that they indicate a perfect classification of the three classes/emotional states (neutral, happy and sad) addressed in the paper and involved in process of multiclass classification.
The results obtained from the confusion matrices (CM) are very good for the two categories of images used (augmented images with added noise) in the paper. With the help of the values obtained from CM and Equations (1)–(17), we can compare and validate the experimental results from
Table 2 and
Table 3, for the cases of the three algorithms corresponding to the field of machine learning, i.e., SVM, RF and KNN.
Figure 10 and
Figure 11 show the two graphs with results, related to the two categories of images used in the paper. In these graphs, the number of epochs, the size of the batch and the classification accuracy of the two categories of thermal images are highlighted; see also
Table 2 and
Table 3.
Comparing the results obtained with the four classification algorithms used, i.e., KNN, RF, SVM and CNN, we can conclude that the results are comparable, outperforming in certain cases of state-of-the-art models. The results obtained in this paper were compared with other results, from different papers that utilized thermal images and artificial intelligence tools, i.e., certain algorithms belonging to the fields of machine learning.
Comparing the results obtained in this paper with those presented above, we can conclude that the accuracy of classification is superior to certain papers and comparable to others, indicating that superior results were obtained with the two categories of images from the augmented databases used in the paper.
4. Discussion
This paper tried to provide a documented and extensive presentation of the basic elements of research in the field of thermal image processing and machine learning (ML).
The objective of the work was to accomplish a comparative study on two subsets of methods belonging to the field of artificial intelligence (AI), i.e., certain algorithms belonging to machine learning and deep learning (KNN, SVM, RF and CNN), applied to the two categories of images presented above (augmented images with Gaussian and “salt and pepper” noise) in order to obtain favorable results regarding the multiclass classification process, in the three emotional states/classes presented above, i.e., neutral, happy and sad.
The reason for choosing the comparative analysis of the classification process regarding the two categories of images used in the paper is given by the fact that both corresponding databases are based on the same 161 thermal images found in the initial dataset (consists of cropped RGB thermal facial images without added noise). Thus, the aim was to highlight the importance of the augmentation process applied to the initial images, so that the extension of the database would provide sufficient variability and generality. This comparative analysis is relative, not absolute; the databases are not absolutely independent, they are more or less connected because their development is based on the same initial source (the same 161 facial thermal images).
Overall, when classifying emotional states from facial thermal images, both machine learning algorithms and deep learning approaches have their strengths, weakness and feasibility considerations. Machine learning algorithms like RF, KNN and SVM provide straightforward implementations and can be computationally efficient for smaller datasets. On the other hand, deep learning with CNNs excels in capturing complex patterns from images but may require more computational resources. The choice between these methods should consider factors such as dataset size, computational resources, interpretability needs and desired classification accuracy for efficient emotional state classification tasks.
The results obtained in this paper with the two subsets of methods belonging to the field of artificial intelligence (AI), i.e., machine learning with random forest (RF), K-nearest neighbors (KNN) and support vector machine (SVM) algorithms, and deep learning with the convolutional neural network (CNN) algorithm, together with the two categories of facial thermal images (50% of the images from the two augmented databases with added noise) presented above and used as input, were very good in both cases, i.e., with both databases used.
Novelty and Contribution
The article does not introduce entirely new concepts, but it still has an educational/didactic and comparative value. To better emphasize the study’s contribution, we explicitly highlighted the following:
Comparison of ML (SVM, RF and KNN) and DL (CNN) for thermal image-based emotion recognition:
While ML and DL have both been applied to infrared-based emotion detection, few studies provide a direct performance comparison across multiple algorithms.
This study evaluates which approach (ML or DL) is better suited for different scenarios, considering factors such as dataset size, computational efficiency and noise robustness.
Such a comparison is crucial for practical implementations where resource limitations may dictate algorithm selection.
Impact of Noise Augmentation in Thermal Image Classification:
Many thermal-based studies assume clean datasets, but in real-world applications, thermal sensors are susceptible to noise (e.g., environmental heat variations, sensor limitations, movement artifacts).
This paper systematically tests how Gaussian noise and salt-and-pepper noise affect ML and DL models, offering insights not commonly covered in prior works.
Computational Trade-offs Between ML and DL:
DL methods like CNNs have gained popularity, but their higher computational requirements make them impractical for certain low-power or real-time applications (e.g., wearable health monitoring devices).
This study demonstrates that traditional ML models (RF, SVM and KNN) can achieve competitive performance while requiring significantly fewer computational resources, if configured/adjusted properly.
5. Conclusions
Our contribution lies in providing a comparative analysis of these approaches, under realistic conditions that include dataset augmentation with noise. Unlike many studies that focus solely on deep learning, we evaluate whether traditional machine learning models (SVM, RF and KNN) can still perform competitively when proper preprocessing and feature selection techniques are applied.
Through systematic experiments, we demonstrate that both machine learning and deep learning have strengths in different scenarios, making this research highly relevant for real-world applications, where computational efficiency and dataset constraints must be considered.
Although no novel deep learning architecture was proposed, the study’s merit lies in its empirical findings, which show that traditional approaches can still compete with CNNs when properly optimized. Additionally, attention mechanisms and transformer-based models are an interesting direction for future work, but were not the main focus of this study.
A series of concrete conclusions drawn from the study are represented below.
Key Findings of the Study:
Machine learning models (RF, SVM) performed comparably to CNNs in thermal image classification, particularly when dataset augmentation and feature selection were applied.
CNNs achieved higher accuracy in some cases but required significantly more computational power.
The impact of noise augmentation was critical: even with high noise levels, classification remained highly accurate (99–100%), showing robustness of both ML and DL methods.
The findings suggest that hybrid models (CNN for feature extraction + RF, SVM and KNN for classification) could offer an optimal balance between accuracy and computational efficiency.
Since temperature variations hold the most critical information, feature-based ML approaches (like RF and SVM) remain relevant in this field.
This study provides one of the few direct comparisons between ML and DL models in thermal emotion recognition, highlighting that ML can still perform well in this domain.
Scientific Takeaways:
Thermal image-based emotion classification is not purely a spatial problem (as in RGB image-based emotion recognition), making it justifiable to compare classical ML approaches to CNNs.
The study confirms that data augmentation significantly boosts performance, even in small datasets, which is important for future studies in thermal image-based AI applications.
Both CNNs and ML models demonstrated high resilience to noise, suggesting that thermal-based emotion recognition can be effective even in less controlled environments.
Future Work Suggestions:
To explore advanced deep learning techniques, such as attention mechanisms and Vision Transformers, to further investigate feature extraction differences between ML and CNNs.
To evaluate more hybrid models where CNNs extract features, and other algorithms perform the final classification.
To implement a more complex classifier, with multiple outputs (more than three), used in combination with other algorithms, in order to make the classification process more efficient and less time consuming.
Analyzing the works presented above in comparison with the current work, some widely varying accuracy rates in thermal emotion recognition were obtained; this is due to the following factors presented below.
Variations in Datasets:
Some studies use small, highly controlled datasets, while others employ larger, more diverse datasets.
Diversity in subjects (age, ethnicity, skin type) affects thermal imaging accuracy, as different individuals may exhibit distinct thermal signatures.
Differences in Preprocessing Techniques:
Some studies apply strong filtering, denoising, and normalization to thermal images, leading to higher reported accuracy.
Others use raw thermal data, which introduces more noise and variability.
Model Selection and Feature Extraction:
Earlier studies may have focused on traditional ML techniques, while recent work emphasizes CNNs and deep learning.
Some studies rely on handcrafted features, while others use end-to-end learning.
Environmental and Hardware Factors:
The thermal camera resolution, sensitivity and calibration significantly impact accuracy.
Studies using high-end thermal cameras often report better results than those using low-cost sensors.
Emotion classification from thermal images is more than just a theoretical problem; it has significant real-world applications. Starting from the results obtained from other research as well as from those obtained in this work, we can conclude that thermal images can be successfully used in various fields of activity, such as those presented below.
Healthcare and Mental Health Monitoring:
The high accuracy and noise resilience of ML models make them suitable for real-time stress monitoring in hospitals, telemedicine and mental health applications.
Portable and embedded implementations could use RF or SVM models instead of CNNs to reduce computational costs while maintaining accuracy.
Non-invasive stress and anxiety detection for patients unable to verbally communicate (e.g., individuals with autism or speech disorders).
Remote patient monitoring for detecting signs of fatigue or distress.
Security and Lie Detection:
Thermal-based deception detection systems require models that can handle noisy, real-world conditions.
This study confirms that both CNNs and ML models can work effectively in such settings, opening the door for AI-driven security applications.
Airport security and law enforcement could benefit from thermal-based deception detection by analyzing micro-expressions in heat maps.
Driver monitoring systems could assess fatigue levels in real time to prevent accidents.
Future AI Model Development for Thermal Imaging:
Hybrid models should be more explored, that is, CNNs for feature extraction, and different ML models for classification.
Transformers and attention mechanisms should be tested for extracting more advanced thermal features.
Human–Computer Interaction (HCI):
Thermal-based adaptive systems that adjust user interfaces based on emotional state (e.g., reducing screen brightness if stress is detected).
VR and gaming applications that adapt gameplay difficulty based on user engagement and emotions.
This study highlights the effectiveness of both traditional machine learning and deep learning methods in classifying human emotions from facial thermal images. Through extensive experimentation, we demonstrated that deep learning models, particularly CNNs, excel in feature extraction and classification, achieving near-perfect accuracy. However, our findings also reinforce the viability of machine learning models like RF, SVM and KNN, which, with appropriate feature selection and preprocessing, can achieve comparable performance while being more computationally efficient. Importantly, we showed that robust classification is possible even when thermal images are subjected to high levels of noise, reinforcing the resilience of AI-driven emotion recognition in real-world, uncontrolled environments. This work contributes not only to advancing the application of AI in thermal image analysis but also to guiding future research on balancing accuracy, efficiency and practicality. By providing a comprehensive comparison of ML and DL techniques in thermal emotion recognition, this work bridges a critical gap in the field and lays the foundation for future advancements, including hybrid models and transformer-based architectures. Future work also could explore integrating attention mechanisms to further refine emotion recognition. Ultimately, this research underscores the growing potential of AI-driven thermal imaging in diverse fields such as healthcare, security and human–computer interactions, paving the way for more adaptive and intelligent systems.


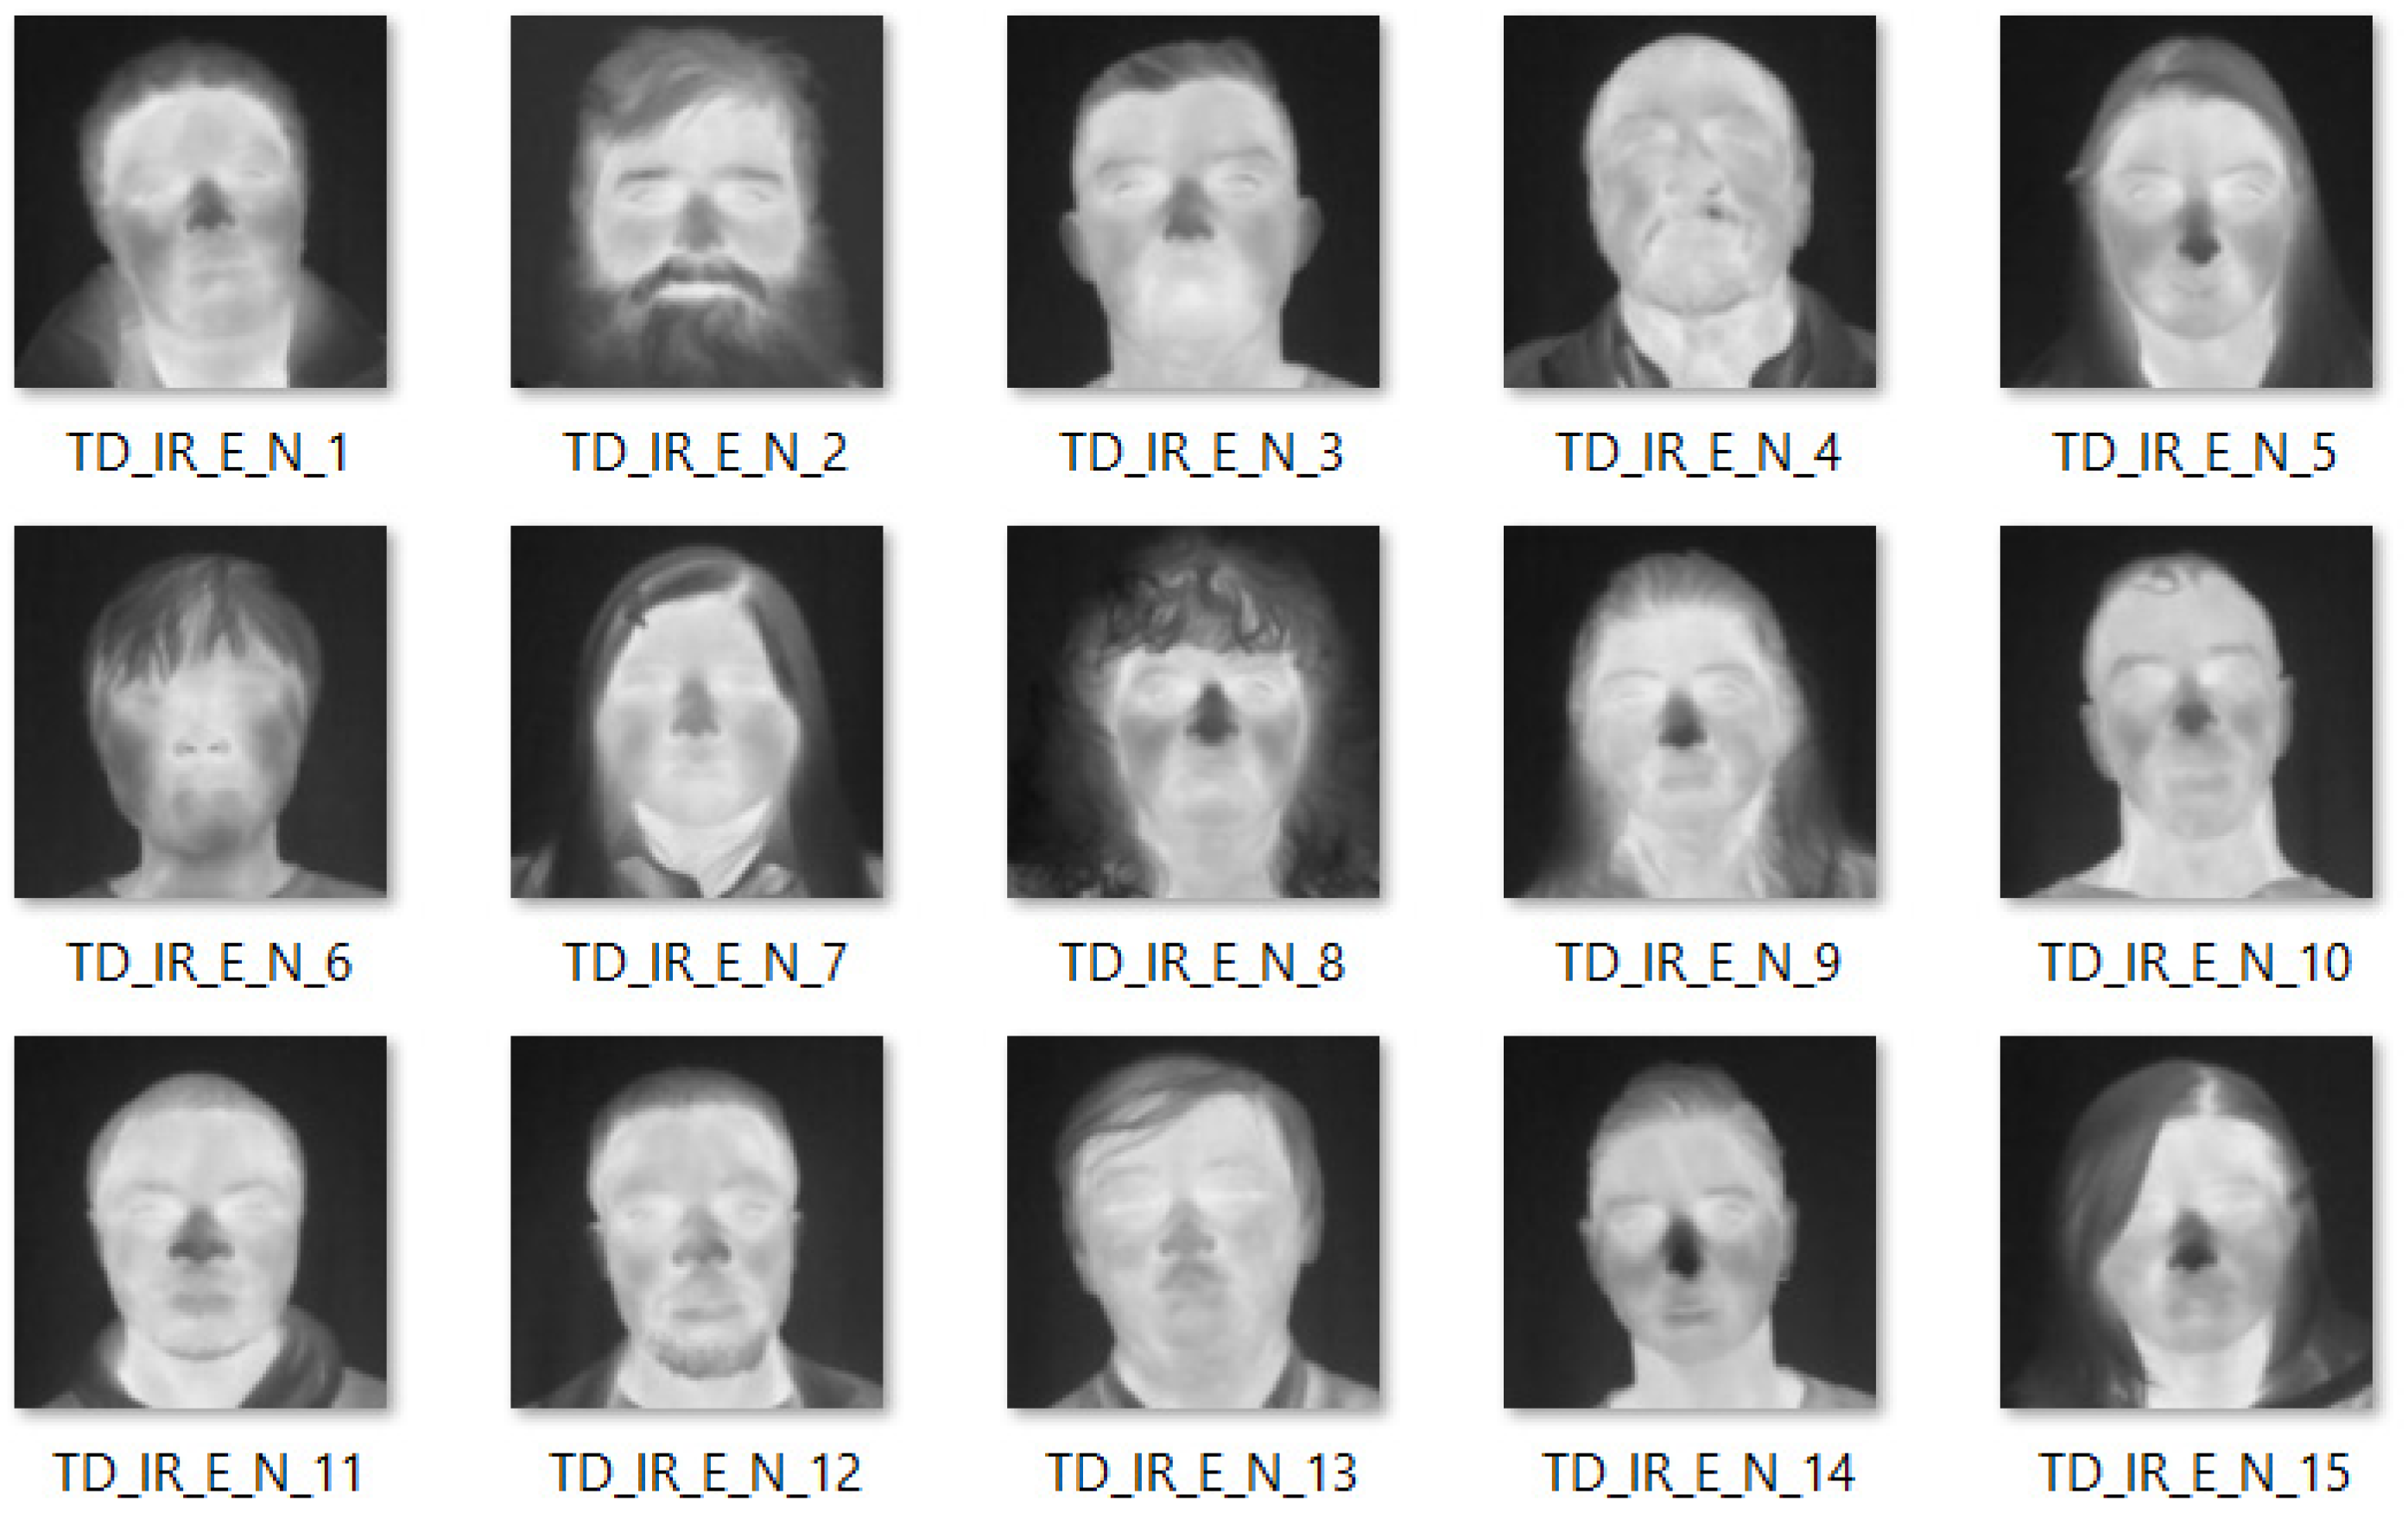
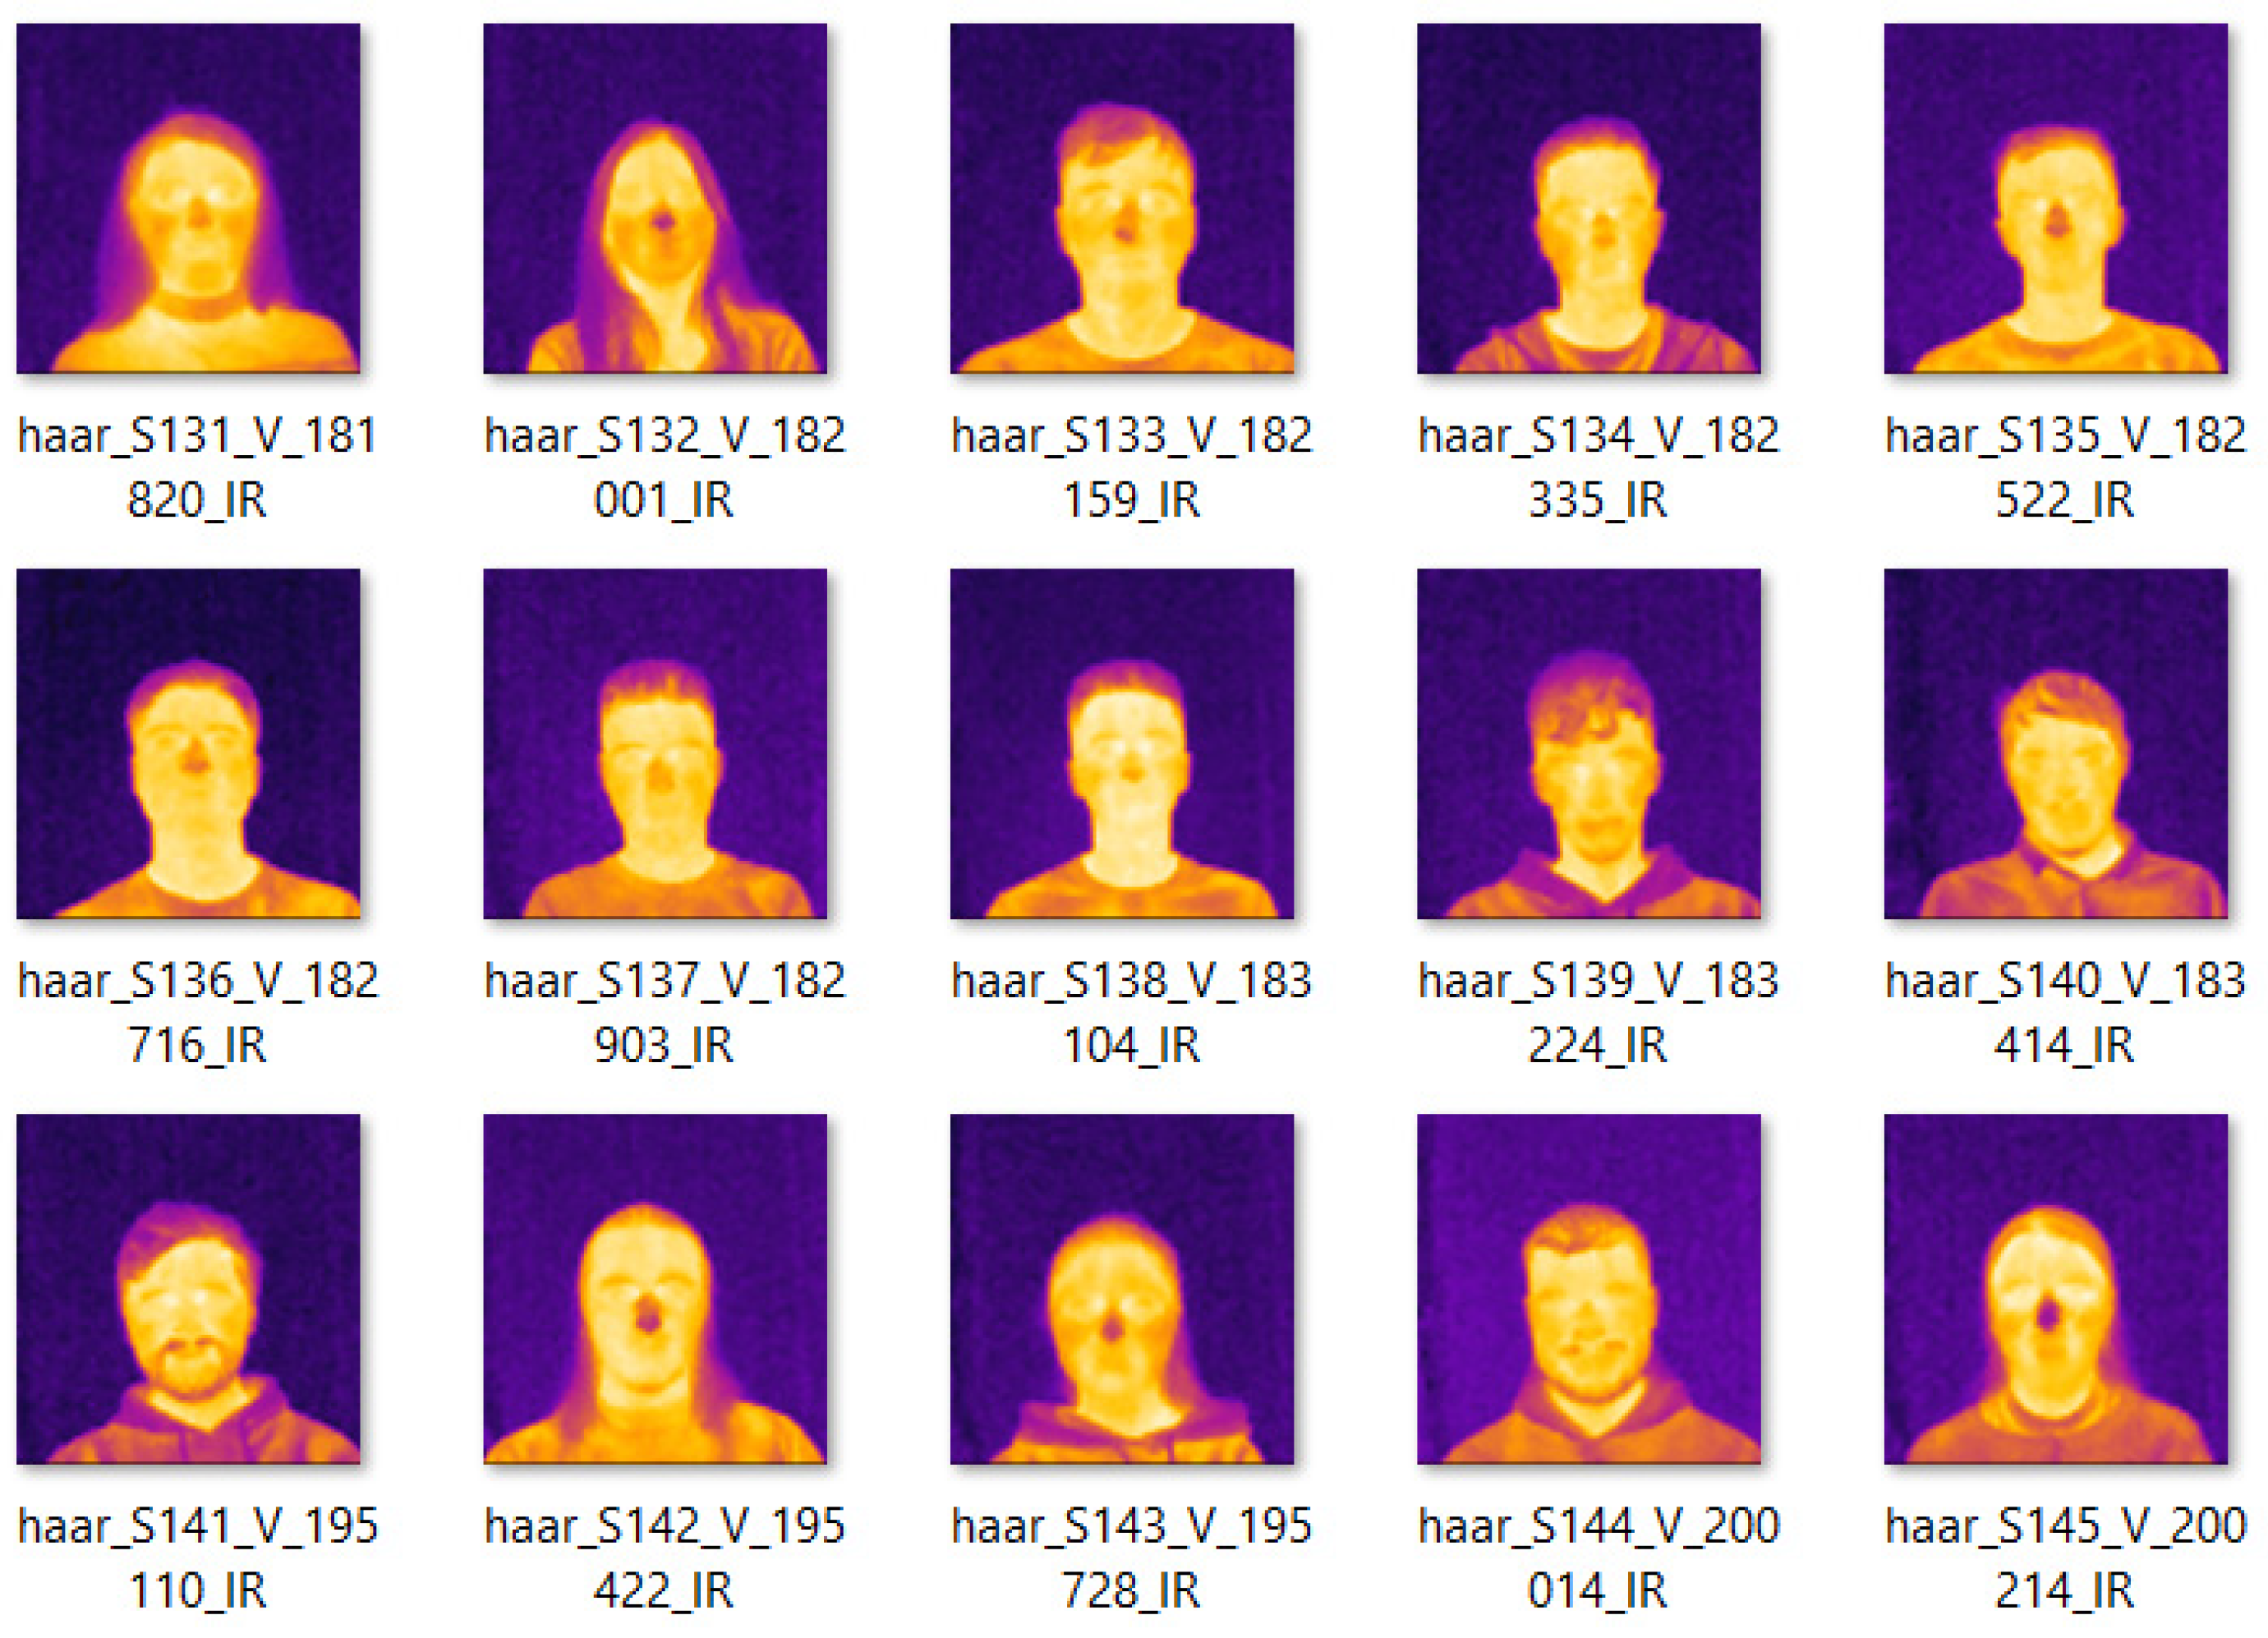
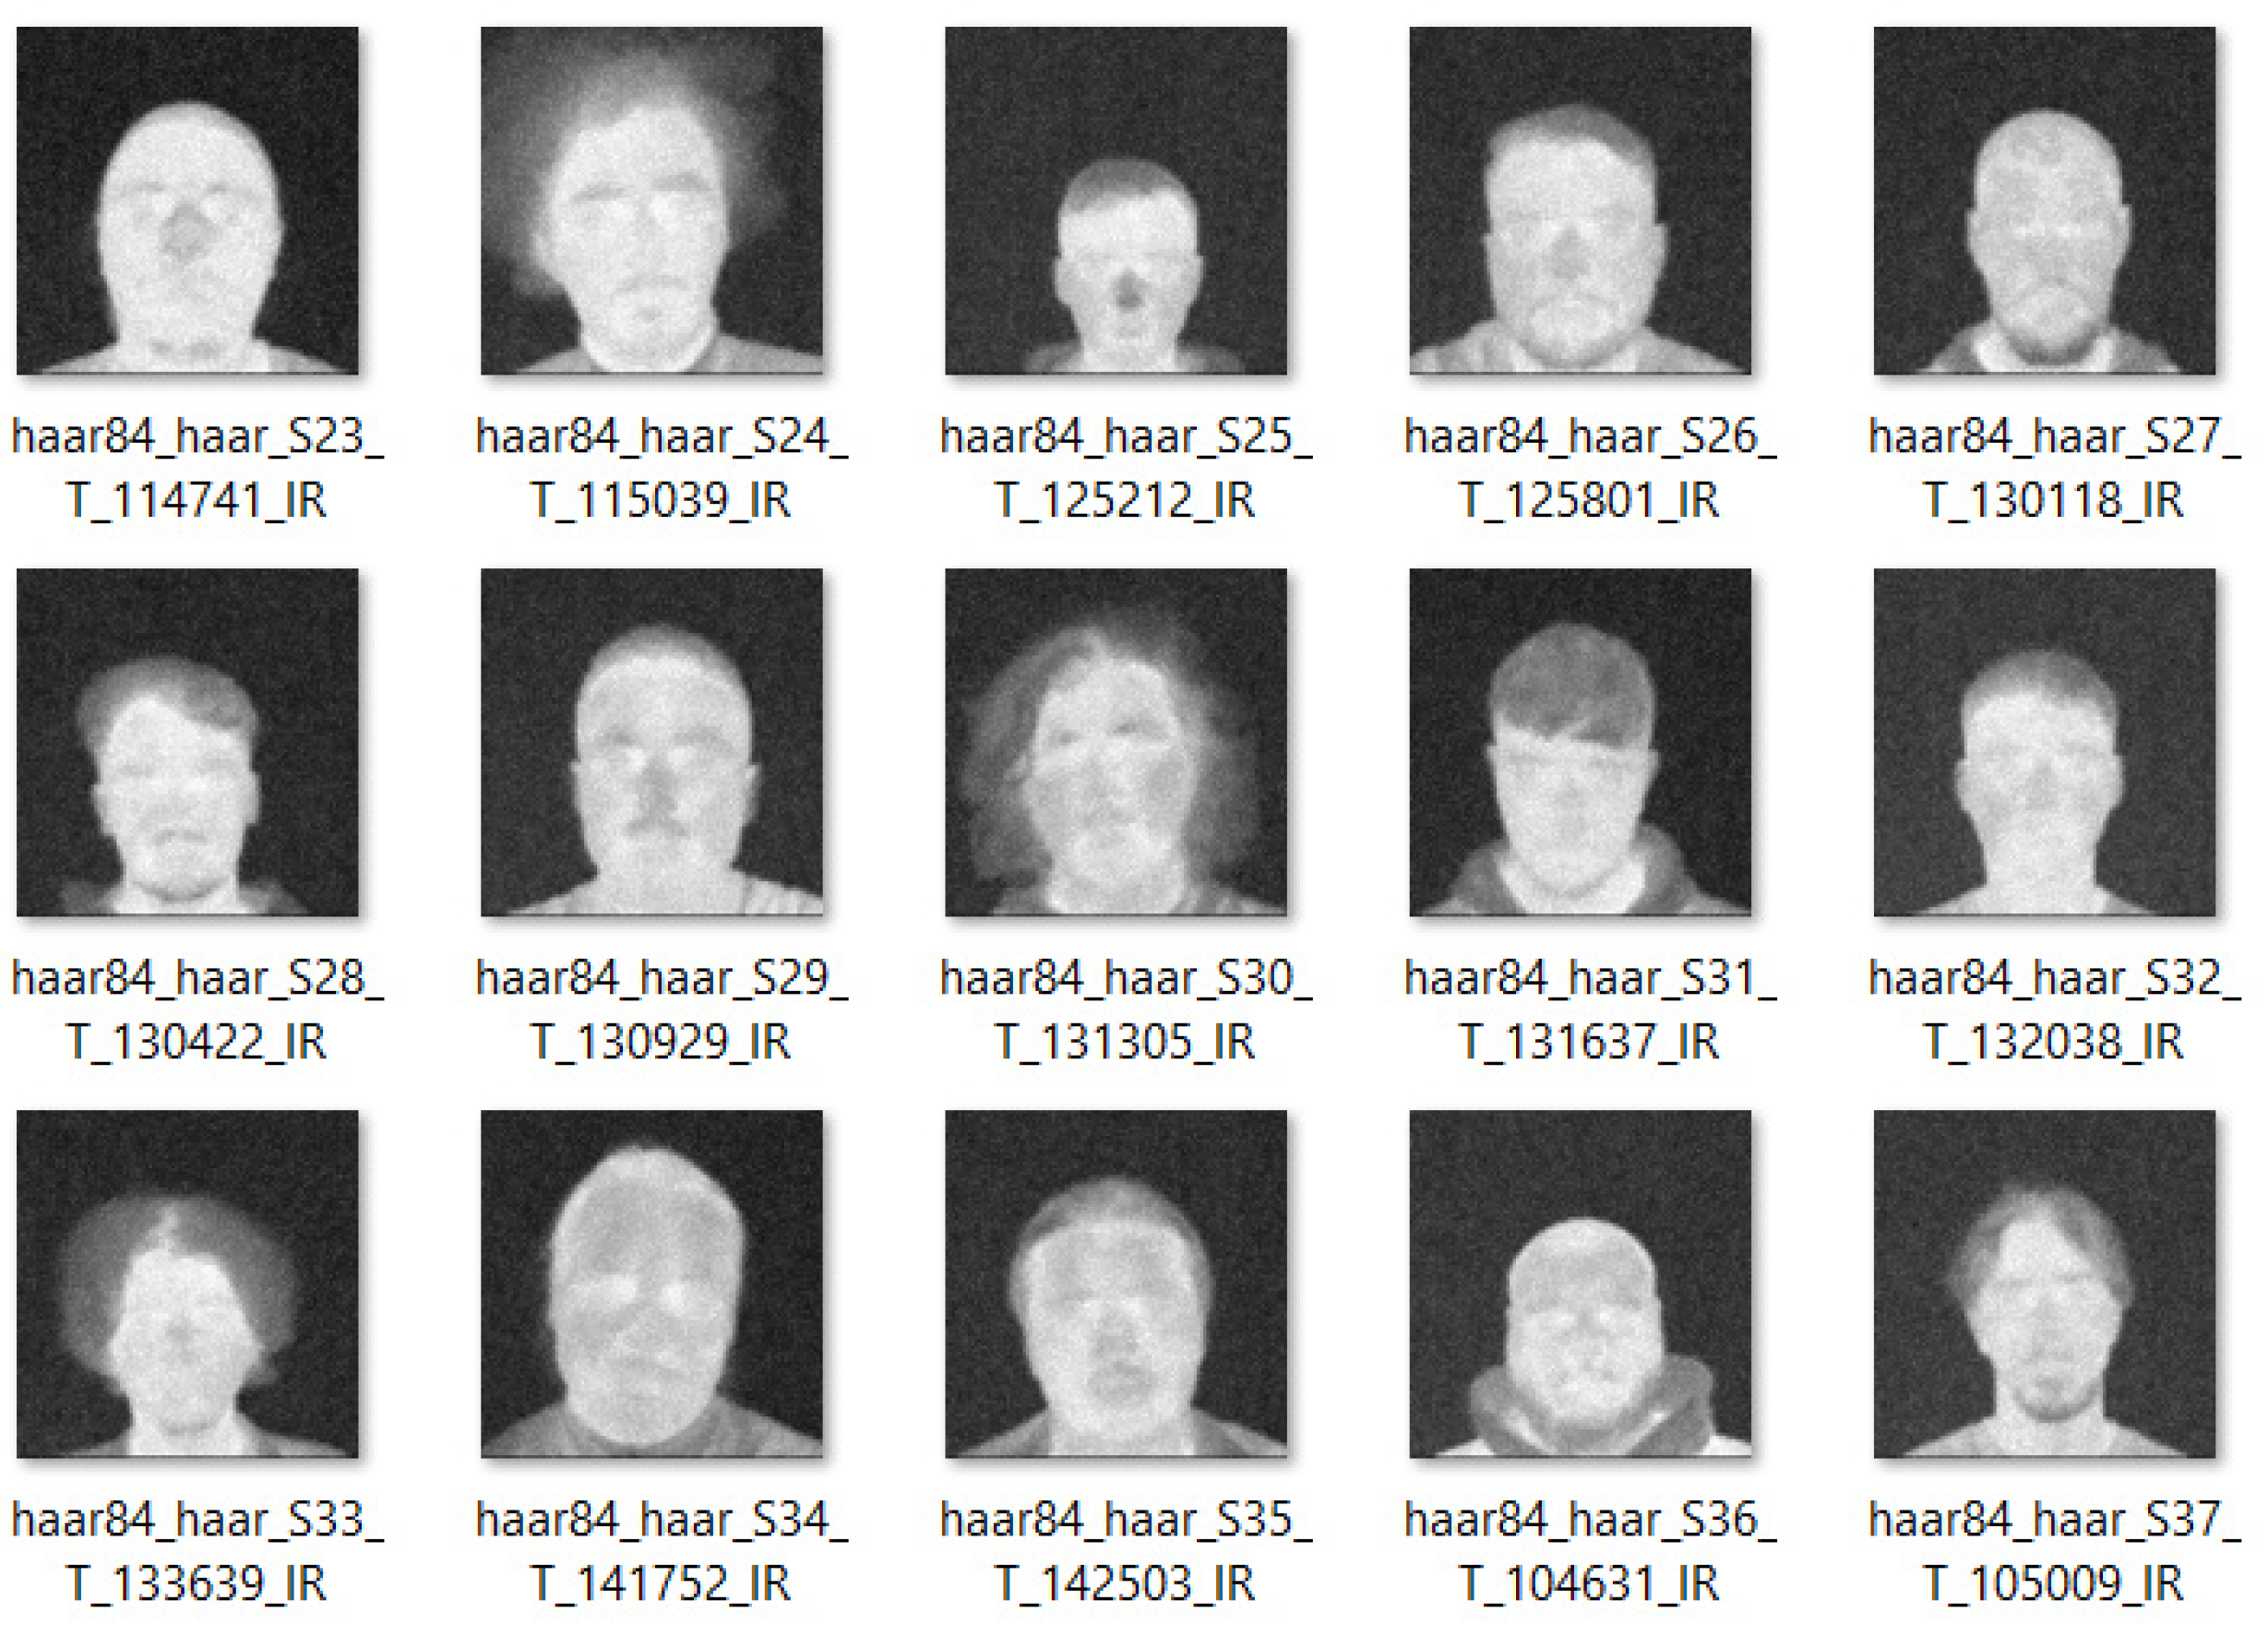
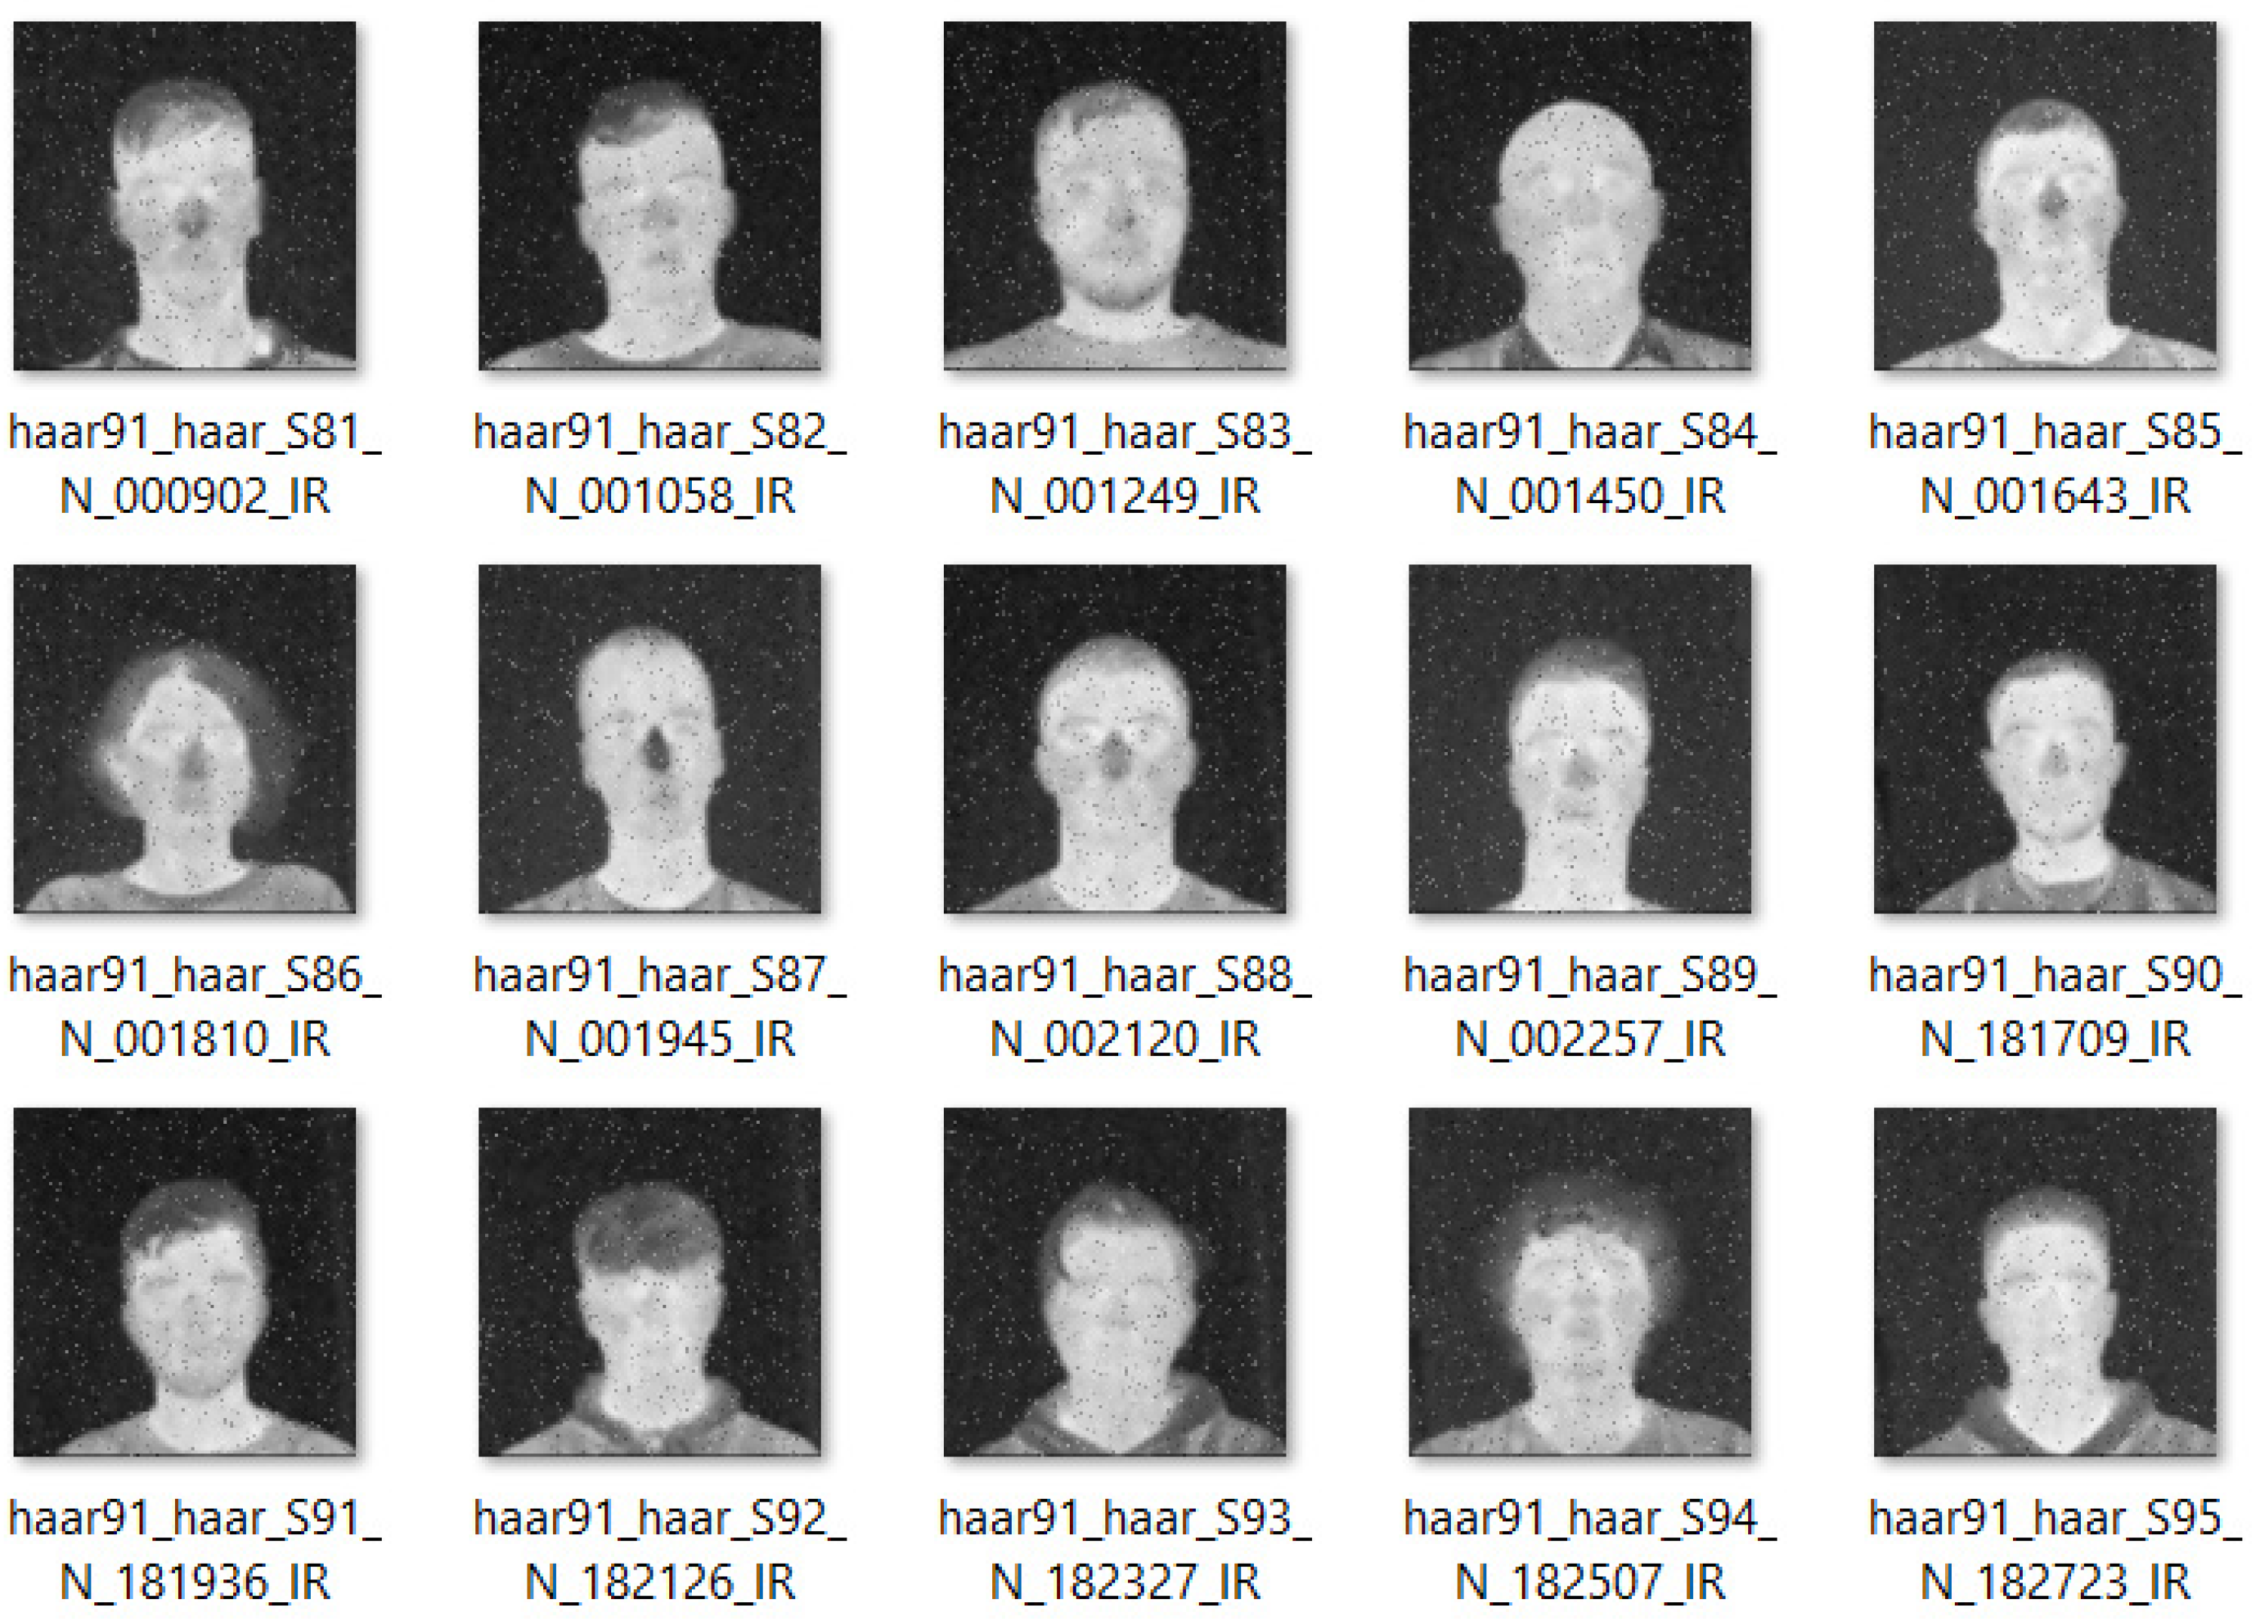
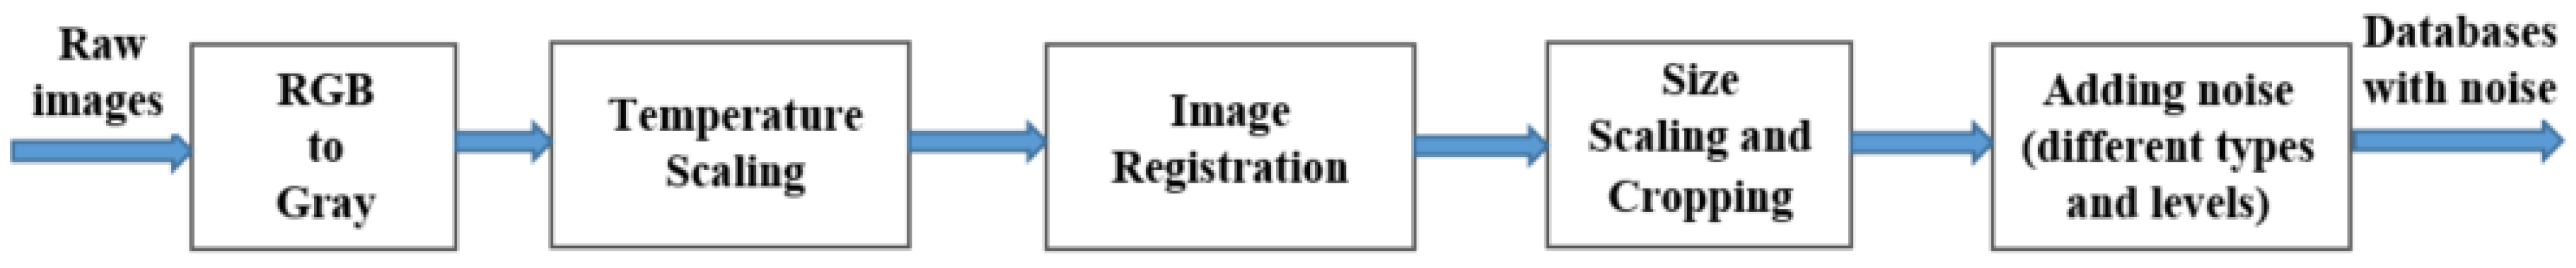
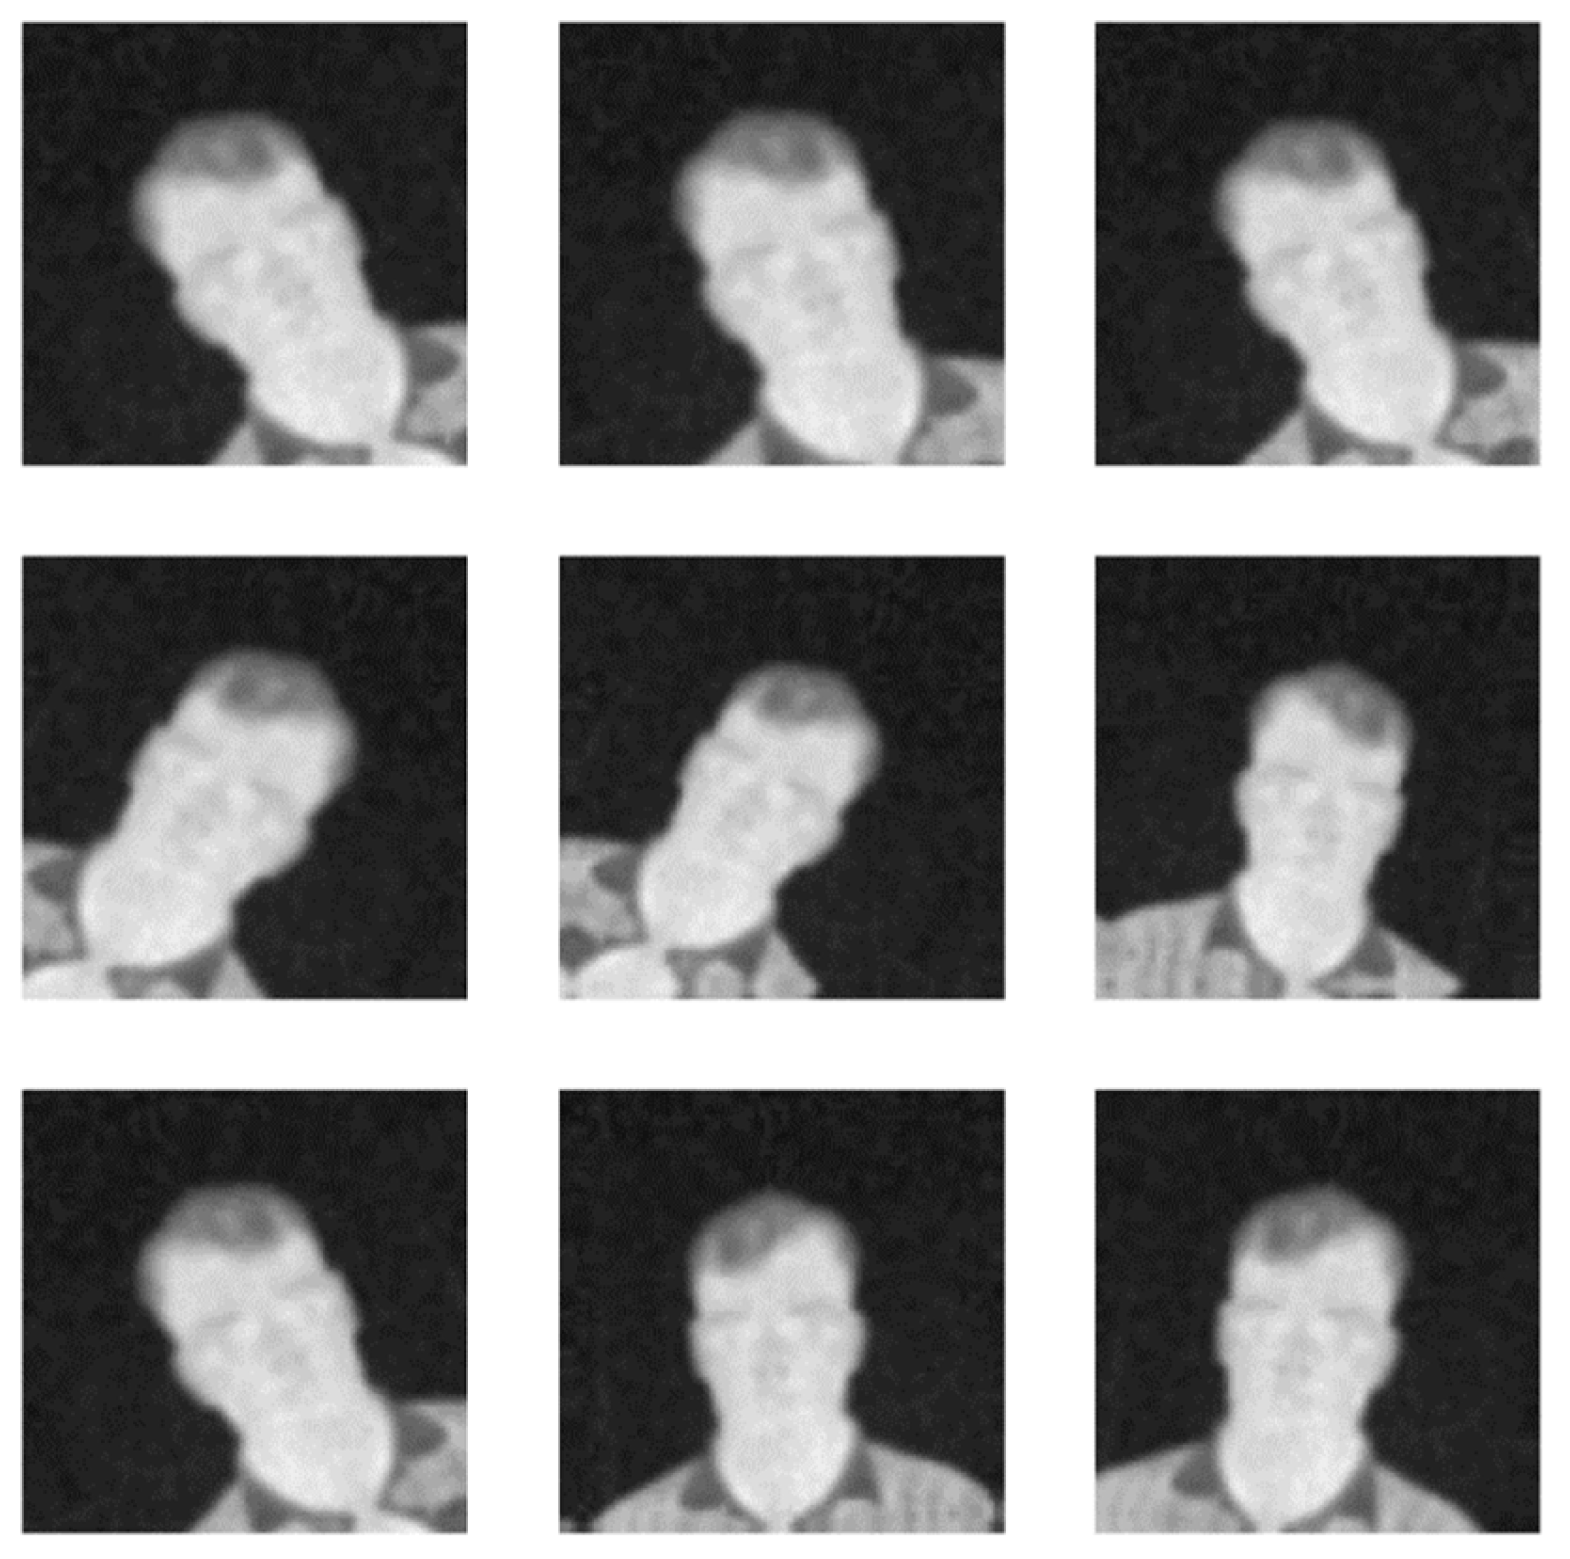
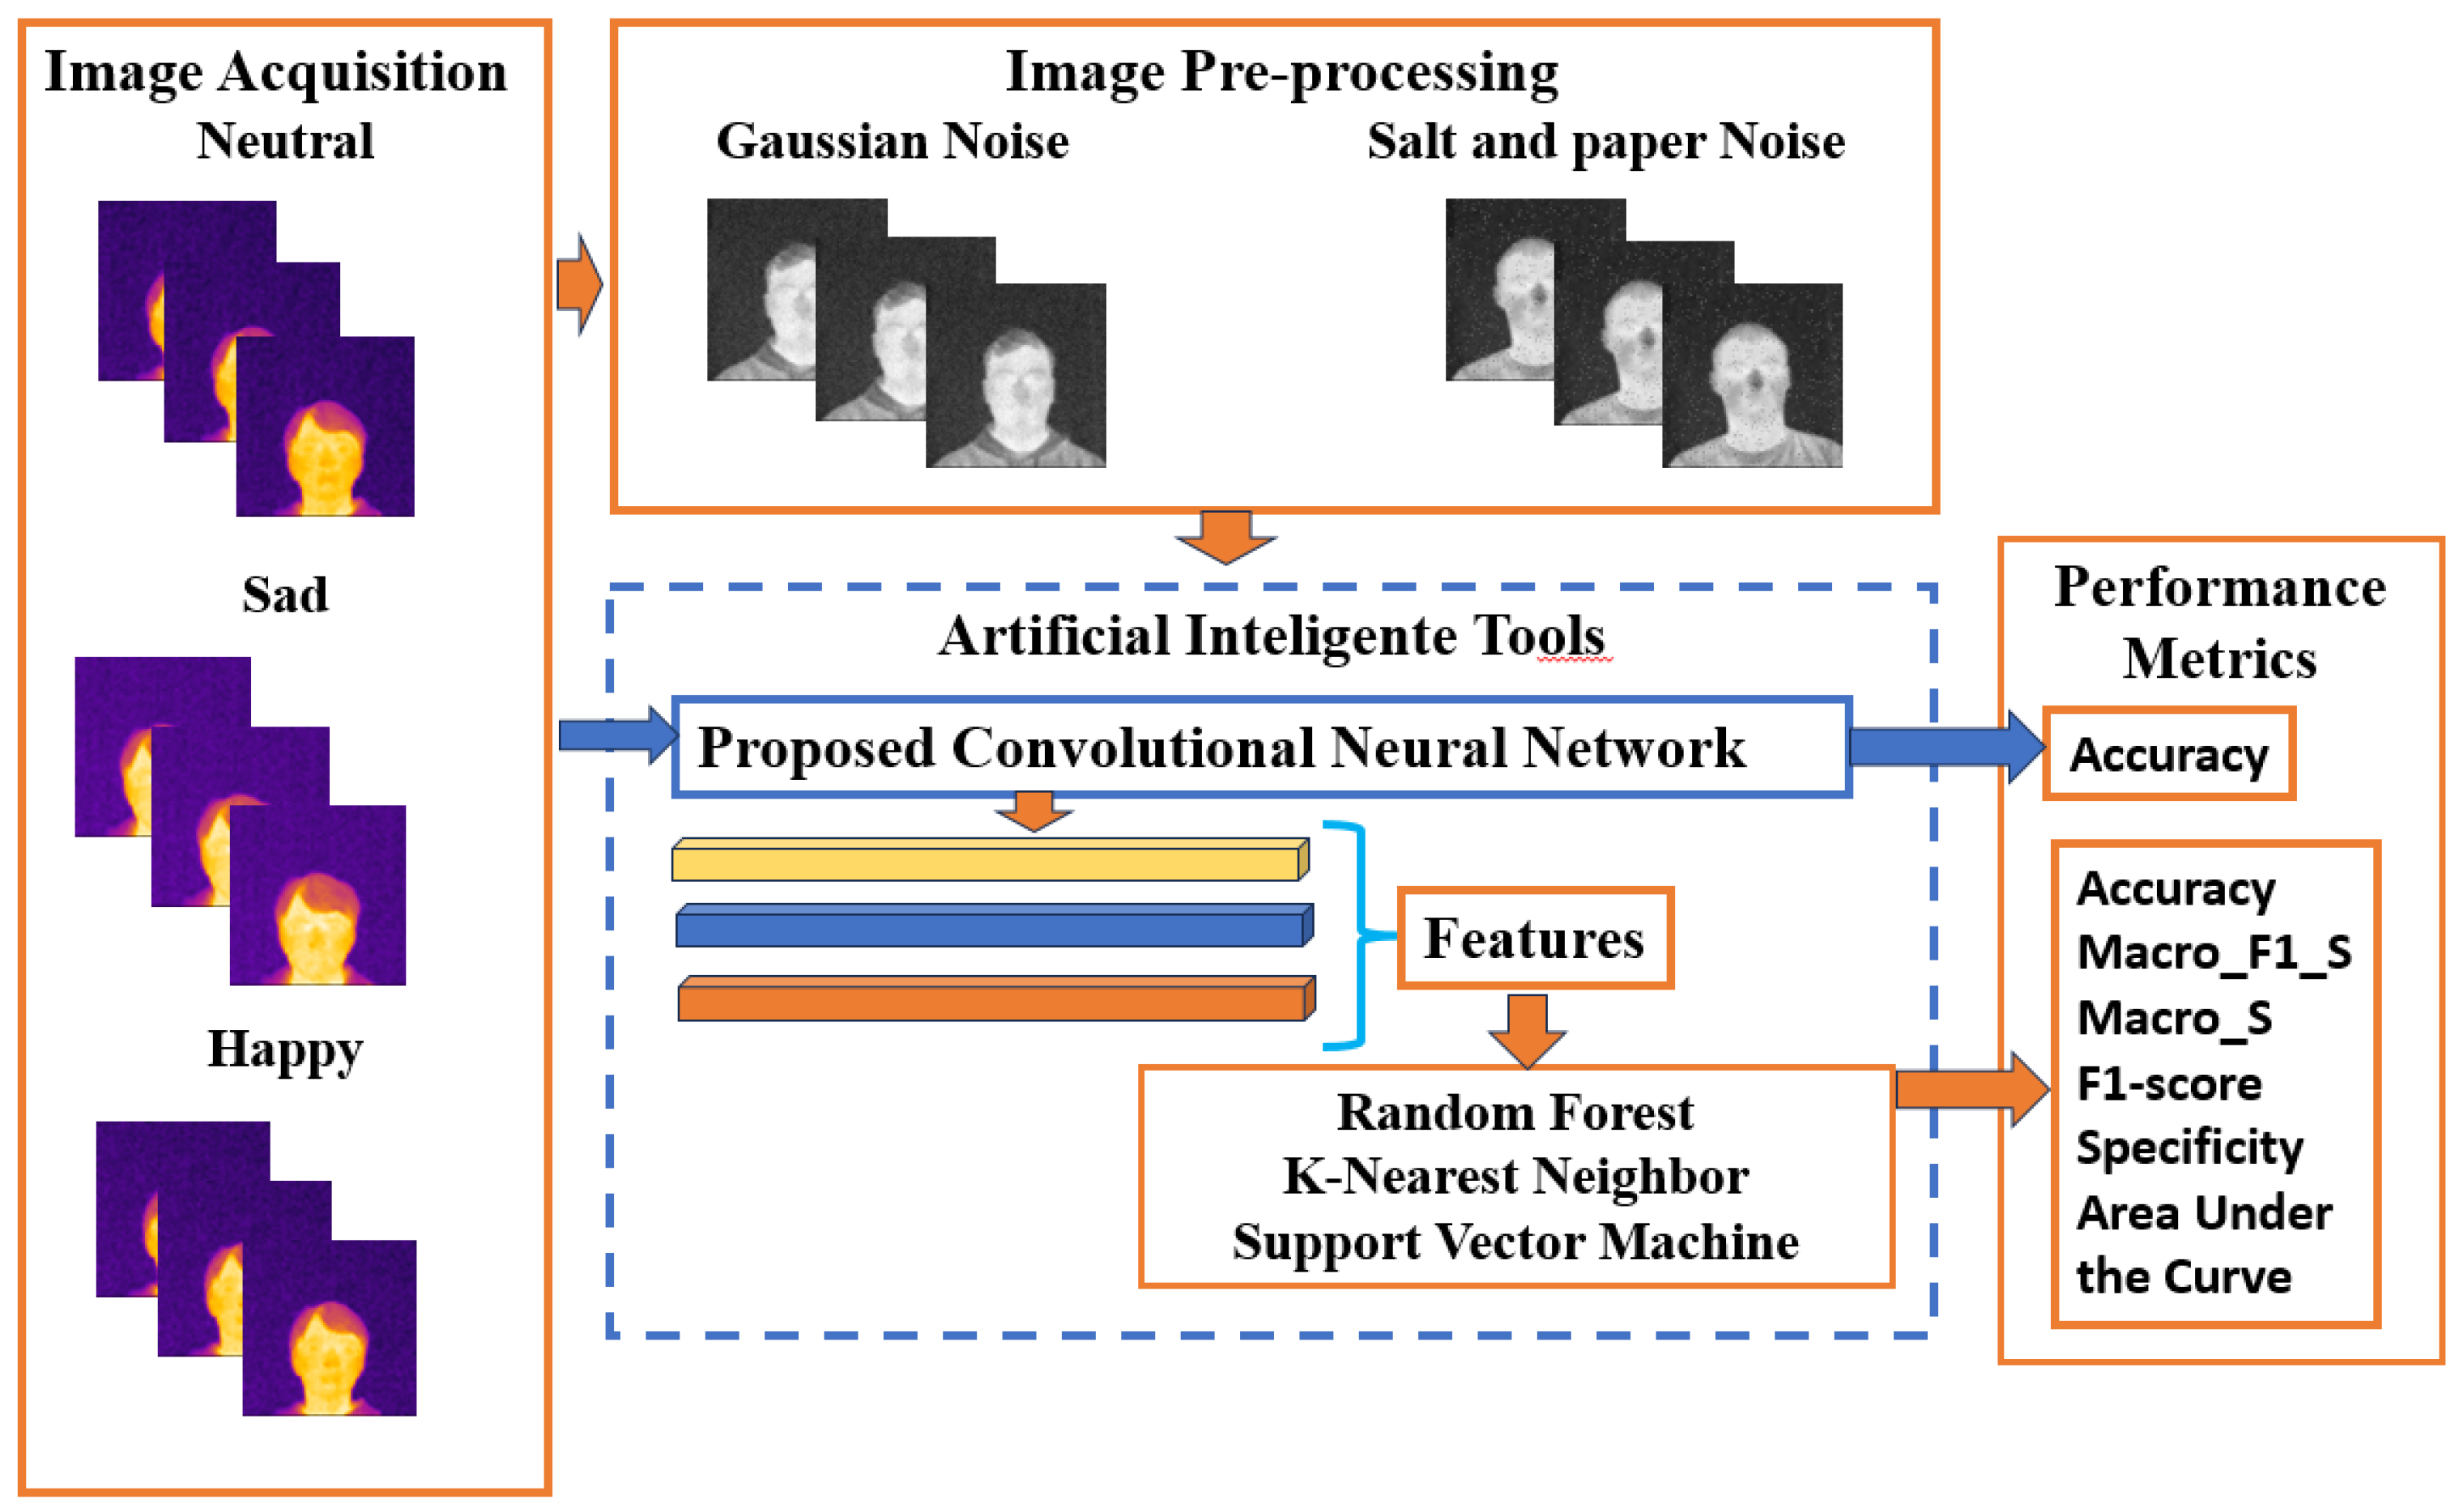
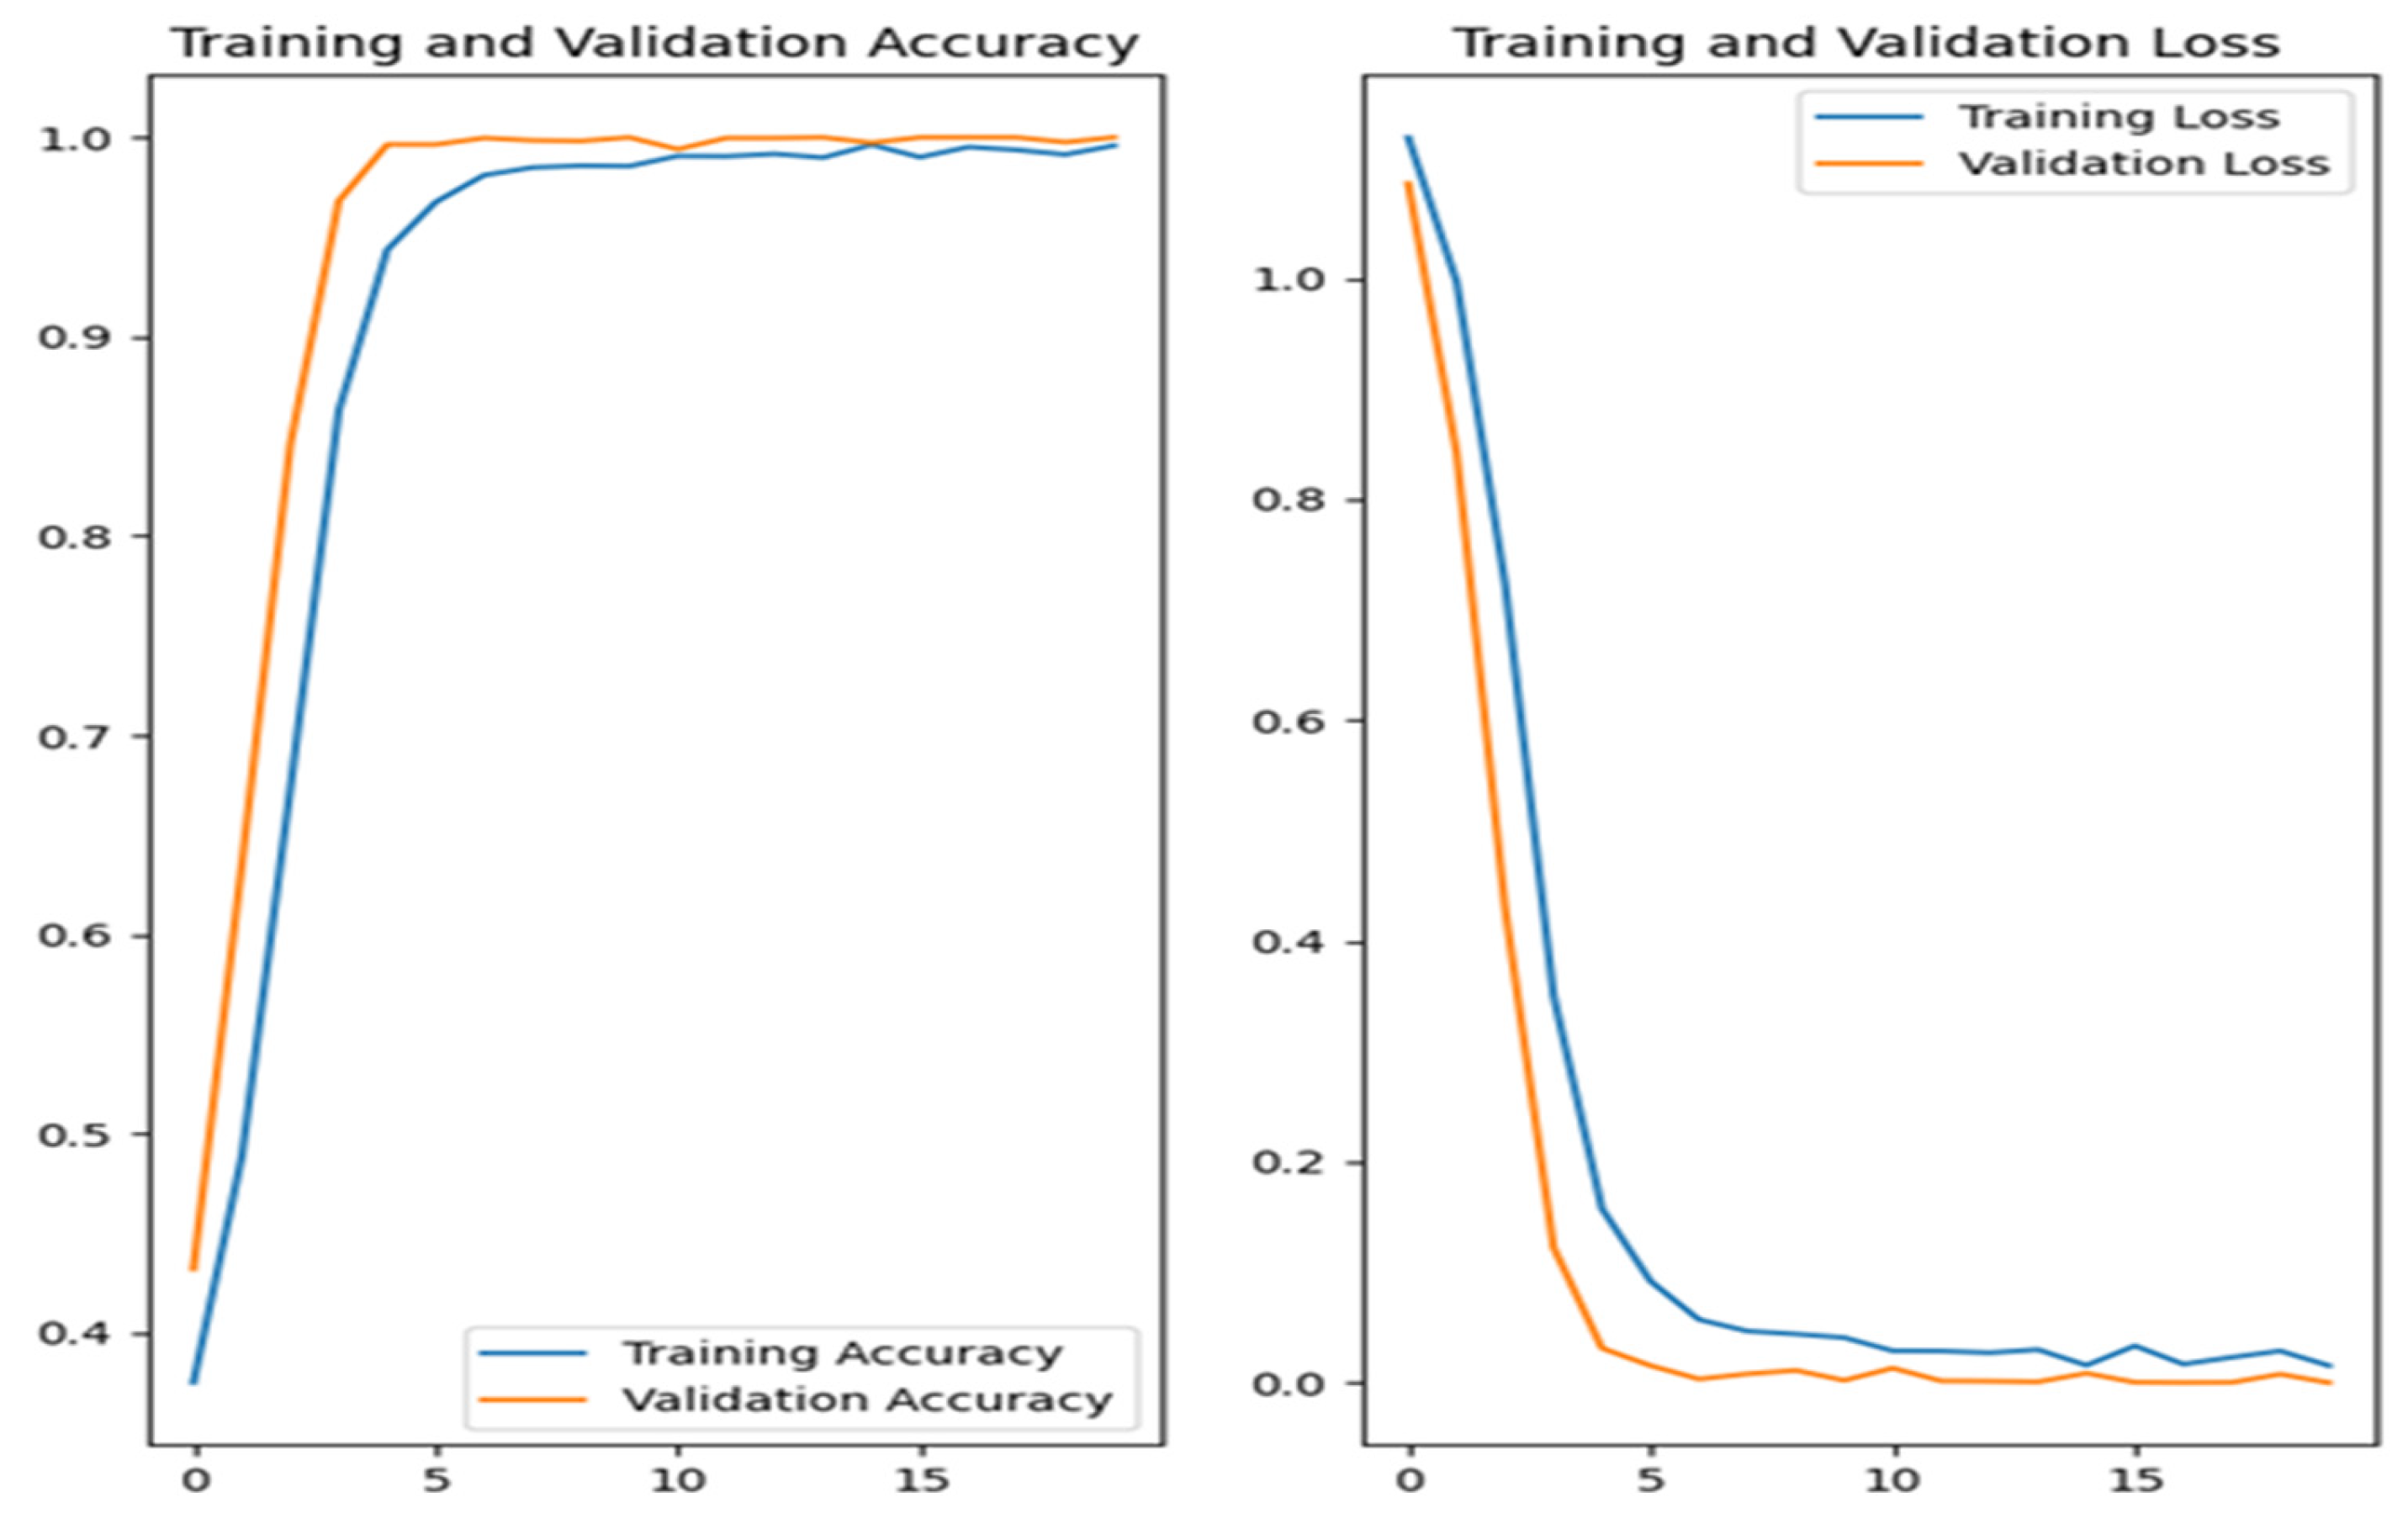
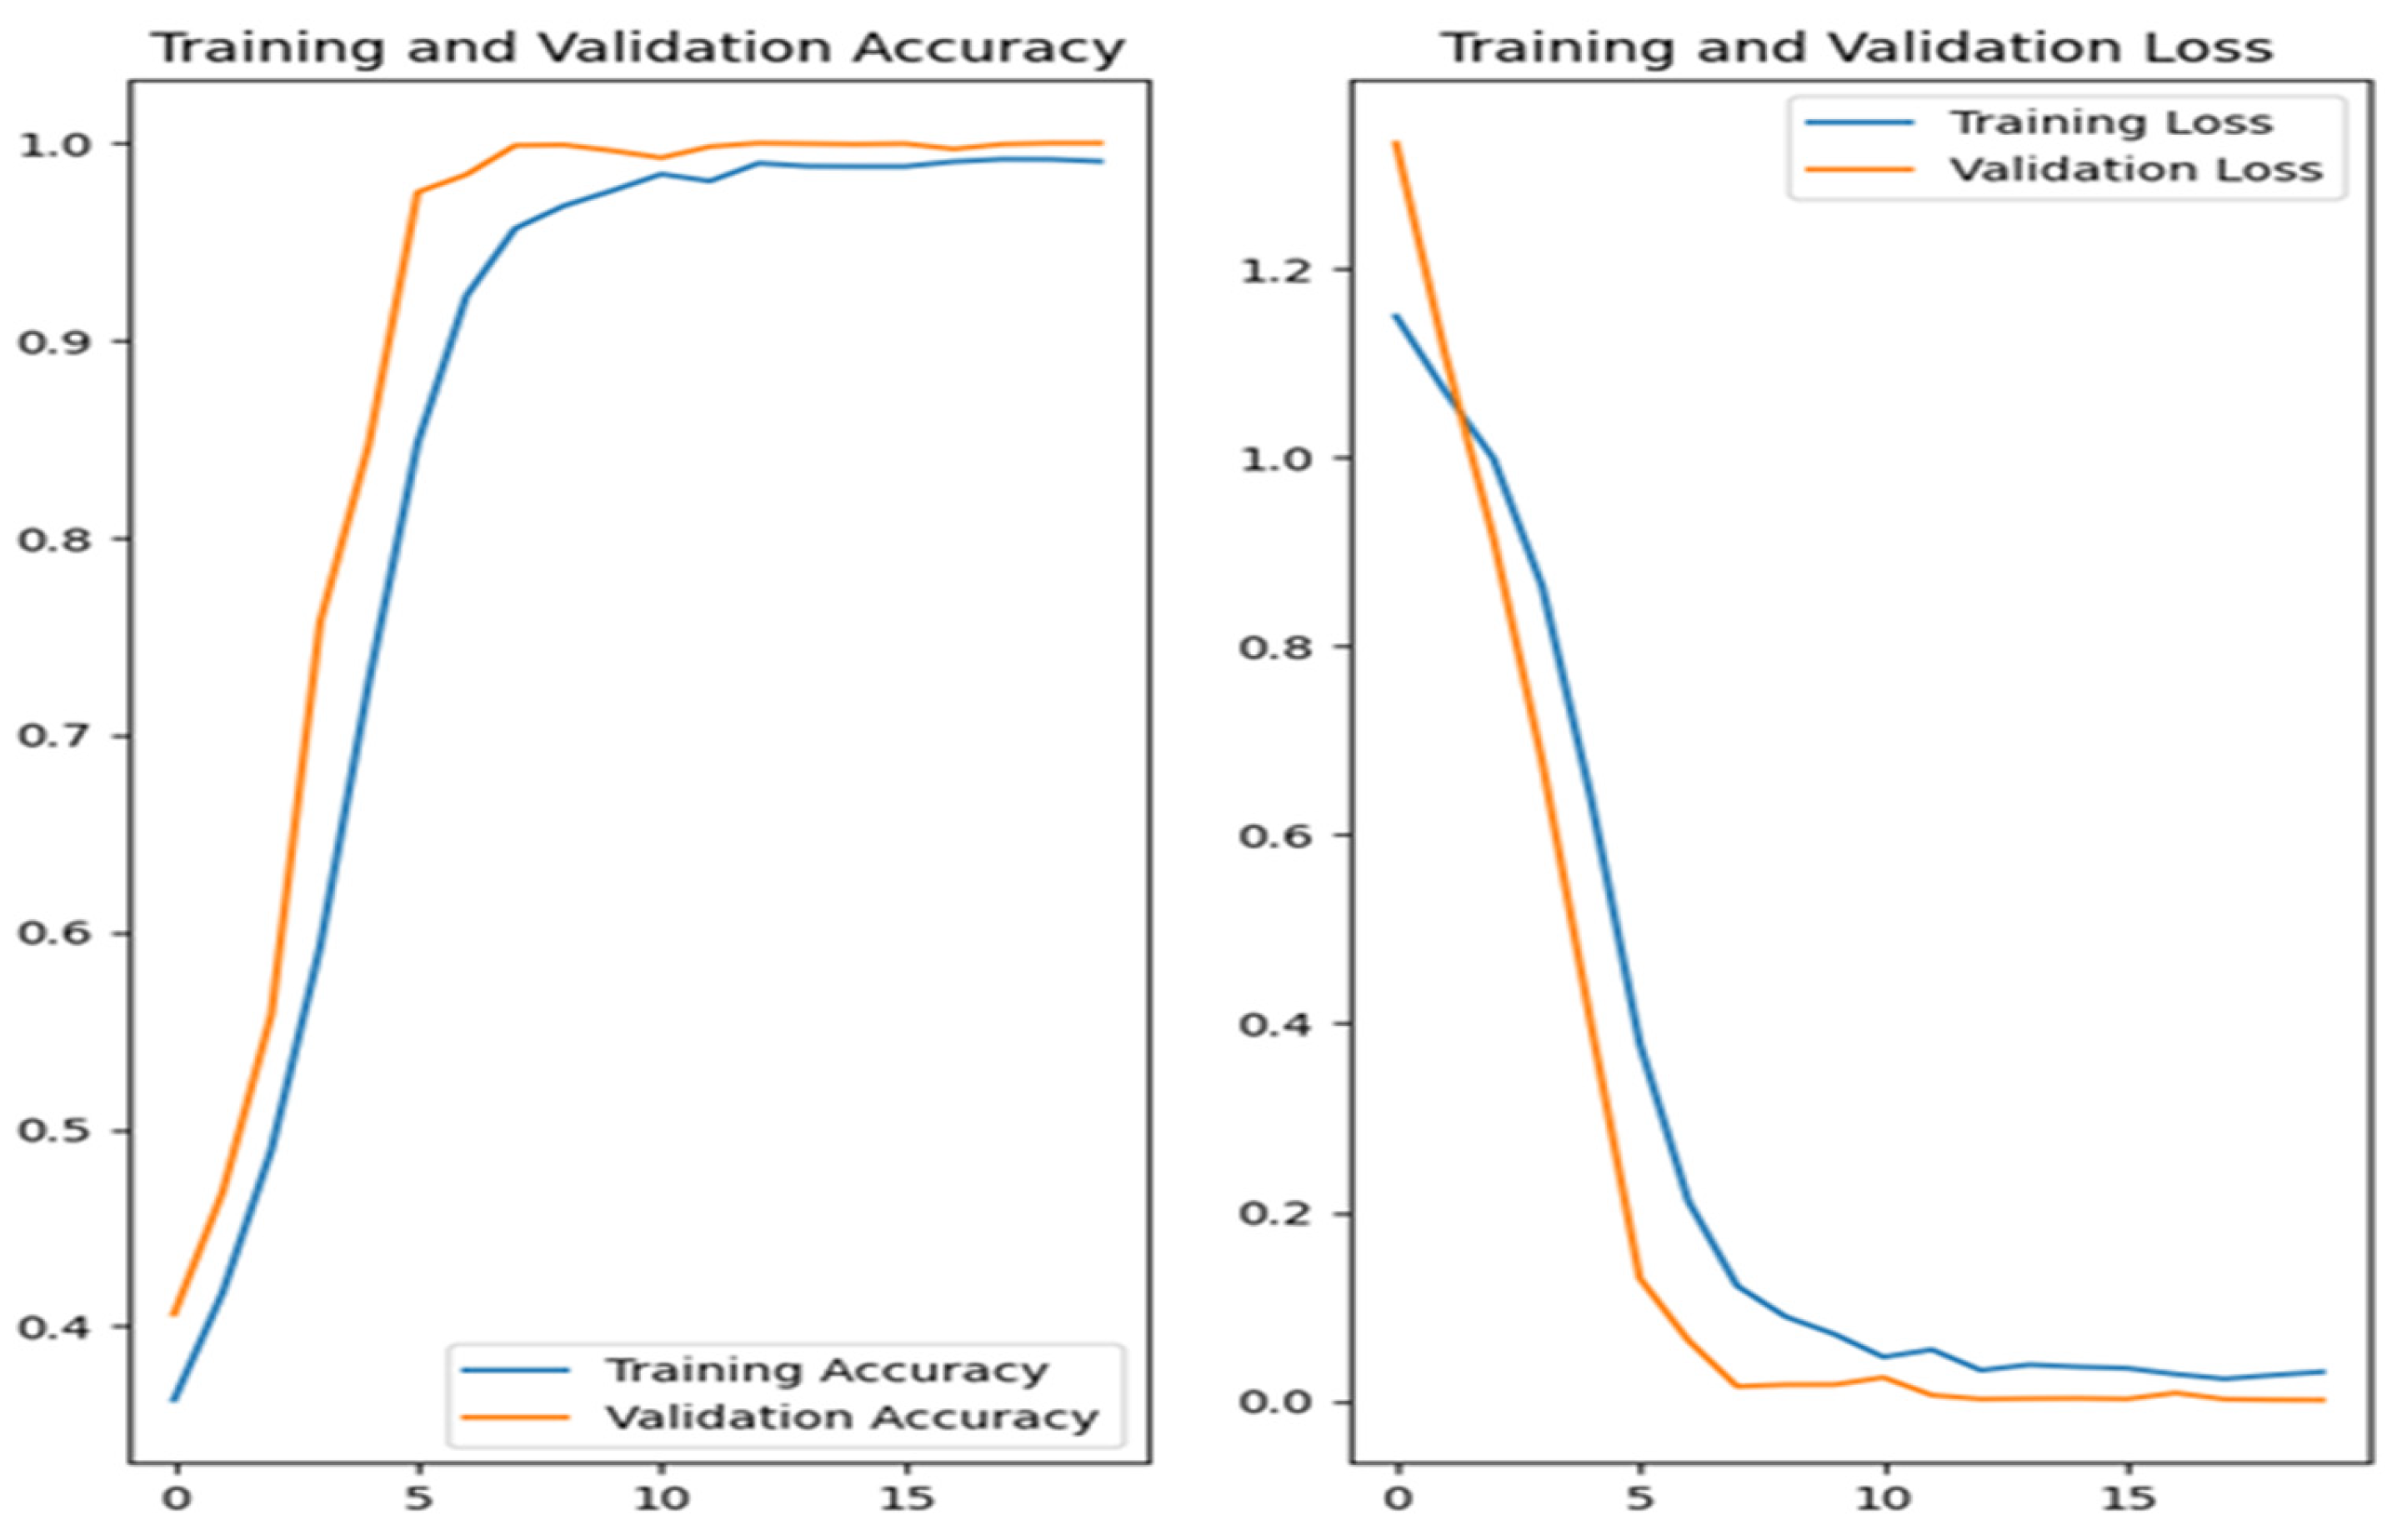
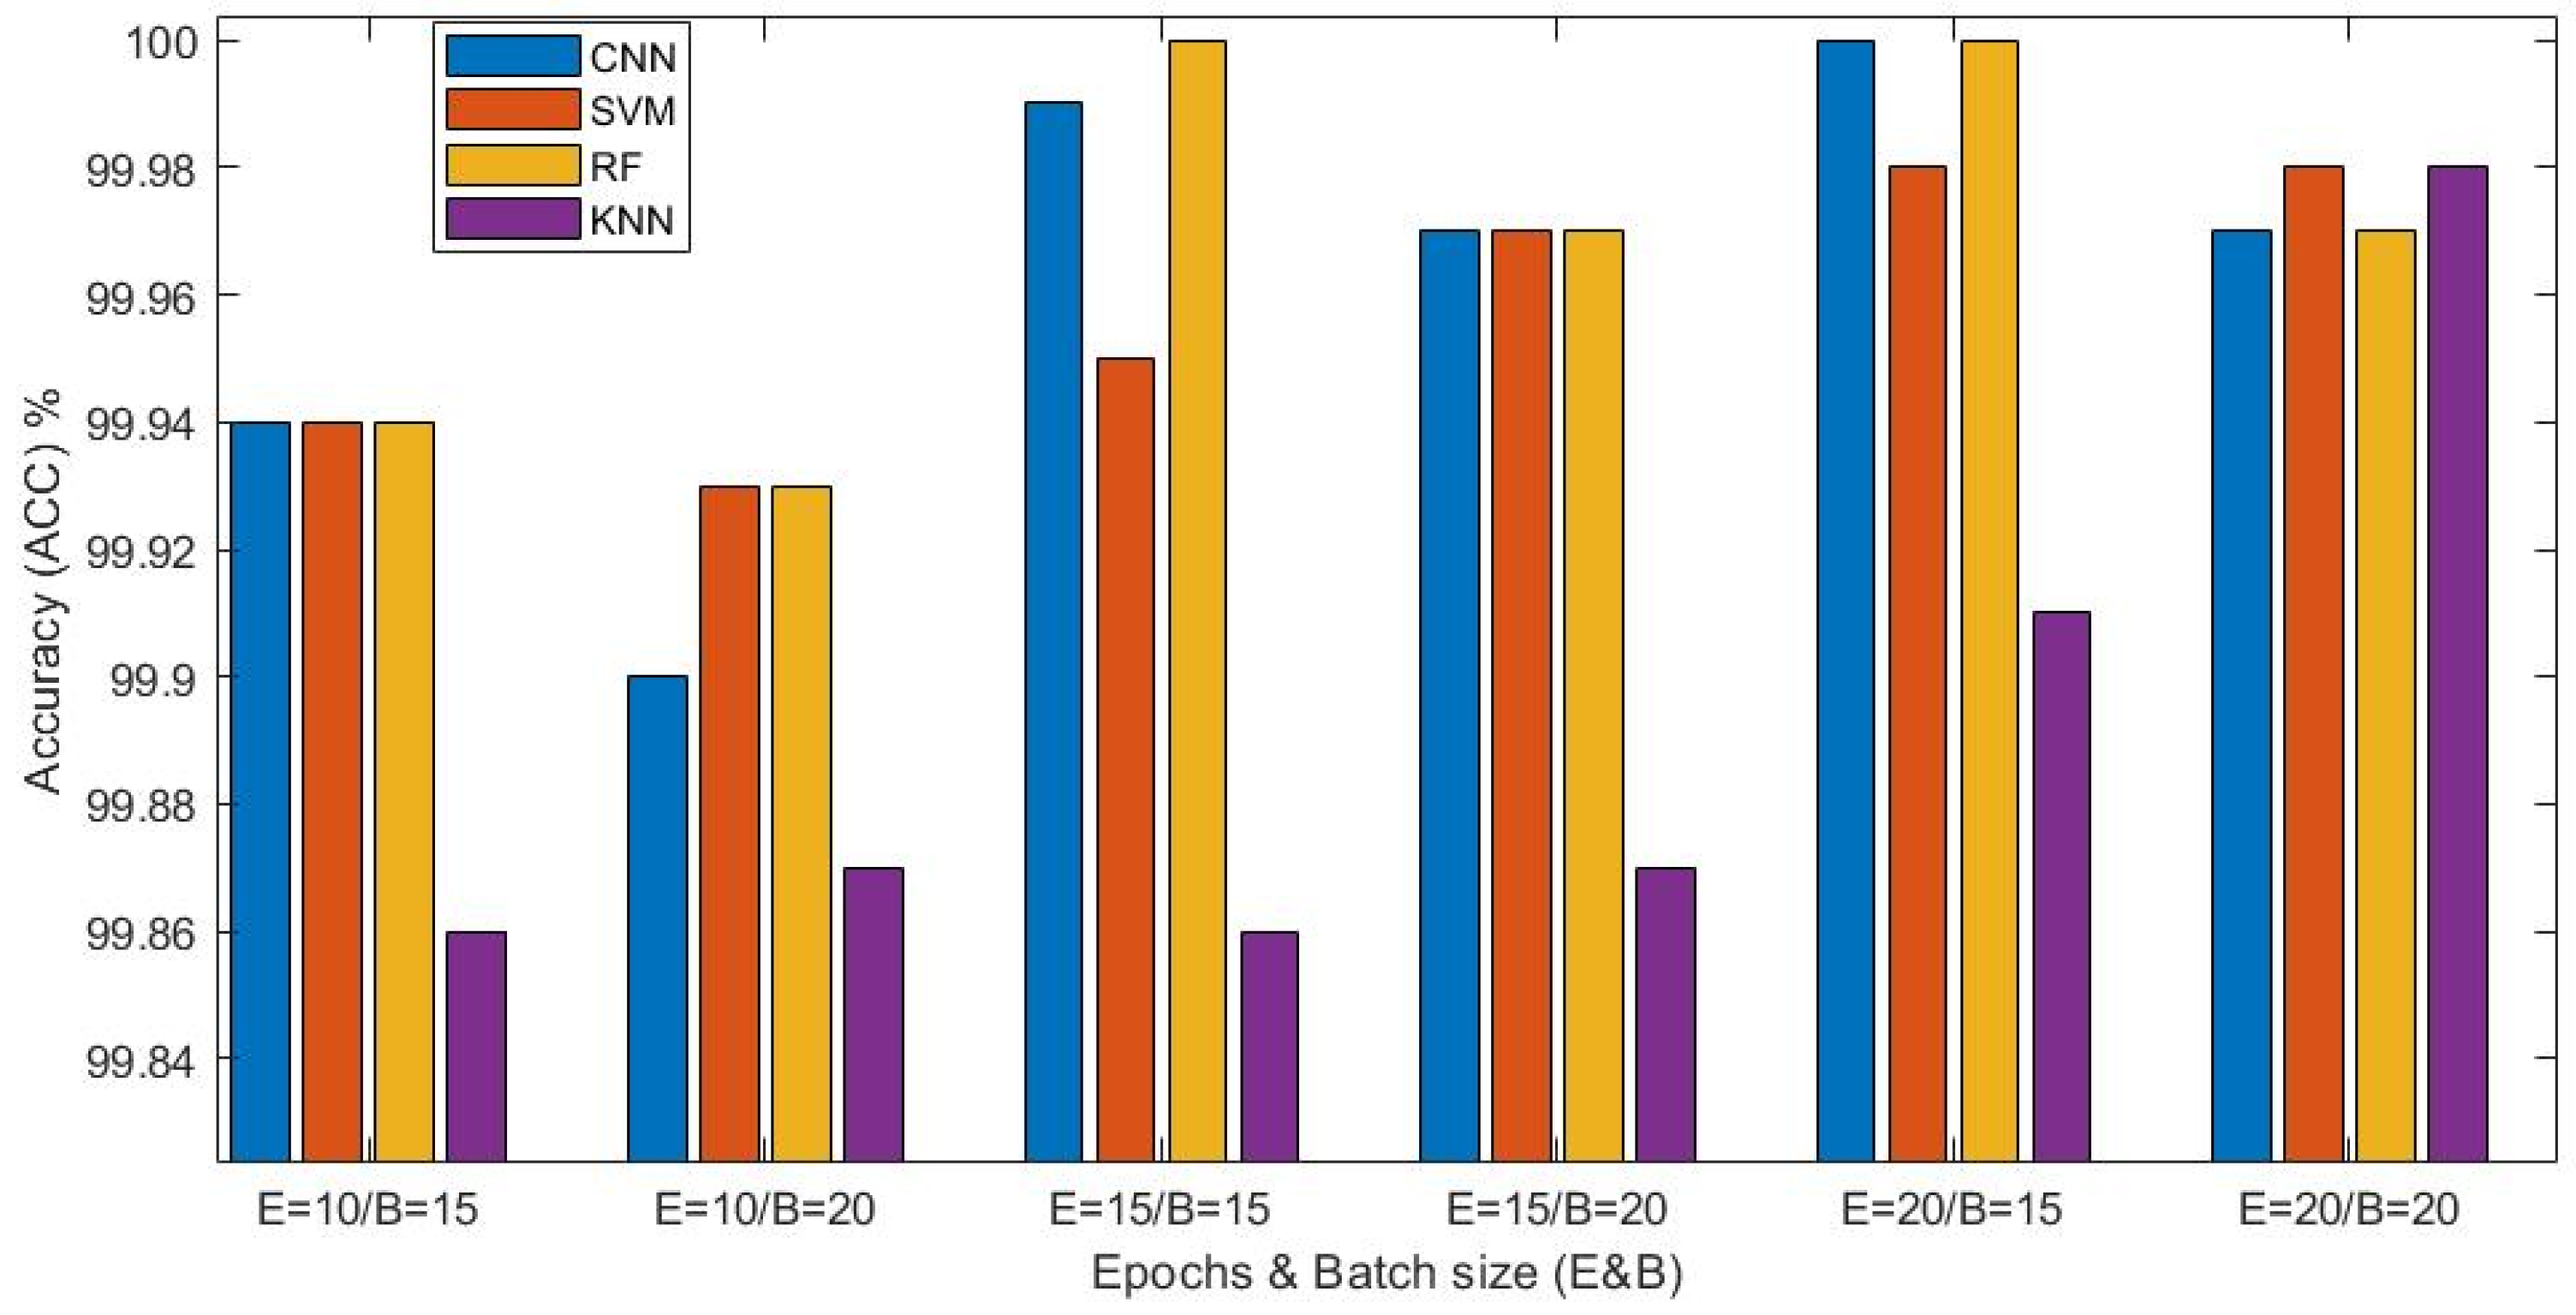
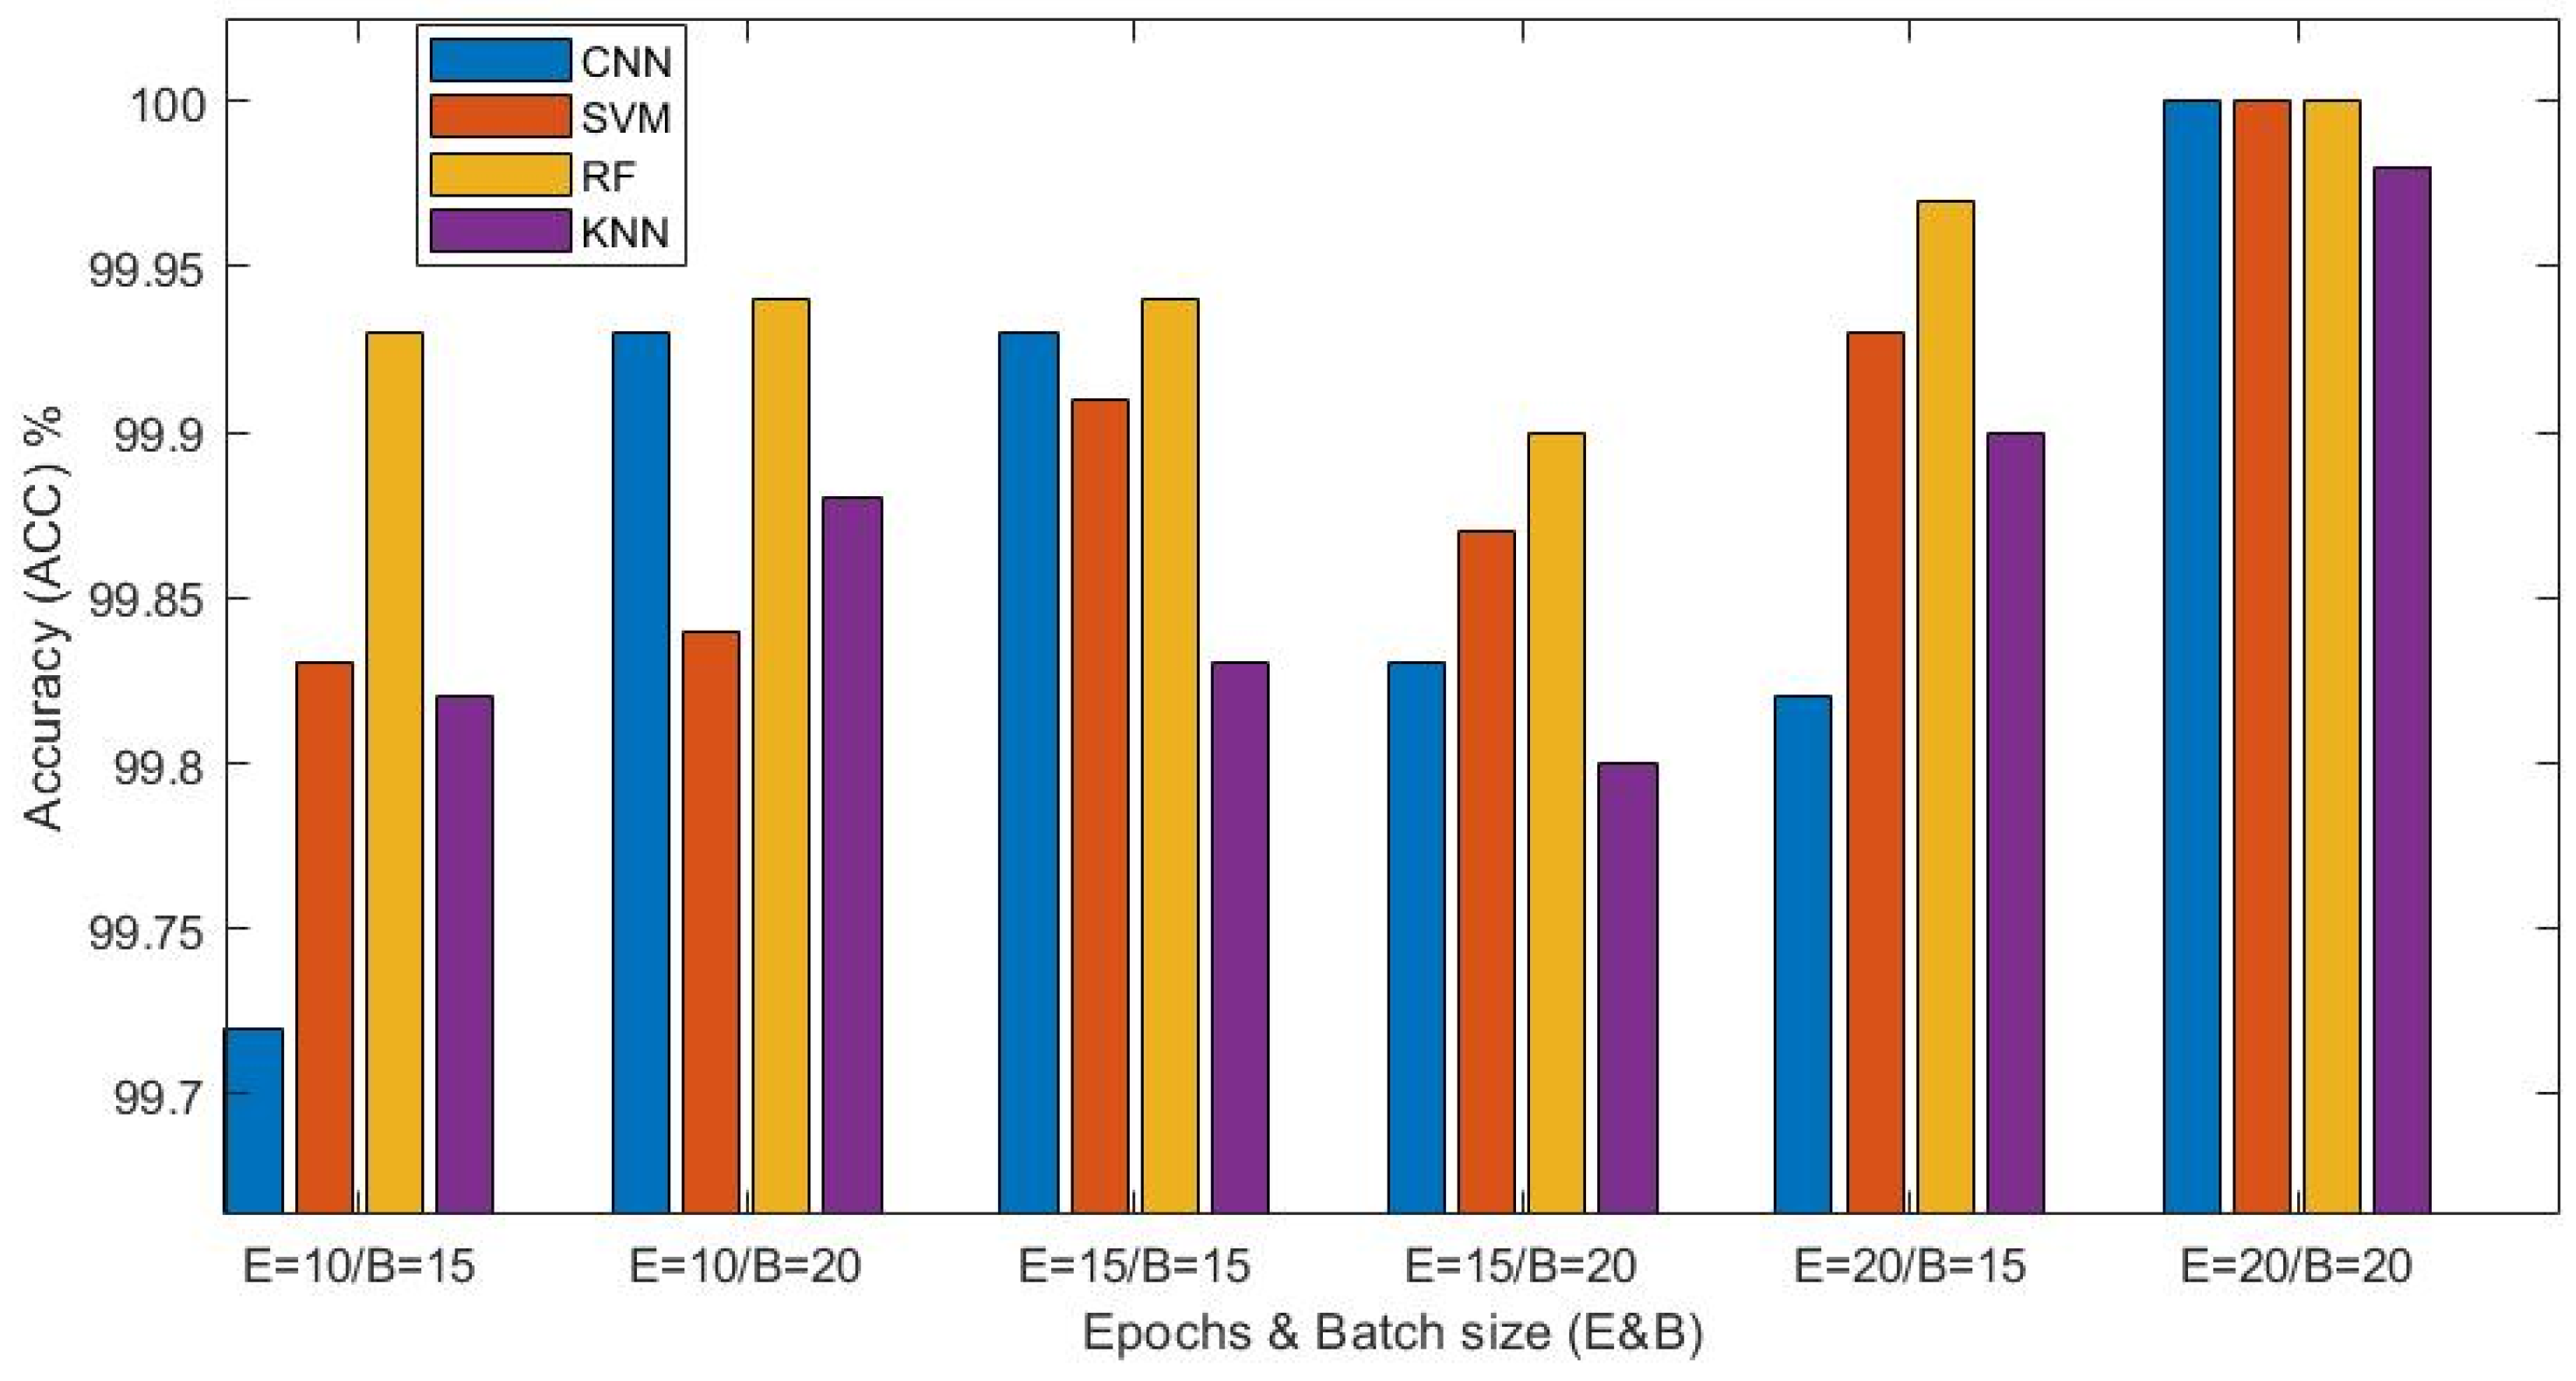
