Article

Design and Implementation of a Self-Supervised Algorithm for Vein Structural Patterns Analysis Using Advanced Unsupervised Techniques

by
Swati Rastogi
1,*,†,
Siddhartha Prakash Duttagupta
2,† and
Anirban Guha
3,†
1
Centre for Research in Nanotechnology & Science, Indian Institute of Technology Bombay, Mumbai 400076, India
2
Department of Electrical Engineering, Indian Institute of Technology Bombay, Mumbai 400076, India
3
Department of Mechanical Engineering, Indian Institute of Technology Bombay, Mumbai 400076, India
*
Author to whom correspondence should be addressed.
All the authors contributed equally to this work.
Mach. Learn. Knowl. Extr. 2024, 6(2), 1193-1209; https://doi.org/10.3390/make6020056
Submission received: 8 May 2024 / Revised: 27 May 2024 / Accepted: 28 May 2024 / Published: 31 May 2024
(This article belongs to the Topic Applications in Image Analysis and Pattern Recognition)

Abstract

:
Compared to other identity verification systems applications, vein patterns have the lowest potential for being used fraudulently. The present research examines the practicability of gathering vascular data from NIR images of veins. In this study, we propose a self-supervision learning algorithm that envisions an automated process to retrieve vascular patterns computationally using unsupervised approaches. This new self-learning algorithm sorts the vascular patterns into clusters and then uses 2D image data to recuperate the extracted vascular patterns linked to NIR templates. Our work incorporates multi-scale filtering followed by multi-scale feature extraction, recognition, identification, and matching. We design the ORC, GPO, and RDM algorithms with these inclusions and finally develop the vascular pattern mining model to visualize the computational retrieval of vascular patterns from NIR imageries. As a result, the developed self-supervised learning algorithm shows a 96.7% accuracy rate utilizing appropriate image quality assessment parameters. In our work, we also contend that we provide strategies that are both theoretically sound and practically efficient for concerns such as how many clusters should be used for specific tasks, which clustering technique should be used, how to set the threshold for single linkage algorithms, and how much data should be excluded as outliers. Consequently, we aim to circumvent Kleinberg’s impossibility while attaining significant clustering to develop a self-supervised learning algorithm using unsupervised methodologies.

1. Introduction

1.1. Relation with Prior Work

Cluster analysis holds significant importance in the realm of data mining. Objects are organized into clusters, and individuals are grouped together. In contrast to other mining techniques, clustering has the ability to classify data without any prior knowledge. Zhai et al. [1] discussed various types of clustering algorithms that can be categorized based on the partitioning, density, and model. When working on a clustering task, the objective is to bring the objects within each cluster as close together as possible. The first cluster tends to be a sample or data point. However, the unpredictability of selecting the center point in a sample often prevents cluster aggregation from reaching a stable state as per Ran et al. [2]. Cluster analysis relies on identifying similarities within datasets, a key aspect of unsupervised learning. In our work, we perform vascular pattern mining and analysis, and propose a self-supervision learning algorithm to computationally retrieve vascular patterns in an automated manner from NIR templates.
The methods used to cluster images generally rely on measuring distance or dissimilarity, e.g., the tethering technique employs Euclidean distance inside a specified feature set, such as pixels or gradients, particularly in the context of photographs. Selecting a feature space is sometimes delegated to the end user as a detail tailored to the application. Choosing the appropriate feature space is essential since using Euclidean distance for clustering on raw pixels is ineffective for small datasets. Therefore, the CNN capabilities are helpful. In their study, Gupta et al. [3] described a variational method that combines improved vein data from line tracking with multi-scale matched screening. The suggested method achieved an EER of 4.47% when tested on the index and middle finger variants utilizing the HKPU database.
Clustering algorithms involve the partitioning of a physical or abstract object into a group of similar objects. A cluster consists of a group of data objects, where the objects within the same cluster exhibit similarities and are distinct from objects in other clusters, according to Sun et al. in [4]. Following this concept, Jalilian et al. [5] used three FCN based on the U-Net network to extract finger vein patterns from input images. The Singular Value Decomposition method was used to extract details, while a local full binary sequence was used to remove any incorrect pairings. In contrast to the models used in the above-mentioned literature, Zhang et al. [6] utilized the ResNet model to investigate the vascular verification system. CNN-based methodologies may provide favorable outcomes when a well-constructed network is trained. However, a prevalent study limitation is the need for meticulous parameter optimization due to the chosen methodology. In addition, there is a notable disparity between vein images and natural images regarding image quality. Consequently, there is a significant need for further study to improve CNN-based vein identification algorithms.
Jun Wang et al. [7] introduced a detection system for identifying dorsal hand veins in the literature. The method is based on a task-specific SCF model. Based on VGG-16 [8] for fingerprint and vein biometric verification, Houjun et al. [9] used CNN by combining two templates to make a better network that can take in two-channel images. However, the research gap pertains to the challenge of applying the model to small-scale image identification tasks, specifically in the context of vein detection. Training the model directly on a small-scale database leads to overfitting during the training phase.
Rastogi et al. [10] used the NIR palm vein to determine the methodology for extracting and verifying palm vein patterns, explicitly focusing on the LPB approach. This technique highlights a deficiency in the research: the obtained characteristics of the suggested approach are not resistant to variations in image intensity, particularly in “flat” areas. The disparities in intensity are minimal and significantly affected by image noise within uniform regions. The strategy outlined in this method is enhanced by using a collection of Gabor filters, image denoising, intensity gradient filtering, and several machine learning classifiers and algorithms [11]. This approach decreases the probability of incorrect identification while detecting NIR palm vein patterns. The research gap, however, involves the inability to detect veins at high intensities.

1.2. Our Work and Contribution

The UML feature map for clustering has received less attention as discussed with the issues and gaps elaborated in Section 1. Current research is motivated primarily by recent studies on UML techniques for vascular pattern mining and image analysis. These studies have shown that enhanced specifications have resulted in notable advancements in performance testing. A wide range of works in the literature have been identified that explore recognizing vascular patterns through different types of supervised learning. In contrast, our study focuses on designing and developing novel algorithms that employ an unsupervised approach to retrieving vascular patterns from NIR imaging data computationally. In addition, some application domains may need additional baselines to obtain precise labeling. Therefore, acquiring a satisfactory depiction of vein patterns from imperfectly accurate “real data” continues to pose a difficulty in vein segmentation. This prompts us to explore the development of a more resilient learning methodology to verify veins in real-world scenarios.
Considering the aforementioned shortcomings, the current study explores the unsupervised learning clustering technique to mine out the NIR vein pattern and attempts to address the following question: Can we solve for vascular image data feature mapping in clusters to mine out patterns associated with a 2D image data-driven technique?
Clustering is a fundamental statistical modeling and visualization technique intensively investigated through UML from many viewpoints: “How many clusters? How can numerous instances be efficiently grouped into clusters? How should clusters be validated?” Several distance functions and embedding methodologies have been studied. On the other hand, the UML feature map for clustering has received less attention. Improved specifications have contributed to significant improvements in the performance test results. The ongoing research on UML vein pattern image analysis techniques motivated us to design and develop a self-supervised learning system using unsupervised methods to extract the NIR vein pattern excavation.
The current research makes the following contributions:
  • The vascular visualization technique is proposed by employing logarithmic dependency to solve UML constraints to construct an algorithm that compares and validates NIR vascular patterns with the database.
  • The proposed GPO algorithm calculates feature orientation and correlation to quantify the similarity between registered and analyzed patterns.
  • Proposing an RDM algorithm that generates the soft focus representation of vein patterns.
As a result, preprocessing is needed at this point (more on preprocessing and ROI segmentation in Section 4.1). This includes changes like size, intensity, rotation, and translation. Following that, an ROI is typically taken from the enhanced image, from which characteristics are derived. Table 1 categorizes the feature extraction methods for vascular authentication from the previous state of the art.
In the current research, we implement a combination (see Figure 1) of geometrical and subspace learning-based feature extraction techniques. As studied in the literature, these techniques can obtain information on topological features that are not just limited to vein extraction. They can also obtain information on vein terminals, intersections, and examples of quantitative learning elements.
Following our study and analysis, Section 1 examines fundamental methodologies for contrasting clustering algorithms. Section 2 justifies the experimental strategy used in this study and the findings. The concepts involved in vein pattern identification are provided in this section. Section 3 gives a detailed description of the developed algorithms, results found, their limitations, and discussion. The image quality evaluation is described in Section 4, and Section 5 concludes with remarks and suggestions for future research on this issue.

2. Experimental Setup

2.1. Preprocessing

To begin research and analysis, we make use of four datasets. The first is “CASIA multi-spectral Palmprint Image DatabaseVl.O (CASIA database)” [12]. The second is the “VERA database”: “The research in this paper used the VERA PalmVein dataset made available by Idiap Research Institute, Martigny, Switzerland” [13]. The third dataset used is “The HongKong Polytechnic University Finger Image database (Version1.0)” known as “HKPolyU” database. The last dataset used is “FV-SUM” [14].
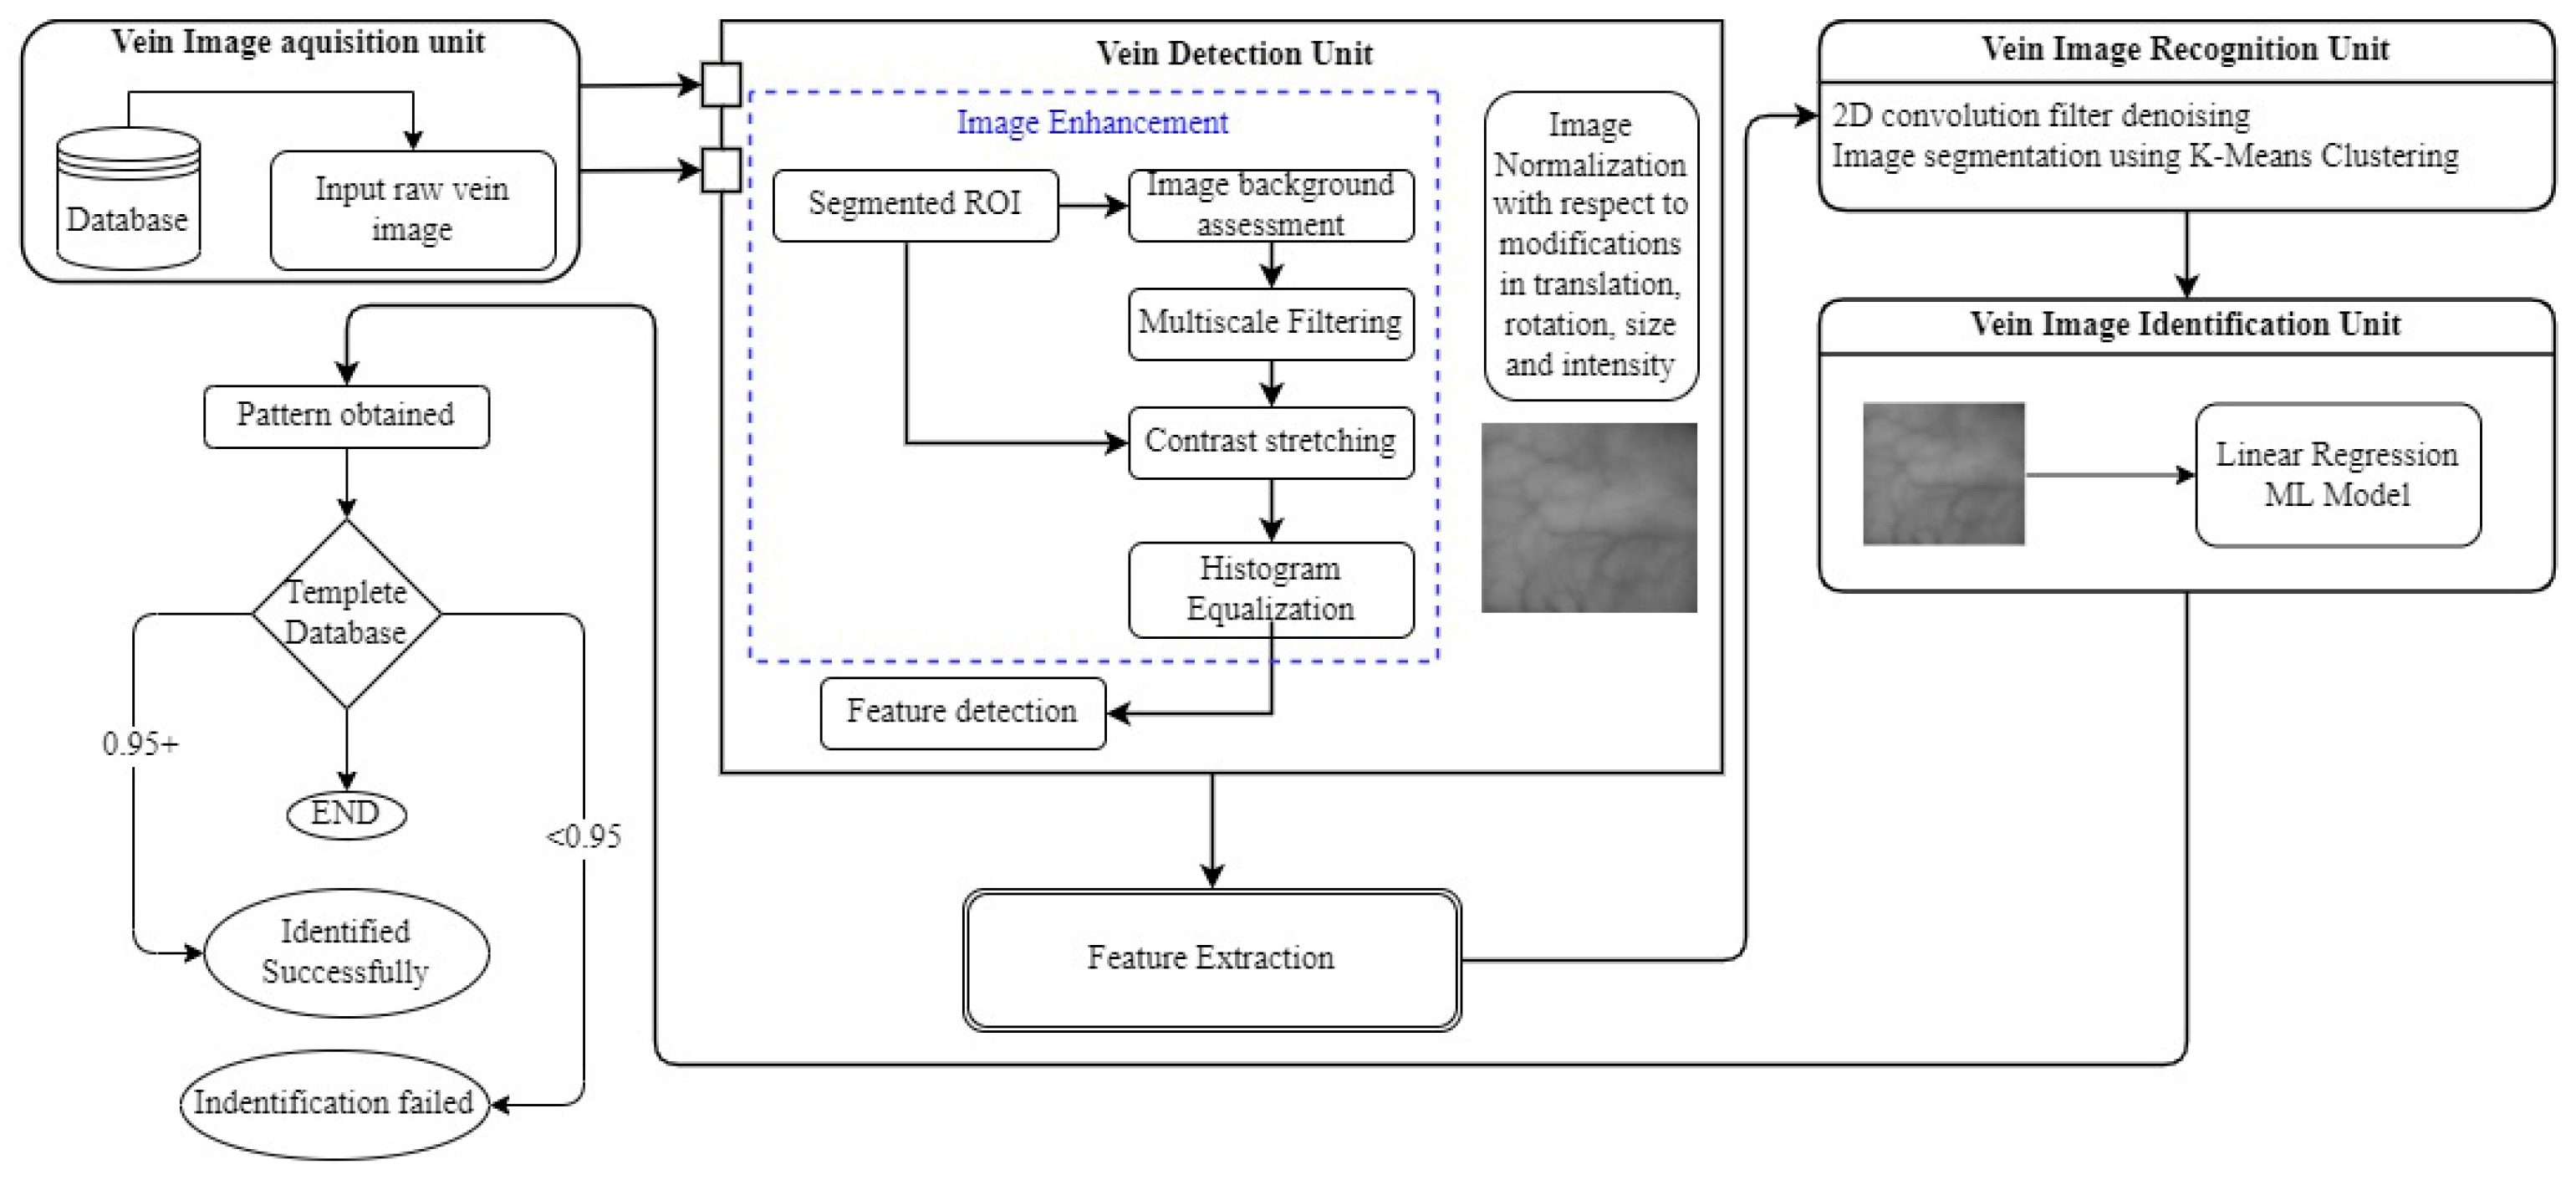
The flowchart in Figure 1 provides an overview of a multi-unit venous image identification system. First, a database contains raw vein images that the Vein Image Acquisition Unit retrieves. The area of interest (ROI) is then segmented [10,11] and improved in the Vein Detection Unit by means of image background evaluation, mythical filtering, contrast stretching, and histogram equalization. Better feature detection is made possible by these processes improving the image quality. Feature extraction occurs after image enhancement and normalization to take the translation, rotation, size, and intensity fluctuations into consideration.
The processed image then passes on to the Vein Image Recognition Unit, where it successfully isolates vein patterns by 2D convolution filter denoising and segmentation using K-Means clustering. The Vein Image Identification Unit uses a linear regression machine learning model as the last stage to determine the vein pattern. The pattern found is next checked against a template database. The identification is termed successful if the similarity score is 0.95 or greater; if not, it fails.
The flowchart in Figure 1 shows how to recognize vein patterns methodically by integrating machine learning with sophisticated image-processing methods. Every component of the system is essential to turning an unprocessed image into a recognizable pattern, providing great accuracy in the recognition procedure.
In this section, the input raw vein image is subjected to noise detection using NMD and denoising [15]. The resulting image is grayscaled and binarized using the Otsu binarization method. This is significant since the global threshold value is derived from the image histogram. Contouring is used to collect the most distinctive and relevant data after the binary image has been denoised and grayscaled. This technique utilizes many distinct implementations to discover the essential, critical point. Segmenting ROI is elucidated in Figure 2, which explains that the current work offers extraction of ROI in the following steps: (a) Otsu binarization, (b) image contour generation, (c) focal key-point detection, (d) coordination structure, and (e) normalization.

2.2. UML Settings

ERM is the most basic method for UML. It involves picking the unsupervised algorithm from a family F that has the lowest empirical error on the training set also written as E R M F ( T t r ). The following proof implies a logarithmic dependency on | F | and aids in solving interesting UML issues in the current study.
Let us say that the learning class is made up of universe ν and label ρ . It is also limited by the loss function, which is also called the error function and measures the difference between the expected results and the actual target values, shown in (1) [16],
ψ : ρ × ρ [ 0 , 1 ]
where ψ ( x , y ) is the loss that predicts Z when the actual label is y.
A learner is something used to train a model from data. A learner L, given in (2) [16]
L : ( ν × ρ ) * ρ ν
takes a training set T t r = [ ( x 1 , y 1 ) , , ( x n , y n ) ] comprised of a finite range of image specimens from μ and outputs a classifier as in (3),
L ( T t r ) ρ ν
where ρ ν is a set of functions from ν and ρ .
The classifier loss is computationally practical loss functions that stand for the cost of inaccurate classification problem predictions. Here, classifier loss c ρ ν is given as (4) [16],
ψ μ ( c ) = E ( x , y ) μ [ ψ ( y , c ( x ) ]
and predicted loss, i.e., the total of all potential losses times the likelihood that such a loss will happen is the expected loss, of L is (5)
ψ μ ( L ) = E T t r μ n [ ψ μ ( L ( T t r ) ) ]
Learning is associated with a concept class. Thus, for every finite class F of the UML algorithm, any distribution over the matter X, Y, and  n 1 and δ > 0 is (6) [16]
Pr T t r μ n ψ μ ( E R M μ ( T t r ) min F μ ( F ) + 2 n log | u | δ 1 δ
E R M μ ( T t r ) arg min F μ ( X , Y ) T t r ψ ( Y , U ( X ) )
where (7) [16] is any empirical loss minimizer over U F .

2.3. Selecting the Number of Clusters

For each dataset X, consider there to be n possible clustering algorithms, or parameter settings C 1 ( X ) , , C n ( X ) . These could be acquired from n distinct clustering techniques, or they might reflect the k issue, i.e., how many clusters to arrange from a single clustering algorithm where the parameter determines the number of clusters to k [ 2 , 3 , , n + 1 ] .
To learn, choose the best C j ( X ) on a problem-by-problem basis. Suppose we have problem features ϕ ( X ) ϕ such as the number of dimensions, number of points, domain (text, vision, etc.), and cluster features (see (8)),
γ ( C j ( X ) ) Γ
and this may include multiple clusters, the mean distance to the cluster center, and the SC [16].
SC for a particular clustering method C is defined as Euclidean clustering as (9):
S C = 1 | C | x C b ( x ) a ( x ) max [ a ( x ) , b ( x ) ]
where a(x) denotes the average distance between point x and other points in its cluster, and b(x) denotes the average distance between x and points in the closest alternative cluster.
In this section, we will show how, given any set of issue data characteristics and cluster-specific attributes, choosing the appropriate approach is a classification problem. However, the present problem for the k-schema would suggest using the same number of clusters across all concerns, which is analogous to choosing the best single class for classification.
To understand how to select the best C j ( X ) for each problem, consider the following: problem features X such as numerous dimensions, the number of points, the domain, and cluster features C j ( X ) such as the number of clusters, mean distance to cluster center, and SC [17].
Assume we also have a family f of functions in (10):
f : ϕ × Γ m 1 , 2 , , m
which determines the clustering based on features as in (11) (any multi-class classification family may be used for this):
arg min f F i l Y i , , C f ( ϕ ( X i ) , γ ( C 1 ( X i ) ) , , γ ( C m ( X i ) )
This preceding E R M F reduces the challenge of choosing C j ( X ) from X to the question of multi-class classified features-based ϕ ( X ) and γ ( C 1 ( X ) ) , , ( C m ( X ) ) and loss as defined in (6). The ERM concept of selecting the “perfect” f will be empirically efficient if a predetermined value of b-bit integers can parameterize F. An approximation minimizer may be employed if the E R M F cannot be calculated precisely within the time restrictions.

3. Designing of Self-Supervision Learning Algorithm

3.1. The Proposed ORC Algorithm

Here, we introduce ORC in the proposed SSA. Previous research studies [5,6,7,8,9,14,18,19] have shown that UML K-Mean is very susceptible to outliers O and tends to produce local optimal centroids. Including an outlier removal strategy in every iteration of the clustering process makes it possible to obtain outcomes even when dealing with datasets that include many outliers. This ensures that locations far from the cluster centroid do not impact the centroid calculation. To keep things simple, we investigate learning a single hyper-parameter of the fraction of outlier samples to delete.
Algorithm 1 is the proposed ORC, while Figure 3a shows the original and normalized data. Our technique (95% confidence intervals) is compared to traditional clustering baselines. Given enough training problems, our method outperforms the best baseline algorithms by more than 5%. It is important to note that ARI is a powerful performance indicator because it compensates for chance and can even be negative. Furthermore, the best potential value of ARI as determined by executing the optimum procedure for each dataset was about 0.16, making this improvement outstanding, Figure 3b shows that the outlier removal yields much better outcomes. Removing 1% of the interpretations as outliers significantly increases the ARI score. Surprisingly, above 1% reduces performance to that before outlier elimination. Rationally, our system intuitively determines the appropriate amount (1%).    
Algorithm 1: Proposed ORC algorithm.
    Require: 
Classification training problem
    Ensure: 
Centroid computation
      1:
The classification cases for training problems are
X i R d i × m i and Y i ( 1 , 2 , 3 , , k i ) m i
      2:
With method C, some parameter ζ
      3:
Define- C ζ : o n d a t a   x 1 , x 2 , x 3 , . . . , x n R d
      4:
Estimate the data mean,
μ = 1 n Σ i ( x i )
      5:
Set aside the proportion of samples: x i is the furthest from μ
      6:
Euclidean distance as outliers ζ ,
      7:
Cluster the data with outliers removed using C, and assign each outlier to the nearest cluster center
      8:
END
In our method, the algorithm produces the highest estimated ARI as a function of the SC [5] and k. We assess using the same 90 dataset clustering as the baseline. In this experiment, we employ basic linear regression to estimate ARI. All of the data from the training set in the partition related to k are used to train ARI as a linear function of SC. Each dataset in the training set has 10 target values corresponding to different runs, where the number of clusters is fixed at k.
Thus, to illustrate, let there be a method C (e.g., K-means clustering [20]). Choosing the parameter ζ that represents the proportion of outliers to disregard during fitting, define C ζ with parameter ζ [ 0 , 1 ) on data x 1 , . . . , x n R d . To maximize performance, we may select the best ζ . The outlier-removal method may be directly modified to eliminate a variable proportion of outliers from each test dataset. The approach may be thought of as assigning weights to points in a test set of size l, where each of the o outlier points, based on the learned threshold ζ is assigned weight ’zero’, while all other points share the equal weight.
This difficult arrangement might be eased to produce a distribution in which the weights are readjusted to award a low but non-zero mass to the outlier points o. The weights are then used in methods like the weighted K-means algorithm, which arranges the points into clusters and a collection of noisy or outlier points.

3.2. Proposed GPO Algorithm for Visualization

The alignment of the distinctive vein characteristics is determined in this section. The orientation image, which represents the characteristics of vascular images, represents them. The localized feature orientation specifies the invariant coordinates of ridges and furrows.
Algorithm 2, which we name GPO, depicts the primary phase of the technique for estimating feature orientation. The correlation technique is employed to measure the similarity between the registered and tester images. Alternatively, simple distance-matching metrics, such as the Hausdorff distance, are employed. In the vein recognition investigation, backpropagation neural networks, Radial Basis Function Neural Networks, and Probabilistic Neural Networks are used as classifiers.
Algorithm 2: Proposed GPO algorithm.
    Require: 
img: Normalized vein image
    Ensure: 
Local Ridges Position for  ω × ω  do
         
end
         
Kernels divided from normalized image;
         
applying the Sobel kernel filtration method in different axis to determine the magnitude variations;
         
while Define do
         
end
1:   | G ( i , j ) | = ( G x ( i , j ) ) 2 + ( G y ( i , j ) ) 2
and estimate the data mean;
      2:
Estimated magnitude: | G ( i , j ) | = | G x ( i , j ) | + | G y ( i , j ) |
taking reference of below equations
e x ( i , j ) = u = i w 2 v = i + w 2 m = i w 2 n = j + w 2 2 G x ( m , n ) 2 G y ( m , n )
e y ( i , j ) = u = i w 2 v = i + w 2 m = i w 2 n = j + w 2 G x 2 ( m , n ) G y 2 ( m , n )
θ ( i , j ) = 1 2 arctan e y ( i , j ) e x ( i , j )
      3:
Converting img into continuous vector field
ϕ x ( a , b ) = cos 2 θ ( i , j ) a n d ϕ y ( a , b ) = cos 2 θ ( i , j )
      4:
Computing the direction of localized ridges for each point (x, y) using:
δ ( x , y ) = 1 2 tan ϕ x ( a , b ) ϕ y ( a , b )
where θ ( i , j ) is the angular direction represented by the Least Square Estimation

3.3. The RDM Algorithm

It is necessary to extract the most essential and valuable information from the vein for detection. First, we identify and use extracted ROI (see Figure 2). To improve the imaging contrast, gamma correction [18] is initially performed. We test several well-known image-enhancing methods to bring out the intricacy of the input vascular ridge pattern (see Figure 4. Although these approaches are practical for sharpening imagery, the noise parts are over-emphasized. As a result, the proposed LRE [21] technique produces a sharper image without exaggerating the noise. This approach determines which portions of the image have critical lines and ridge patterns and then enhances just those areas. To mine out the vein structures in an image, the suggested LRE approach employs an “RDM algorithm” (see Figure 4).
To generate a soft-focus representation of an image m(x, y), LRE first applies an LPF l(x, y) to the original image, i(x, y) as illustrated in Figure 5 and represented in (12):
m ( x , y ) = l ( x , y ) × i ( x , y )
In this study, we use a Gaussian filter with kernel size 5 × 5, followed by an HPF h(x, y) to detect the ridge in an image as represented in (13):
m ( x , y ) = h ( x , y ) × m ( x , y )
Only the edges of the predominant ridges M′(x, y) are presented since the relatively insignificant ridge patterns have been “filtered”.
Further, the Laplacian filter is used as the HPF, and M′(x, y) at this stage displays the boundaries of the primary ridge structure (see Figure 6). We binarize M′ using a threshold value (x, y). Certain morphological operators are also used to eliminate undesirable noise zones. The detailed structure is labeled “mask”, and it identifies the location of the strong ridge pattern. We “overlay” M′(x, y) on I(x, y) to improve the ridge region (x, y) as in (14):
I ( x , y ) = c · I ( x , y ) i f M ( x , y ) = 1 I ( x , y ) o t h e r w i s e
where I′(x, y) is the augmented image and “c” is the “intensity coefficient” used to emphasize and recognize the ridge area. The more intense the ridge pattern, the lower the value of c (i.e., the darker the area will be).
The value of “c” is experimentally established at 0.9. We want to mention that additional permutations may be incorporated to determine alternative values for “c” to demonstrate the distinct ridge sections based on their strength levels. For instance, gray-level dicing could allocate a more considerable weight, “c”, to the more robust ridge pattern and inversely. We do not perform this additional step because of the computational overhead (computation time is critical for an online application). Figure 4 depicts many instances of contrast enhancement results in the vein image, while Figure 5 depicts the enhanced image.
The vein pattern feature recognition using various ML approaches is described in Section 2 and Section 3. The following section demonstrates how the image is processed to extract the characteristics required to recognize the feature/pattern. The first step in this experiment is to denoise the image using a 2D convolution filter. Convolution is the numerical activity between two functions that creates a third function. Image processing refers to every pixel performing a calculation with its neighbors. The kernels will characterize the convolution’s size, weights, and anchor point, usually at the center. With this denoising, an algorithm convolves the kernel with an image.
In this study, a kernel size of 25 × 25 is considered. The resultant 2D convolution-filtered image is obtained from the vein pattern detected as found in Section 3. Figure 6 elucidates the 2D convolution filter denoising. Image segmentation splits an image into numerous areas (or segments) to change an image’s portrayal into more essential data. Current research discloses the UML image segmentation techniques employed on various datasets. This is the most basic and widely used iterative UML method.
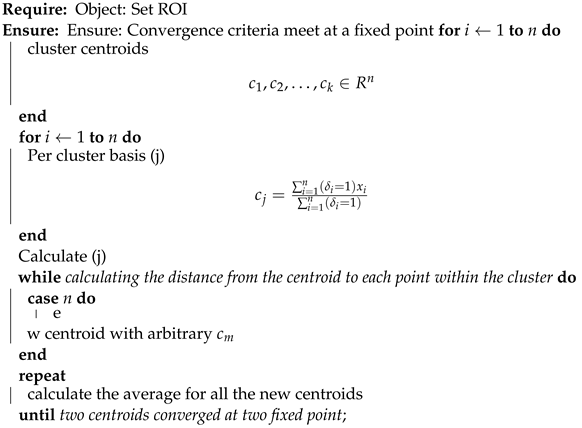
In this technique, we randomly initialize the K number of centroids in the data (the number of k is determined using the elbow method) and iterate these centroids until the position of the centroid does not change. To better understand, Algorithm 3 explains the steps involved in the experimentation of UML clustering. These points are chosen so that the summation of distances between test data and their corresponding centroids is minimal, or the sum of distances between them is minimal. The maximum number of iterations permitted is 500, and the epsilon value is 1. This robust UML algorithm expects to partition N observations into an n number of clusters, where every observation must be placed with the group with the closest mean. A cluster alludes to an assortment of information accumulated based on specific similarities. The image obtained (from Figure 6a) is subjected to image segmentation for the clusters at K = 10, 15, and 20 as shown in Figure 6.    
Algorithm 3: UML K-means pseudoalgo model.
Make 06 00056 i001

4. Results and Discussion

4.1. Computational Retrieval of Vascular Pattern: The Mining Model

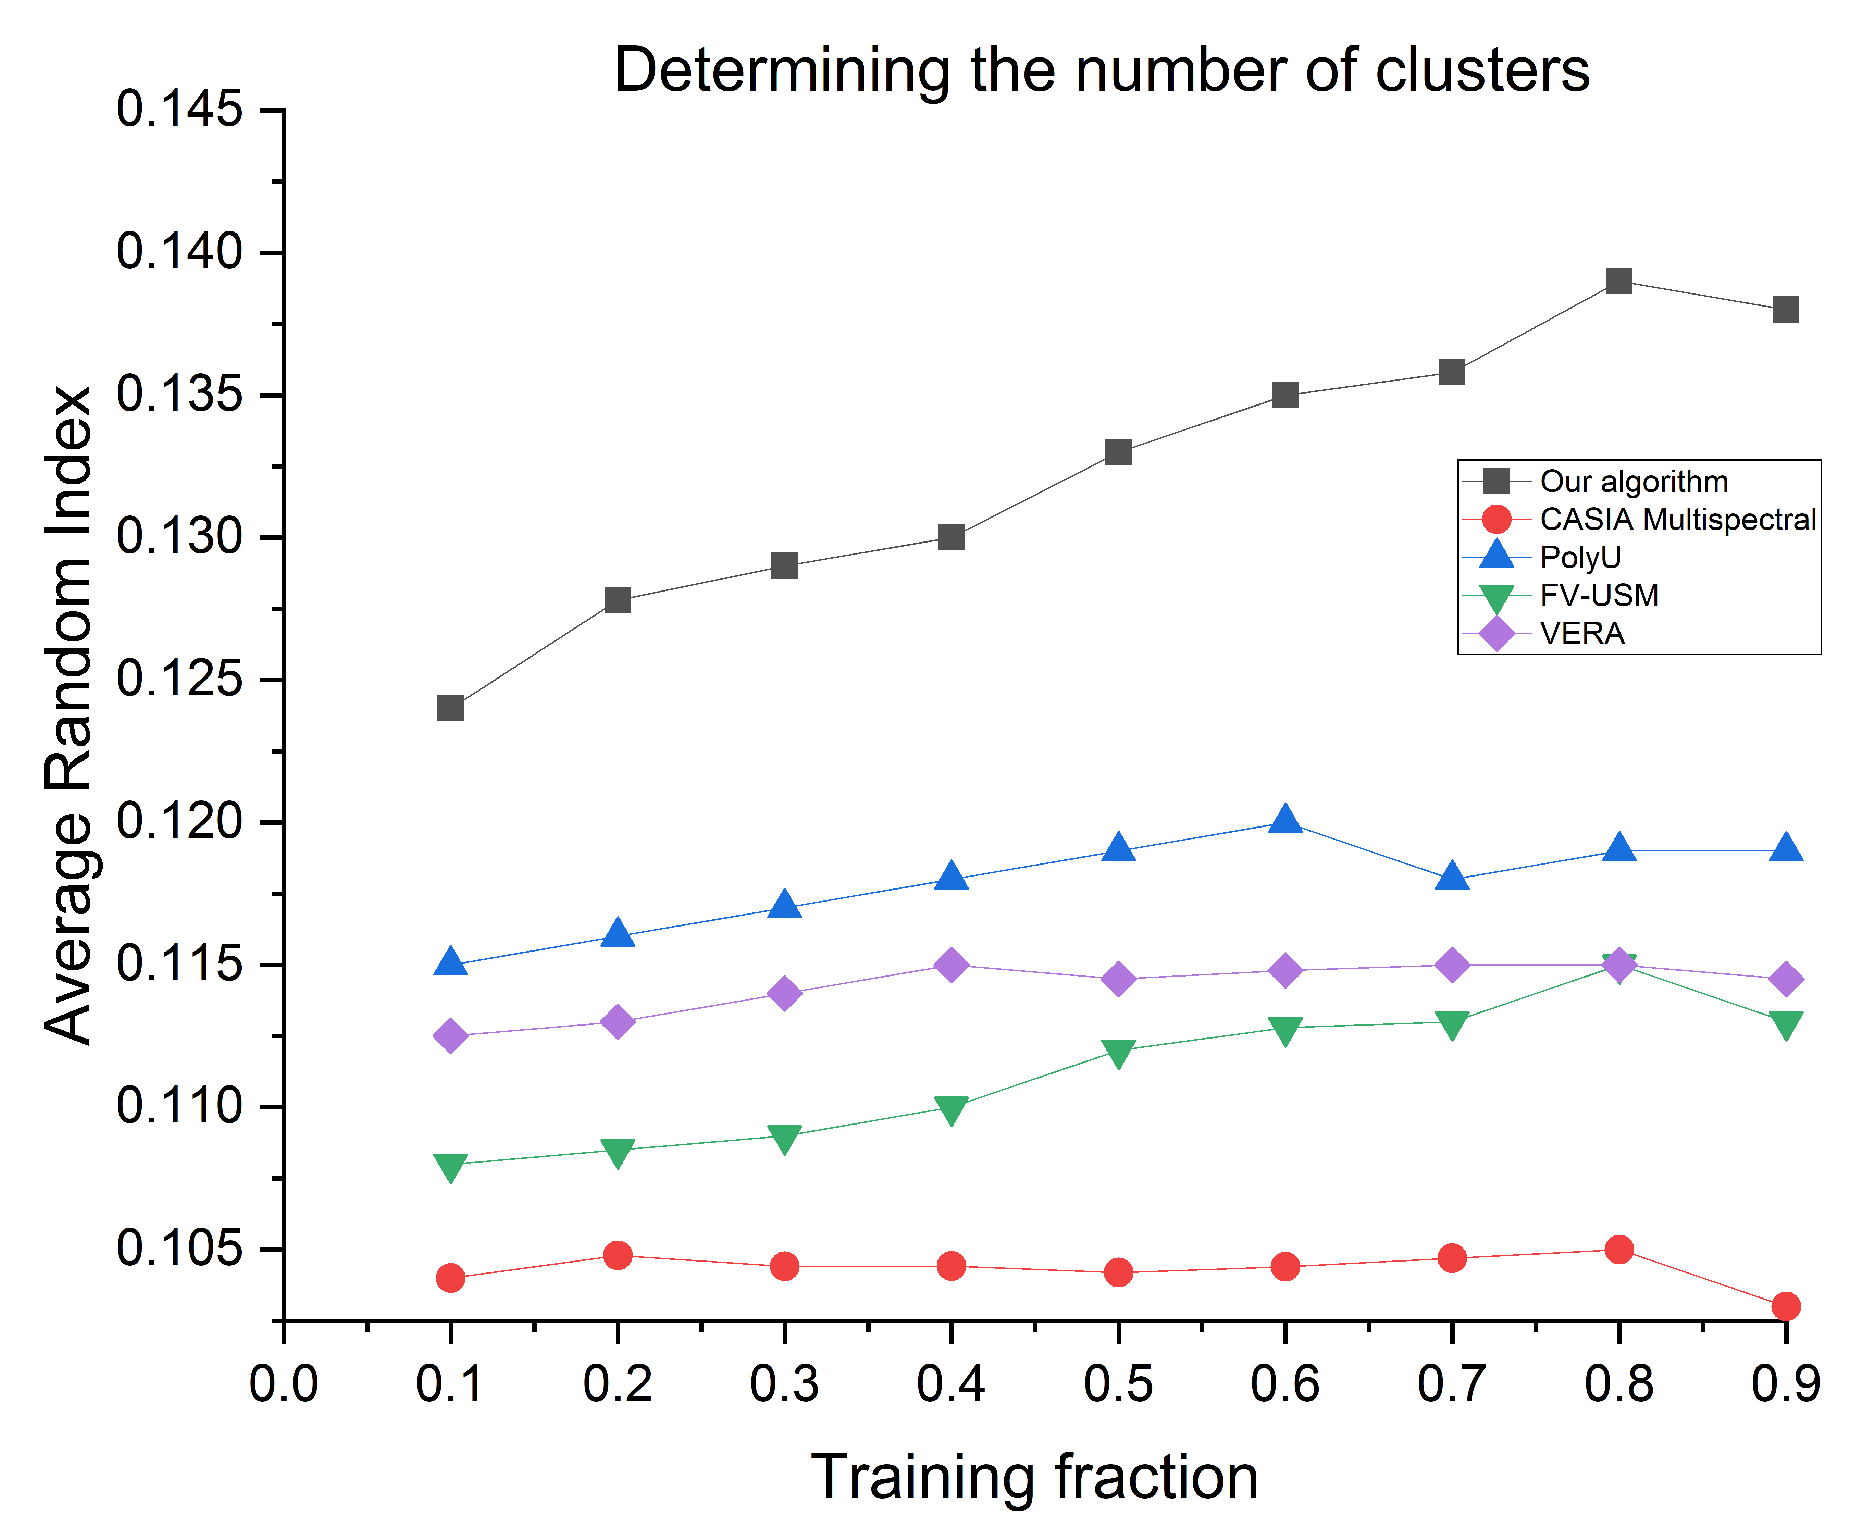
In this section, we define the K-means clustering approach and calculate the number of clusters k, which can range from 2 to 20. First, we investigate traditional heuristics for the baseline choice of k: for each cluster size k and dataset, we form ten clusters for K-means from various random starting points and choose the one with the best SC among the ten. Then, among the nine unique k selections, we choose the one with the highest SC, resulting in the clustering with the highest SC of all 90 clustering for the desired datasets as the baseline. The ARI scores of the UML approach and the baseline for determining the number of clusters are presented vs. the proportion of problems used for training in Figure 7.
Algorithm 4 demonstrates how to link and optimize a vascular line in a specific region. Identifying recognizable proof is a one-to-many cycle that endeavors to group an imprint into a subject. The algorithms separate the entity classes from the feature extraction after image denoising and segmentation. So, the most helpful vein entity in the image was picked out based on previous research. This completes the second step of the proposed self-supervision learning algorithm experiment for vein recognition. Processing an image is essential for identification, which serves as the foundation for the vein pattern filtration model, also known as the optimization phase in this study.    
Algorithm 4: Vascular pattern visualization mining model.
    Require: 
image (img): localized vein image,
α h m a s k h e i g h t
α w m a s k w i d t h
    Ensure: 
centroid computation
      1:
Extraction of image size is required for the initialization
α = z e r o s ( α h a n d α w )
      2:
Creating pre-treatment filtering α for post-processing:
α = 1 h e i g h t / 2 α = 1 h e i g h t / 2 n α = 1 ; o t h e r w i s e
      3:
By adjusting the α , size x and y, filter kernel, β , is created for σ = 1 :
β = 1 2 π σ e x 2 + y 2 2 σ 2
      4:
Image filtering ( ϕ i )
ϕ i = c o n v ( i m g , β )
      5:
Use curvature technique to determine vein curves
      6:
Extricate x, y, z through the coordinate system
      7:
Applying line tracking Algorithm 1 to track veins
      8:
To each kernel size n × n , using the pattern orientation algorithm (including Algorithms 2 and 3)
      9:
Any unneeded pixels in the binary image should be eliminated
In the current section, feature matching or identification, samples with obscure marks are alluded to as the samples, utilizing the vascular images known as preparing tests. A touchless vein pattern is detected and recognized through procedures outlined in Section 3, respectively, utilizing the k-means cluster UML algorithm for pattern recognition as a non-parametric technique. Within this subsection, the linear regression model uses 80% of the data for training, and the remaining 20% is used for testing. The images taken from all four datasets individually are grouped into a few cohesive clusters, making this study an unsupervised problem.
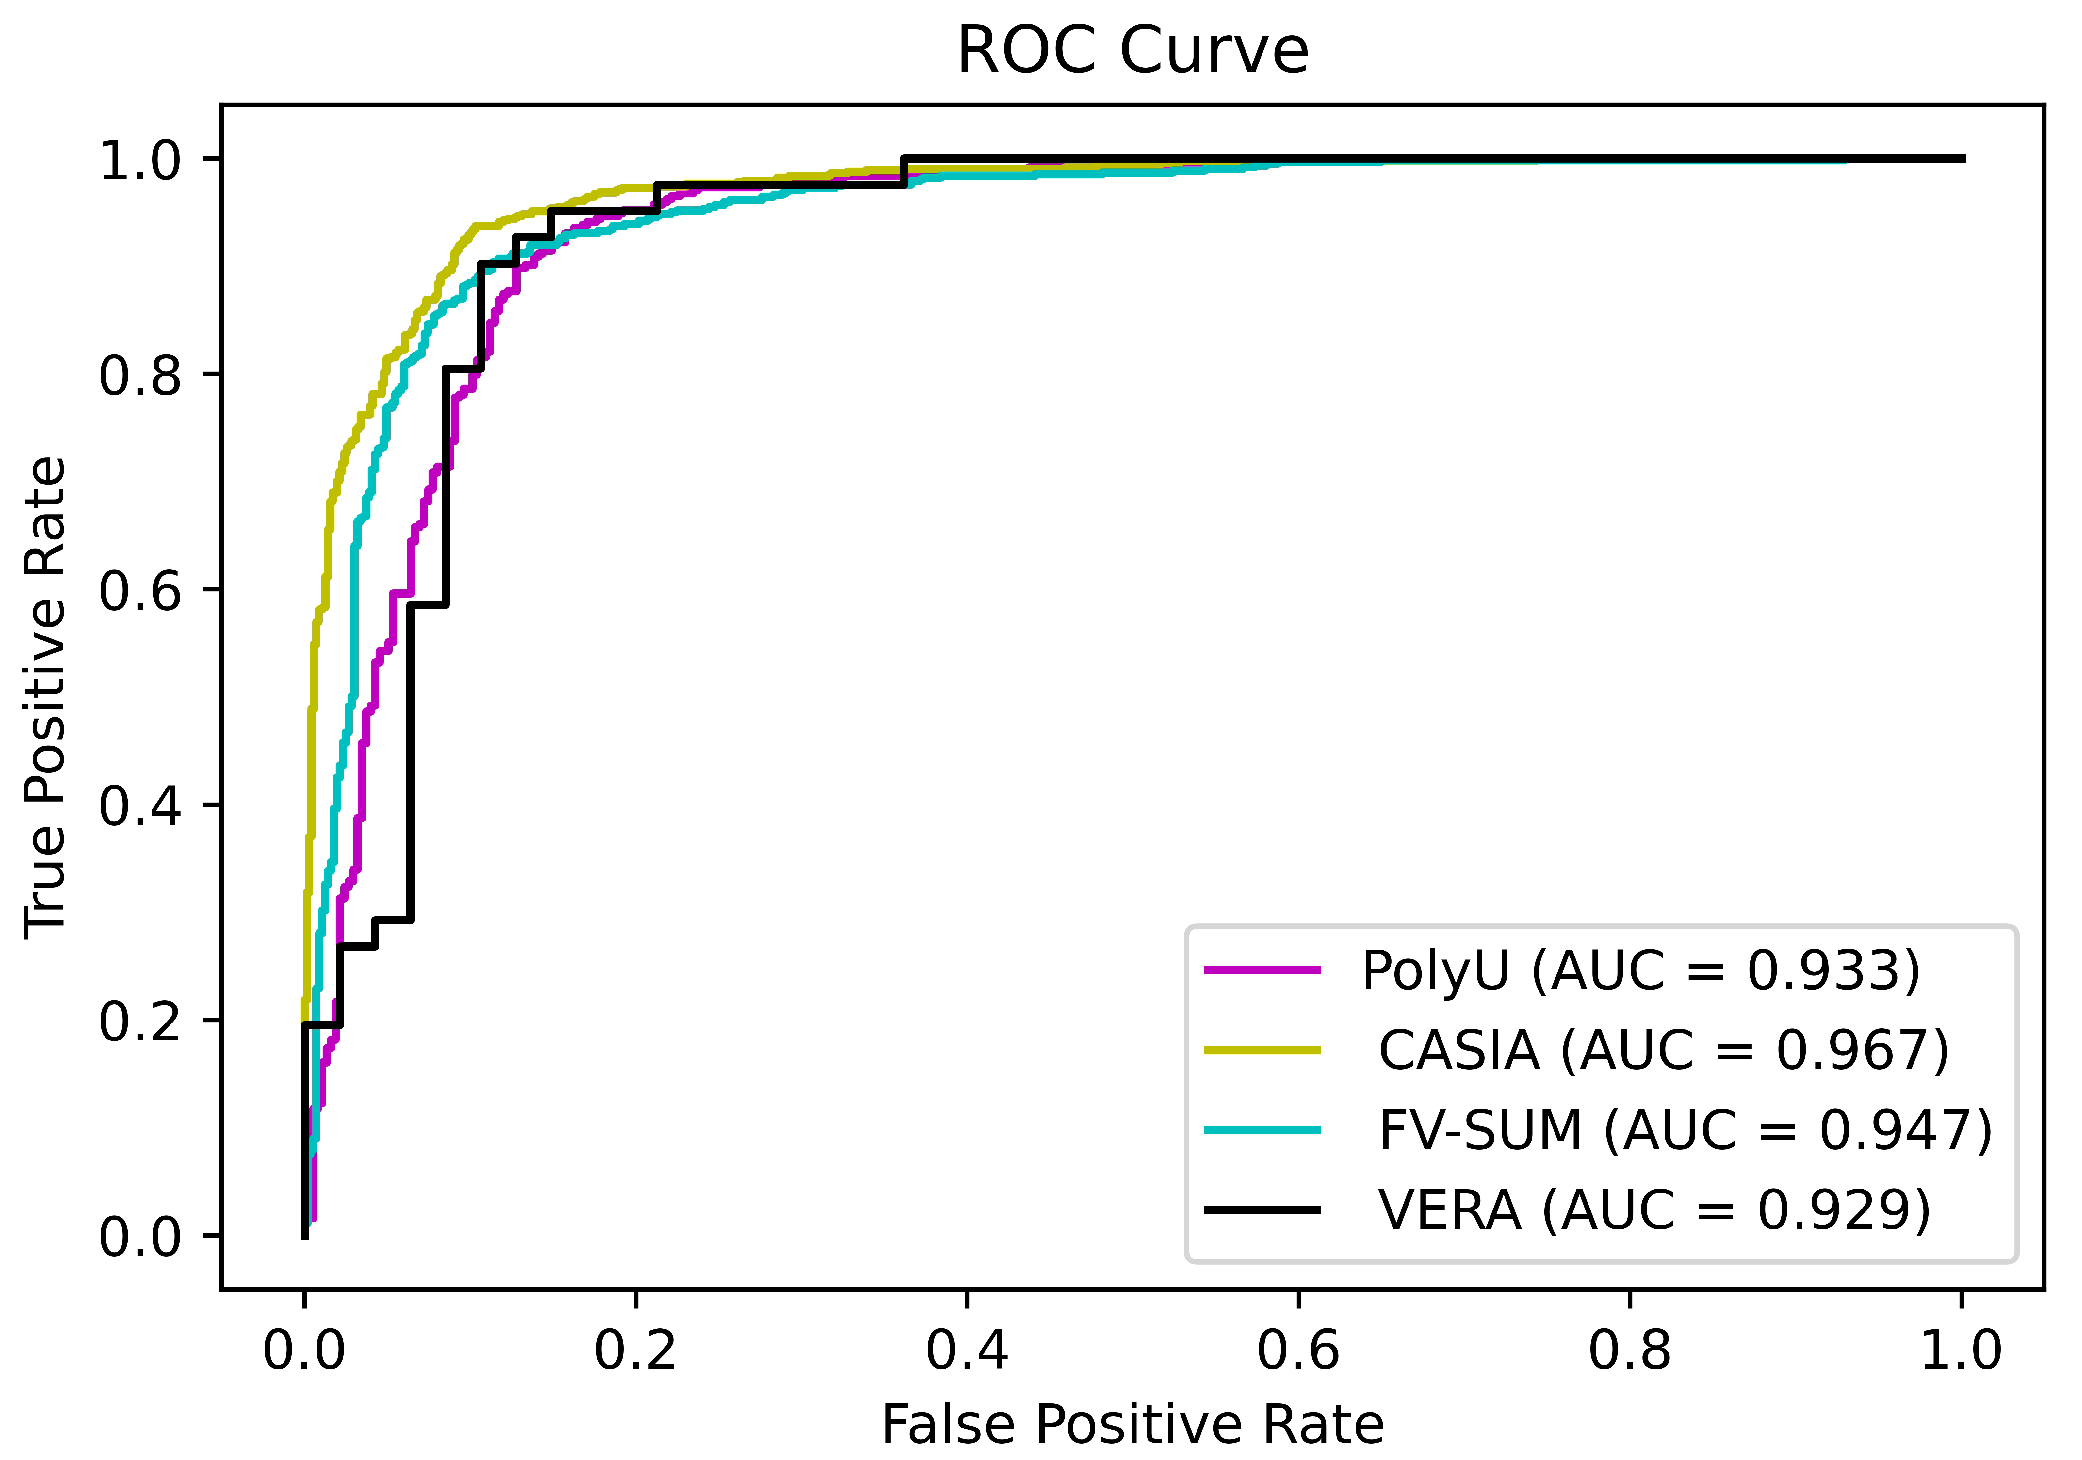
The ultimate aim of contactless authentication for vein pattern recognition is to anticipate the clusters corresponding to the data and labels specified in each data point. The performance of this algorithm can be defined by the CIR. This can be computed from the ROC curve as the AUC. Figure 8 shows that the accuracy for the current study on all four datasets is 96.7%. This is well above the average accuracy reported in Section 1 and Section 2 in various works in the literature.

4.2. Ablation Study

This article analyzed how adding different techniques to our self-supervising algorithm can affect the ARI score. As shown in Table 2, multiple investigations have been carried out in the conducted ablation study. We employed three UML algorithms: K-means clustering, K-nearest neighbors (KNN), and the Apriori algorithm. These algorithms were evaluated in conjunction with our proposed method, SSA, to ascertain comparative performance metrics.
For a rigorous quantitative assessment, the ARI was utilized as the evaluation parameter across three different unsupervised learning algorithms. All algorithms were trained under identical experimental conditions. The detailed quantitative results are presented in Table 2, while the corresponding visual representations are depicted in Figure 4a for K-mean along with other UML algorithms.

4.3. Image Quality Assessment

IQA aims to provide a quality measurement method for evaluating the effectiveness of image-processing systems and provides analytical methods for assessing image quality. Table 3 shows the test metrics’ IQA findings: PSNR and RMSE. Significantly greater statistics suggests better image quality. We use the same quality metrics to evaluate and compare palm vein datasets to PolyU, VERA, CASIA Multi-spectral, and FV-USM datasets.
The table delineates a comparative analysis of image quality metrics pre- and post-processing across four distinct datasets: FV-USM, VERA, CASIA, and PolyU. The datasets exhibit variability in the number of images and subjects, with FV-USM containing the highest number at 5940 images and 123 subjects, and VERA the lowest at 440 images and 110 subjects. The comparison is made between the metrics before processing and after processing. “Before processing” refers to the unaltered, original images of the dataset, whereas “After processing” pertains to the images that have undergone all the requisite steps to extract the vascular pattern from the original images.
The table clearly explains that the CASIA Multispectral imagery dataset achieved a higher performance (PSNR = 25.19@after processing and RMSE = 0.055@after processing) than others. So far, most IQA approaches [23,24,25,26] published are based on subjective quality measures. This experiment potentially concludes that PSNR and obtaining a contrast image are compatible. RMSE measurement is, nevertheless, compatible with segmented images. This research was carried out by obtaining the IQA on tested images and categorizing them.

5. Conclusions

This study determines a parameterized feature mapping developed from the IF to a lower IM, which is then optimized for clustering. Instead of the prior method of extracting veins, we use a multi-scale filtering technique, followed by an image enhancement approach, to build the UML-parameterized mapping at the appropriate level. Our technique may be used with other methods [19,27,28] to facilitate learning in situations with limited resources [29], where it is impractical to maintain a distinct network for each dataset.
This research concludes that the current study develops a parameterized feature mapping from the initial feature space to a lower-dimensional intermediate manifold, optimized for a clustering objective. Unlike prior methodologies that predominantly depended on vein extraction techniques, the proposed approach utilizes multi-scale filtering followed by an image enhancement procedure to establish the UML-parameterized mapping at the desired level of granularity. Essentially, the methodology introduced in this study can be integrated with other approaches [30,31] to facilitate learning in resource-constrained environments, where maintaining a distinct network for each dataset is impractical.
Because of the lack of supervision, unsupervised learning is challenging to describe, analyze, and deal with. Therefore, we can provide theoretically rigorous and practically efficient solutions for problems such as determining the optimal number of clusters for a particular task, selecting the appropriate clustering method to use, establishing the threshold in single linkage algorithms, and deciding how much data to discard as outliers. Consequently, we are able to avoid Kleinberg’s impossibility result and successfully achieve very effective clustering.
In the present study, utilizing 7200 NIR vein images from the CASIA dataset, 5940 from the FV-SUM database, 3744 from the PolyU dataset, and 440 vein pattern images from the VERA database, the UML-based self-supervision algorithm for vascular pattern retrieval attains a 96.7% success rate. This performance is comparable to, or surpasses, other touch-based biometric systems such as hand geometry [30], palm vein recognition [6], and finger vein verification [9] reported in the literature.
While the benefits of such a touchless vein-based system are evident, it should be acknowledged that the improper positioning of the acquisition apparatus, erroneous scanning positions, and variations in system settings introduce potential errors. Future work will focus on enhancing the robustness of the proposed method and algorithms to mitigate these errors and improve system reliability.

Author Contributions

Conceptualization, methodology, software, validation, formal analysis, investigation, writing—original draft preparation, visualization, S.R.; resources, data curation, A.G.; Conceptualization, validation, supervision, S.P.D.; Conceptualization, validation, supervision, S.P.D. and A.G. All authors have read and agreed to the published version of the manuscript.

Funding

This research received no external funding.

Data Availability Statement

The data that support the findings of this study are available from FV-USM, PolyU, CASIA and VERA but restrictions apply to the availability of these data, which were used under license for the current study, and so are not publicly available. Data are, however, available from upon reasonable request and with the permission of FV-USM, PolyU, CASIA and VERA.

Conflicts of Interest

The authors declare no conflicts of interest.

Abbreviations

The following abbreviations are used in this manuscript:
2DTwo dimensional
ARIAverage Random Index
AUCArea Under the Curve
BRIEFBinary Robust Independent Elementary Features
CASIAChinese academy of sciences institute of Automation
CNNConvolution Neural Network
CIRCorrect Identification Rate
DDADigital Differential Analyzer
EEREqual Error Rate
ERMEmpirical Risk Minimization
FV-USMVein database
FCNFast Convolution Networks
GPOGlobal Pattern Orientation
HPFHigh-Pass Filter
HKPU/HKPolyUHong Kong Polytechnic University
IQAImage Quality Analysis
IFImage Featured Set
IMImage Featured Map
LRELocal Ridge Enhancement
LPFLow Pass Filter
LBPLinear Binary pattern
LBPHLocal Binary Patterns Histogram
LDPLocal Directional Pattern
NIRNear Infrared
NMDNon-Local Means Denoising
ORCOutlier Removal Clustering
PCAPrincipal Component Analysis
PSNRPeak Signal-to-Noise Ratio
RDMRidge Detection Masking
ROIRegion of Interest
ROCReceiver Operating Characteristics
RMSERoot Mean Squared Error
SVDSingular Value Decomposition
SCFSelective Convolutional Feature
SCSilhouette Score
SIFTScale-Invariant Feature Transform
SSASelf-Supervised Algorithm
SURFSped-Up Robust Features
UMLUnsupervised Machine Learning
U-NetAn architecture for semantic segmentation
VGGVisual Geometry Group
VERAFingerVein dataset for finger vein recognition

References

  1. Yuan, C.; Yang, H. Research on K-Value Selection Method of K-Means Clustering Algorithm. J 2019, 2, 226–235. [Google Scholar] [CrossRef]
  2. Ran, X.; Zhou, X.; Lei, M.; Tepsan, W.; Deng, W. A Novel K-Means Clustering Algorithm with a Noise Algorithm for Capturing Urban Hotspots. Appl. Sci. 2021, 11, 11202. [Google Scholar] [CrossRef]
  3. Gupta, P.; Gupta, P. An accurate finger vein based verification system. Digit. Signal Process. 2015, 38, 43–52. [Google Scholar] [CrossRef]
  4. Zhai, D.; Yu, J.; Gao, F.; Lei, Y.; Feng, D. K-means text clustering algorithm based on centers selection according to maximum distance. Appl. Res. Comput. 2014, 31, 713–719. [Google Scholar]
  5. Jalilian, E.; Uhl, A. Finger-vein recognition using deep fully convolutional neural semantic segmentation networks: The impact of training data. In Proceedings of the 2018 IEEE International Workshop on Information Forensics and Security (WIFS), Hong Kong, China, 11–13 December 2018. [Google Scholar] [CrossRef]
  6. Zhang, L.; Cheng, Z.; Shen, Y.; Wang, D. Palmprint and palmvein recognition based on DCNN and a new large-scale contactless palmvein dataset. Symmetry 2018, 10, 78. [Google Scholar] [CrossRef]
  7. Wang, J.; Pan, Z.; Wang, G.; Li, M.; Li, Y. Spatial pyramid pooling of selective convolutional features for vein recognition. IEEE Access 2018, 6, 28563–28572. [Google Scholar] [CrossRef]
  8. Simonyan, K.; Zisserman, A. Very deep convolutional networks for large-scale image recognition. arXiv 2014, arXiv:1409.1556. [Google Scholar]
  9. Huang, H.; Liu, S.; Zheng, H.; Ni, L.; Zhang, Y.; Li, W. DeepVein: Novel finger vein verification methods based on deep convolutional neural networks. In Proceedings of the 2017 IEEE International Conference on Identity, Security and Behavior Analysis (ISBA), New Delhi, India, 22–24 February 2017. [Google Scholar] [CrossRef]
  10. Rastogi, S.; Duttagupta, S.P.; Guha, A.; Prakash, S. NIR Palm Vein Pattern Recognition. In Proceedings of the 2020 IEEE International Conference for Innovation in Technology (INOCON), Bangluru, India, 6–8 November 2020. [Google Scholar] [CrossRef]
  11. Rastogi, S.; Duttagupta, S.P.; Guha, A.; Prakash, S. Palm vein pattern: Extraction and Authentication. In Proceedings of the 2020 IEEE International Conference on Machine Learning and Applied Network Technologies (ICMLANT), Hyderabad, India, 20–21 December 2020. [Google Scholar] [CrossRef]
  12. The Institute of Automation, Chinese Academy of Sciences. Data Retrieved from Biometric Ideal Test (BIT). 2020. Available online: http://biometrics.idealtest.org/dbDetailForUser.do?id=5 (accessed on 5 April 2021).
  13. Tome, P.; Marcel, S. On the vulnerability of palm vein recognition to spoofing attacks. In Proceedings of the 2015 International Conference on Biometrics (ICB), Phuket, Thailand, 19–22 May 2015. [Google Scholar] [CrossRef]
  14. Asaari, M.S.; Suandi, S.A.; Rosdi, B.A. Fusion of band limited phase only correlation and width centroid contour distance for finger based biometrics. Expert Syst. Appl. 2014, 41, 3367–3382. [Google Scholar] [CrossRef]
  15. Rastogi, S.; Duttagupta, S.P.; Guha, A. Digital Image Conspicuous Features Classification Using TLCNN Model with SVM Classifier. In Pattern Recognition and Image Analysis, Proceedings of the IbPRIA 2022, Aveiro, Portugal, 4–6 May 2022; Lecture Notes in Computer Science; Pinho, A.J., Georgieva, P., Teixeira, L.F., Sánchez, J.A., Eds.; Springer: Cham, Switzerland, 2022; Volume 13256. [Google Scholar] [CrossRef]
  16. Shahapure, K.R.; Nicholas, C. Cluster quality analysis using silhouette score. In Proceedings of the 2020 IEEE 7th International Conference on Data Science and Advanced Analytics (DSAA), Sydney, Australia, 6–9 October 2020; pp. 747–748. [Google Scholar]
  17. Shutaywi, M.; Kachouie, N.N. Silhouette Analysis for Performance Evaluation in Machine Learning with Applications to Clustering. Entropy 2021, 23, 759. [Google Scholar] [CrossRef] [PubMed]
  18. Gonzalez, R.C.; Woods, R.E. Digital Image Processing; Prentice Hall: Upper Saddle River, NJ, USA, 2008. [Google Scholar]
  19. Chen, W.; Wilson, J.; Tyree, S.; Weinberger, K.; Chen, Y. Compressing neural networks with the hashing trick. In Proceedings of the 32nd International Conference on Machine Learning, Lille, France, 6–11 July 2015; pp. 2285–2294. [Google Scholar]
  20. Ahmed, M.; Seraj, R.; Islam, S.M.S. The k-means Algorithm: A Comprehensive Survey and Performance Evaluation. Electronics 2020, 9, 1295. [Google Scholar] [CrossRef]
  21. Michael, G.K.; Connie, T.; Teoh, A.B. A contactless biometric system using palm print and palm vein features. In Advanced Biometric Technologies; Chetty, G., Yang, J., Eds.; IntechOpen: Rijeka, Croatia, 2011; pp. 155–177. [Google Scholar]
  22. Guan, S.; Asfour, H.; Sarvazyan, N.; Loew, M. Application of unsupervised learning to hyperspectral imaging of cardiac ablation lesions. J. Med. Imaging 2018, 5, 046003. [Google Scholar] [CrossRef] [PubMed]
  23. Ren, H.; Sun, L.; Guo, J.; Han, C.; Cao, Y. A high compatibility finger vein image quality assessment system based on deep learning. Expert Syst. Appl. 2022, 196, 116603. [Google Scholar] [CrossRef]
  24. Zhang, Z.; Wang, M. A simple and efficient method for finger vein recognition. Sensors 2022, 22, 2234. [Google Scholar] [CrossRef]
  25. Shaheed, K.; Liu, H.; Yang, G.; Qureshi, I.; Gou, J.; Yin, Y. A systematic review of finger vein recognition techniques. Information 2018, 9, 213. [Google Scholar] [CrossRef]
  26. Faltaous, S.; Liebers, J.; Abdelrahman, Y.; Alt, F.; Schneegass, S. VPID: Towards vein pattern identification using thermal imaging. i-com 2019, 18, 259–270. [Google Scholar] [CrossRef]
  27. Han, S.; Mao, H.; Dally, W.J. Deep compression: Compressing deep neural networks with pruning, trained quantization and huffman coding. arXiv 2015, arXiv:1510.00149. [Google Scholar]
  28. Luo, J.H.; Wu, J.; Lin, W. Thinet: A filter level pruning method for deep neural network compression. In Proceedings of the 2017 IEEE International Conference on Computer Vision (ICCV), Venice, Italy, 22–29 October 2017; pp. 5058–5066. [Google Scholar]
  29. Gupta, C.; Suggala, A.S.; Goyal, A.; Simhadri, H.V.; Paranjape, B.; Kumar, A.; Goyal, S.; Udupa, R.; Varma, M.; Jain, P. Protonn: Compressed and accurate knn for resource-scarce devices. In Proceedings of the International Conference on Machine Learning, Sydney, Australia, 6–11 August 2017; pp. 1331–1340. [Google Scholar]
  30. Van, H.T.; Thai, T.T.; Le, T.H. Robust finger vein identification base on discriminant orientation feature. In Proceedings of the 2015 Seventh International Conference on Knowledge and Systems Engineering (KSE), Ho Chi Minh City, Vietnam, 8–10 October 2015; pp. 348–353. [Google Scholar]
  31. Ning, Y.; Zhu, M.; Zhang, J.L. Near-infrared (NIR) lanthanide molecular probes for bioimaging and biosensing. Coord. Chem. Rev. 2019, 399, 213028. [Google Scholar] [CrossRef]
Figure 1. Methodological flowchart: The vascular classification scheme is divided into four stages: retrieval of palm vein images, preprocessing mostly in ROI, feature extraction, and identification. The preprocessing technique improves the vein image segments, whereas the extraction method extracts an acceptable element from the preprocessed image.
Make 06 00056 g001
Figure 2. The vascular pattern preparation step involves denoising NIR images using UML approaches and converting them to grayscale. The grayscale image is further processed to obtain the binary image. Utilizing the Otsu binarization ML technique in (a), the obtained image from (a) undergoes canny edge detection to obtain the perfect contouring as shown in (b). (c) The rectangular ROI selection is made taking a reference point, in between two fingers as marked, (d) the preprocessed image ROI is selected, and (e) ROI extraction is accomplished.
Make 06 00056 g002
Figure 3. (a) The ARI scores of several different clustering (k = 2) techniques. (b) Outlier removal yields much better outcomes with 1% of the interpretations as outlier removal.
Make 06 00056 g003
Figure 4. Image-enhancing methods: (a) extracted ROI, (b) gamma corrected image, (c) Laplacian filters, (d) Laplacian of Gaussian, and (e) unsharp masking bring out the intricacy of the input vascular ridge pattern.
Make 06 00056 g004
Figure 5. Processes entailed in the LRE, as mentioned above, approach: (a) unsharp masked image from (e), (b) response of applying LPF, (c) response of applying HPF on the response of C, (d) image binarization, (e) applying morphological operations to remove any other unwanted noise, (f) the eventual outcome of LRE.
Make 06 00056 g005
Figure 6. (a) Vein pattern obtained using a 2D convolution filter and masked image segmentation using UML algorithm at (b) k = 10, (c) k = 15, and (d) k = 20.
Make 06 00056 g006
Figure 7. The average ARI score of the UML algorithm and the baseline for choosing the number of clusters are plotted against the proportions of problems used for training.
Make 06 00056 g007
Figure 8. ROC curve.
Make 06 00056 g008
Table 1. A categorical description of vascular-based approaches.
MethodTechniqueFeature
GeometricalLine-like, Curvature modelTopological features such as vein knuckle forms, terminal points, and intersection points
Subspace learningDDA, PCA, 2D PCAinformation extraction, statistical moments of the data distribution
StatisticalLBPH, LBP, LDPtexture extraction, image retrieval
InvariantSIFT, SURF, BRIEFgesture recognition, matching the movement, image comparison
Table 2. Ablation study.
AlgorithmARISSA + AlgorithmNew ARI
K-Means [22]0.12SSA + KMeans0.125
KNN0.09SSA + KNN0.093
Apriori0.05SSA + Apriori0.051
Table 3. The best IQA results are highlighted for each quality parameter and modality.
DatasetImagesSubjectPSNRRMSE
BPAPBPAP
FV-USM594012324.1524.580.0620.059
VERA44011022.3822.850.0760.072
CASIA720010024.8825.190.0570.055
PolyU374415623.2223.610.0690.066
BP—before processing. AP—after processing.
Disclaimer/Publisher’s Note: The statements, opinions and data contained in all publications are solely those of the individual author(s) and contributor(s) and not of MDPI and/or the editor(s). MDPI and/or the editor(s) disclaim responsibility for any injury to people or property resulting from any ideas, methods, instructions or products referred to in the content.