
The Impact of Light Conditions on Neural Affect Classification: A Deep Learning Approach


Abstract
1. Introduction
- (1)
- Can we train a network to predict an affect state? To answer this question, two tasks arise: an affect-classification task under the influence of warm light and an affect-classification task under the influence of cold light.
- (2)
- Can we train a network to predict light conditions given an affect state? To answer this question, the following task arises: classification of a warm light vs. a cold light condition.
- (3)
- How well can we classify affect states in one condition vs. another? To answer this question, a statistical analysis of the results of the previous tasks has to be performed.
2. Methods
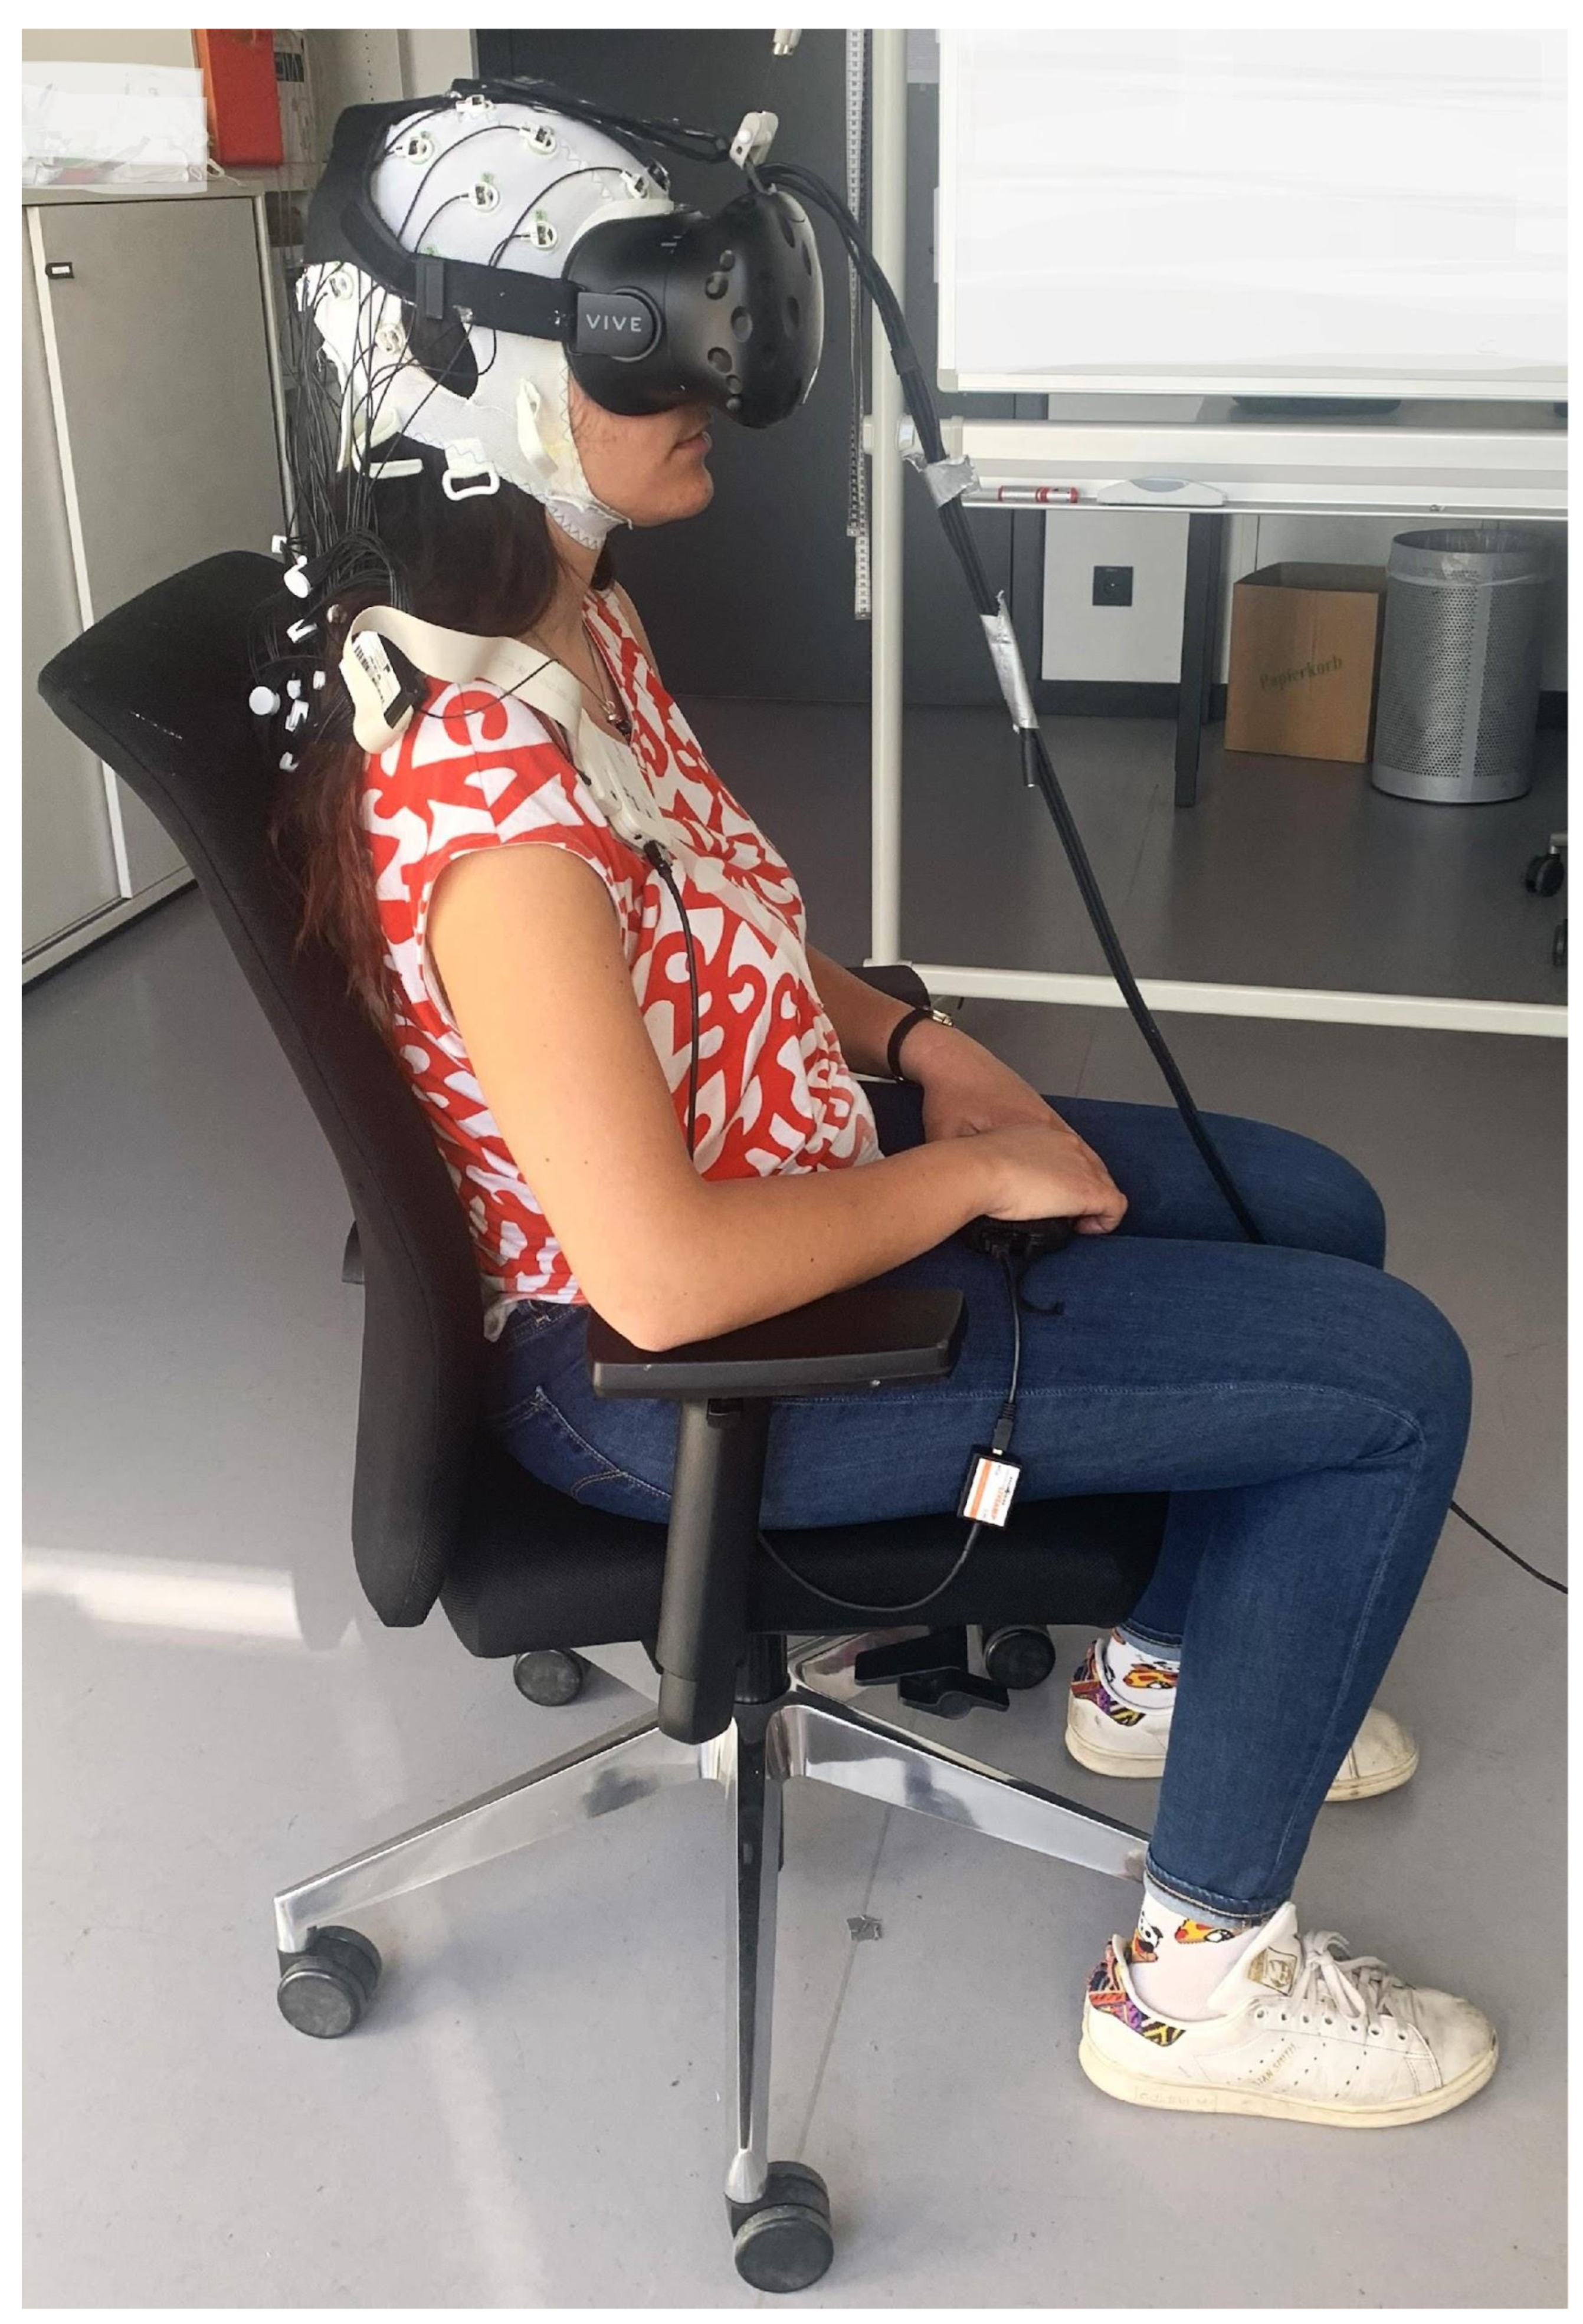
2.1. Participants
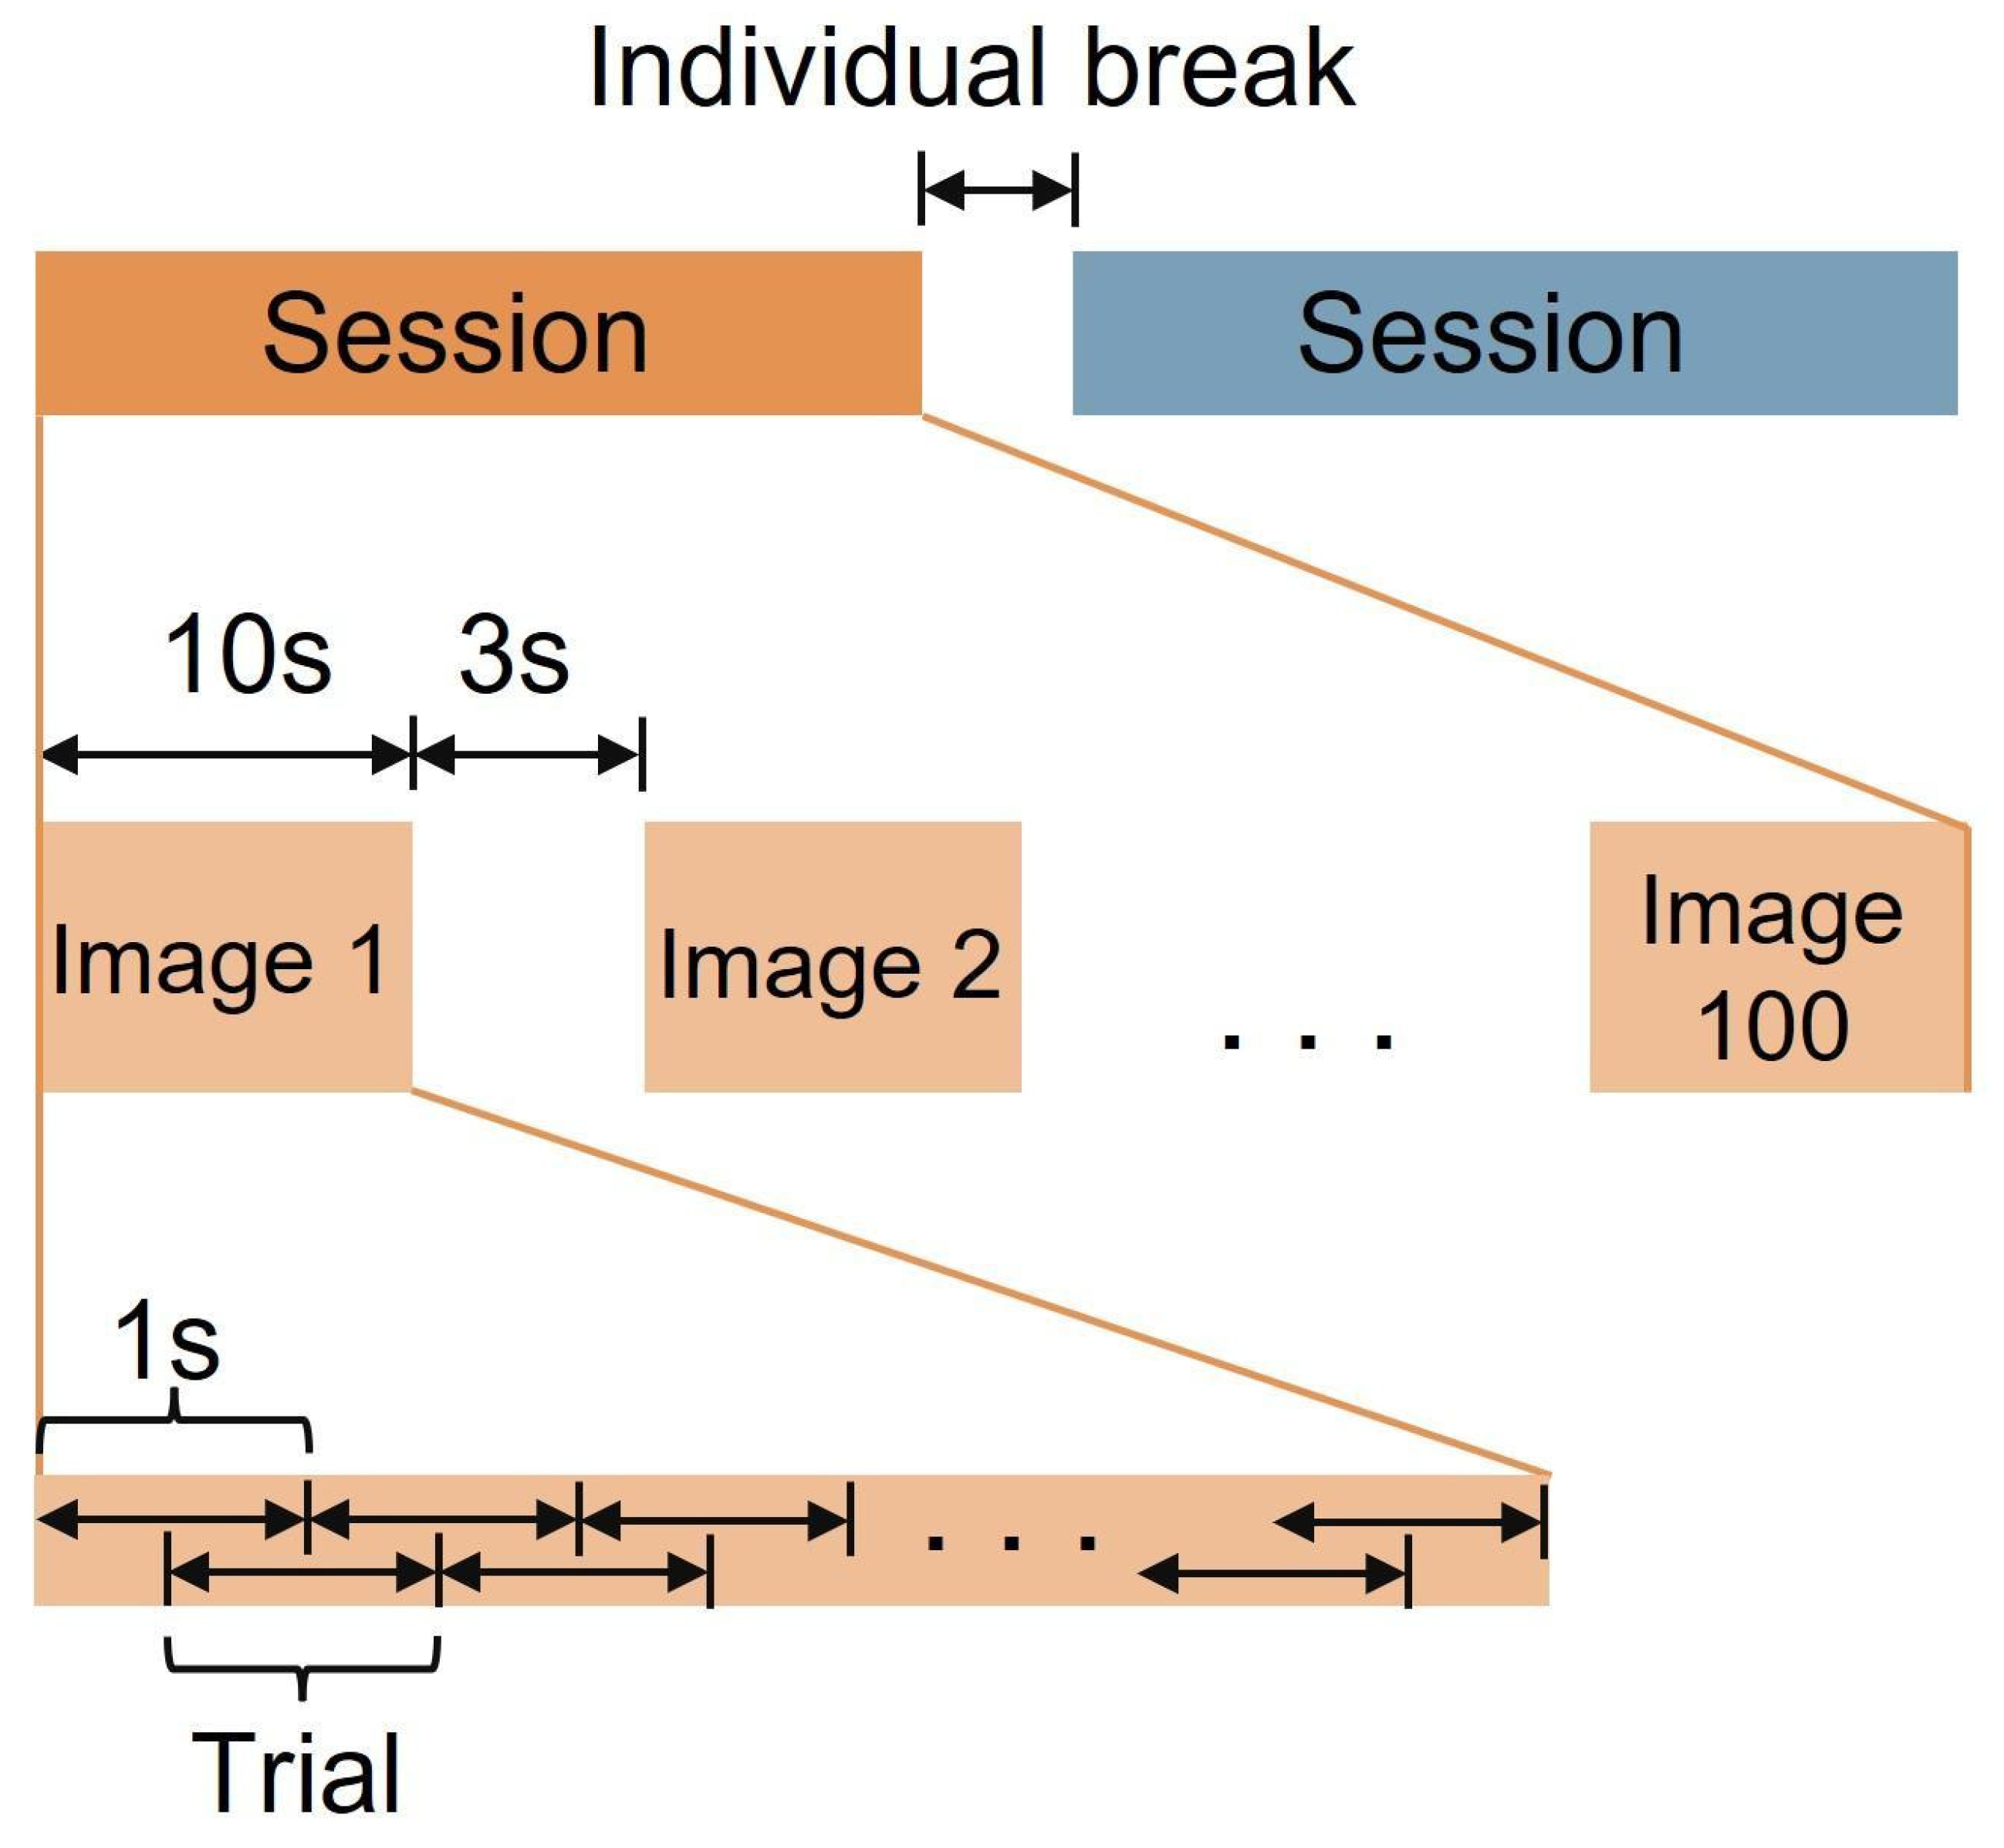
2.2. Experimental Paradigm
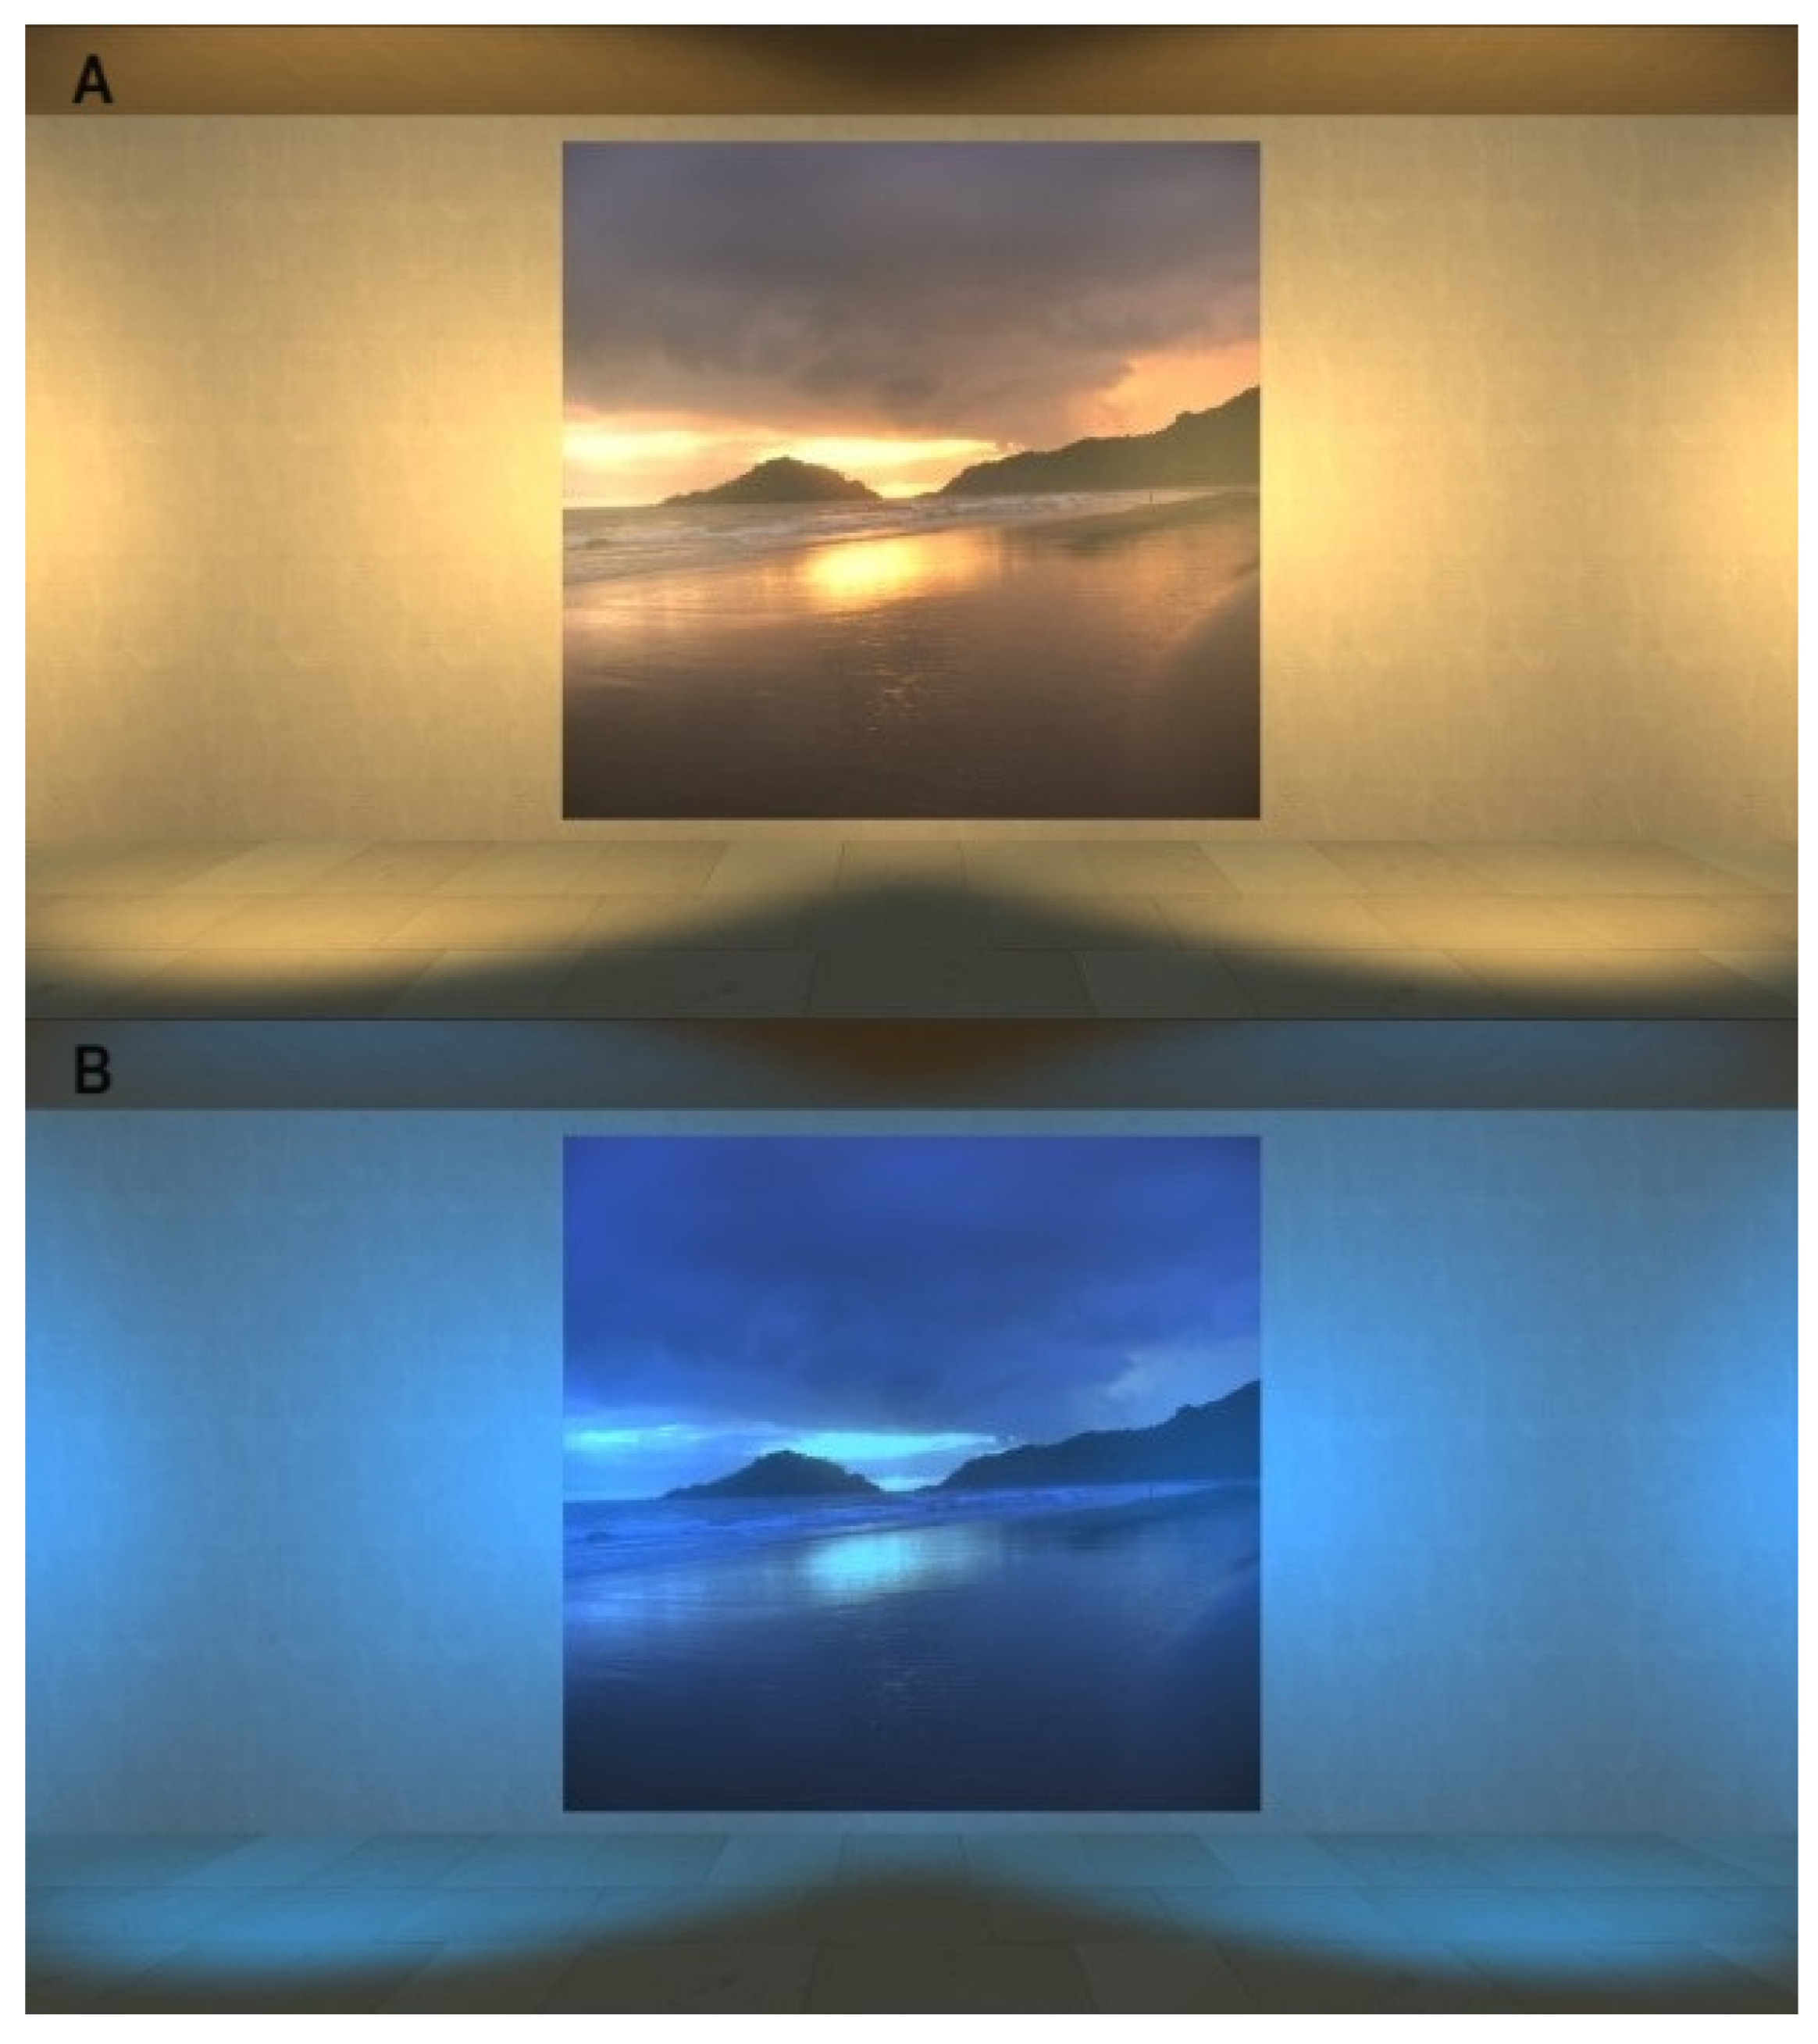
2.3. Affect Elicitation and Labeling
2.4. EEG Setup and Data Preprocessing
2.5. Classification Methods
- (1)
- Linear discriminant analysis (LDA)
- (2)
- Spatial Filter Model
- (3)
- CNN Model
- (4)
- EEGNet Model
- (5)
- SincNet Model
3. Results
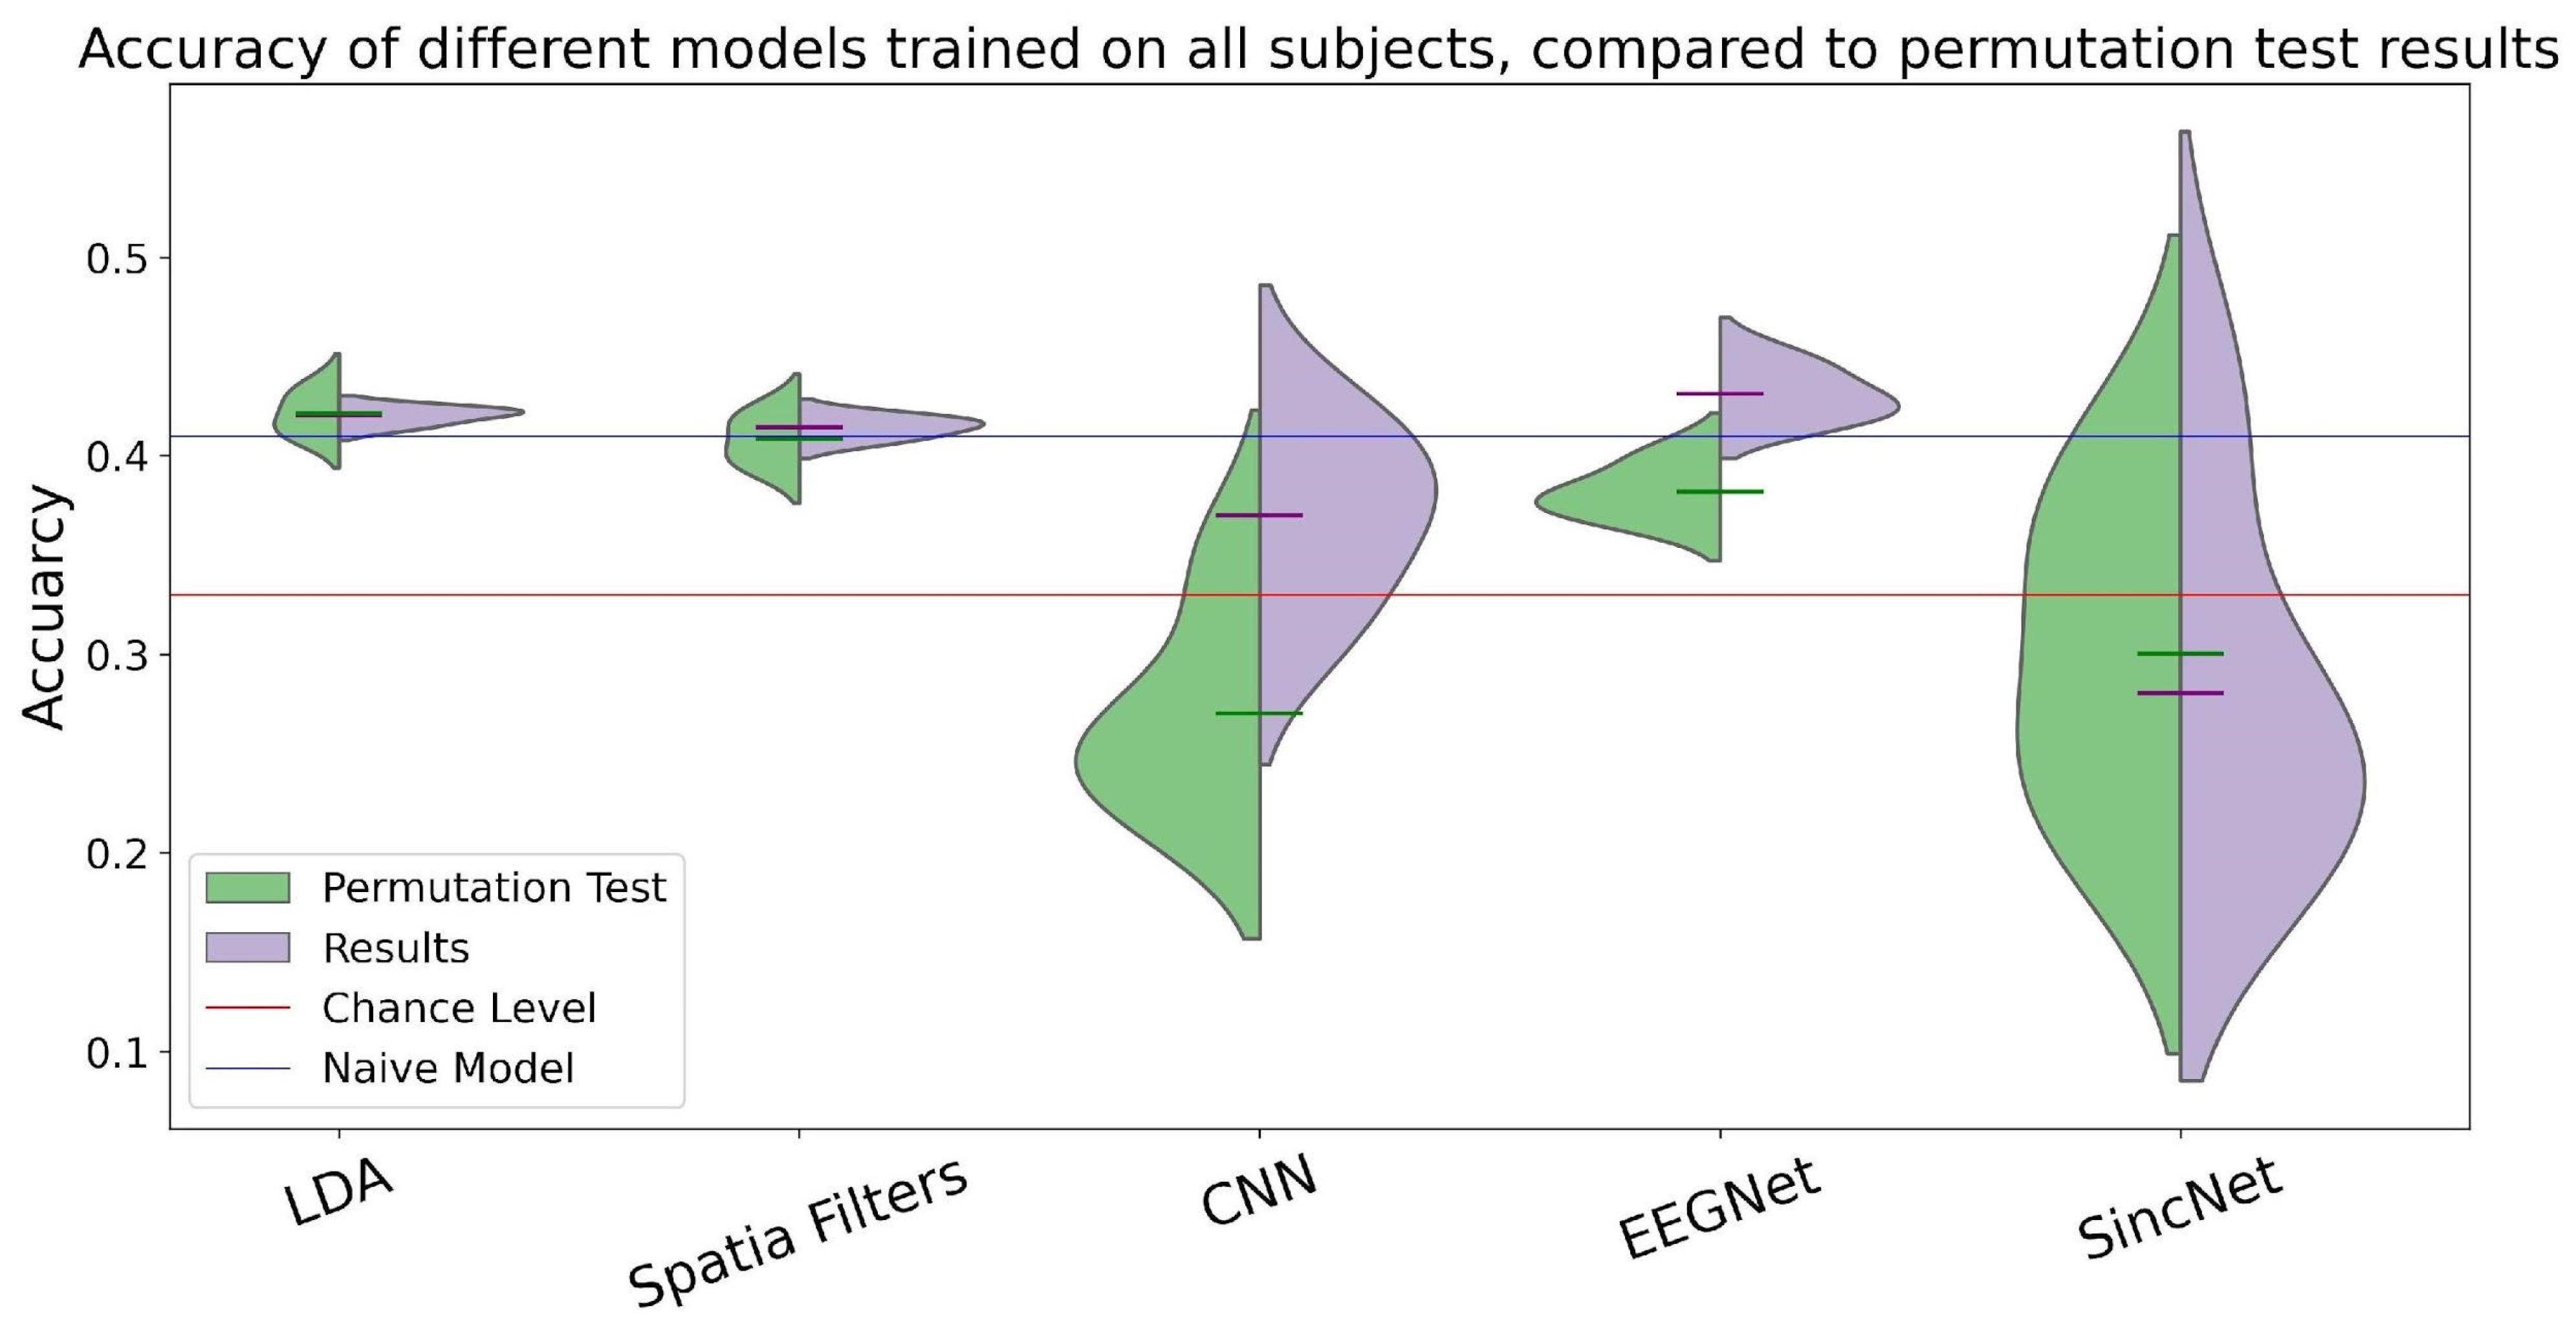
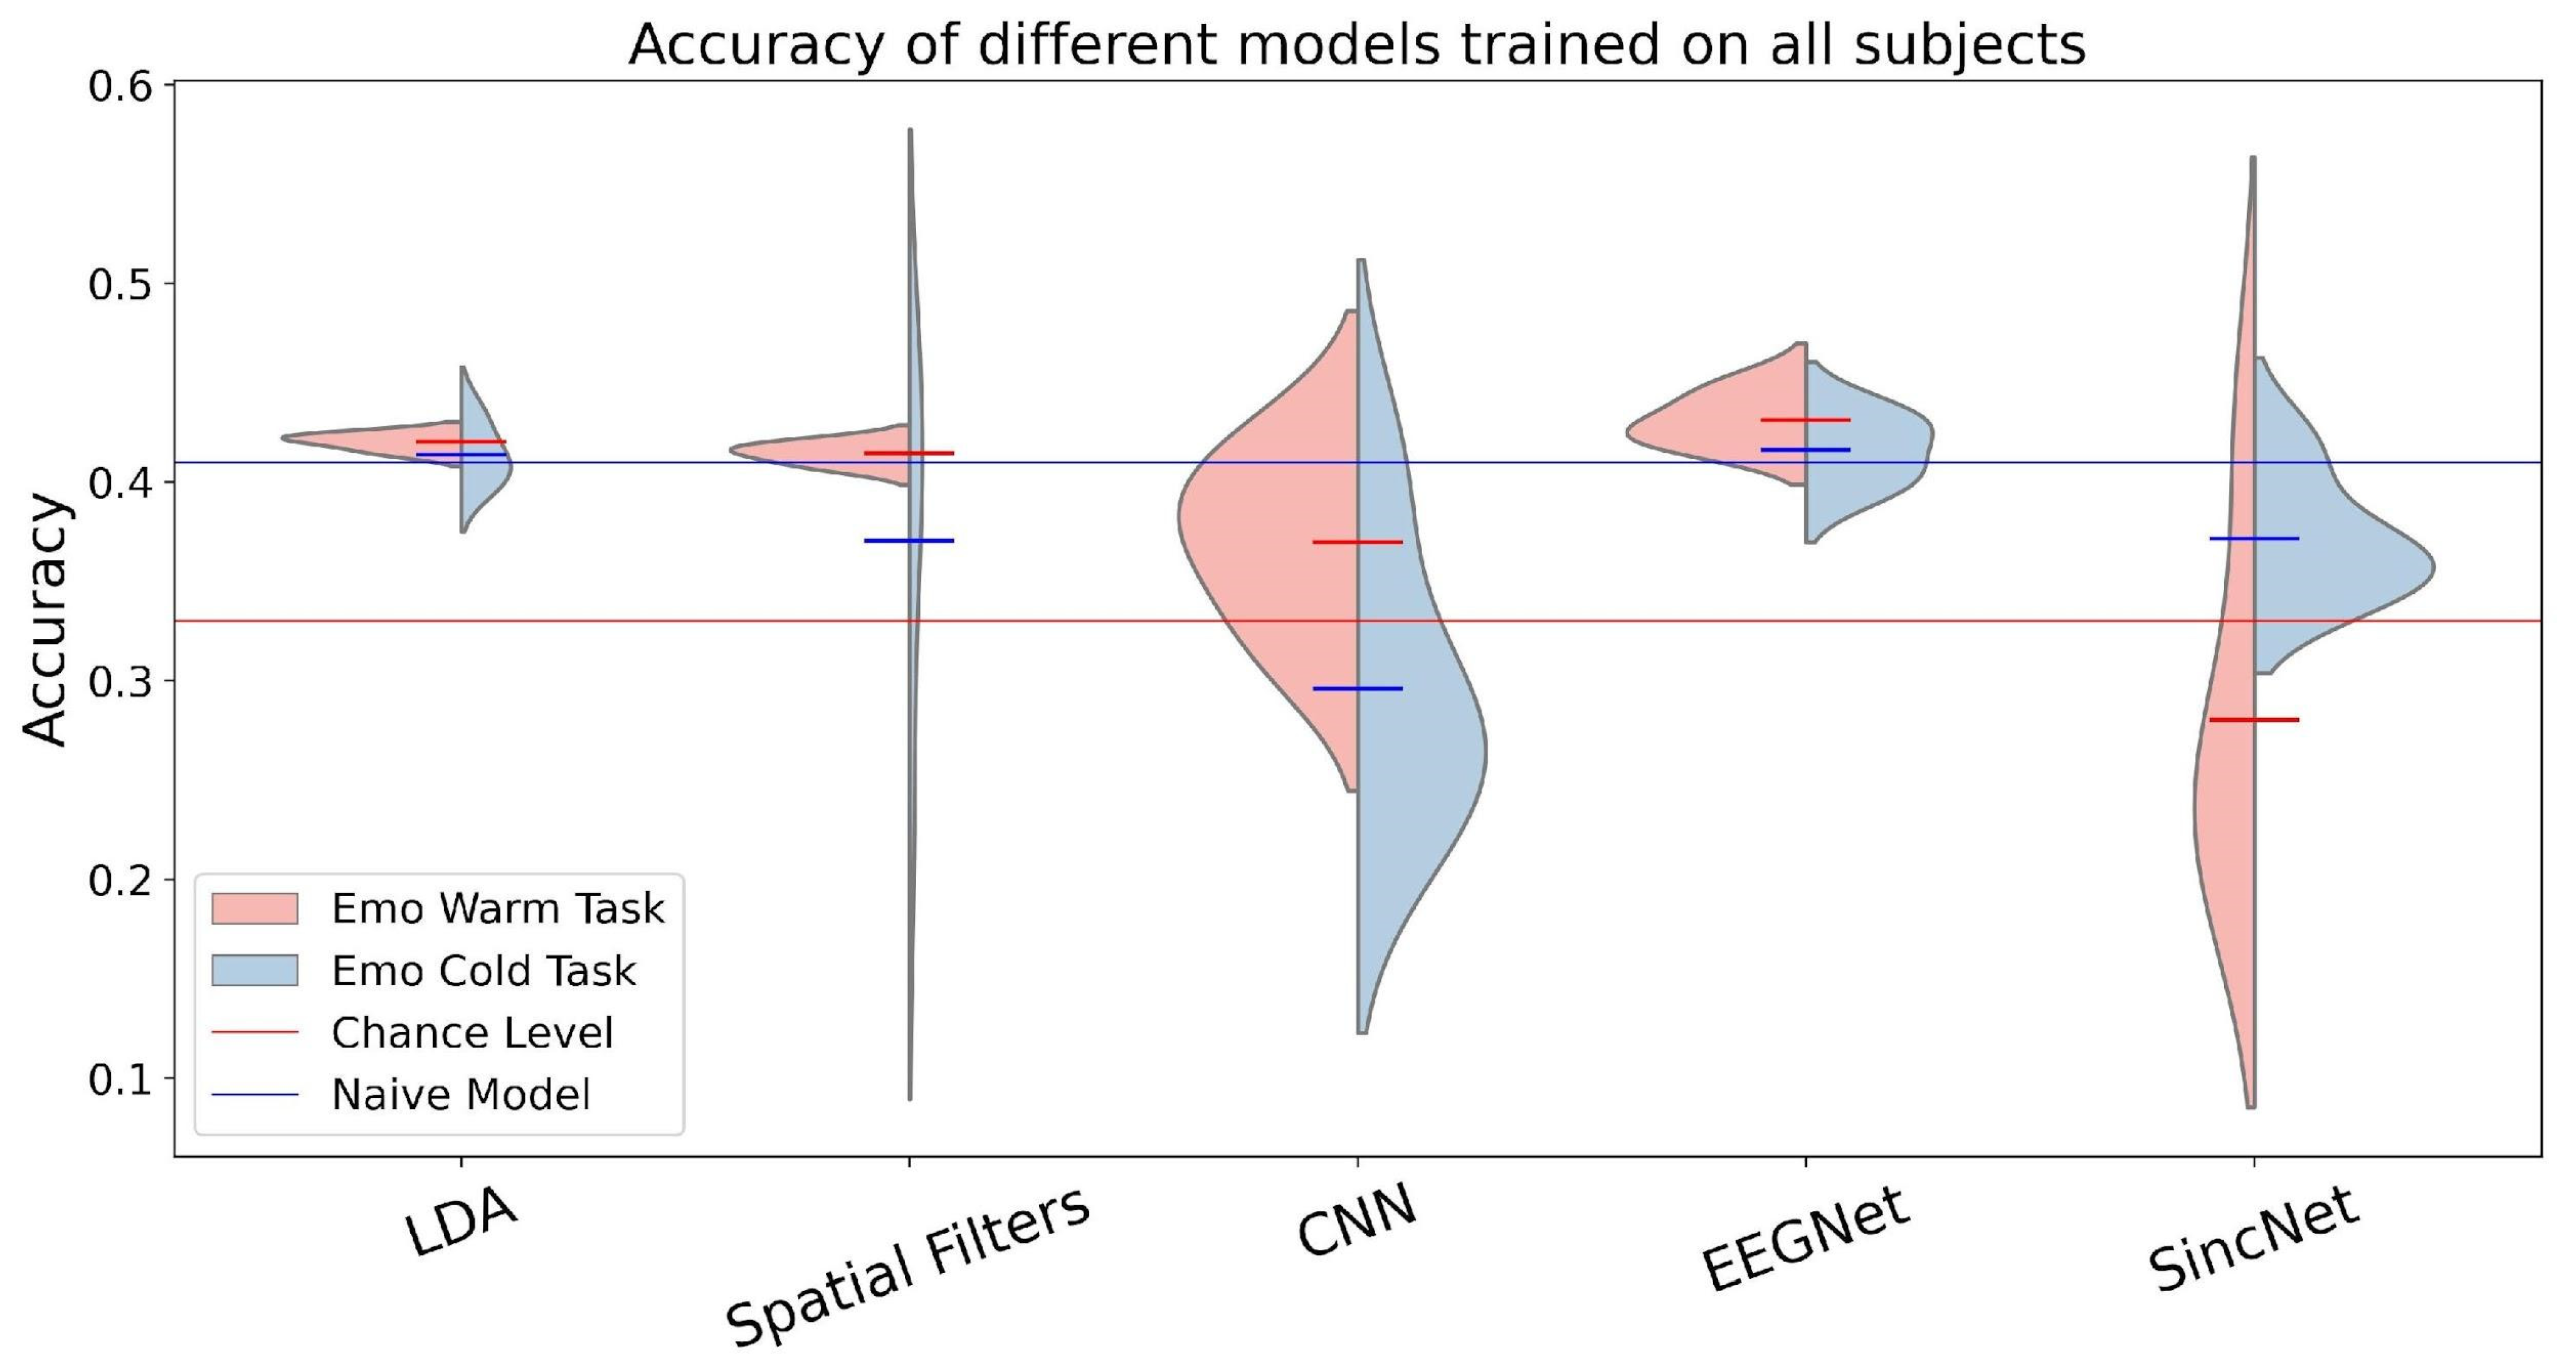
3.1. Affect Classification
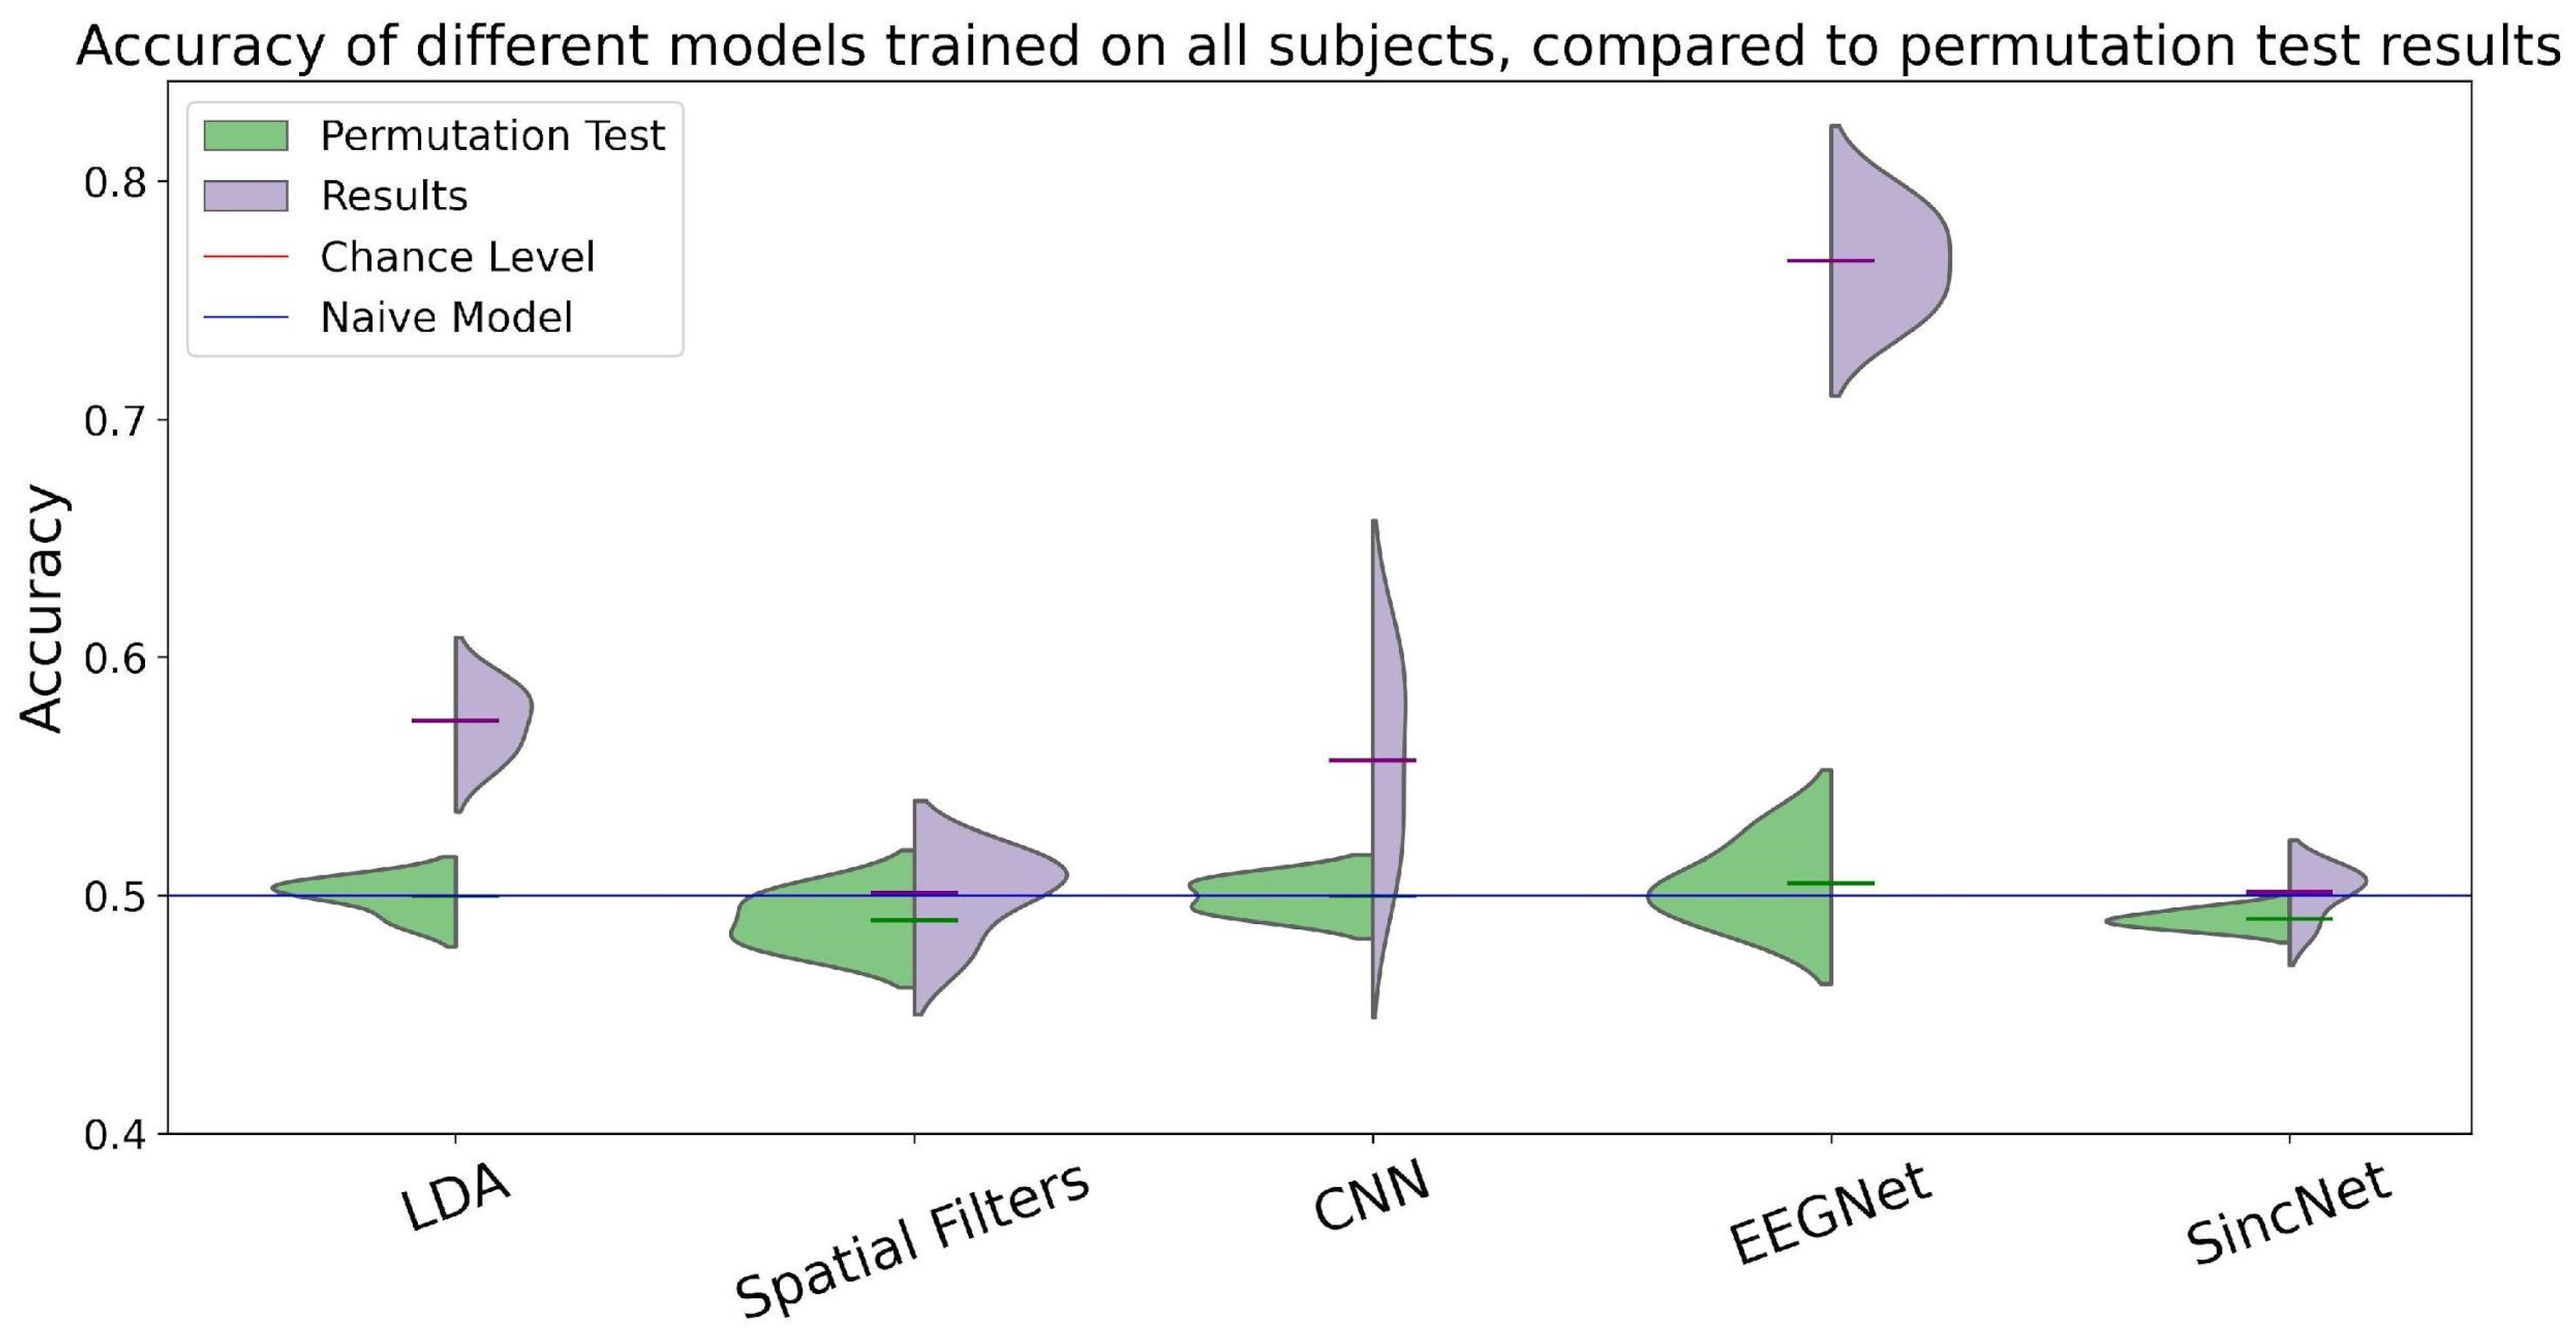
3.2. Warm vs. Cold Light Classification
3.3. Warm Affect Classification vs. Cold Affect Classification
4. Discussion
4.1. Training a Model to Predict Affect States
4.2. Training a Model to Predict Light Conditions Based on Affect States
4.3. Comparing Affective Classification: Evaluating Model Performance across Different Conditions
5. Conclusions
Author Contributions
Funding
Data Availability Statement
Acknowledgments
Conflicts of Interest
References
- Bos, D.O. EEG-based emotion recognition. The influence of visual and auditory stimuli. Comput. Sci. 2006, 56, 1–17. [Google Scholar]
- Micoulaud-Franchi, J.A.; Jeunet, C.; Pelissolo, A.; Ros, T. EEG Neurofeedback for Anxiety Disorders and Post-Traumatic Stress Disorders: A Blueprint for a Promising Brain-Based Therapy. Curr. Psychiatry Rep. 2021, 23, 84. [Google Scholar] [CrossRef]
- De Brito, M.A.; Fernandes, J.R.; Esteves, N.S.; Müller, V.T.; Alexandria, D.B.; Pérez, D.I.V.; Slimani, M.; Brito, C.J.; Bragazzi, N.L.; Miarka, B. The effect of neurofeedback on the reaction time and cognitive performance of athletes: A systematic review and meta-analysis. Front. Hum. Neurosci. 2022, 16, 868450. [Google Scholar] [PubMed]
- Lawrence, L.M.; Ciorciari, J.; Kyrios, M. Cognitive processes associated with compulsive buying behaviours and related EEG coherence. Psychiatry Res. Neuroimaging 2014, 221, 97–103. [Google Scholar] [CrossRef]
- Jalilpour, S.; Müller-Putz, G. Toward passive BCI: Asynchronous decoding of neural responses to direction-and angle-specific perturbations during a simulated cockpit scenario. Sci. Rep. 2022, 12, 6802. [Google Scholar]
- Ekman, P. Basic emotions. In Handbook of Cognition and Emotion; Dalgleish, T., Power, M.J., Eds.; John Wiley & Sons, Ltd.: Hoboken, NJ, USA, 2005; pp. 45–60. [Google Scholar] [CrossRef]
- Russell, J.A. A circumplex model of affect. J. Personal. Soc. Psychol. 1980, 39, 1161–1178. [Google Scholar] [CrossRef]
- Dadebayev, D.; Goh, W.W.; Tan, E.X. EEG-based emotion recognition: Review of commercial EEG devices and machine learning techniques. J. King Saud. Univ.-Comput. Inf. Sci. 2022, 34, 4385–4401. [Google Scholar]
- Alarcao, S.M.; Fonseca, M.J. Emotions Recognition Using EEG Signals: A Survey. IEEE Trans. Affect. Comput. 2019, 9, 374–393. [Google Scholar]
- Ramzan, M.; Dawn, S. Fused CNN-LSTM deep learning emotion recognition model using electroencephalography signals. Int. J. Neurosci. 2023, 133, 587–597. [Google Scholar] [CrossRef]
- Pinilla, A.; Voigt-Antons, J.-N.; Garcia, J.; Raffe, W.; Möller, S. Real-time affect detection in virtual reality: A technique based on a three-dimensional model of affect and EEG signals. Front. Virtual Real. 2023, 3, 964754. [Google Scholar] [CrossRef]
- Liu, Y.H.; Wu, C.T.; Cheng, W.T.; Hsiao, Y.T.; Chen, P.M.; Teng, J.T. Emotion recognition from single-trial EEG based on kernel Fisher’s emotion pattern and imbalanced quasiconformal kernel support vector machine. Sensors 2014, 14, 13361–13388. [Google Scholar] [CrossRef]
- Gonzalez, H.A.; Yoo, J.; Elfadel, I.M. EEG-based emotion detection using unsupervised transfer learning. In Proceedings of the 2019 41st Annual International Conference of the IEEE Engineering in Medicine and Biology Society (EMBC), Berlin, Germany, 23–27 July 2019; pp. 694–697. [Google Scholar]
- Ding, Y.; Robinson, N.; Zeng, Q.; Chen, D.; Wai, A.A.P.; Lee, T.S.; Guan, C. TSception: A deep learning framework for emotion detection using EEG. In Proceedings of the 2020 International Joint Conference on Neural Networks (IJCNN), Glasgow, UK, 19–24 July 2020; pp. 1–7. [Google Scholar]
- Yu, M.; Xiao, S.; Hua, M.; Wang, H.; Chen, X.; Tian, F.; Li, Y. EEG-based emotion recognition in an immersive virtual reality environment: From local activity to brain network features. Biomed. Signal Process. Control 2022, 72, 103349. [Google Scholar] [CrossRef]
- Marín-Morales, J.; Higuera-Trujillo, J.L.; Greco, A.; Guixeres, J.; Llinares, C.; Scilingo, E.P.; Alcañiz, M.; Valenza, G. Affective computing in virtual reality: Emotion recognition from brain and heartbeat dynamics using wearable sensors. Sci. Rep. 2018, 8, 13657. [Google Scholar] [PubMed]
- Ding, Y.; Wu, G.; Chen, D.; Zhang, N.; Gong, L.; Cao, M.; Qin, Z. DeepEDN: A deep-learning-based image encryption and decryption network for internet of medical things. IEEE Internet Things J. 2020, 8, 1504–1518. [Google Scholar]
- Gupta, K.; Lazarevic, J.; Pai, Y.S.; Billinghurst, M. AffectivelyVR: Towards VR personalized emotion recognition. In Proceedings of the 26th ACM Symposium on Virtual Reality Software and Technology, Virtual Event, 1–4 November 2020; pp. 1–3. [Google Scholar]
- Hofmann, S.M.; Klotzsche, F.; Mariola, A.; Nikulin, V.; Villringer, A.; Gaebler, M. Decoding subjective emotional arousal from EEG during an immersive virtual reality experience. eLife 2021, 10, e64812. [Google Scholar] [PubMed]
- Marín-Morales, J.; Llinares, C.; Guixeres, J.; Alcañiz, M. Emotion recognition in immersive virtual reality: From statistics to affective computing. Sensors 2020, 20, 5163. [Google Scholar] [CrossRef]
- Menezes, M.L.R.; Samara, A.; Galway, L.; Sant’Anna, A.; Verikas, A.; Alonso-Fernandez, F.; Wang, H.; Bond, R. Towards emotion recognition for virtual environments: An evaluation of eeg features on benchmark dataset. Pers. Ubiquitous Comput. 2017, 21, 1003–1013. [Google Scholar] [CrossRef]
- Pei, G.; Shang, Q.; Hua, S.; Li, T.; Jin, J. EEG-based affective computing in virtual reality with a balancing of the computational efficiency and recognition accuracy. Comput. Hum. Behav. 2024, 152, 108085. [Google Scholar]
- Suhaimi, N.S.; Mountstephens, J.; Teo, J. EEG-based emotion recognition: A state-of-the-art review of current trends and opportunities. Comput. Intell. Neurosci. 2020, 2020, 8875426. [Google Scholar]
- Hosseini, S.F.; Ghabanchi, Z. What’s in a Color? A neuropsycholinguistic study on the effect of colors on EEG brainwaves, immediate emotional responses, and English language vocabulary retention among Iranian young adults. J. Neurolinguist. 2022, 63, 101083. [Google Scholar] [CrossRef]
- Hassib, M.; Braun, M.; Pfleging, B.; Alt, F. Detecting and influencing driver emotions using psycho-physiological sensors and ambient light. In Proceedings of the IFIP Conference on Human-Computer Interaction, Paphos, Cyprus, 2–6 September 2019; Springer: Cham, Switzerland, 2019; pp. 721–742. [Google Scholar]
- Bower, I.S.; Clark, G.M.; Tucker, R.; Hill, A.T.; Lum, J.A.; Mortimer, M.A.; Enticott, P.G. Enlarged Interior Built Environment Scale Modulates High-Frequency EEG Oscillations. Eneuro 2022, 9, 1–16. [Google Scholar]
- Schilling, T.; Sipatchin, A.; Chuang, L.; Wahl, S. Tinted lenses affect our physiological responses to affective pictures: An EEG/ERP study. In Proceedings of the 2nd International Neuroergonomics Conference: The Brain at Work and in Everyday Life, Philadelphia, PA, USA, 27–29 June 2018. [Google Scholar]
- Peacock, E.J.; Wong, P.T.P. The stress appraisal measure (SAM): A multidimensional approach to cognitive appraisal. Stress Med. 1990, 6, 227–236. [Google Scholar]
- Liu, X. Methods and Applications of Longitudinal Data Analysis; Elsevier: Amsterdam, The Netherlands, 2015. [Google Scholar]
- Horvat, M.; Dobrinić, M.; Novosel, M.; Jerčić, P. Assessing emotional responses induced in virtual reality using a consumer EEG headset: A preliminary report. In Proceedings of the 2018 41st International Convention on Information and Communication Technology, Electronics and Microelectronics (MIPRO), Opatija, Croatia, 21–25 May 2018; pp. 1006–1010. [Google Scholar]
- Carrington, A.M.; Manuel, D.G.; Fieguth, P.W.; Ramsay, T.; Osmani, V.; Wernly, B.; Bennett, C.; Hawken, S.; Magwood, O.; Sheikh, Y.; et al. Deep ROC analysis and auc as balanced average accuracy, for improved classifier selection, audit and explanation. IEEE Trans. Pattern Anal. Mach. Intell. 2023, 45, 329–341. [Google Scholar] [PubMed]
- Huang, J.; Ling, C.X. Using AUC and accuracy in evaluating learning algorithms. IEEE Trans. Knowl. Data Eng. 2005, 17, 299–310. [Google Scholar] [CrossRef]
- Abraham, A.; Pedregosa, F.; Eickenberg, M.; Gervais, P.; Mueller, A.; Kossaifi, J.; Gramfort, A.; Thirion, B.; Varoquaux, G. Machine learning for neuroimaging with scikit-learn. Front. Neuroinform. 2014, 8, 14. [Google Scholar] [CrossRef] [PubMed]
- Szczerbicki, E. Information-based integration for complex systems. In Knowledge and Information Technology Management: Human and Social Perspectives; IGI Global: Hershey, PA, USA, 2003; pp. 89–103. [Google Scholar]
- Albawi, S.; Mohammed, T.A.; Al-Zawi, S. Understanding of a convolutional neural network. In Proceedings of the 2017 International Conference on Engineering and Technology (ICET), Antalya, Turkey, 21–23 August 2017; pp. 1–6. [Google Scholar]
- Lawhern, V.J.; Solon, A.J.; Waytowich, N.R.; Gordon, S.M.; Hung, C.P.; Lance, B.J. EEGNet: A compact convolutional neural network for EEG-based brain-computer interfaces. J. Neural Eng. 2018, 15, 056013. [Google Scholar]
- Yu, Y.; Abadi, M.; Barham, P.; Brevdo, E.; Burrows, M.; Davis, A.; Dean, J.; Ghemawat, S.; Harley, T.; Hawkins, P.; et al. Dynamic control flow in large-scale machine learning. In Proceedings of the Thirteenth EuroSys Conference, Porto, Portugal, 23–26 April 2018; pp. 1–15. [Google Scholar]
- Ravanelli, M.; Bengio, Y. Interpretable convolutional filters with sincnet. arXiv 2018, arXiv:1811.09725. [Google Scholar]
- Huang, W.; Xue, Y.; Hu, L.; Liuli, H. S-EEGNet: Electroencephalogram signal classification based on a separable convolution neural network with bilinear interpolation. IEEE Access 2020, 8, 131636–131646. [Google Scholar]
- Qiao, Y.; Alnemari, M.; Bagherzadeh, N. A two-stage efficient 3-D CNN framework for EEG based emotion recognition. In Proceedings of the 2022 IEEE International Conference on Industrial Technology (ICIT), Shanghai, China, 22–25 August 2022; pp. 1–8. [Google Scholar]
- Zhu, Y.; Ozawa, K.; Kong, W. EEGNetT: EEG-based neural network for emotion recognition in real-world applications. In Proceedings of the 2021 IEEE 3rd Global Conference on Life Sciences and Technologies (LifeTech), Nara, Japan, 9–11 March 2021; pp. 376–378. [Google Scholar]
- Knez, I.; Kers, C. Effects of indoor lighting, gender, and age on mood and cognitive performance. Environ. Behav. 2000, 32, 817–831. [Google Scholar] [CrossRef]
- Ma, C.; Wang, H.; Wu, J.; Xue, C. How the Quantity and Hue Contrast of Interface Color Coding Affect Human Perception: Evidence from Two EEG Studies. Res. Sq. 2022. [Google Scholar] [CrossRef]
- Li, Y.; Zhang, S.; Yin, Y.; Xiao, W.; Zhang, J. Parallel one-class extreme learning machine for imbalance learning based on Bayesian approach. J. Ambient. Intell. Hum. Comput. 2018. [Google Scholar] [CrossRef]


| Emo-Warm | Emo-Cold | Warm vs. Cold | |
|---|---|---|---|
| LDA | 0.4213 | 0.4136 | 0.5732 |
| Spatial Filters | 0.4143 | 0.3705 | 0.5008 |
| CNN | 0.3698 | 0.2958 | 0.5567 |
| EEGNet | 0.4312 | 0.4163 | 0.7666 |
| SincNet | 0.2804 | 0.3714 | 0.5014 |
Disclaimer/Publisher’s Note: The statements, opinions and data contained in all publications are solely those of the individual author(s) and contributor(s) and not of MDPI and/or the editor(s). MDPI and/or the editor(s) disclaim responsibility for any injury to people or property resulting from any ideas, methods, instructions or products referred to in the content. |
© 2024 by the authors. Licensee MDPI, Basel, Switzerland. This article is an open access article distributed under the terms and conditions of the Creative Commons Attribution (CC BY) license (https://creativecommons.org/licenses/by/4.0/).
Share and Cite
Zentner, S.; Barradas Chacon, A.; Wriessnegger, S.C. The Impact of Light Conditions on Neural Affect Classification: A Deep Learning Approach. Mach. Learn. Knowl. Extr. 2024, 6, 199-214. https://doi.org/10.3390/make6010011
Zentner S, Barradas Chacon A, Wriessnegger SC. The Impact of Light Conditions on Neural Affect Classification: A Deep Learning Approach. Machine Learning and Knowledge Extraction. 2024; 6(1):199-214. https://doi.org/10.3390/make6010011
Chicago/Turabian StyleZentner, Sophie, Alberto Barradas Chacon, and Selina C. Wriessnegger. 2024. "The Impact of Light Conditions on Neural Affect Classification: A Deep Learning Approach" Machine Learning and Knowledge Extraction 6, no. 1: 199-214. https://doi.org/10.3390/make6010011
APA StyleZentner, S., Barradas Chacon, A., & Wriessnegger, S. C. (2024). The Impact of Light Conditions on Neural Affect Classification: A Deep Learning Approach. Machine Learning and Knowledge Extraction, 6(1), 199-214. https://doi.org/10.3390/make6010011