Article

FCIoU: A Targeted Approach for Improving Minority Class Detection in Semantic Segmentation Systems

1
Department of Electronics (DOE), Carleton University, Ottawa, ON K1S 5B6, Canada
2
Department of Systems and Communication, Carleton University, Ottawa, ON K1S 5B6, Canada
*
Author to whom correspondence should be addressed.
Mach. Learn. Knowl. Extr. 2023, 5(4), 1746-1759; https://doi.org/10.3390/make5040085
Submission received: 18 October 2023 / Revised: 14 November 2023 / Accepted: 21 November 2023 / Published: 23 November 2023
(This article belongs to the Section Learning)

Abstract

:
In this paper, we present a comparative study of modern semantic segmentation loss functions and their resultant impact when applied with state-of-the-art off-road datasets. Class imbalance, inherent in these datasets, presents a significant challenge to off-road terrain semantic segmentation systems. With numerous environment classes being extremely sparse and underrepresented, model training becomes inefficient and struggles to comprehend the infrequent minority classes. As a solution to this problem, loss functions have been configured to take class imbalance into account and counteract this issue. To this end, we present a novel loss function, Focal Class-based Intersection over Union (FCIoU), which directly targets performance imbalance through the optimization of class-based Intersection over Union (IoU). The new loss function results in a general increase in class-based performance when compared to state-of-the-art targeted loss functions.

1. Introduction

In vision-based off-road terrain segmentation, imbalanced datasets present a significant obstacle for the adequate training of models which completely encompass all terrain classes. In modern driving datasets, the distributions of class labels are highly imbalanced resulting in a subset of classes appearing considerably more often leading to a “class imbalance” problem. In some cases such as the Rellis-3D outdoor dataset, four specific classes account for roughly 94% of total labeled pixels [1]. Other off-road and urban driving datasets feature similar distributions [2,3,4]. The presence of imbalanced class distributions lead to reduced model effectiveness, particularly for the very infrequent minority classes.
As models are predominantly trained through incremental corrective adjustments based on measured performance, sparse exposure to minority classes may bias training to favor majority class detection. In extreme cases, sparse exposure may lead to models ignoring the presence of minority classes entirely. To ensure the robustness of segmentation systems and to allow for a comprehensive solution to be developed, the training process and model must be resilient to imbalanced data distributions.
When considering the class imbalance problem, it presents itself in two main manners: (1) in the imbalanced distribution of occurrence frequency for a class pixel within a specific image, and (2) in the imbalanced occurrence of a class within each image in the dataset. Manner (1) occurs when the total amount of pixels pertaining to the majority classes greatly outnumber the minority classes. This imbalanced pixel distribution is readily seen when examining pixel label distributions of major driving datasets [1,2,3,4]. The second manner involves the frequency presence of each class within the set of dataset images. Since the more frequent classes are generally present in most if not all images, the model is more often exposed to them resulting in increased net influence. To remedy these issues, numerous approaches have been suggested in the contemporary literature. These approaches can be divided into two main types: data-level, and algorithmic-level methods [5].
As class imbalance is a direct byproduct of infrequent class data occurrence within the dataset, a logical approach is to equalize the distribution of data prior to its use in model training [5]. Data-level methods such as data augmentation provide a logical manner of increasing the overall presence of minority classes in training sets. Applying transformations to images containing the minority classes to generate synthetic data points results in some glaring issues, however. Since the new data generated forms new versions of past images, the resulting data will remain imbalanced overall or no longer accurately represent the desired training environment.
Rather than altering the dataset, algorithmic-level methods specifically target class imbalance and related effects through alterations to the standard training algorithm(s). A particularly popular subset of these being the modification of the loss/objective function used during training. To ensure that the model is not over-trained on majority class data, specialized loss functions counterbalance the influence of majority classes by increasing the impact of minority classes during training. The resulting advantage to this approach thereby being the reduction in both training time and the overall increase in achieved model performance. In the most extreme cases, this may allow models to detect priorly undetected classes as they become increasingly sensitive to them. These tailored loss-function approaches are found to be rather effective in increasing model performance within imbalanced environments [5,6]. As loss functions are extremely varied, we have set out to detail and apply them to our specific use-case environment.
The application of semantic segmentation to terrain segmentation has become increasingly widespread and developed greatly in recent years. Surveys such as [7,8,9] provide detailed overviews of current models and approaches for semantic segmentation on off-road environments. These surveys, however, mainly focus on the design aspects such as model architecture and datasets, but do not consider class imbalance as well as possible approaches which remedy this issue.
Research surveys assessing and comparing loss function performance in imbalanced datasets has been published, but mainly focus on the medical imaging field [6,10]. The task of medical image segmentation suffers from the same issues of class imbalance as off-road terrain segmentation. Generally, medical images contain large areas entirely representing a single class (such as the background class). In Jadon et al. (2020), a study was conducted comparing the results of training with nine different loss functions on the segmentation of the NBFS Skull Stripping Dataset [11]. The survey by Ma et al. (2021), then expanded upon this work, presenting 20 different loss functions and comparing their performance when employed on four different medical image segmentation datasets [6]. These surveys both highlighted the potential impact the loss function can have on the resulting model performance. With some loss functions resulting in considerably greater performance when compared to others. As the problem faced in off-road terrain segmentation is extremely similar, these surveys have formed the basis for the selection of loss functions which will be evaluated within this publication.
To our knowledge, no prior work concerning the performance comparison of loss functions in off-road environments has yet to be published. Therefore, in this paper, we provide the following contributions:
  • We present a study of current loss functions tailored to solving class imbalance issues.
  • With the aforementioned loss functions, we train, evaluate, and compare their performance when applied on the Rellis-3D off-road dataset.
  • We present a novel loss function FCIoU which aims to further reduce the impact of class imbalance.

2. Loss Functions

The use of loss functions to counterbalance against class imbalance is widespread within the semantic segmentation literature [12,13,14,15,16,17,18]. As the objective function dictates the direction that the model will be optimized, the loss function can be tailored to better target minority classes. Implementations of each loss function vary greatly but, in general, tend to be variations of currently existing and proven semantic segmentation loss functions such as the dice loss [19], cross-entropy (CE) loss, or intersection over union (IoU) loss [20] functions. The counterbalancing of pre-existing loss functions generally occur either by (1) indirectly targeting class imbalance through increasing the impact of individual poorly performing pixels [12,13,17,18], or (2) by applying a general weight to each class with the aim of increasing the overall loss generated by minority classes [15,16]. In this section, a detailed description of each loss function contained within this study is provided.

2.1. Cross-Entropy (CE) Loss

The cross-entropy (CE) loss function is a distribution-based loss function which has seen widespread utilization and has grown to become the de-facto standard for semantic segmentation tasks. CE loss measures the dissimilarity between the prediction and ground-truth probability distribution as described in Equation (1):
L C E = 1 N c = 1 C i = 1 N g i c log s i c
where c represents a specific class within the entire set of classes C, i represents a specific pixel instance within the set of all pixels N , g represents the ground-truth annotation label values (either 0 or 1), and s i c [ 0,1 ] represents the probabilistic prediction output for the model defined as:
s i c = P p i c     I ,   N ,   C )  
s i c therefore, represents the conditional probability that the specific pixel p i in image I is part of the associated class c . The probability value is obtained from the model output by applying the softmax function across every class. As can be inferred, the loss function only returns a non-zero value for the specific active class of the pixel where g i c = 1 . Therefore, only the prediction score for the ground-truth class label value contributes to the loss measured.
The CE loss function, however, does have a particularly large downside when being employed with an imbalanced dataset. This downside is due to the underlying assumption made that the target distribution is balanced and evenly distributed. This leads to the loss function evaluating each pixel prediction evenly compared with others. As the majority classes appear in a considerably larger quantity of pixels, those classes generate a much greater portion of the total loss calculated for the system. As model training is tied to the scores generated, the CE loss function will indicate increased performance mainly when the majority class predictions are effective.
To prevent this, variations of the CE loss function have been developed to counterbalance the loss function to favour the low-performing minority classification methods. The simplest of these approaches, known as the weighted CE (WCE) loss function is configured to assign an array of static weights ( w c ) for each class as defined by:
L W C E = 1 N c = 1 C i = 1 N w c g i c log s i c
Examples of the use of this function can be seen in [15]. This approach, in general, is not efficient, both in training optimization and training hyper-parameter tuning. Since the weights are manually configured, determining the best weights to employ can be a time-intensive laborious process which may require several iterations to determine. Additionally, initializing with the wrong weights will result in inefficient or ineffective training. In Jun et al., a 2021 survey comparing loss functions, the weighted cross entropy method scored the lowest performance consistently when compared to other methods [6].
For the purposes of this study, only the base CE loss function will be employed as a baseline evaluation of the model’s performance. As the de facto standard loss function, the CE loss will serve as the point of comparison for the other loss functions which are tailored to handling class-imbalance.

2.2. Focal Loss

To avoid the issues inherent with assigning static weights, other methods such as the focal loss [12] employ dynamic weighting for each pixel instance based on the pixel’s prediction certainty ( s c i ) and is represented by:
L F o c a l = 1 N c = 1 C i = 1 N 1 s i c γ g i c log s i c
The weighted term is therefore configured to be inversely proportional with the prediction value. A lower prediction score s i c [ 0,0.5 ] will result in considerably larger loss than the higher prediction values. This will provide a general increase in the prediction accuracy for all samples and will indirectly aid in strengthening performance towards minority classes. An additional focusing parameter γ is present to increase the overall impact of low predictions. For the purposes of the evaluation of the focal loss, the focusing parameter value of γ = 2 will be used as it was determined to be the most effective in associated research [6,12].

2.3. Dice Loss

The dice loss operates by minimizing the dice coefficient metric [21]. Since the dice coefficient is already employed to provide a measure of system performance [10], this implementation presents an extension for the overall process. The dice loss measures the completement (1 − score) of the dice score as follows:
L D i c e = 1 2   c = 1   C i = 1   N g i c s i c c = 1   C i = 1   N g i c + c = 1   C i = 1   N s i c
The main advantage of the dice loss function and similar region-based loss functions, when compared to distribution-based loss functions, is how they are inherently indifferent to the number of pixels present in the image. This is due to how the function calculates a ratio ( [ 0,1 ] ) representing how closely tied the prediction region is with the ground-truth region. Therefore, the quantity of samples is irrelevant when calculating the value as only a relative metric is being obtained.

2.4. Tversky Loss

The Tversky loss [18] is a variant of the dice loss that disproportionately penalizes false negative predictions which tend to occur more frequently in imbalanced cases and is defined by:
L T = 1 c = 1 C i = 1   N g i c s i c α c = 1 C i = 1   N ( 1 g i c ) s i c + β c = 1   C i = 1   N g i c ( 1 s i c )  
With the α and β being hyper-parameters which control the level at which false positives and false negatives are factored into the loss, respectively. For the purposes of the study, the values of α = 0.3 and β = 0.7 are used as was recommended in the original literature [18].

2.5. IoU (Jaccard) Loss

The intersection over union (IoU) loss function employs a similar method to dice loss by converting a well-known performance metric, the IoU/Jaccard score, into a loss function. Since the IoU score has become commonplace in measuring the performance of semantic segmentation systems [22,23,24], its conversion into a loss function enables direct optimization of performance metrics in a manner similar to dice loss:
L I o U = 1 c = 1 C i = 1   N g i c s i c c = 1 C i = 1   N ( g i c + s i c g i c s i c )

2.6. Power Jaccard

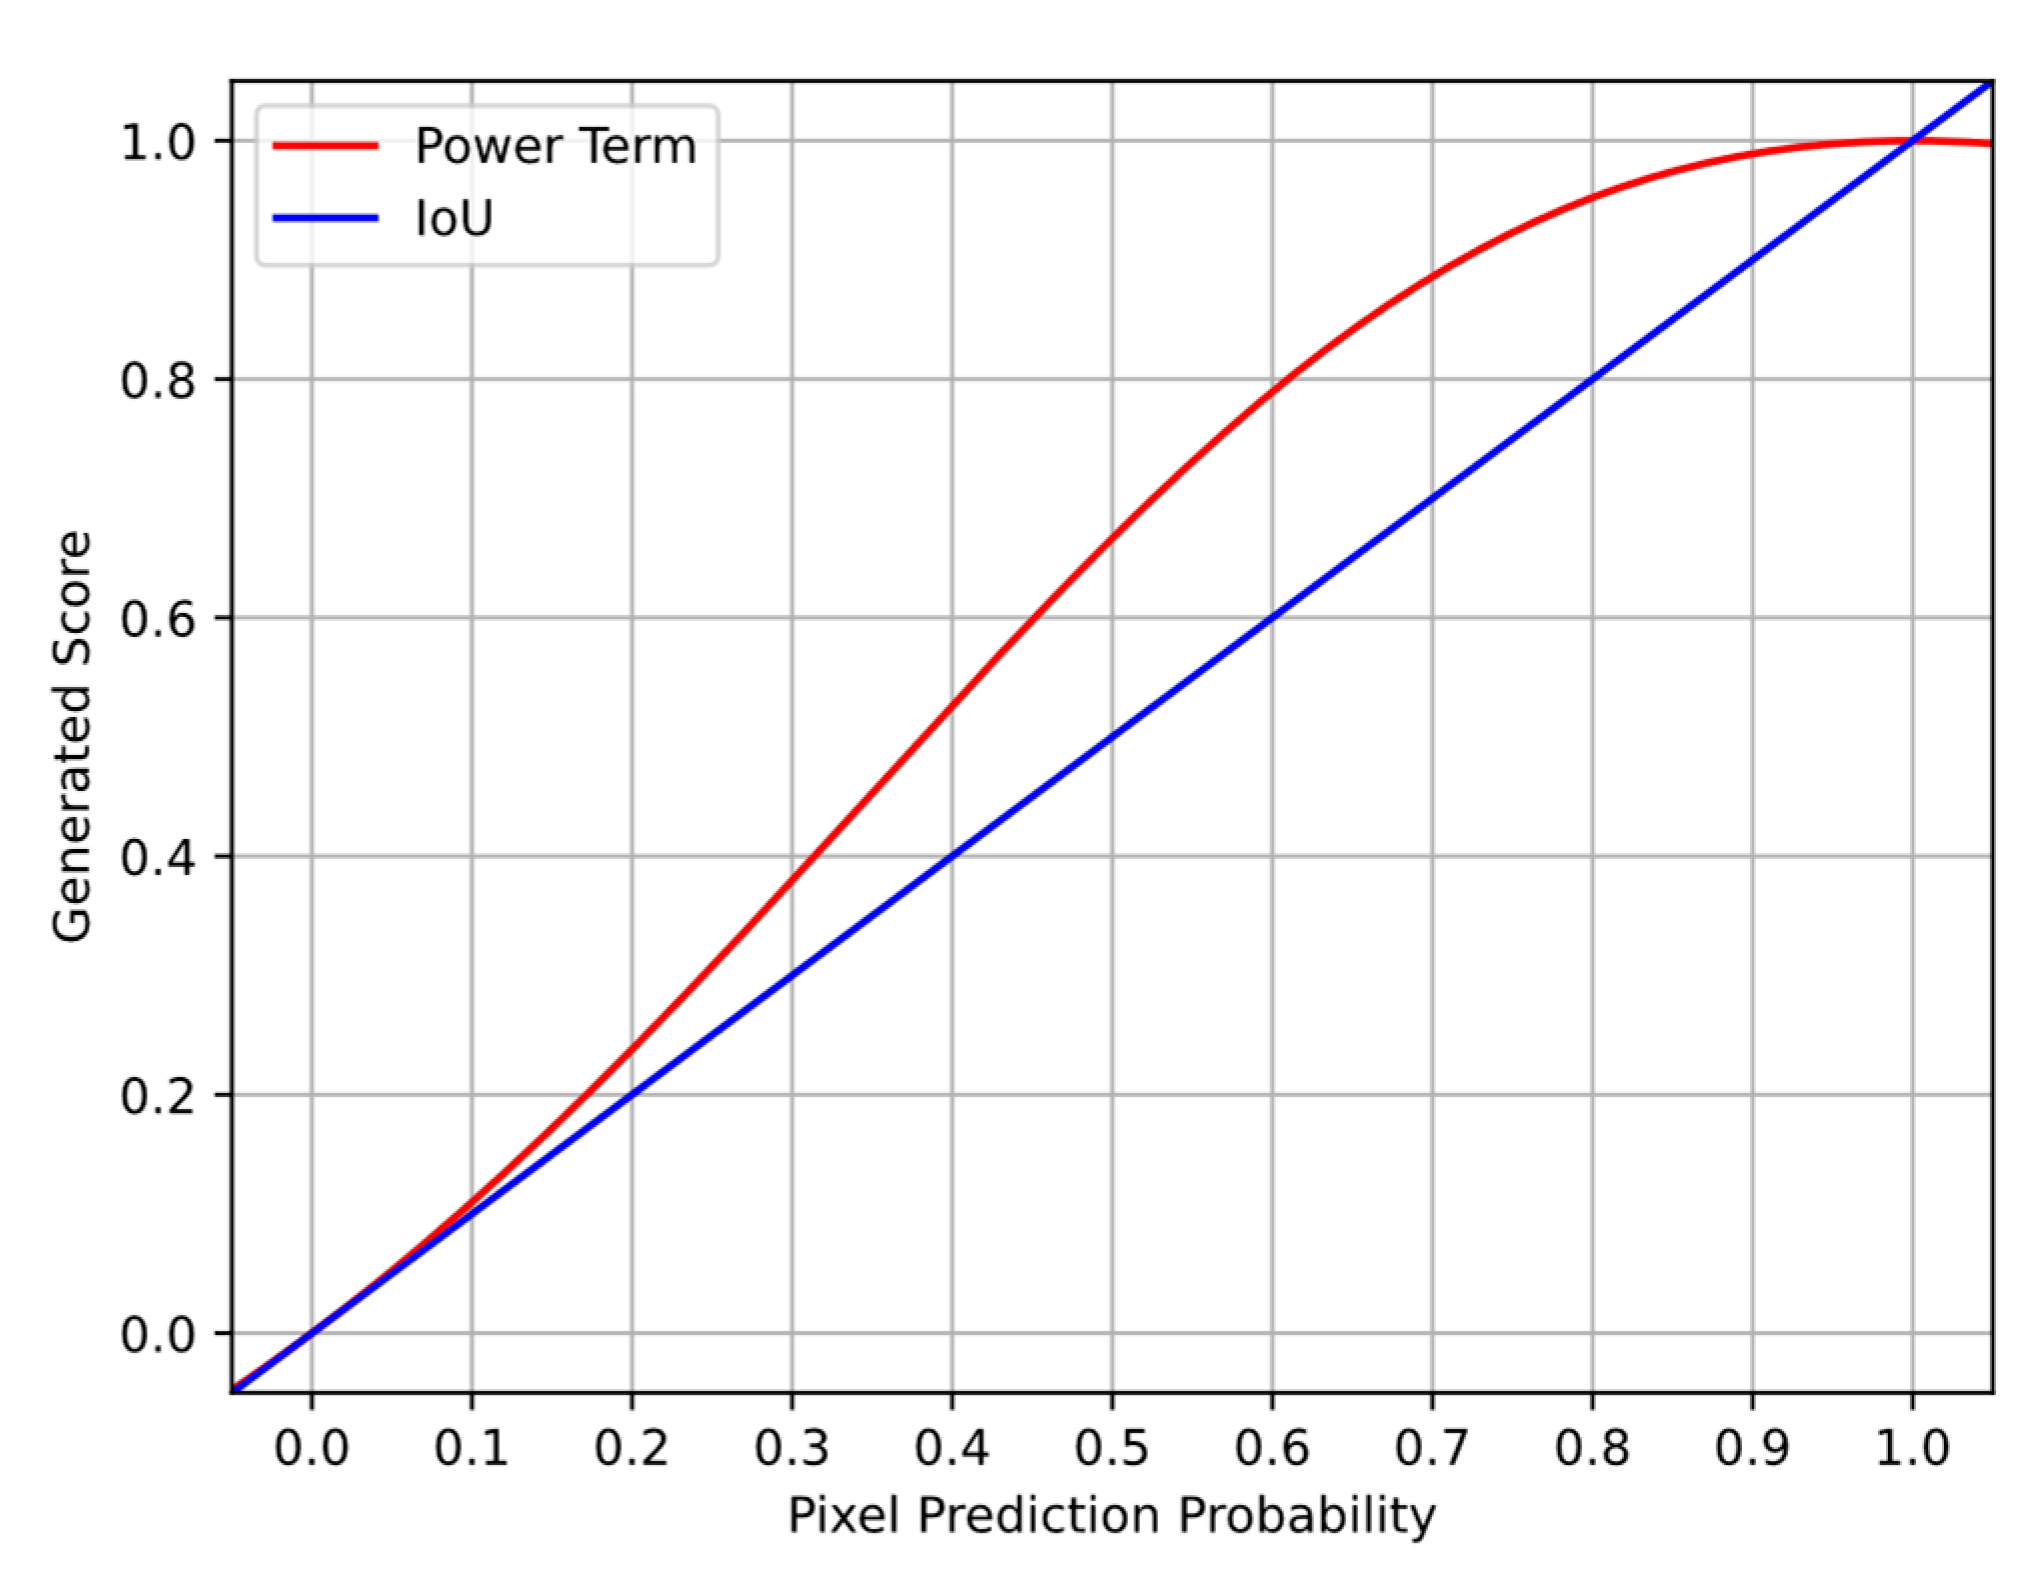
In a manner similar to focal loss, the power Jaccard loss function uses dynamic weighting to improve the segmentation ability of the IoU loss function [17] as shown in Equation (8).
L P J = 1 c = 1 C i = 1   N g i c s i c c = 1 C i = 1   N g i c p + s i c p g i c s i c
The power Jaccard function modifies the IoU score calculation formula through the new power term p applied to the prediction and ground-truth values in the denominator. The addition of the power term results in the reduction of influence high certainty predictions have on the overall loss thereby increasing the impact of the minority classes. As was found in the associated literature paper, the value of p = 2 resulted in optimal performance and is used within this survey.

2.7. Compound Loss Functions

Compound loss functions employ combinations of several loss functions to benefit from the individual advantages of each component loss functions. Component loss functions can thereby target different aspects of model training concurrently. This approach has come across a large quantity of success. In the loss function comparison survey by Jun et al. (2021), the combination loss functions consistently obtained the highest performance when compared to their counterparts [6]. Out of all the compound loss functions presented in that study, the DiceTopK and DiceFocal loss functions obtained the best results and are included within this study.

2.8. DiceFocal Loss

The DiceFocal loss is the combination of the dice loss function and the focal loss function. The resulting loss from this function is calculated as follows:
L D F = L D + L F

2.9. DiceTopk Loss

Another variant of a dice-based combination loss is the DiceTopk loss which combines the Topk loss function with dice loss. The TopK loss function itself is a variant of the cross-entropy loss function where only a subset, typically examples where the model struggles the most, is considered when calculating the loss. The resulting loss function forces the optimizer to increasingly focus on hard samples. TopK loss selects its top “k” amount loss by either: (1) retaining the pixels with probability values below a set threshold value, and (2) retaining the top k percent of worst loss generating samples [6]. For the purposes of this study, the Topk approach where k = 10 % of the worst performing samples is utilized due to its comparatively higher performance than other iterations [6]. The Topk (k = 10%) loss function utilized during the study is described in Equation (10):
L T k = 1 N c = 1 C i K g i c l o g s i c
where K represents the set of k % worst pixels. The DiceTopK compound loss function is then calculated by:
L D T k = L D + L T k

3. Proposed Loss Function

FCIoU (Focal Class-Based Intersection over Union)

We propose the FCIoU (Focal Class-based Intersection over Union) loss function as a novel method of treating class imbalance. In line with the state-of-the-art literature, this new loss function is tailored to counterbalance the detrimental effects of class imbalance through the dynamic weighting of the IoU loss. As the effects of class imbalance manifest themselves most visibly when examining class-based IoU scores, our aim is to optimize the model to best improve the overall score obtained for each class. In doing so, we aim to directly target the root issue within class imbalance. The class based IoU formulation for the specific class c is represented by:
I o U c = i = 1 N s i c g i c i = 1 N s i c + g i c s i c g i c
Examining the class based IoU scoring is insufficient due to the inherent imbalanced class presence distribution. With this in mind, our main approach generates a class-based counter balancing function which advantages the worst performing (minority) classes. To achieve this, a loss-shaping function was used to convert the measured IoU scores into loss values favouring the worst-performing classes. This loss-shaping function is applied to each measured class IoU scores individually and is defined as:
f L s h a p i n g = log 10 I o U c   0.5  
The negative log function was selected as the basis of the loss-shaping function due to its shape favouring low IoU score values as shown in Figure 1.
Accordingly, the classes which obtained lower overall performance scores ( x [ 0 , 0.4 ] ) contribute the most to the generated loss. Additionally, the contribution of the loss generated is greatly reduced for the higher performing classes ( x [ 0.7 ,   1 ] . The optimizer is thereby incentivized to target the greater loss-generating minority classes.
The first iteration of the full implementation of the FCIoUv1 loss function is formulated as:
L = c = 1 C log i = 1 N s i c g i c i = 1 N s i c + g i c s i c g i c 0.5  
As will be demonstrated in the obtained results, the initial formulation of the new loss function presented some issues. Although the model did demonstrate a willingness to learn minority classes, the resulting segmentation was found to be too smooth and generalized leading to a homogenized output. Fine details were not being captured by the segmentation model. Therefore, the sole application of weight corrections to the class based IoU scores did not allow for low-level fine segmentation to occur.
To improve low-level segmentation, a loss factor considering the individual pixels was further introduced. This provided a special focus on the pixel-level definition particularly for the low-prediction scores. For this task, we chose to employ the same approach as the power Jaccard [17] loss function and modified the calculation of the IoU metric at the pixel-level. This was carried out by applying a power factor of two to the denominator prediction score. The difference in how the power term impacts the IoU measurement for a single sample is seen between the red (new power-term) and blue (regular IoU) functions represented in Figure 2.
Higher performing pixel predictions therefore return a, respectively, larger performance value than if normal IoU measurement was performed. The result being that the lowest valued predictions generate a much greater amount of loss. The training optimizer is then incentivized to focus on the lowest performing cases, thereby increasing performance at the pixel level. The resulting version, referred to as FCIoUv2 is formulated as:
c = 1 C log i = 1 N s i c g i c i = 1 N s i c 2 + g i c s i c g i c 0.5  
The result is a loss function which targets class-imbalance and considers both general class-based and pixel-level performance.

4. Methodology

4.1. Dataset

The comparative study was completed using the Rellis-3D off-road semantic segmentation dataset [1]. The dataset provides one of the most comprehensive collection of annotated terrain segmentation image [8] and is considered to be highly imbalanced [1]. For the purposes of training and performance evaluation, the training and testing image set provided by the Rellis-3D research team was employed. The imbalanced class distribution is demonstrated in Figure 3, which displays the image label–pixel distribution for the Rellis-3D training image set.
As represented in Figure 3, the pixel–label distribution within the Rellis-3D training image set is highly imbalanced with the majority grass, sky, tree, and bush classes comprising the majority of pixels within the training set. The remaining minority classes consist only a small subset of the training set, being one to two orders of magnitude smaller than the majority classes. A subgraph is included within the figure to better contrast the presence of minority classes. As demonstrated, the minority classes do not exhibit an equal distribution, with some classes appearing more frequently than others. As shown in the figure, a clear imbalance in the distribution of pixels is present within the dataset.
The Rellis-3D dataset, in total, contains 20 classes each of which representing a distinct aspect or object contained within the off-road environment. With the dataset being considerably imbalanced, it is therefore expected that the model performs best when predicting the four majority classes (grass, sky, bush, and tree). For the minority classes, a significant deterioration in performance is expected with the least frequent fence, building, object, and pole classes being the most impacted.

4.2. Model

For the comparison of the loss functions, a modified version of the U-Net [25] tailored to operate on the Rellis-3D dataset was employed. The U-Net was selected due to its proven effectiveness and overall simplicity. As was carried out in [6], we selected the U-Net to reduce the possible impact of other unexamined factors on loss function performance. With the goal being of directly examining and comparing the resulting performance of loss functions. Since the U-Net struggles with handling highly imbalance datasets, the improvement in performance will be in majority due to the loss function itself. The resulting effect of the loss function will therefore be tangible and readily examinable.
Since the U-Net was designed to operate on another dataset [25], the model had to be resized to function on the larger Rellis-3D images. The new U-Net was resized to input the full image and output an equal-size prediction. This was carried out through the addition of padding to the input images to retain the original size. Due to memory constraints, the channel depth for each layer was reduced to half of its original size to allow for training to occur. The parameters for the original and new U-Net are specified in Table 1.

4.3. Training Process

Model training was completed over the period of 10 epochs. For training, the pre-built training set provided by the Relli-3D team was employed [26]. Through iterative testing, it was determined that the initial learning rate value of l r = 1 × 10 5 was optimal and presented the best rate for effective learning. To enable finer precise learning, the PyTorch learning rate scheduler ReduceLROnPlateau [27] was employed to update the learning rate based on the minimum loss value obtained during the previous epoch. If the measured loss never reduced further than the previously minimum measured value, the learning rate was reduced by a applying a factor of 0.1 . The use of the adaptive loss allowed for training of finer model details to be performed without the need for manual modifications.

4.4. Performance Metrics

For performance comparison, class based IoU ( I o U c ), the mean IoU (mIoU), and the dice score index were measured for each sample image. The average value of all sample image scores were then calculated for comparison. The formal representation of these metrics are defined in Equations (16)–(18), respectively:
I o U c = i = 1 N s i c g i c i = 1 N s i c + g i c s i c g i c
m I o U = 1 N c c = 1 C I o U c
D i c e = 2 T P 2 T P + F P + F N
These metrics were chosen to represent the multiple facets that must be considered when handling a highly imbalanced environment. Both the general performance of the model as well as the class-based performance are being measured. The dice score employs the general performance approach by measuring the quantity of overlap between the ground-truth and prediction segmentation regions thereby measuring how closely the prediction matches the ground truth map. The class-based IoU, on the other hand measures the resulting performance individually for each class thereby providing an effective measurement of the performance of class-imbalance counterbalancing methods. Finally, the mIoU is calculated to represent the mean levels of performance for each class thereby providing a single point of comparison between loss functions.

5. Results and Comparison

This section contains the results obtained through the comparative study. Since the dirt and void class are sparsely presented, they will not be used for the performance analysis as was carried out in the original Rellis-3D publication [1]. For the evaluation process, the test set provided by the Rellis-3D team was employed. This provided a targeted sample set which covered all classes within the dataset. The scores obtained for each metric were obtained for each image sample and averaged to represent a generalized view of the results.
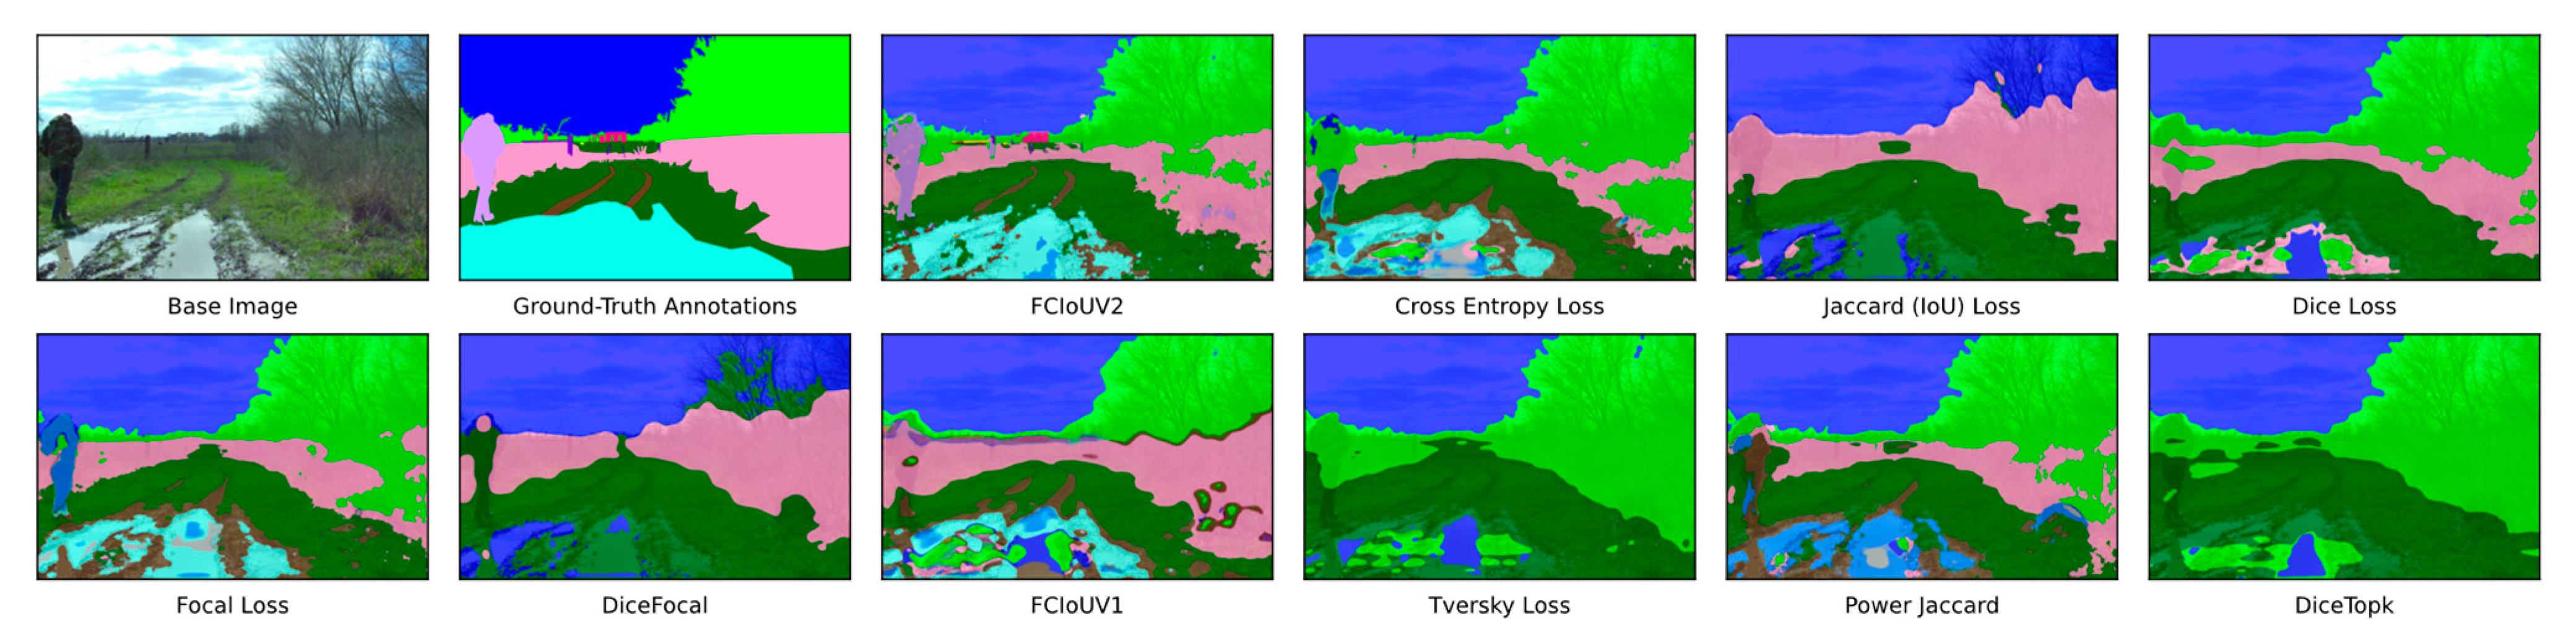
A visual representation of the single same image prediction obtained by models trained using each loss function is shown in Figure 4. The base image and its accompanying ground-truth annotation image are additionally provided for reference.
As shown in Figure 4, each loss function performed with varying levels of success. In general, the majority classes predictions are effective with corresponding areas of influence being well defined. Most loss functions, however, struggled greatly with the detection of the minority building and person classes which are represented in red and purple, respectively. Of the 10 loss functions, only the FCIoUV2 loss function resulted in the detection of both these minority classes demonstrating its effectiveness.
Indicated in Table 2, the overall mIoU loss obtained by the various loss functions remained consistently low and are in stark contrast to the high performance (>0.75) values obtained for the dice score. This difference demonstrates the disparity in performance due to the imbalance class distribution. The large dice score values are the result of the general measurement of the overlap between prediction and ground-truth segmentations for each image. As the model performs generally well at predicting the majority classes, the resulting dice score remains high as most of the image (~75–90%), the majority classes, is rightfully being detected. The resulting ~10–25% of the area is, however, typically attributable to the minority image classes. As the model struggles to classify these minority classes, the mIoU metric remains much smaller. Since each class is being equally weighed when calculating the mIoU, the resulting score is considerably lower than the dice metric.
As indicated in Table 2, our FCIoUv2 performs best in both the mIoU and dice score metric. These are then closely followed by the focal loss and CE loss functions. The results indicate a noticeable improvement in performance when targeted loss functions are employed. The performance values obtained for the majority and minority classes are represented in Table 3 and Table 4, respectively.
The loss function prediction performance for majority classes remains generally stable with each loss functions resulting in a similar set range of values. In extreme cases, however, some of the majority classes were not detected resulting in a zero measured performance. Out of the four majority classes, the sky and grass classes performed considerably better followed by the tree and bush classes. Interestingly, the two best performing classes (sky and grass) are accordingly the most numerous classes in the dataset as shown in Figure 3. This indicates a distinct correlation between class-based performance and class-label occurrence frequency even for majority classes.
The minority class performance, as shown in Table 4, did not exhibit a similar stability instead featuring a considerable portion of class performance with a near zero score. These results directly represent the potential impact of imbalanced datasets on model performance. The most negatively affected classes being the most infrequent building, log, and object classes thereby indicating a definitive link between model performance and class frequency. Out of all the of loss functions presented, only the FCIoUV1 and FCIoUV2 function obtained an above zero, albeit quite small, score for all classes thereby demonstrating the effectiveness of a targeted class-based IoU loss function approach. Of the two, the FCIoUV2 loss function greatly outperformed the FCIoUV1 loss function for almost all classes.
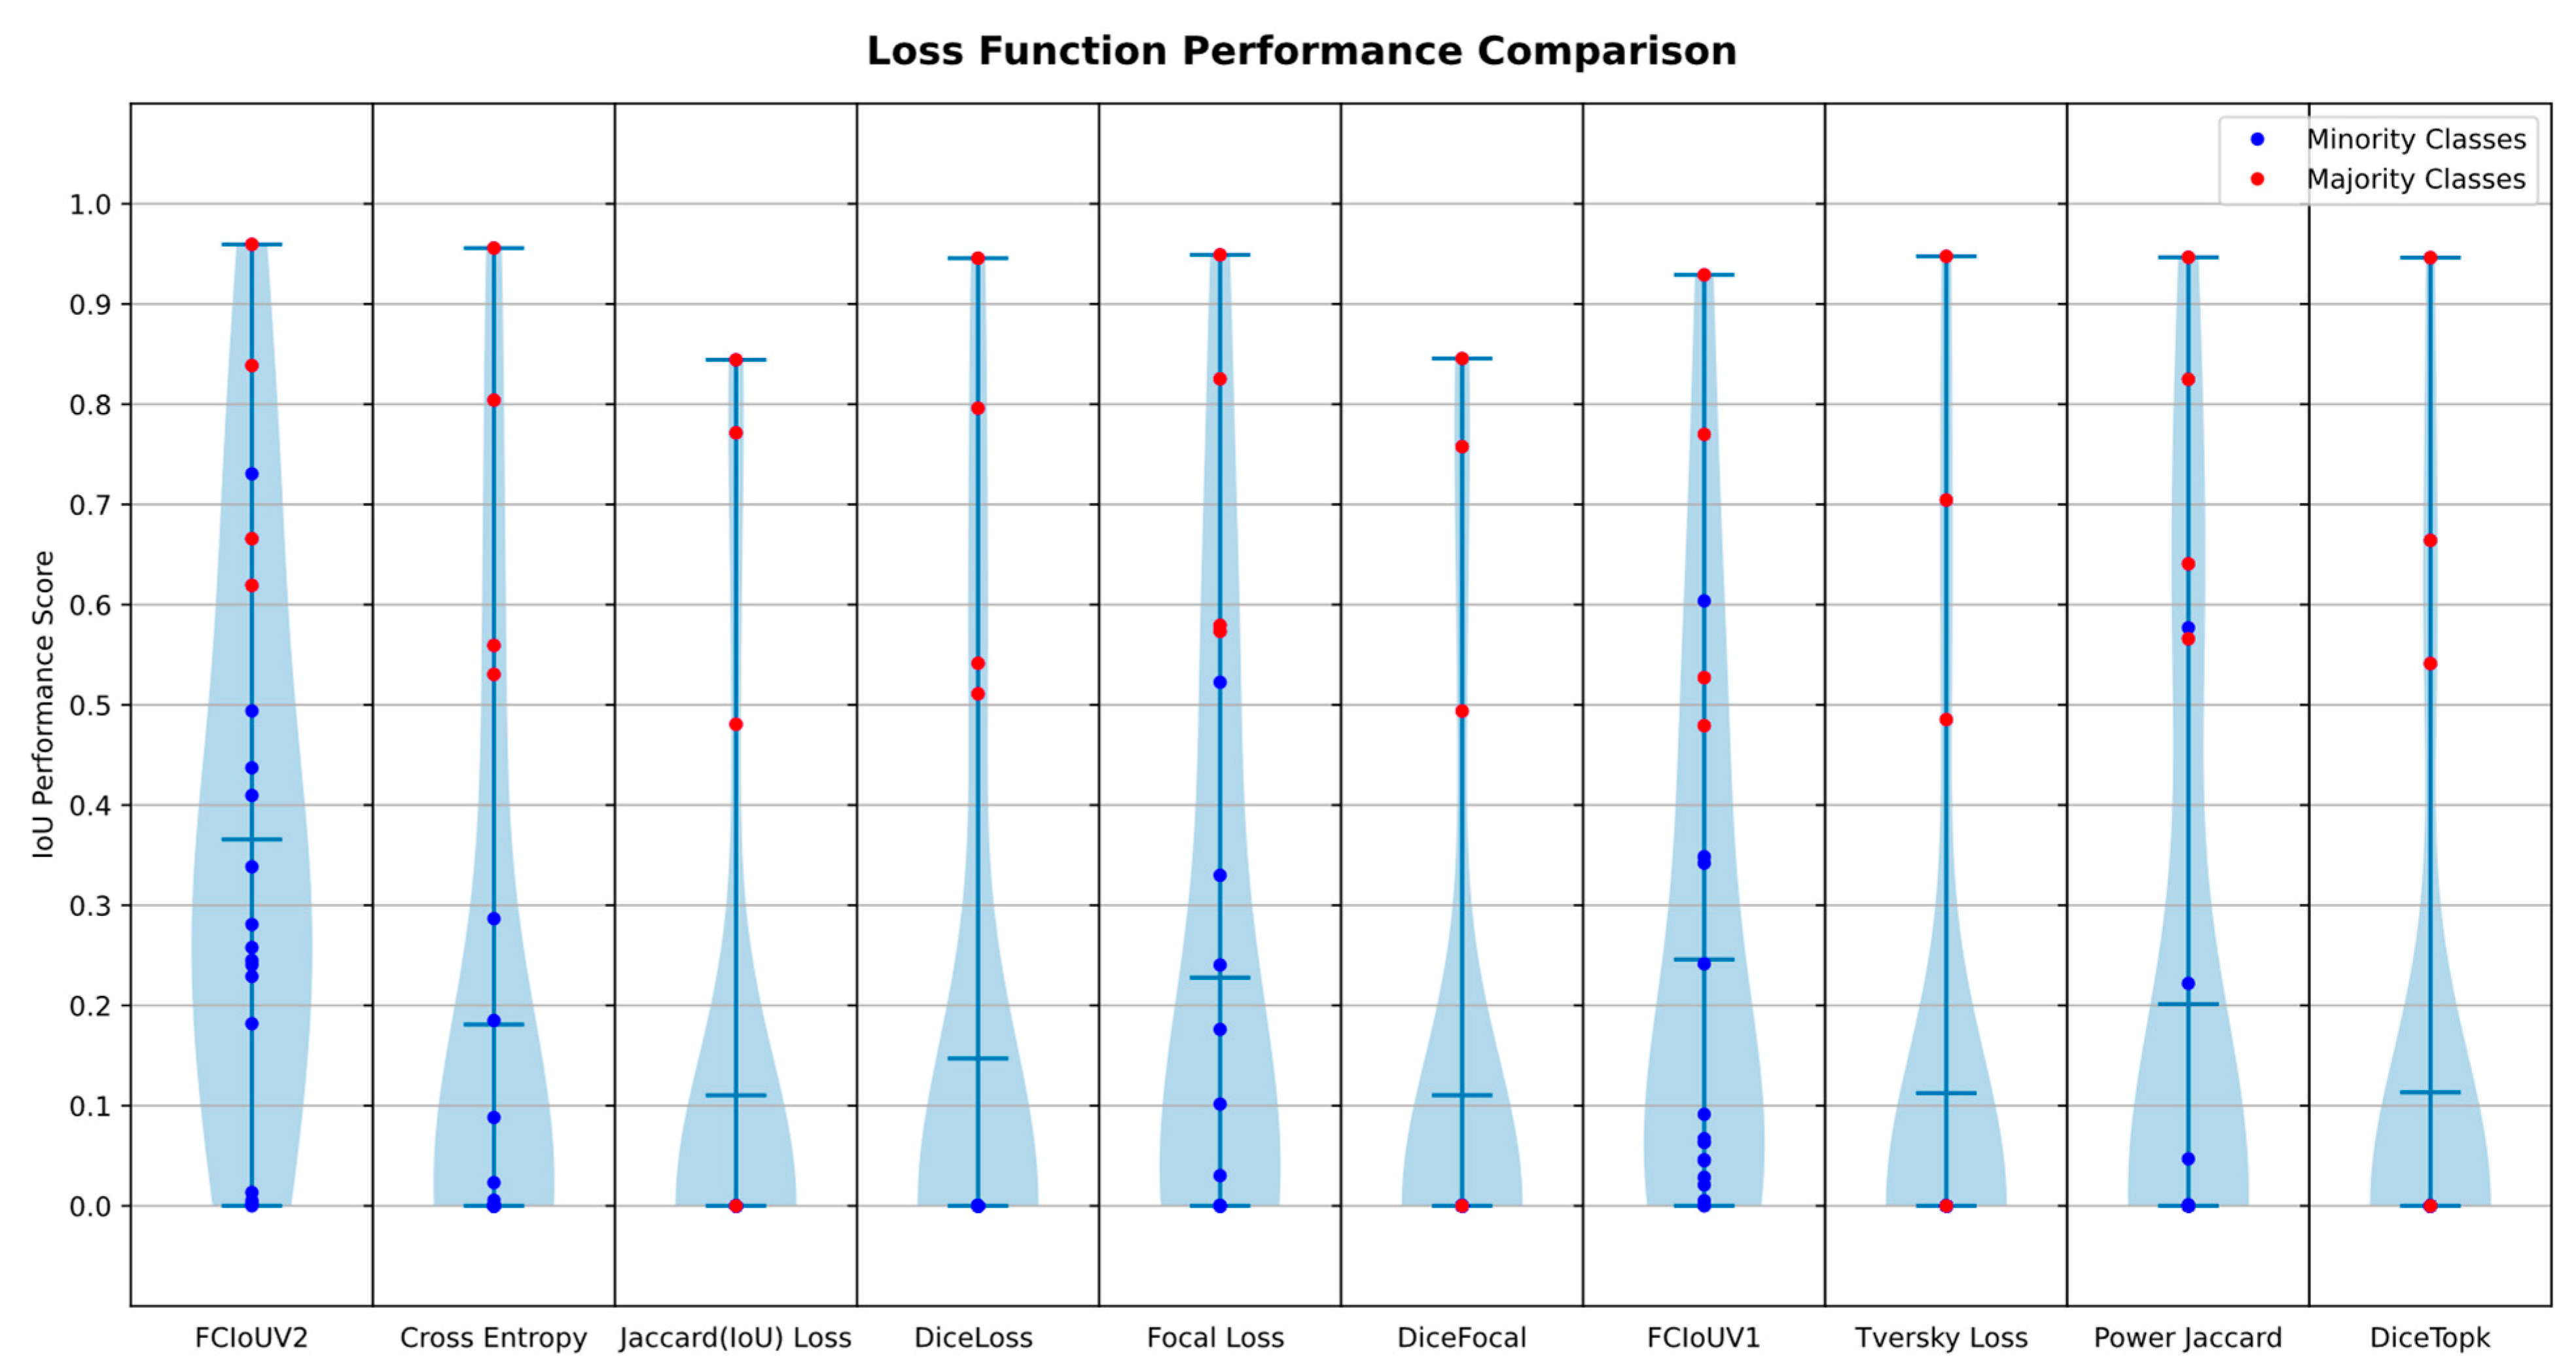
A visualization of the class-based performance results tabulated in Table 3 and Table 4 is presented within the violin plots shown in Figure 5. The differences between the achieved classification performances for each loss function alongside the stark disparity in performance between majority and minority classes is evident within the plots. Figure 5 is divided into separate columns per each loss function. Within each column, the resulting IoU scores for the Rellis-3D terrain classes (excluding the dirt class) are represented with circles, with majority and minority classes indicated in red and blue, respectively. The mean IoU (mIoU) score, being the average IoU score obtained for each class for the given loss function is indicated by the blue horizontal bar in each column. Furthermore, the distribution of IoU scores is further represented through the blue outlining regions surrounding the center vertical line. These distributions are obtained through kernel density estimation (KDE) and represent the relative empirical distribution of class results near the specified IoU performance score.
As was expected, the majority classes are shown to perform considerably better than their minority class counterparts. The minority classes, on the other end, performed quite poorly thereby shifting the performance distributions downwards and centering them near zero. Only a few of the loss functions did not directly exhibit this behaviour, with the focal loss, FCIoUV1, power Jaccard, and FCIoUV2 loss function exhibiting a raised distribution due to greater minority class scores. The FCIoUV2 featured the best performance distribution, with the center point of the distribution being raised to near ~0.3 IoU.
The FCIoUV2 loss function was found to perform best overall and featured the greatest performance for both majority and minority classes. The distribution represented in Figure 5 demonstrate that the FCIoUV2 loss function met its intended goal of focusing the model’s attention on minority class detection while preserving majority class detection performance. Therefore, the FCIoUV2 was found to be an effective method of mitigating the impact of class imbalance on model performance.

6. Conclusions

In this work, we highlighted the importance of proper loss function selection towards negating the adverse effects of class imbalance. We surveyed 10 different loss functions and evaluated their performance when applied on a common segmentation model (U-Net) in an off-road environment. Additionally, we presented a novel loss function, the FCIoU loss function, which directly targeted and optimize model performance to counterbalance the impact of class imbalance.
Of the selection of loss functions, the FCIoUv2 was found to have performed the best, followed by the focal loss function and the FCIoUv1 loss function. This improvement in performance highlighted the importance of considering class imbalance when selecting loss functions. The targeted approach towards the optimization for class-based IoU loss and the counterbalancing to account for class-imbalance was found to greatly improve overall segmentation. Additionally, the difference in performance between v1 and v2 of the loss function demonstrates the importance of considering the loss at the pixel level rather than solely at the class-based level. This scope refinement greatly increased the homogeneity of the prediction class distribution, thereby allowing the smaller minority classes to be more readily detected.
In future works, we recommend further research into other possible loss-shaping functions. As this research did not go in depth into the wide variations of loss-shaping functions, other options could result in even greater performance increase. Additionally, a more in-depth comparative study concerning a wide array of different models and loss functions would allow for a more comprehensive examination of the impact of loss functions on system performance. We additionally recommend that the FCIoUv2 loss function be implemented in the training state-of-the-art off-road semantic segmentation systems. The benefits of implementing the FCIoUv2 will improve the performance of current semantic segmentation approaches.

Author Contributions

Conceptualization, J.P.; methodology, J.P.; software, J.P.; validation, J.P.; investigation, J.P.; data curation, J.P.; writing—original draft preparation, J.P.; writing—review and editing, J.P., M.A. and H.C.; visualization, J.P.; supervision, M.A. and H.C. All authors have read and agreed to the published version of the manuscript.

Funding

The publication of this research is funded by the NSERC Discovery research grant (ID RGPIN-2017-06261).

Data Availability Statement

All data, figures, code, examples, and models are publicly available on our Github research repository: https://github.com/jonathanplangger/VBTC (accessed on 22 November 2023).

Conflicts of Interest

The authors declare they have no conflict of interest.

References

  1. Jiang, P.; Osteen, P.; Wigness, M.; Saripalli, S. RELLIS-3D Dataset: Data, Benchmarks and Analysis. arXiv 2020, arXiv:2011.12954. [Google Scholar]
  2. Wigness, M.; Eum, S.; Rogers Iii, J.G.; Han, D.; Kwon, H. A RUGD Dataset for Autonomous Navigation and Visual Perception in Unstructured Outdoor Environments. In Proceedings of the 2019 IEEE/RSJ International Conference on Intelligent Robots and Systems (IROS), Macau, China, 3–8 November 2019. [Google Scholar]
  3. Cordts, M.; Omran, M.; Ramos, S.; Rehfeld, T.; Enzweiler, M.; Benenson, R.; Franke, U.; Roth, S.; Schiele, B. The Cityscapes Dataset for Semantic Urban Scene Understanding. arXiv 2016, arXiv:1604.01685. [Google Scholar]
  4. Neuhold, G.; Ollmann, T.; Bulo, S.R.; Kontschieder, P. The Mapillary Vistas Dataset for Semantic Understanding of Street Scenes. In Proceedings of the 2017 IEEE International Conference on Computer Vision (ICCV), Venice, Italy, 22–29 October 2017; IEEE: Piscataway Township, NJ, USA, 2017; pp. 5000–5009. [Google Scholar]
  5. Johnson, J.M.; Khoshgoftaar, T.M. Survey on deep learning with class imbalance. J. Big. Data 2019, 6, 27. [Google Scholar] [CrossRef]
  6. Ma, J.; Chen, J.; Ng, M.; Huang, R.; Li, Y.; Li, C.; Yang, X.; Martel, A.L. Loss odyssey in medical image segmentation. Med. Image Anal. 2021, 71, 102035. [Google Scholar] [CrossRef]
  7. Emek Soylu, B.; Guzel, M.S.; Bostanci, G.E.; Ekinci, F.; Asuroglu, T.; Acici, K. Deep-Learning-Based Approaches for Semantic Segmentation of Natural Scene Images: A Review. Electronics 2023, 12, 2730. [Google Scholar] [CrossRef]
  8. Borges, P.; Peynot, T.; Liang, S.; Arain, B.; Wildie, M.; Minareci, M.; Lichman, S.; Samvedi, G.; Sa, I.; Hudson, N.; et al. A Survey on Terrain Traversability Analysis for Autonomous Ground Vehicles: Methods, Sensors, and Challenges. Field Robot. 2022, 2, 1567–1627. [Google Scholar] [CrossRef]
  9. Islam, F.; Nabi, M.M.; Ball, J.E. Off-Road Detection Analysis for Autonomous Ground Vehicles: A Review. Sensors 2022, 22, 8463. [Google Scholar] [CrossRef] [PubMed]
  10. Jadon, S. A survey of loss functions for semantic segmentation. In Proceedings of the 2020 IEEE Conference on Computational Intelligence in Bioinformatics and Computational Biology (CIBCB), Via del Mar, Chile, 27–29 October 2020; pp. 1–7. [Google Scholar]
  11. Puccio, B.; Pooley, J.P.; Pellman, J.S.; Taverna, E.C.; Craddock, R.C. The preprocessed connectomes project repository of manually corrected skull-stripped T1-weighted anatomical MRI data. GigaSci 2016, 5, 45. [Google Scholar] [CrossRef] [PubMed]
  12. Lin, T.-Y.; Goyal, P.; Girshick, R.; He, K.; Dollár, P. Focal Loss for Dense Object Detection. arXiv 2018, arXiv:1708.02002. [Google Scholar]
  13. Abraham, N.; Khan, N.M. A Novel Focal Tversky loss function with improved Attention U-Net for lesion segmentation. arXiv 2018, arXiv:1810.07842. [Google Scholar]
  14. Yeung, M.; Sala, E.; Schönlieb, C.-B.; Rundo, L. Unified Focal loss: Generalising Dice and cross entropy-based losses to handle class imbalanced medical image segmentation. Comput. Med. Imaging Graph. 2022, 95, 102026. [Google Scholar] [CrossRef] [PubMed]
  15. Rezaei-Dastjerdehei, M.R.; Mijani, A.; Fatemizadeh, E. Addressing Imbalance in Multi-Label Classification Using Weighted Cross Entropy Loss Function. In Proceedings of the 2020 27th National and 5th International Iranian Conference on Biomedical Engineering (ICBME), Tehran, Iran, 26–27 November 2020; IEEE: Piscataway Township, NJ, USA, 2020; pp. 333–338. [Google Scholar]
  16. Lu, S.; Gao, F.; Piao, C.; Ma, Y. Dynamic Weighted Cross Entropy for Semantic Segmentation with Extremely Imbalanced Data. In Proceedings of the 2019 International Conference on Artificial Intelligence and Advanced Manufacturing (AIAM), Dublin, Ireland, 16–18 October 2019; IEEE: Piscataway Township, NJ, USA, 2019; pp. 230–233. [Google Scholar]
  17. Duque-Arias, D.; Velasco-Forero, S.; Deschaud, J.-E.; Goulette, F.; Serna, A.; Decencière, E.; Marcotegui, B. On Power Jaccard Losses for Semantic Segmentation. In Proceedings of the 16th International Joint Conference on Computer Vision, Imaging and Computer Graphics Theory and Applications, SCITEPRESS—Science and Technology Publications, Vienne, Austria, 8–10 February 2021; pp. 561–568. [Google Scholar]
  18. Salehi, S.S.M.; Erdogmus, D.; Gholipour, A. Tversky loss function for image segmentation using 3D fully convolutional deep networks. arXiv 2017, arXiv:1706.05721. [Google Scholar]
  19. Sudre, C.H.; Li, W.; Vercauteren, T.; Ourselin, S.; Jorge Cardoso, M. Generalised Dice Overlap as a Deep Learning Loss Function for Highly Unbalanced Segmentations. In Deep Learning in Medical Image Analysis and Multimodal Learning for Clinical Decision Support; Cardoso, M.J., Arbel, T., Carneiro, G., Syeda-Mahmood, T., Tavares, J.M.R.S., Moradi, M., Bradley, A., Greenspan, H., Papa, J.P., Madabhushi, A., et al., Eds.; Lecture Notes in Computer Science; Springer International Publishing: Cham, Switzerland, 2017; Volume 10553, pp. 240–248. ISBN 978-3-319-67557-2. [Google Scholar]
  20. Rahman, M.A.; Wang, Y. Optimizing Intersection-Over-Union in Deep Neural Networks for Image Segmentation. In Advances in Visual Computing; Bebis, G., Boyle, R., Parvin, B., Koracin, D., Porikli, F., Skaff, S., Entezari, A., Min, J., Iwai, D., Sadagic, A., et al., Eds.; Lecture Notes in Computer Science; Springer International Publishing: Cham, Switzerland, 2016; Volume 10072, pp. 234–244. ISBN 978-3-319-50834-4. [Google Scholar]
  21. Drozdzal, M.; Vorontsov, E.; Chartrand, G.; Kadoury, S.; Pal, C. The Importance of Skip Connections in Biomedical Image Segmentation. arXiv 2016, arXiv:1608.04117. [Google Scholar]
  22. Takikawa, T.; Acuna, D.; Jampani, V.; Fidler, S. Gated-SCNN: Gated Shape CNNs for Semantic Segmentation. arXiv 2019, arXiv:1907.05740. [Google Scholar]
  23. Cakir, S.; Gauß, M.; Häppeler, K.; Ounajjar, Y.; Heinle, F.; Marchthaler, R. Semantic Segmentation for Autonomous Driving: Model Evaluation, Dataset Generation, Perspective Comparison, and Real-Time Capability. arXiv 2022, arXiv:2207.12939. [Google Scholar]
  24. Wu, Z.; Shen, C.; Van Den Hengel, A. Wider or Deeper: Revisiting the ResNet Model for Visual Recognition. Pattern Recognit. 2019, 90, 119–133. [Google Scholar] [CrossRef]
  25. Ronneberger, O.; Fischer, P.; Brox, T. U-Net: Convolutional Networks for Biomedical Image Segmentation. arXiv 2015, arXiv:1505.04597. [Google Scholar]
  26. Jiang, P.; Osteen, P.; Wigness, M.; Saripalli, S. GitHub: Rellis-3D: A Multi-Modal Dataset for Off-Road Robotics. 2022. Available online: https://github.com/unmannedlab/RELLIS-3D (accessed on 17 October 2023).
  27. ReduceLROnPlateau—PyTorch 2.0 Documentation. Available online: https://pytorch.org/docs/stable/generated/torch.optim.lr_scheduler.ReduceLROnPlateau.html (accessed on 27 September 2023).
Figure 1. Loss-Shaping Function. The loss-shaping function (red) increases the relative loss generated by low-scoring (<0.4 IoU) class-based IoU scores when compared to the linear loss–score relationship of unmodified IoU loss (blue).
Make 05 00085 g001
Figure 2. Power Term IoU Comparison. The power term (red) increases the score of higher certainty (>0.3) pixel class predictions when compared to the standard IoU (blue) linear relationship.
Make 05 00085 g002
Figure 3. Rellis-3D Image Label Distribution (Training Set) [1]. Each bar plot represents the quantity of pixels for the given class within the Rellis-3D [1] training image set. A subplot is present to further compare minority class presence.
Make 05 00085 g003
Figure 4. Case Study: Model Image Segmentation Comparison. The figure provides a visual representation of the semantic segmentation map predicted by a model trained with the corresponding loss function. The original (base) image and ground-truth annotation map are included for reference.
Make 05 00085 g004
Figure 5. Loss Function Performance Comparison. The figure displays the majority (red) and minority (blue) class average IoU performance for each analyzed loss function. The mean IoU (mIoU) score and the score distributions for each loss function are represented by the blue bar and the blue outlining region, respectively.
Make 05 00085 g005
Table 1. U-Net Model Parameters.
ParameterOldNew
Input Dimension 512 × 5121920 × 1200
Output Dimension388 × 3881920 × 1200
Base Channel Depth6432
Kernel Size35
Padding02
Table 2. Loss Function Performance Comparison—Performance Metrics.
Loss FunctionmIoUDice
CrossEntropyLoss0.19100.8352
Jaccard (IoU) Loss0.11650.8764
DiceLoss0.15520.853
Focal Loss0.24720.8721
DiceFocal0.11650.7743
Tversky Loss0.11870.7722
DiceTopk0.11950.7475
Power Jaccard0.21250.8772
FCIoUv10.25960.7483
FCIoUv20.38600.9013
Table 3. Majority Class Performance (Average IoU per Class).
Loss Function3: Grass4: Tree7: Sky19: Bush
FCIoUV20.83860.66580.95950.6192
CrossEntropyLoss0.80410.55930.95580.5304
Jaccard (IoU) Loss0.771400.84430.4806
DiceLoss 0.7960.54150.94570.511
Focal Loss 0.83040.60940.95110.5905
DiceFocal0.757700.84560.4938
FCIoUV10.76990.47920.92910.5271
Tversky Loss 0.70440.48530.94760
Power Jaccard0.82480.64070.94660.5659
DiceTopk0.66410.54120.94630
Table 4. Minority Class Performance (Average IoU per Class).
Loss Function5:
Pole
6:
Water
8:
Vehicle
9:
Object
10:
Asphalt
12:
Building
15:
Log
17:
Person
18:
Fence
23:
Concrete
27:
Barrier
31:
Puddle
33:
Mud
34:
Rubble
FCIoUV20.01340.18180.24040.40960.33840.00170.00520.25780.2290.73050.24510.49390.28080.4372
CrossEntropyLoss00.005600000000.28660.02320.1850.08820
Jaccard (IoU) Loss00000000000000
DiceLoss00000000000000
Focal Loss00.1683000000.000100.57960.0260.30130.16340.2288
DiceFocal00000000000000
FCIoUV10.00040.06350.02090.06350.00520.04510.0670.02850.09140.60370.0460.34850.24150.342
Tversky Loss00000000000000
Power Jaccard0000000000.57690.04690.00120.2220
DiceTopk00000000000000
Disclaimer/Publisher’s Note: The statements, opinions and data contained in all publications are solely those of the individual author(s) and contributor(s) and not of MDPI and/or the editor(s). MDPI and/or the editor(s) disclaim responsibility for any injury to people or property resulting from any ideas, methods, instructions or products referred to in the content.

