1. Introduction
Thyroid hormones are primarily responsible for the regulation of human metabolism, neuronal growth, and large increases in reproductive activity. When the thyroid gland is unable to produce regular hormone levels, normal body functionality is disrupted. This is known as thyroid disease. Thyroid disorders in medical science can result in thyroiditis and thyroid cancer. The primary thyroid conditions are hyperthyroidism and hypothyroidism [
1]. The proportion of people with thyroid dysfunction is rising globally, accounting for between 30 and 40% of patients seen in endocrine clinics [
2]. An estimated 20 million Americans have thyroid illness, of which approximately 60% are unaware [
3].
It might be challenging to distinguish thyroid disease from other illnesses owing to the conditions it produces. Diagnosis of thyroid illness is a difficult and time-consuming process. The traditional procedure for diagnosing thyroid illness involves clinical examination, as well as many blood tests. However, the main issue is being able to make a precise diagnosis of the condition in its early stages [
4]. Blood tests are recommended if doctors suspect thyroid dysfunction because they can offer crucial details regarding various thyroid hormones, including thyroid-stimulating hormone (TSH), triiodothyronine (T3), thyroxin (T4), and thyroid-stimulating immunoglobulin (TSI) [
5].
Thyroid disease should never be underestimated, as it can lead to severe complications such as thyroid storm (extreme hyperthyroidism) and myxedema (life-threatening end-stage untreated hypothyroidism) [
6]. Therefore, managing the progression of an illness and even avoiding death greatly depend on early disease identification, diagnosis, and therapy. Despite numerous tests being conducted, medical diagnosis is sometimes regarded as a difficult task [
7]. Data mining uses a semi-automated process to identify patterns and relationships in large databases [
8]. The classification of thyroid dysfunction can be resolved using data-mining methods. The use of machine-learning (ML) and DM techniques has become more widespread among academics and researchers.
It has become increasingly clear in recent years that the complexity of life and changes in food preferences have contributed to the sharp increase in medical issues. In addition, the cost of medical therapy is thought to be higher, particularly for compliance that requires surgical intervention. Data science, technology, and intelligent systems can be used to enhance medical diagnosis [
9]. The strategic prediction of thyroid disease is crucial for providing appropriate care, reducing medical expenses, and preventing avoidable fatalities. By understanding each patient’s complete medical history over time and analyzing the patterns of biological indicators and other parameters, it is possible to predict individual responses to therapy and modify treatments accordingly. Thus, it is essential to enhance medical procedures and leverage cutting-edge technologies for the early identification and prevention of thyroid problems. With advancements in data processing and computation technologies, ML approaches have been increasingly employed for accurate thyroid diagnosis.
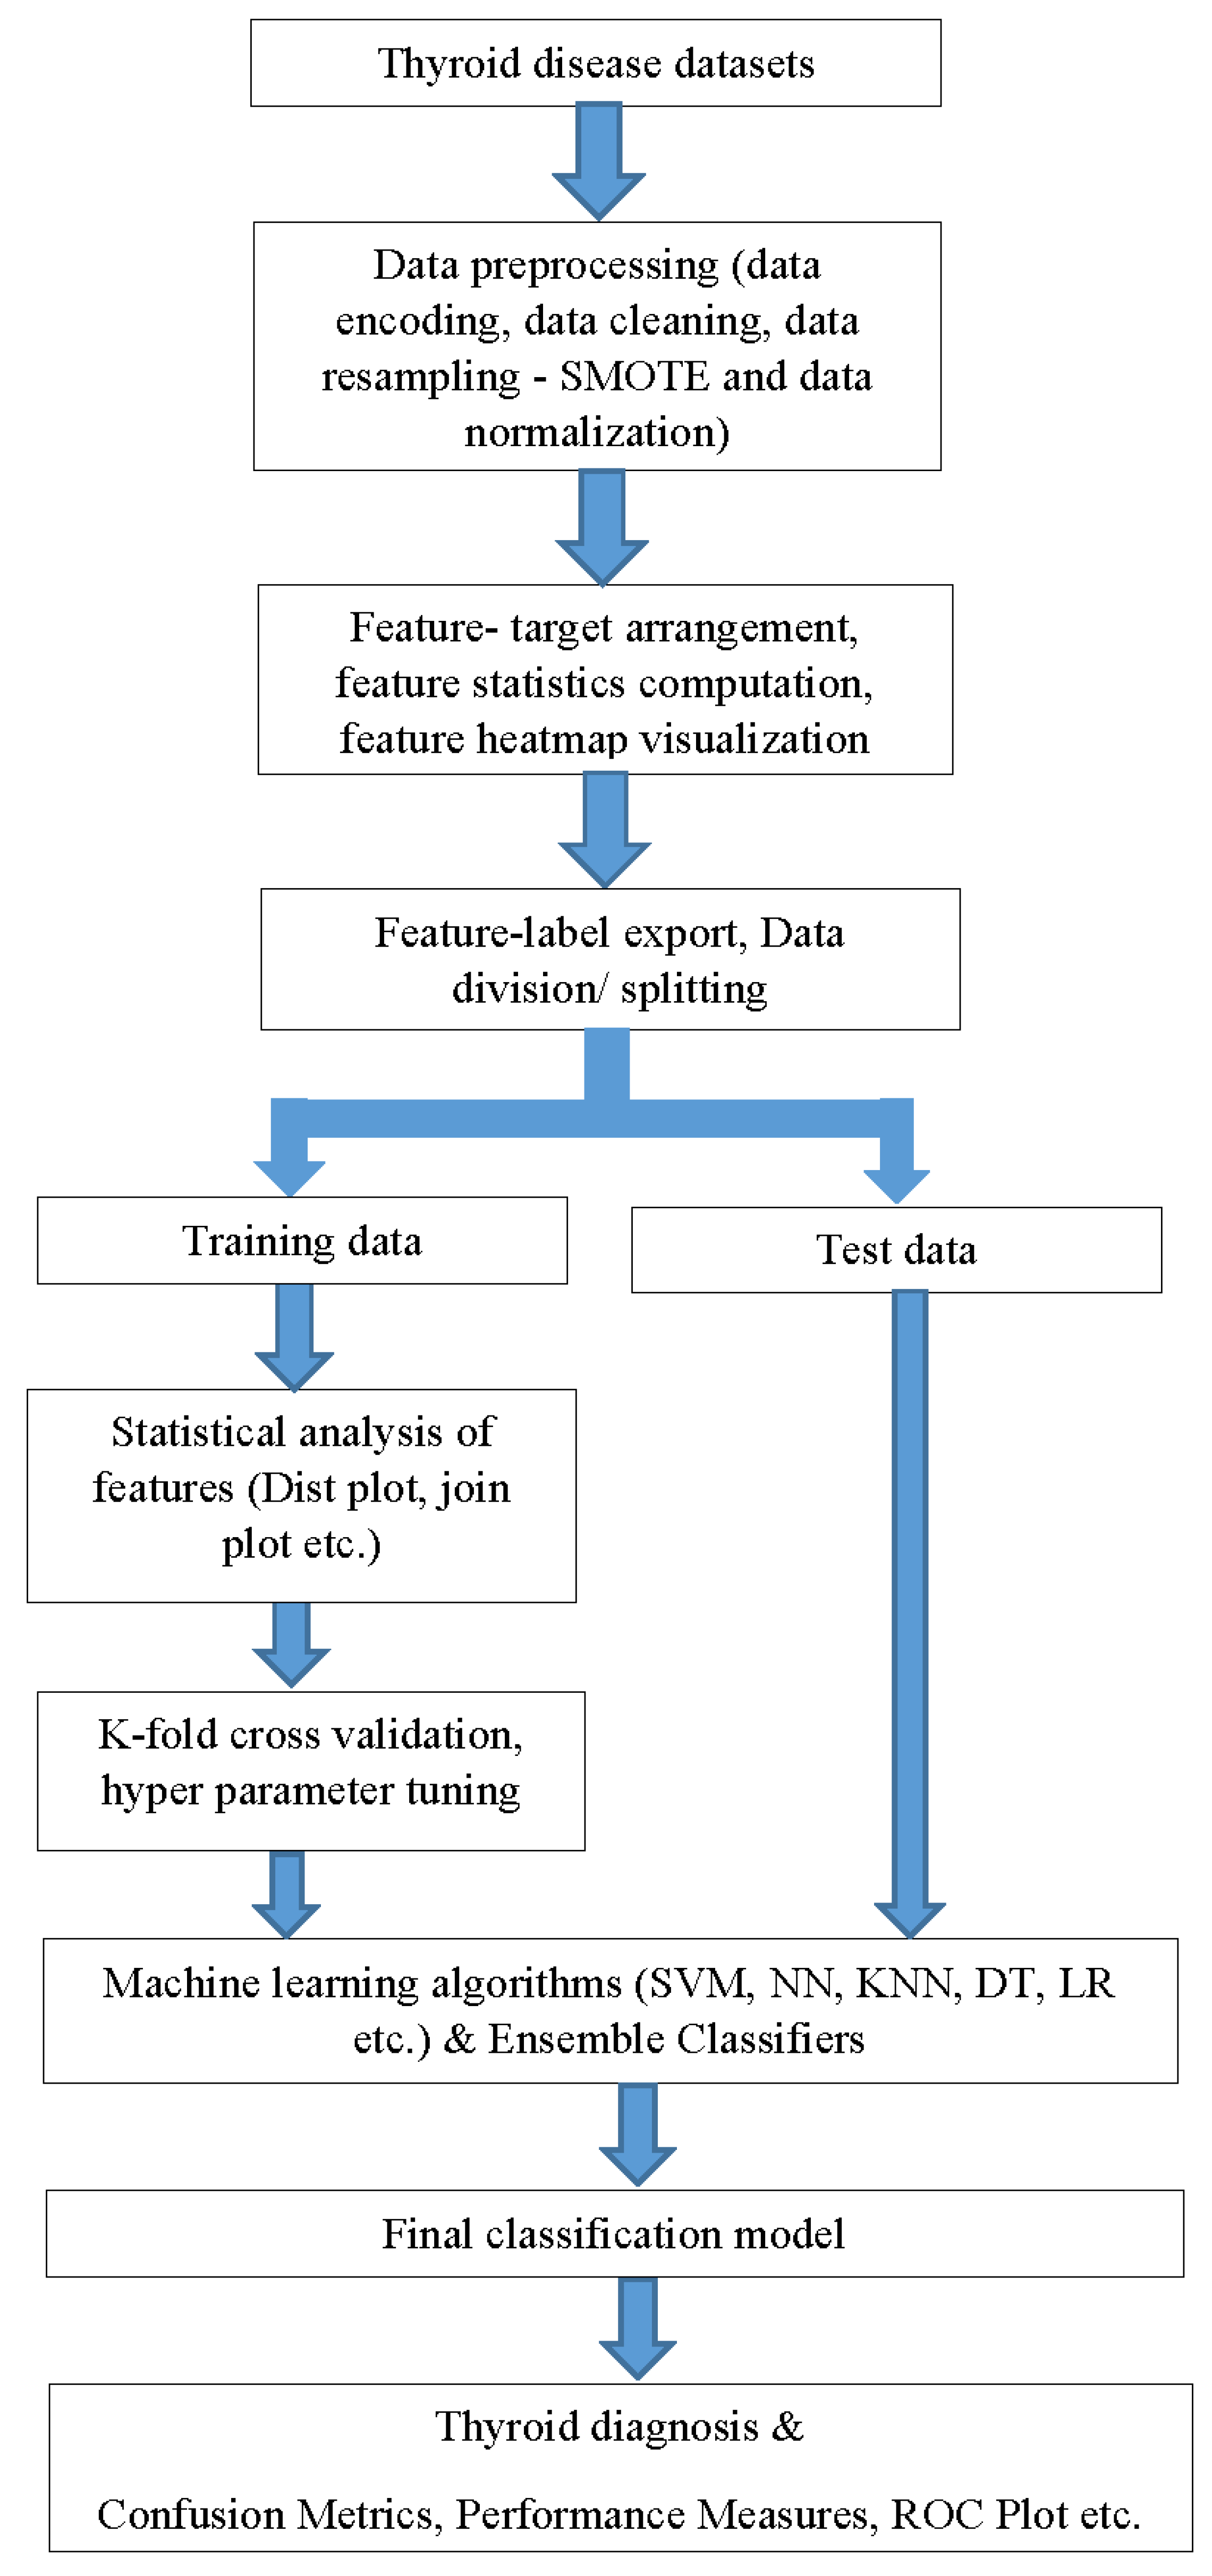
A general outline of the workflow that combines data mining and ML is shown in
Figure 1. The dataset chosen for the model training consisted of 29 clinical features. Because the data are gathered in real time, data preparation must be performed to obtain appropriate ML classifier inputs. Data preprocessing involves data encoding, cleaning, resampling, and normalization. To address any imbalances in the dataset and mitigate bias, a synthetic minority oversampling technique (SMOTE) algorithm can be employed to balance the data, which generates minority class synthetic samples by using K-nearest neighbors. In addition, to ensure that the models can be generalized to new data and are not unduly specialized in the training data, overfitting can be checked using cross-validation. Among the various thyroid diseases that include thyroiditis, goiter, thyroid cancer, etc., the present study focused on hypothyroid diagnosis. However, the same framework can also be employed for other diseases by training the model with the appropriate database. The primary contributions of this study are as follows.
The development of a simple, automatic, precise, and reliable ML thyroid prediction model can be incorporated into computer-aided diagnosis (CAD) systems.
Correlation analysis, heatmap generation, and other visualizations of various clinical features were implemented to understand their role in thyroid risk prediction.
Involvement of 29 features that can predict and classify the thyroid by analyzing early symptoms. In addition, it replaces the tedious manual analyses of these parameters. The SMOTE algorithm was implemented to achieve data balancing and to ensure that the results were not biased.
Ensemble learning ensures the reliability of the prediction model owing to the use of several classifiers, instead of a single ML algorithm.
A detailed survey of various existing studies that address thyroid prediction is presented in
Section 2.
Section 3 provides additional information on the materials and techniques used in this study.
Section 4 provides a detailed methodology. The corresponding experiments and results are discussed in
Section 5 and
Section 6 provides the conclusions of the work.
2. Related Works
A thorough analysis of the different prediction methodologies presented in recent studies for diagnosing thyroid illness is provided in this section by categorizing them as conventional ML- and DL-based approaches.
Traditional ML approaches: The authors created a thyroid prediction model [
10] that uses a kernel-based classification approach with “multi-kernel SVM”. To enhance the effectiveness of the classification process, optimal feature selection was performed using enhanced gray wolf optimization (GWO) [
11], which is a population-based meta-heuristic technique that mimics the natural leadership structure and hunting strategy of gray wolves. With respect to GWO, the three fittest candidate solutions—alpha, beta, and delta—lead the population to favorable regions of the search space. By adaptively searching for the feature space, we determined the optimal feature combination. This approach achieved 97.49% accuracy, 99.05% sensitivity, and 94.5% specificity. However, this technique requires lengthy computations; hence, the authors suggest the need for new and powerful procedures that will improve the performance and allow for the diagnosis of thyroid disease.
In [
12], the authors followed an empirical method by comparing the performance of random forest (RF), artificial neural networks (ANN), decision tree (DT), and K-nearest neighbor (KNN) on the dataset to enhance disease prediction based on the dataset’s specified parameters. The dataset was also altered to allow for a precise classification prediction. The dataset was modified to enable an accurate classification prediction, and categorization was performed on the sampled and unsampled datasets to improve comparability. After modifying the dataset, the RF algorithm achieved an accuracy of 94.8% and a specificity of 91%.
Using ML techniques, such as gradient-boosting machine (GBM), deep neural network (DNN), logistic regression (LR), SVM, and RF, Garcia et al. [
13] identified molecules that are highly likely to initiate thyroid hormone homeostasis. In the initial phases of thyroid illness, the early prediction of these compounds is helpful for additional testing. The ToxCast database provides information on molecular events. The best predictive performance was observed for the thyroid hormone receptor (TR) and thyroid peroxidase (TPO), with F1 values of 0.81 and 0.83.
Another study [
14] investigated three feature selection algorithms in conjunction with ML algorithms: univariate feature selection (UFS), principal component analysis (PCA), and recursive feature extraction (RFE). PCA [
15] transforms high-dimensional data into lower dimensions, whereas UFS [
16] selects the strongest features and RFE [
17] removes the weakest features until a specified number of features are reached. PCA is used when dealing with high-dimensional data, UFS is preferred for a simple selection approach, and RFE is performed by iteratively selecting the strongest features. The RFE and ML classifiers performed better than the other classifiers and achieved an accuracy of 99.35%. However, the sample size was small (n = 519). A sizable dataset was required to assess the efficacy of the method.
In another study [
18], in-depth analyses of thyroid prediction were conducted using various ML classifiers, with and without feature selection techniques. The DHQ Teaching Hospital in Dera Ghazi Khan, Pakistan, provided the data. It also included the extra parameters of blood pressure, body mass index, and pulse rate, which stood out from previous research. The experiment was conducted with and without L1 and L2 norm feature selection [
19]. L1 regularization aids feature selection by eliminating irrelevant features, whereas L2 reduces model overfitting by minimizing weight magnitudes. L1 is better when a subset of features is important, whereas L2 maintains a larger set of features. The final model with the naïve Bayes (NB) classifier and L2 selection achieved 100% accuracy. Another study [
20] experimented with different separate distance functions of the KNN classifier for the same database. In addition, they utilized the L1 norm and chi-squared test to perform feature selection. The chi-squared test [
21] identifies features strongly associated with the target variable. This is useful for dealing with categorical or discrete data. In addition to improving model performance, it prevents overfitting and enhances interpretability. Chi-squared techniques with KNN, Euclidean, and cosine distance functions achieved 100% accuracy. However, the proposed model has not yet been validated by using a public thyroid database. Hence, it cannot be verified based on overfitting and real-time usage.
To predict hypothyroid illnesses, Mishra et al. [
22] used ML techniques, such as sequential minimum optimization (SMO), RF, DT, and K-star classifiers. SVM training involves solving large quadratic programming optimization problems. SMO breaks them into smaller analytically solved problems, reducing the time-consuming optimization [
23]. In this investigation, 3772 distinct records were considered. RF and DT performed better and achieved 99.44% and 98.97% accuracy, respectively. However, hyperthyroid prediction was not considered in the present study. The efficacy of supervised and unsupervised classifiers in predicting thyroid conditions has received considerable attention. Instead of following this pattern, another study [
24] concentrated on the idea of feature relevance and its clinical application. They listed the top four features most likely to indicate the presence of thyroid disease, and demonstrated how easily and affordably practitioners could test these features. Moreover, they pointed out the drawbacks of widespread clinical practice in many nations with universal healthcare of not testing the whole thyroid panel. Finally, the results are stable and unlikely to vary depending on the classifier used or because of the fundamental characteristics of the dataset, such as imbalance.
DL-based approaches: Some studies make use of deep-learning-driven algorithms to provide good performance for the automatic identification of thyroid disorders, which provides doctors with support for diagnostic decision-making and reduces human false-positive diagnostic rates. One study [
25] used two preoperative medical imaging modalities to classify thyroid diseases. It developed a diagnostic model for thyroid disease based on a convolutional neural network (CNN) architecture, and it achieved remarkable performances of 0.972 and 0.942 accuracy for computed tomography (CT) scans and ultrasound images, respectively, using Xception. They conducted experiments using DeseNet121 and InceptionV3 in addition to Xception.
To improve the prediction accuracy, the authors in [
26] followed a series of procedures for input data before being input into the DL networks. After preprocessing the real data, they experimented with feature-reduction techniques, such as singular value decomposition (SVD) and PCA. SVD provides singular vectors with reduced dimensionality. The resulting data were then fed into KNN and neural network classifiers. In addition, the same data were applied to the DNN after the data augmentation. The experiment utilized 2 hidden layers (16 neurons), 1 input layer (23 inputs), and the ReLU activation function for prediction. They achieved an accuracy of 99.95% when using a DNN. Although it achieved a higher prediction accuracy, it could not identify the features based on which the network made the prediction decisions. Additionally, we could not determine whether model overfitting had occurred or not. Another study [
27] proposed a collection of multiple multilayer perceptron (MMLP) neural networks with backpropagation error handling to improve the generalization and prevent overfitting during training. They also employed an adjustable learning rate strategy to address the convergence and local minima issues associated with backpropagation error. The MMLP model outperformed a single network, increasing the accuracy by 0.7%. Additionally, using an adjustable learning rate algorithm improved the accuracy of Internet of Medical Things (IoMT) systems by 4.6%, ultimately achieving 99% accuracy compared with classical backpropagation.
To identify five distinct thyroid conditions, hypothyroidism, hyperthyroidism, and thyroid cancer, a CNN-based modified ResNet architecture was used in another study [
28]. In the proposed study, the training method was improved by employing dual optimizers to achieve greater accuracy and outcomes. It was found that the modified ResNet operational efficiency increased when using Adam and stochastic gradient descent (SGD) optimizers. The improved ResNet design offers 97% accuracy with SGD compared with 94% accuracy for the baseline ResNet architecture.
Table 1 presents an overview of the studies reviewed.
In the reviewed existing works based on conventional approaches, the prediction accuracy requires improvement because, while considering ML in the medical field, the prediction accuracy measure plays a significant role. Additionally, the models were built on a single ML classifier and there was no evidence to recheck their reliability. Only after ensuring reliability can the proposed models be incorporated into CAD systems. Although a few studies have achieved a high accuracy, they were developed on private datasets instead of public datasets and obtained permission to acquire data, privacy, secrecy concerns, etc. The remaining studies that are based on DL networks face the limitations of the requirement of huge training data, high computational power, large training time, and black-box nature. Additionally, the underlying decision-making features are unknown. To resolve these issues, This study proposed a model with sufficient reliability by implementing an ensemble of classifiers, in which more than one classifier is involved in making diagnosis decisions. The classic ML algorithms employed ensured model simplicity and speed. In addition, the features can be accessed and analyzed at any stage. Training the model with public data will help it handle diverse data, and thereby, it can be incorporated into real-time CAD systems.
4. Proposed Methodology
A detailed workflow diagram of the present study is shown in
Figure 2. Early identification, diagnosis, and treatment are critical to stop the progression of thyroid illnesses and lower the mortality rate. The accurate prediction of disease outcomes and understanding of the interdependencies of clinical features play a crucial role in medical diagnosis and therapy. By developing a fully automatic ML model that can be incorporated into a CAD system, a higher prediction time and error rate can be eliminated.
The public thyroid database from the UCI ML Repository [
29] was used in this study. With 29 clinical variables that will help in early diagnosis, this is the only public thyroid dataset with such a large sample size. By using a public dataset for model development, the proposed model will be capable of handling real-world data limitations.
Preprocessing the dataset is a crucial step that both data mining and ML rely on. Real-world data have inherent irregularities and noise, and there is a chance that some of the data will be missing, duplicated, or irrelevant. This can result in false information being learned and a decline in algorithm performance. The dataset is encoded, resampled, normalized, and thereby put into the proper format using preprocessing to make it ready for processing. In the database, data values are also written in words as well as by numbers. The training data are frequently labeled in words to make them human-readable and intelligible. However, machines require numeric representations, and hence, label encoding transforms actual data into numeric. Machine-learning algorithms can then analyze and determine the optimal functioning of these labels. Converting categorical data into numeric values is essential in supervised learning for structured datasets, ensuring accurate analysis.
To verify that the data given into the ML model are not redundant, duplicate rows were then eliminated as part of the data-cleaning process. A given class is typically underrepresented in relation to other classes in datasets that accurately reflect the real world. When learning a concept from a class with few examples, it might be difficult due to the “class-imbalance” problem. One among the main issues associated with data mining and pattern recognition is the data-imbalance problem. Unbalanced datasets significantly impede learning because the bulk of currently used ML techniques presuppose a balanced class distribution or an equal penalty for misclassification. To solve this problem associated with our database, data resampling was performed with the SMOTE technique, which uses oversampling. Patients without hypothyroidism made up the minority group in this case. Because SMOTE was applied ahead of data splitting, the minority class had sufficient samples and the data imbalance was mitigated.
SMOTE has several benefits over conventional oversampling. Duplicating existing data may bias the model in conventional oversampling. SMOTE interpolates between the minority class’s existing samples to construct synthetic samples. By adding diversity to the oversampled dataset, the likelihood of overfitting is decreased. SMOTE can assist in enhancing the model’s capacity to discriminate between classes in the critical regions by producing samples along the decision boundary. Additionally, it can assist in decreasing the effect of noisy data points.
This study utilized SMOTE class implementation from the imbalanced-learn Python library. This class is like a scikit-learn data transform object and needs to be defined and configured before it can be applied to a dataset. By using SMOTE, it initially oversampled the minority class, ensuring it contained 10% majority class instances. Required ratios were passed as arguments to the SMOTE and RandomUnderSampler classes, which were combined into a pipeline. This pipeline allowed us to apply the transformations step by step, resulting in a final dataset with the desired number of transformations.
As the final part of preprocessing, data normalization is applied to convert the numerical values in the dataset’s columns to a comparable scale while keeping their ranges. This method is noteworthy for maintaining the consistency of such value ranges. By using a linear data transformation called min–max normalization, the range of the dataset is condensed to a single range, set to 0 to 1. Here, it was applied to the TT4, T4U, FTI, and age data columns. Then, the statistical summary, such as the mean, count, standard deviation, percentiles, and minimum–maximum value ranges of the preprocessed data, was obtained.
To analyze the data, feature distributions and seaborn distribution charts, such as distplot and jointplot, were utilized. First, we selected one specific column of the dataset since the distplot frequently visualizes univariant sets of observations using histogram, that is, one observation. Then, a plot of two variables with bivariate and univariate graphs is created using a jointplot. In essence, it mixes two distinct narratives. Finally, the correlation between the data columns is evaluated, and a corresponding heatmap is generated. Data preprocessing was completed, and the data features and targets were separated from the preprocessed data. Feature-target values were exported into Excel files for later ML stages.
In the ML classification stage, DT, neural network (NN), SVM, LR, and KNN were initially used. Then, ensemble classifiers were employed since they would be more reliable than individual classifiers. A 5-fold cross-validation which prevents overfitting was also performed. Moreover, hyperparameters were tuned by employing Bayesian optimization. The ensemble-learning approaches of bagging and boosting were employed. Using bagging, several models were trained on a portion of the real dataset before combining the model results to produce the final prediction conclusion. Another meta-model was also trained combining the output predictions of many models to produce a concluding forecast. Boosting-based ensemble techniques contain models that have been trained several times, relying on previously trained performance errors as well as underperforming models. Afterward, a weighted average of the predictions was created using the accuracy of various models. Real-world scenarios benefit most from these ML models that have been trained to handle a class imbalance that characterizes all real-world data.
Some disease diagnosis may be affected by intricate relationships between features that are not immediately apparent. The model can capture these complicated relationships when all clinical features are used. To evaluate feature relevance, feature selection sometimes necessitates time-consuming data-preprocessing activities. The entire data-preparation procedure can be streamlined by omitting this step. Models using all features might provide more transparency in their decision-making process, as clinicians and researchers can observe the influence of various features on the predictions. Models without feature selection are better able to adapt to data changes, making them advantageous for real-time applications where new features become relevant in the future.
When the proposed approach is implemented into medical systems, thyroid disease screening can be carried out with minimal or no assistance from physicians. As a result, the standard thyroid screening approach could be changed, allowing for faster screening and treatment. Patients from remote locations and the elderly who do not have easy access to hospitals might benefit from the integration of this ML model into mobile applications. In principle, by retraining the suggested framework, it can be used for many diseases such as thyroid dysfunction, diabetes mellitus, pituitary tumors, acromegaly, etc. It, however, requires similar biomedical databases with clinical features that can aid in the prediction of a specific disease.
5. Experimental Results and Discussion
The results of each experiment conducted during the model development will be presented and discussed here. Several preprocessing approaches were used to improve the model performance that include locating and handling missing values and encoding categorical data. Furthermore, various ML classifier algorithms were tried along with cross-validation and hyperparameter tuning. The accuracy, sensitivity, specificity, etc., were assessed to gauge the efficacy of the prepared model.
As a first step, a thyroid dataset from the UCI ML repository was used since we needed a real-time database with enough data for model training. A model developed from such a database would be useful as a CAD system in day-to-day hospital activities. The amount of data are essential for improved accuracy. When conducting research using private healthcare data, researchers must also address additional challenges such as obtaining permission to acquire the data, privacy, and secrecy concerns, etc. These are some of the reasons why many researchers use this public thyroid disease database. Since the dataset consisted of data-imbalance problems, the SMOTE algorithm was implemented in the preprocessing stage, and bar charts of both cases are given in
Figure 3.
Data preprocessing is a data-mining technique used to clean up and make the raw data that have been collected in the initial stage more workable. The Pandas python library was employed to perform the ML preprocessing. The actual data included attributes that have values such as letters or numbers. However, it must be encoded to make it readable by machines. Hence, data were converted into data frames, and encoding was carried out using the Sklearn label encoder. Then, all 29 attributes were converted into the “int64” data type. Later, data cleaning was performed by dropping duplicated rows from the encoded data, which ensured that the ML classifier input will not be redundant. Next, the statistical data summary was evaluated using count (nonempty values), mean, standard deviation, etc., as given in
Table 2. How many values fall below the specified percentile is what the term “percentile” means.
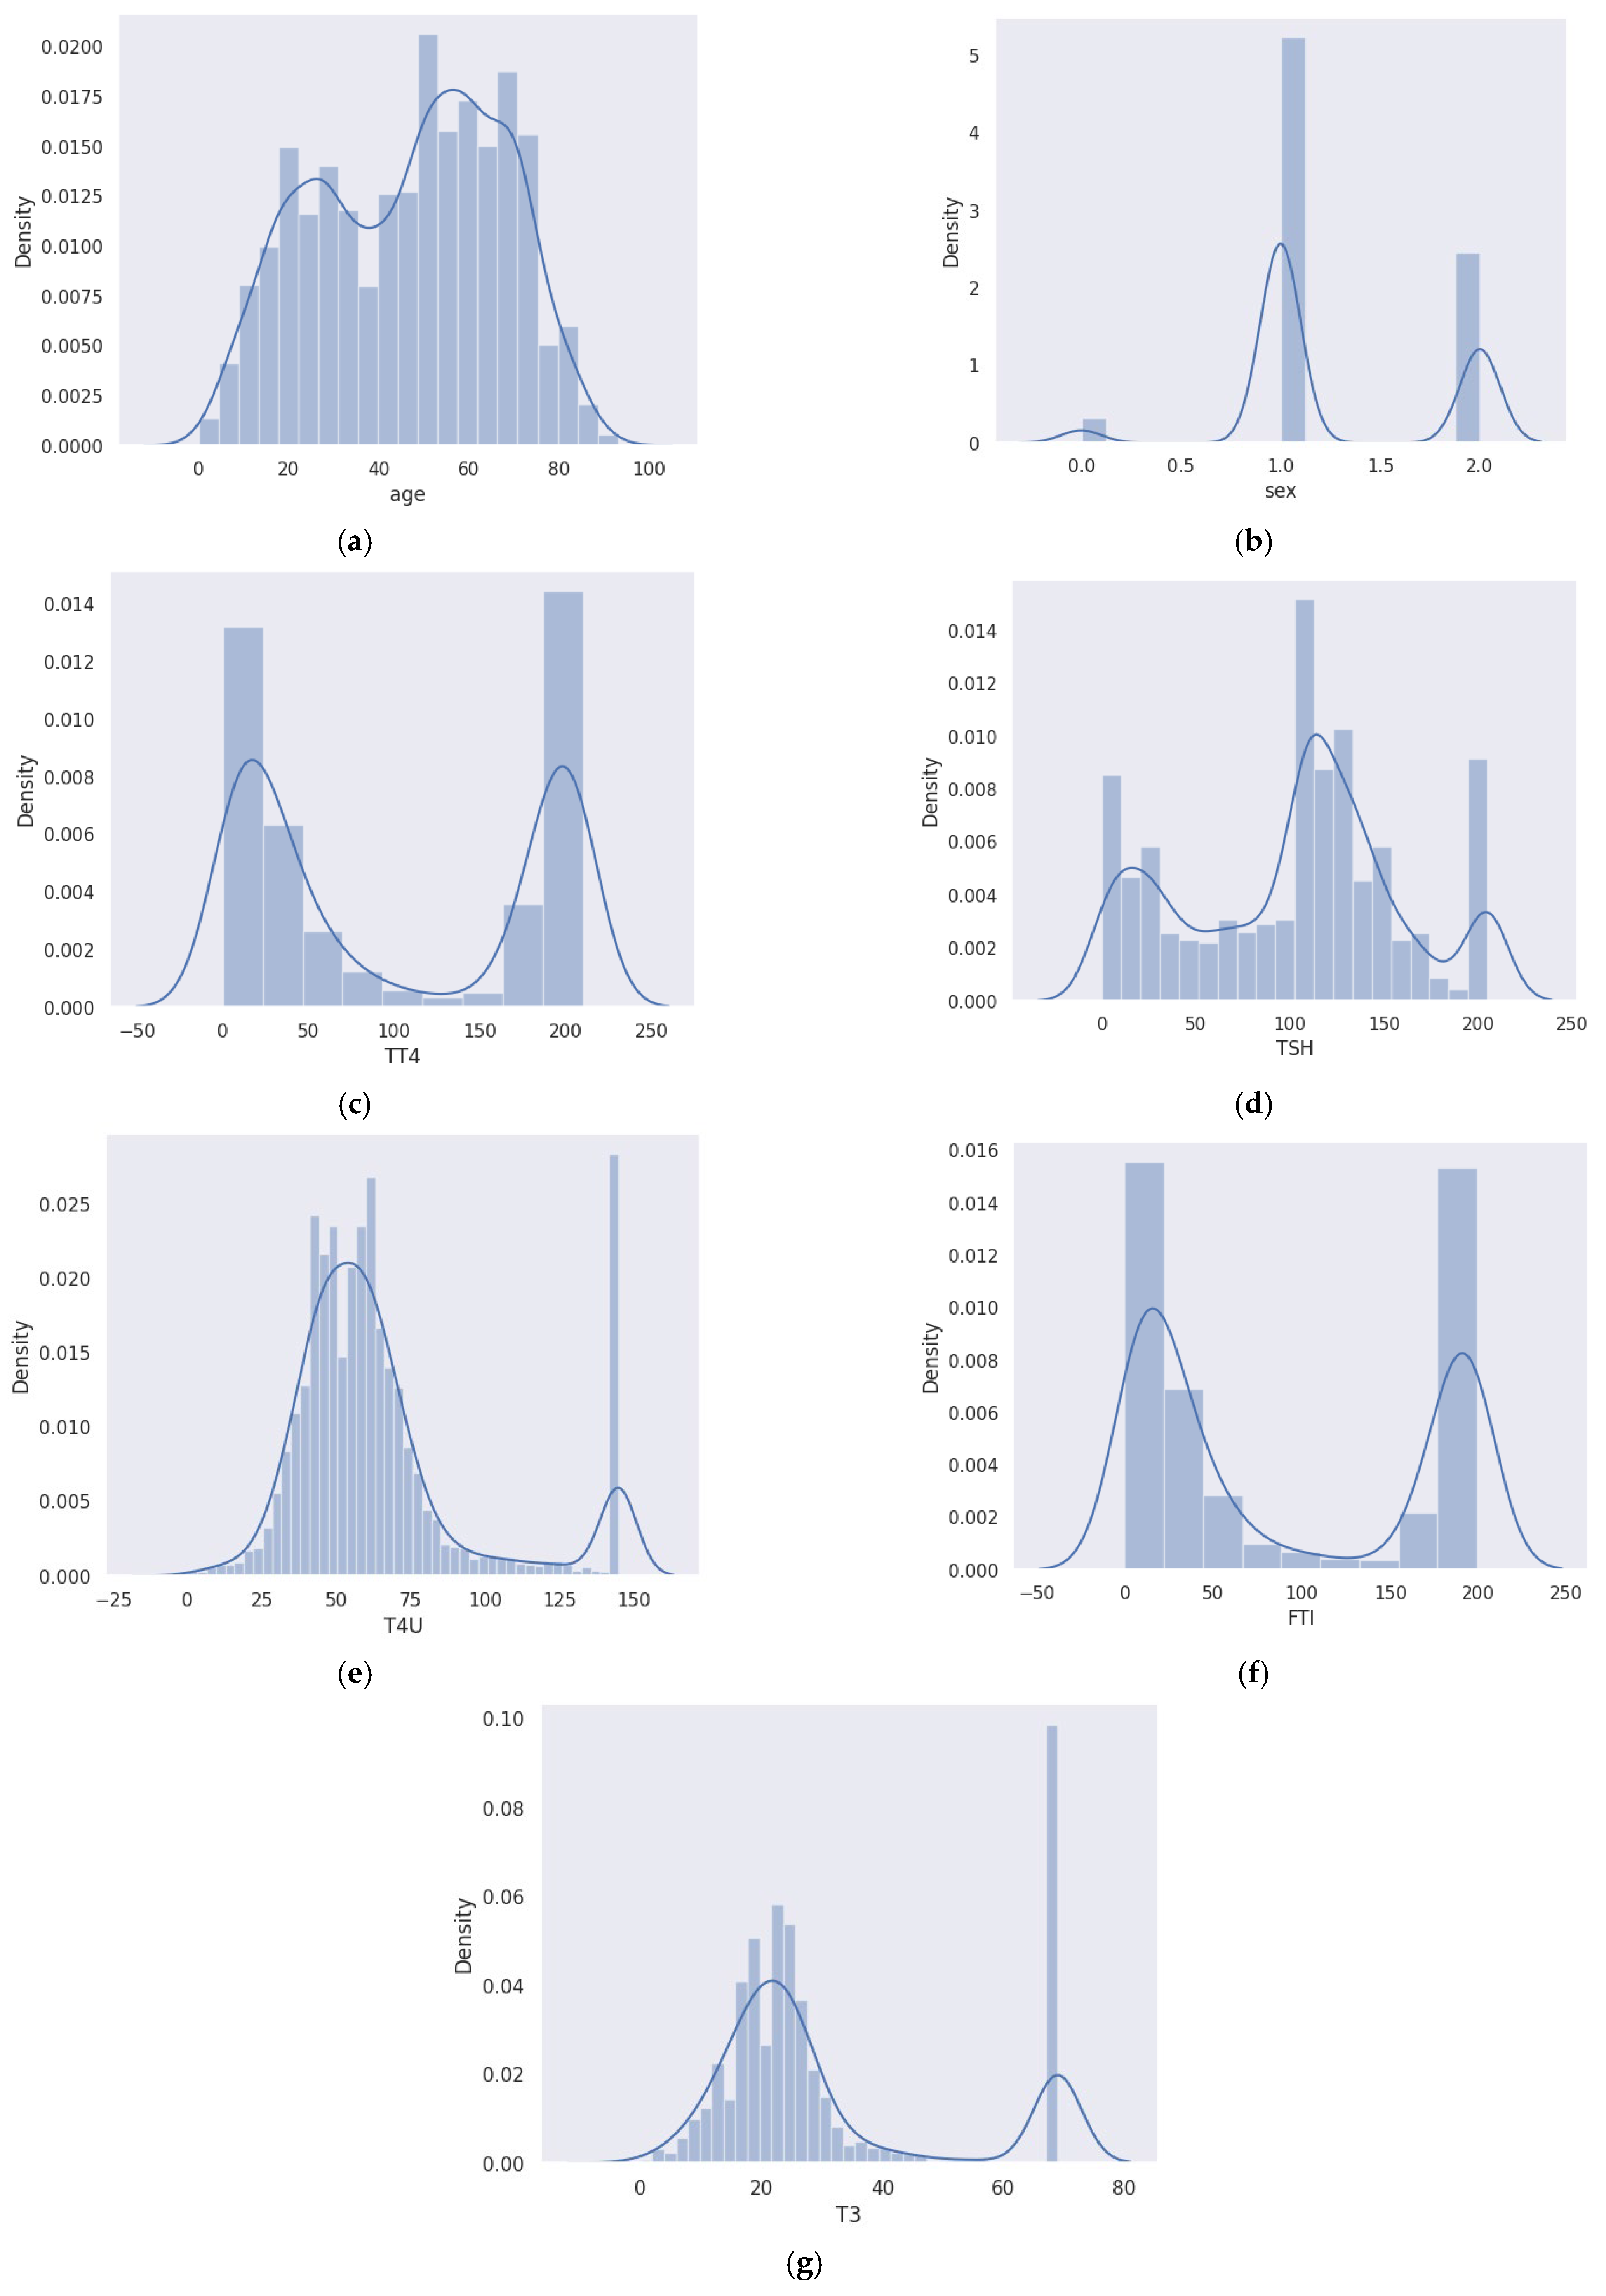
In the field of medical diagnosis and treatment, the accurate prediction of disease outcomes and understanding the interdependencies among clinical variables or attributes are essential. Hence, before going further, the analysis of the data features was performed using seaborn distribution plots, such as distplots and jointplots, where the former considers a single variable, and the latter handles two variables. Distplots showing the different attribute distributions are shown in
Figure 4a–g.
Distplots combine the functionality of histograms, kde plots, and rug plots in a simple and unified manner. Here, the rug plot was kept false. It is clear from the plot (
Figure 4a) that thyroid issues become more common as people age. Additionally, the count of occurrence is more in females than in males when considering genderwise analysis, as shown in
Figure 4b.
Total thyroxine (TT4) (
Figure 4c) and triiodothyronine (T3) (
Figure 4g) are thyroid hormones. Thyrotropin-releasing hormone, which is released by the hypothalamus, stimulates the pituitary gland to generate thyroid-stimulating hormone (TSH). The thyroid gland then releases T4 and T3 with the aid of TSH. TSH is essential to the system’s operation. Therefore, the pituitary gland releases more TSH if the T3 and T4 levels are too low, as shown in the above distplot in
Figure 4d. The gland will release less TSH if it is too high, but this give-and-take system only works if everything is in working order.
When the thyroid gland does not produce sufficient thyroid hormone to meet the body’s needs, it causes hypothyroidism, also known as underactive thyroid. Primary hypothyroidism, caused by thyroid gland disease, is indicated by high FTI levels and elevated TSH levels (
Figure 4f). Low levels of TSH and FTI suggest hypothyroidism caused by a malfunctioning pituitary gland. In the case of hyperthyroidism, TSH levels are low, while FTI levels are high.
Figure 4e shows an increasing trend in T4U, whereas TT4 levels appear to be declining.
Both the main plot and the marginal plots make up the jointplot, as given in
Figure 5. The combination of univariate and bivariate plots in a single figure is highly beneficial. This is so that the bivariate analysis can explore the link between two variables and explain the strength of that association, whereas the univariate analysis concentrates on one variable and describes, summarizes, and displays any patterns in your data. The Seaborn library’s jointplot() function by default generates a scatter plot with two kernel density estimate (KDE) plots at the top and right edges of the graph. By setting the “hue” option to column “binary class” in this plot, the data points for thyroid (labeled as 1) and nonthyroid (labeled as 0) conditions are displayed in different hues and are clearly distinguishable. Regarding the marginal plots, density plots that separately display the data distribution for the two levels of the hue variable are plotted on both margins. If we observe the scatterplot of thyroid class, it can be noticed that the columns “age” and “TSH” appear to be positively correlated with one another as their values rise together. While considering the jointplot of “age” and “TT4”, it is possible to observe the bimodal distribution of the density plots irrespective of age. However, for TSH and TT4, the nonthyroid class marginal plots are comparatively left skewed. From the analysis of these features, it can be concluded that each attribute plays a key role in predicting thyroid disease.
On the TT4, T4U, FTI, and age columns, min–max normalization was also performed. This is because, even with very rich data, if normalization is neglected, some traits may entirely outweigh others. Next, using the “Pearson” method (standard correlation coefficient), the pairwise correlation of all columns was determined. The row variable’s correlation with the column variable determines the output cell value. Since the variable’s correlation with itself is 1, each diagonal value is 1.00. Then, a heatmap was created that used various colors to depict the numerical values in the correlation data frame (
Figure 6). Dark colors are used in this heatmap to show low values, and light colors are used to show high values. To the right of the figure is a color bar that illustrates how the colors and values relate to one another. Ticks are located at 0.75, 0.5, 0.25, etc., till 1.00 on the color bar. The minimum and maximum data values in the correlation data frame are used to compute the tick positions.
Following the completion of data preprocessing, the data features and target were separated from the preprocessed data frame. Excel files were used to export feature-target values to use in the ML stages. Using an 80:20 split, the dataset was divided into training and testing sets, using 80% data for training and 20% for testing. Here, we employed numerous ML models after partitioning the data with LR, NN, DT, KNN, and SVM algorithms with 5-fold cross-validation.
The maximum classification accuracy of 95.62% was obtained from the DT classifier. However, the prediction accuracy required further improvement since the model is for medical diagnosis, where accuracy plays a key role. In addition, to incorporate the model into CAD real-time systems, reliability was another concern. To achieve these targets, the ensemble-learning algorithms of bagging and boosting were applied. They performed better than conventional classifiers, and the best accuracy achieved by boosting was 99.5%. Here, class 0 was used to denote nonthyroid classes, and 1 was used to denote thyroid classes. Also, we evaluated the model’s negative predictive value (NPV), true-negative rate (TNR), positive predictive value (PPV), true-positive rate (TPR), and misclassification rate [
37], as given in
Table 3.
Accuracy measures the count of data samples belonging to the test dataset that were properly categorized out of all the data samples (Equation (1)). The percentage of correct positive cases predicted out of all positive cases is known as sensitivity or TPR (Equation (2)). Specificity or TNR is the model’s capacity to accurately categorize a data sample with a negative case among all the negative cases (Equation (4)). Precision or PPV assesses the model’s performance by comparing the correct positive cases to those predicted by the model (Equation (3)). Negative predictive value (NPV) is the probability that a data sample with a negative screening test truly does not have the disease (Equation (5)). True positive (TP) and true-negative (TN) indicate positive and negative cases predicted correctly. False positive (FP) and false negative (FN) denote the false detection of negative cases as positive and positive cases as negative.
The models are fine-tuned by Bayesian optimization, and the classification error plot is shown in
Figure 7. For the finalized boosting ensemble method, the training time required was 148.82 s with a prediction speed of 7800 obs/s. The hyperparameter range and optimized values are given in
Table 4.
For the finalized thyroid prediction model using the boosting ensemble method, we exported the TPR and false-negative rate (FNR) plots (
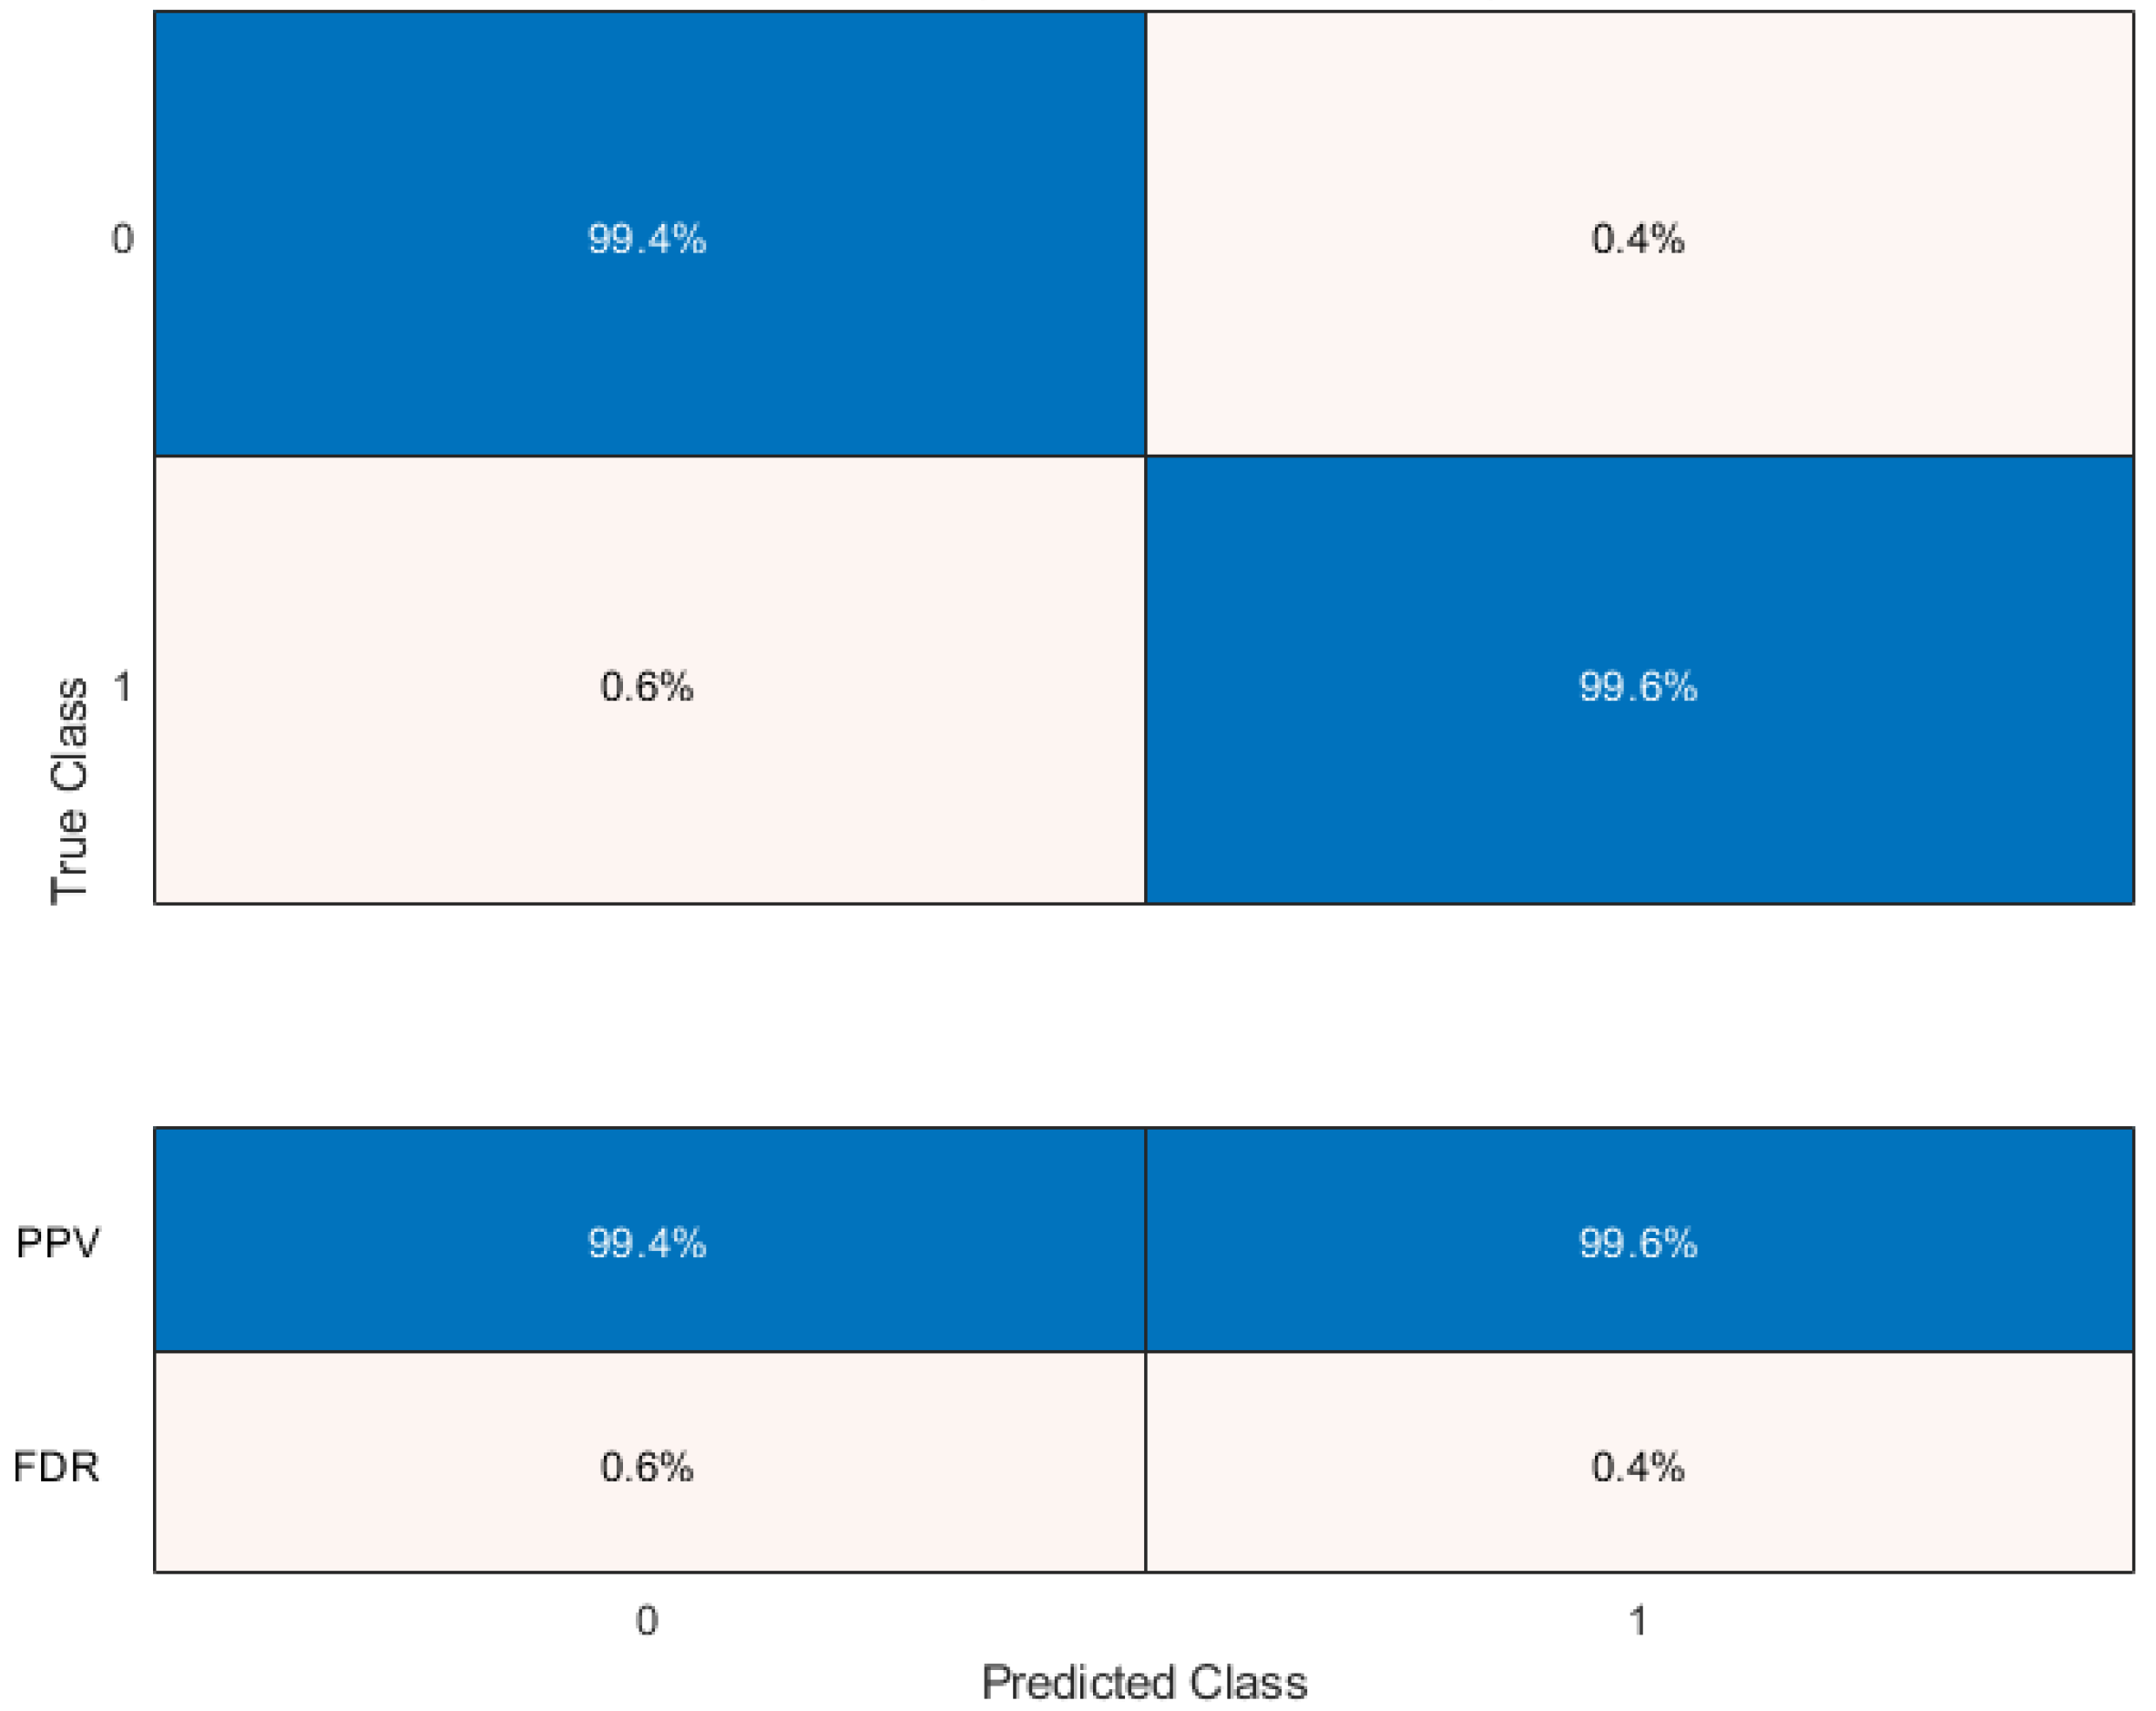
Figure 8) to see the classifier’s performance for each class. Here, the false positives (FPs), true positives (TPs), false negatives (FNs), and true negatives (TNs) are 14, 3406, 21, and 3399, respectively. The TPR measures how many observations are accurately categorized for each true class. The FNR gives the ratio of mistakenly classified observations to correctly classified observations. The last two columns on the right of the plot display summaries for each true class. Since false positives are crucial to our classification problem, PPV and false-discovery rate (FDR) plots are obtained, as given in
Figure 9. PPV represents the percentage of correctly classified data in each predicted class, while FDR measures the proportion of incorrectly classified observations for each predicted class.
The TPR and false-positive rate (FPR) for various thresholds of classification scores, calculated by the currently chosen classifier, are displayed on the receiver operating characteristic (ROC) curve (
Figure 10). The integral of an ROC curve (TPR values) with respect to FPR from FPR = 0 to FPR = 1 is equivalent to the area under the ROC curve (AUC) value. The classifier’s overall efficiency is gauged using the AUC value, and obtained a maximum value of 1, which indicates a higher classifier performance. An AUC of 1.000 indicates perfect separation between positive and negative classes in a model’s predicted probabilities. However, this does not result in 100% performance in other metrics every time, as various matrices consider factors like classification threshold, class imbalance, and trade-offs. Each performance measure gives various performance aspects of a model’s behavior.
A performance comparison of the proposed model with some similar works based on the same database is given in
Table 5.
Most of the individuals in the database are those who were referred to the thyroid clinic for evaluation. Since predictions relating to thyroid are the proposed model’s main focus, this dataset is a useful resource for training and evaluating the model because it includes important clinical features for identifying thyroid disease. As a result, the model’s applicability to this specific task could be ensured. SMOTE and cross-validation techniques are capable of mitigating bias and improving generalizability. Furthermore, this work could be extended for other related medical diagnosis applications by retraining the framework using an appropriate database.
The proposed model is valuable for real-time disease identification since it demonstrates several important qualities and characteristics such as high accuracy, robustness, balanced sensitivity and specificity, and adaptability, and it could be integrated into CAD systems as well. Incorporating our method into a software-based solution allows for patient data entry, and by utilizing the proposed ML model, it can predict the patient’s thyroid state. Once a labeled public database is accessible in the future, a multiclass thyroid classification model will be tested. Additionally, deep networks will then be tried, coupled with the visualization of feature relevance in classification judgments. The proposed work details are available at Zenodo [
42].


