1. Introduction
In natural language processing (NLP), text classification is defined as a problem of learning a classification model that maps documents to classes, which are human defined and application specific [
1]. The performance of such a model depends on multiple factors, including the quality and size of the training data, the choice of machine learning algorithm and its hyperparameters and the features used by the algorithm. No single algorithm can outperform all other algorithms on all possible text classification tasks [
2,
3]. In other words, no single algorithm will always be the best choice, hence it is important to experiment with different algorithms and hyperparameters to find the best combination for a particular task. Nonetheless, greater performance improvements can often be gained by exploiting domain-specific text features regardless of the machine learning algorithm used. Unfortunately, such features are often neglected in favor of ‘one size fits all’ approaches [
4].
Clinical text contains extensive numerical information of various types and formats (see
Table 1 for examples). Unfortunately, most clinical text classification approaches fail to take advantage of the corresponding features. For instance, let us have a look at two document representation models and how they fail to capture numerical information. Specifically, we will discuss a vector space model and a word embeddings model.
A vector space model is a mathematical model in which text documents are represented as vectors whose dimensions correspond to terms [
5]. If a term occurs in a given document its value in the vector is positive, otherwise, it is set to zero. The definition of a term depends on a specific application. For example, it can be a single word, a keyword, a phrase or an n-gram. Most often, words are chosen to be the terms, in which case the dimensionality of the vector, also called a bag of words (BoW), matches the number of distinct words occurring in the training corpus. As a result, we have long sparse vectors.
Stopwords are common words that do not add much meaning to a document. For that reason, but also to reduce the dimensionality of document vectors, stopwords are often removed. Whether or not numbers are considered as stopwords often depends on the specific NLP task considered. Even though they do add meaning to a document, more often than not, numbers are removed for a practical reason of reducing the dimensionality of the vector space. Another reason against using numbers as features in the vector space model is that they bear no meaning without context. For example, the number 10 can have many different meanings depending on the context, e.g., the base of the decimal numeral system, the number 2 in the binary decimal system, the number of commandments, the Prime Minister’s official residence, etc. Therefore, it makes little sense to use the number 10 as a term in the vector space model.
Word embeddings were introduced to address the limitations of traditional BoW models. They are dense, low-dimensional vectors that can be used to represent the meaning of words in a vector space, which is learnt from their distribution in a large corpus of text [
6]. By capturing the meaning of words using low-dimensional vectors, which are easier to use by machine learning algorithms, word embeddings can support a variety of NLP tasks including text classification. Each number can have its own word embedding. Numeracy-preserving embeddings are designed specifically to capture the numeric properties of numbers [
7]. This is achieved by training the word embeddings on a dataset of text that includes numbers [
8]. The training data are used to learn the relationships between numbers and other words. This allows the word embeddings to capture the numeric properties of numbers, such as their magnitude and order.
Individual word embeddings can be aggregated to represent a whole document in the same vector space. Some common document embedding techniques [
9] include simple averaging, weighted averaging, hierarchical pooling, or sequence modeling with a neural network (NN). Unlike recurrent NNs, which process a document sequentially, transformer-based networks process the entire document simultaneously, which allows for better utilization of contextual information. Like the underlying word embeddings, document embeddings represent dense, low-dimensional vectors whose dimensions aim to capture semantic and syntactic relationships between words, but whose exact interpretation is not always clear or intuitive. While many dimensions in word embeddings may have meaningful interpretations, not all dimensions have clear semantic or syntactic explanations. Some dimensions might capture noise, rare linguistic patterns or other factors that are not easily interpretable. This makes it difficult to interpret how individual numbers mentioned within a document are actually represented in its overall embedding.
Typed information is information that has been classified into a specific type, which can be in turn used to describe its meaning and to help with its processing. Context used to interpret a number can be used to infer its type. Let us consider the hypothetical example provided in
Figure 1. It mentions five numbers, which have been highlighted in the same color as the corresponding context. We named the type of this information in the subscript. Typed representation of numbers would mean assigning their values to specific features that represent their types.
Figure 2 illustrates how the numbers in typed representation can still be interpreted following the removal of their context. Typed representation of numbers can be used to extend a document representation model. This leads us to the primary aim of this study, which is to demonstrate that numbers as features can significantly improve the performance of text classification.
The secondary aim is to demonstrate the feasibility of extracting such features. In NLP, this represents an information extraction (IE) problem, which deals with the automatic extraction of structured information from unstructured text [
10]. A template consists of a number of slots, each of which represents a specific piece of information that needs to be extracted. Templates need to be tailored to a specific application, which makes them difficult to create. To address this problem, the first objective of this study is to identify different types of numerical information in text in an unsupervised manner. Trying to relate this to our previous IE example shown in
Figure 1 and
Figure 2, we want the data to inform the structure of the IE template (the header of the table) as opposed to designing it in a top-down manner. The second objective is to populate the template automatically with answers extracted from text. The third objective is to integrate these features into a text classification model.
Finally, these objectives will enable us to address the primary aim by allowing us to measure the impact of numerical features on the performance of text classification. The key research question therefore is what performance improvements can be gained by incorporating automatically extracted typed numerical information into a text classification model? We can answer this question by comparing the results to the baseline, which represents a typical text classification model based on either vector space model or word embeddings model. The aim is not to implement the highest performing text classification system but to make a relative improvement and quantify it.
2. Related Work
A recent review, which summarized and contextualized research on numeracy in NLP, concluded that despite huge advances in large language models, this community is still not only far from reaching a holistic solution to numeracy but far from even attempting it [
11]. When they are not filtered out, numbers are usually either all collapsed into a generic token or tokenized into subwords. Either representation has proven to be inadequate for NLP tasks such as question answering (QA) [
12].
Scientific notation has been shown to be more amenable to word embeddings than decimal notation [
13], as language models can learn to attend to the exponent over the mantissa [
14]. In addition, embedding characters, in this case digits, is more effective than embedding subwords as the positions of digits can be used to capture scales [
15,
16,
17].
Nonetheless, it is still difficult to train continuous value functions for a large range of numbers [
15]. To reduce the complexity of this task, numbers can be first binned and then embeddings learnt for each bin [
13,
18]. Binning can also help with the scarcity of numbers. There are infinitely many numbers, but their individual mentions in finite training corpora are next to none giving rise to the out-of-vocabulary problem for most numbers. Previously mentioned tokenization into subwords and characters can help address this issue. Alternatively, embeddings can be learnt for a finite set of prototype numbers, and embeddings of numbers calculated as a weighted average of prototype embeddings [
19].
Still, numeracy-preserving embeddings need to be trained on corpora that include numbers [
7,
8]. Some domains such as science [
20] and finance [
18] provide a challenge as well as an opportunity to learn how to embed numbers. Our brief overview of different types of numbers used in clinical narratives (see
Table 1) shows that the majority of them are grounded in units. Such numbers are particularly challenging to model as they need to be interpreted in context [
11].
In particular, medications are associated with multiple grounded numbers such as dosage (the amount of a single medication used in each administration, e.g., two puffs, one tablet, 200 mg), frequency (how often each dose of the medication should be taken, e.g., daily, ×1, once a week) and duration (how long the medication is to be administered, e.g., one week, indefinitely, until the follow-up appointment). The long track record in clinical NLP can be used to facilitate access to training data required for modelling of such numbers. Annotated data already exist for some types of numbers (e.g., medication dosages [
21]). Moreover, there are also open-source tools tested on such data that can be used to annotate much larger silver standards [
22]. Such data can be used to develop and evaluate approaches to preserving numeracy in representation of clinical narratives. To encourage further research in this area, we hereby provide evidence of the benefits of paying special attention to numbers in clinical NLP.
4. Methods
4.1. Preprocessing
Preprocessing text prior to its classification has been shown to be as important as feature extraction, feature selection and classification steps [
25]. Both datasets were preprocessed using a linguistic preprocessing and normalization module originally developed for hospital discharge summaries [
26] and later adapted for referral letters [
27]. Its main purpose is to streamline subsequent text analysis by regularizing the text content. In addition to standard linguistic preprocessing operations such as tokenization, sentence splitting and lowercasing, it handles punctuation in clinical narratives (e.g., by removing period from abbreviations such ‘M.D.’ and ‘
E. coli’) and expands enclitics (e.g., has not is expanded to ‘has not’). A selected subset of words and phrases are replaced by their representatives based on a set of local lexica. For example, the words ‘woman’ and ‘lady’ are replaced by the word ‘female’, the brand names of insulin are replaced by the word ‘insulin’, etc. Here, special consideration is given to acronyms and abbreviations. For example, the abbreviations ‘w/o’, ‘YOF’, ‘DMII’ are replaced by without, ‘year old female’, and ‘diabetes mellitus 2′, respectively.
4.2. Feature Engineering
Feature engineering is the process of transforming raw data into features that are more informative and relevant for machine learning algorithms. It is a complex and time-consuming process, but it can significantly improve the performance of a machine learning model in terms of its accuracy, reliability and robustness. Top-down (or hypothesis-driven or knowledge-driven) feature engineering starts with a high-level understanding of the problem and then identifies features that are relevant to the domain knowledge. This approach can lead to more accurate models, as it takes into account the domain knowledge of the problem. However, it can also be expensive, as it requires a deep understanding of the domain knowledge. Bottom-up (or data-driven) feature engineering starts with individual features and then tests each one individually for predictive power. This approach can be more efficient, as it does not require as much domain knowledge, but it can easily overlook important features.
The best approach to feature engineering will vary depending on a specific problem. In general, it is a good idea to use a combination of both bottom-up and top-down approaches. This will help to ensure that all important features are identified and that the most relevant ones are used by the model. We suggest an inside-out approach to feature engineering, where a bottom-up up approach is used to identify potential features and a top-down approach is used to interpret and process them.
In this study, we are looking to use references to numbers as features in text classification. The bottom-up part of feature engineering is concerned with the availability of numbers in text, whereas the top-down part is concerned with their interpretation in order to assign them to particular types as discussed in the introduction.
Figure 3 describes the overall process of feature engineering. The input consists of a preprocessed corpus of training documents. In order to consider numbers written as words, such words are numerized, i.e., converted to the corresponding Arabic numerals. Numbers are then located in text using a regular expression. Each number is anchored by inserting a special token. By extracting its concordance, we effectively extract contexts of the corresponding numbers. Concordance lines are clustered to facilitate their subsequent analysis whose goal is to identify pertinent numerical features. The analysis is the only manual operation, with the rest being fully automated. The following subsections describe these processing steps in more detail.
4.2.1. Numerization
Numbers can be written in several different ways, depending on the notation system, e.g., Arabic numerals (e.g., 34), Roman numerals (e.g., XXXIV), number words (e.g., thirty-four), scientific notation (e.g., 3.4e-6), fractional notation (e.g., ¾), decimal notation (e.g., 0.75), etc. Numbers can represent quantity, measure or label. For the purpose of feature engineering, we are only interested in numbers that represent quantity or measure. In clinical narratives, Roman numerals are normally used only to label list items. Similarly, scientific notation would be more relevant for scientific articles than clinical notes. Therefore, we focus only on the most prevalent ways of writing numbers in clinical narratives, and these include Arabic numerals, decimal notation and word numbers.
Figure 1 provides examples of such numbers. The first two types (e.g., 22 and 44.5) can be stored directly as integer or float values of the corresponding features. Word numbers (e.g., fifty-five), however, need to be converted into the corresponding numbers (e.g., 55). This is performed as the first step in our feature engineering process, which we refer to as numerization. We implemented it using a series of regular expressions.
4.2.2. Anchoring and Concordancing
In the next step, a regular expression is used to locate numbers and anchor them using a special token that is lexically distinguishable from all other tokens. Anchoring establishes fixed reference points or markers that can be used to identify, extract and manipulate relevant information efficiently. We used the anchor to extract its concordance, i.e., a list of all of its occurrences in the corpus, along with the surrounding context. In corpus linguistics, concordances are often used to study the usage of words and phrases, to identify patterns in language, and to find examples of how words are used in different contexts [
28]. In our case, we use a concordance to analyze the usage of numbers and define the corresponding features.
4.2.3. Clustering
To facilitate such analysis, we automatically cluster similar concordance lines, which makes it easier to identify and interpret a particular pattern of usage. To cluster lines based on their meaning and account for possible variation of terminology used, we embed each line using Sentence-BERT (SBERT) [
29], a framework for learning sentence embeddings using the Bidirectional Encoder Representations from Transformers (BERT) model. BERT is a pre-trained language model that has been trained on a massive dataset of text and code [
30]. SBERT fine-tunes BERT by incorporating pairwise training to generate similar embeddings for sentences that have the same meaning and dissimilar embeddings for sentences with different meanings. SBERT leverages approximate nearest neighbor search algorithms to efficiently retrieve semantically similar sentence embeddings from large corpora. These algorithms allow for fast similarity searches in high-dimensional vector spaces, making SBERT scalable for applications like clustering.
Text clustering is an unsupervised machine learning task of grouping similar texts together. It is a powerful tool for discovering hidden patterns in text data. Text clustering is a complex task, and there are a variety of different algorithms that can be used. We take advantage of both hierarchical and k-means clustering. Hierarchical clustering may not be practical when analyzing large amounts of data. We support random sampling to get a representative view of number usage and save time and resources required for its analysis.
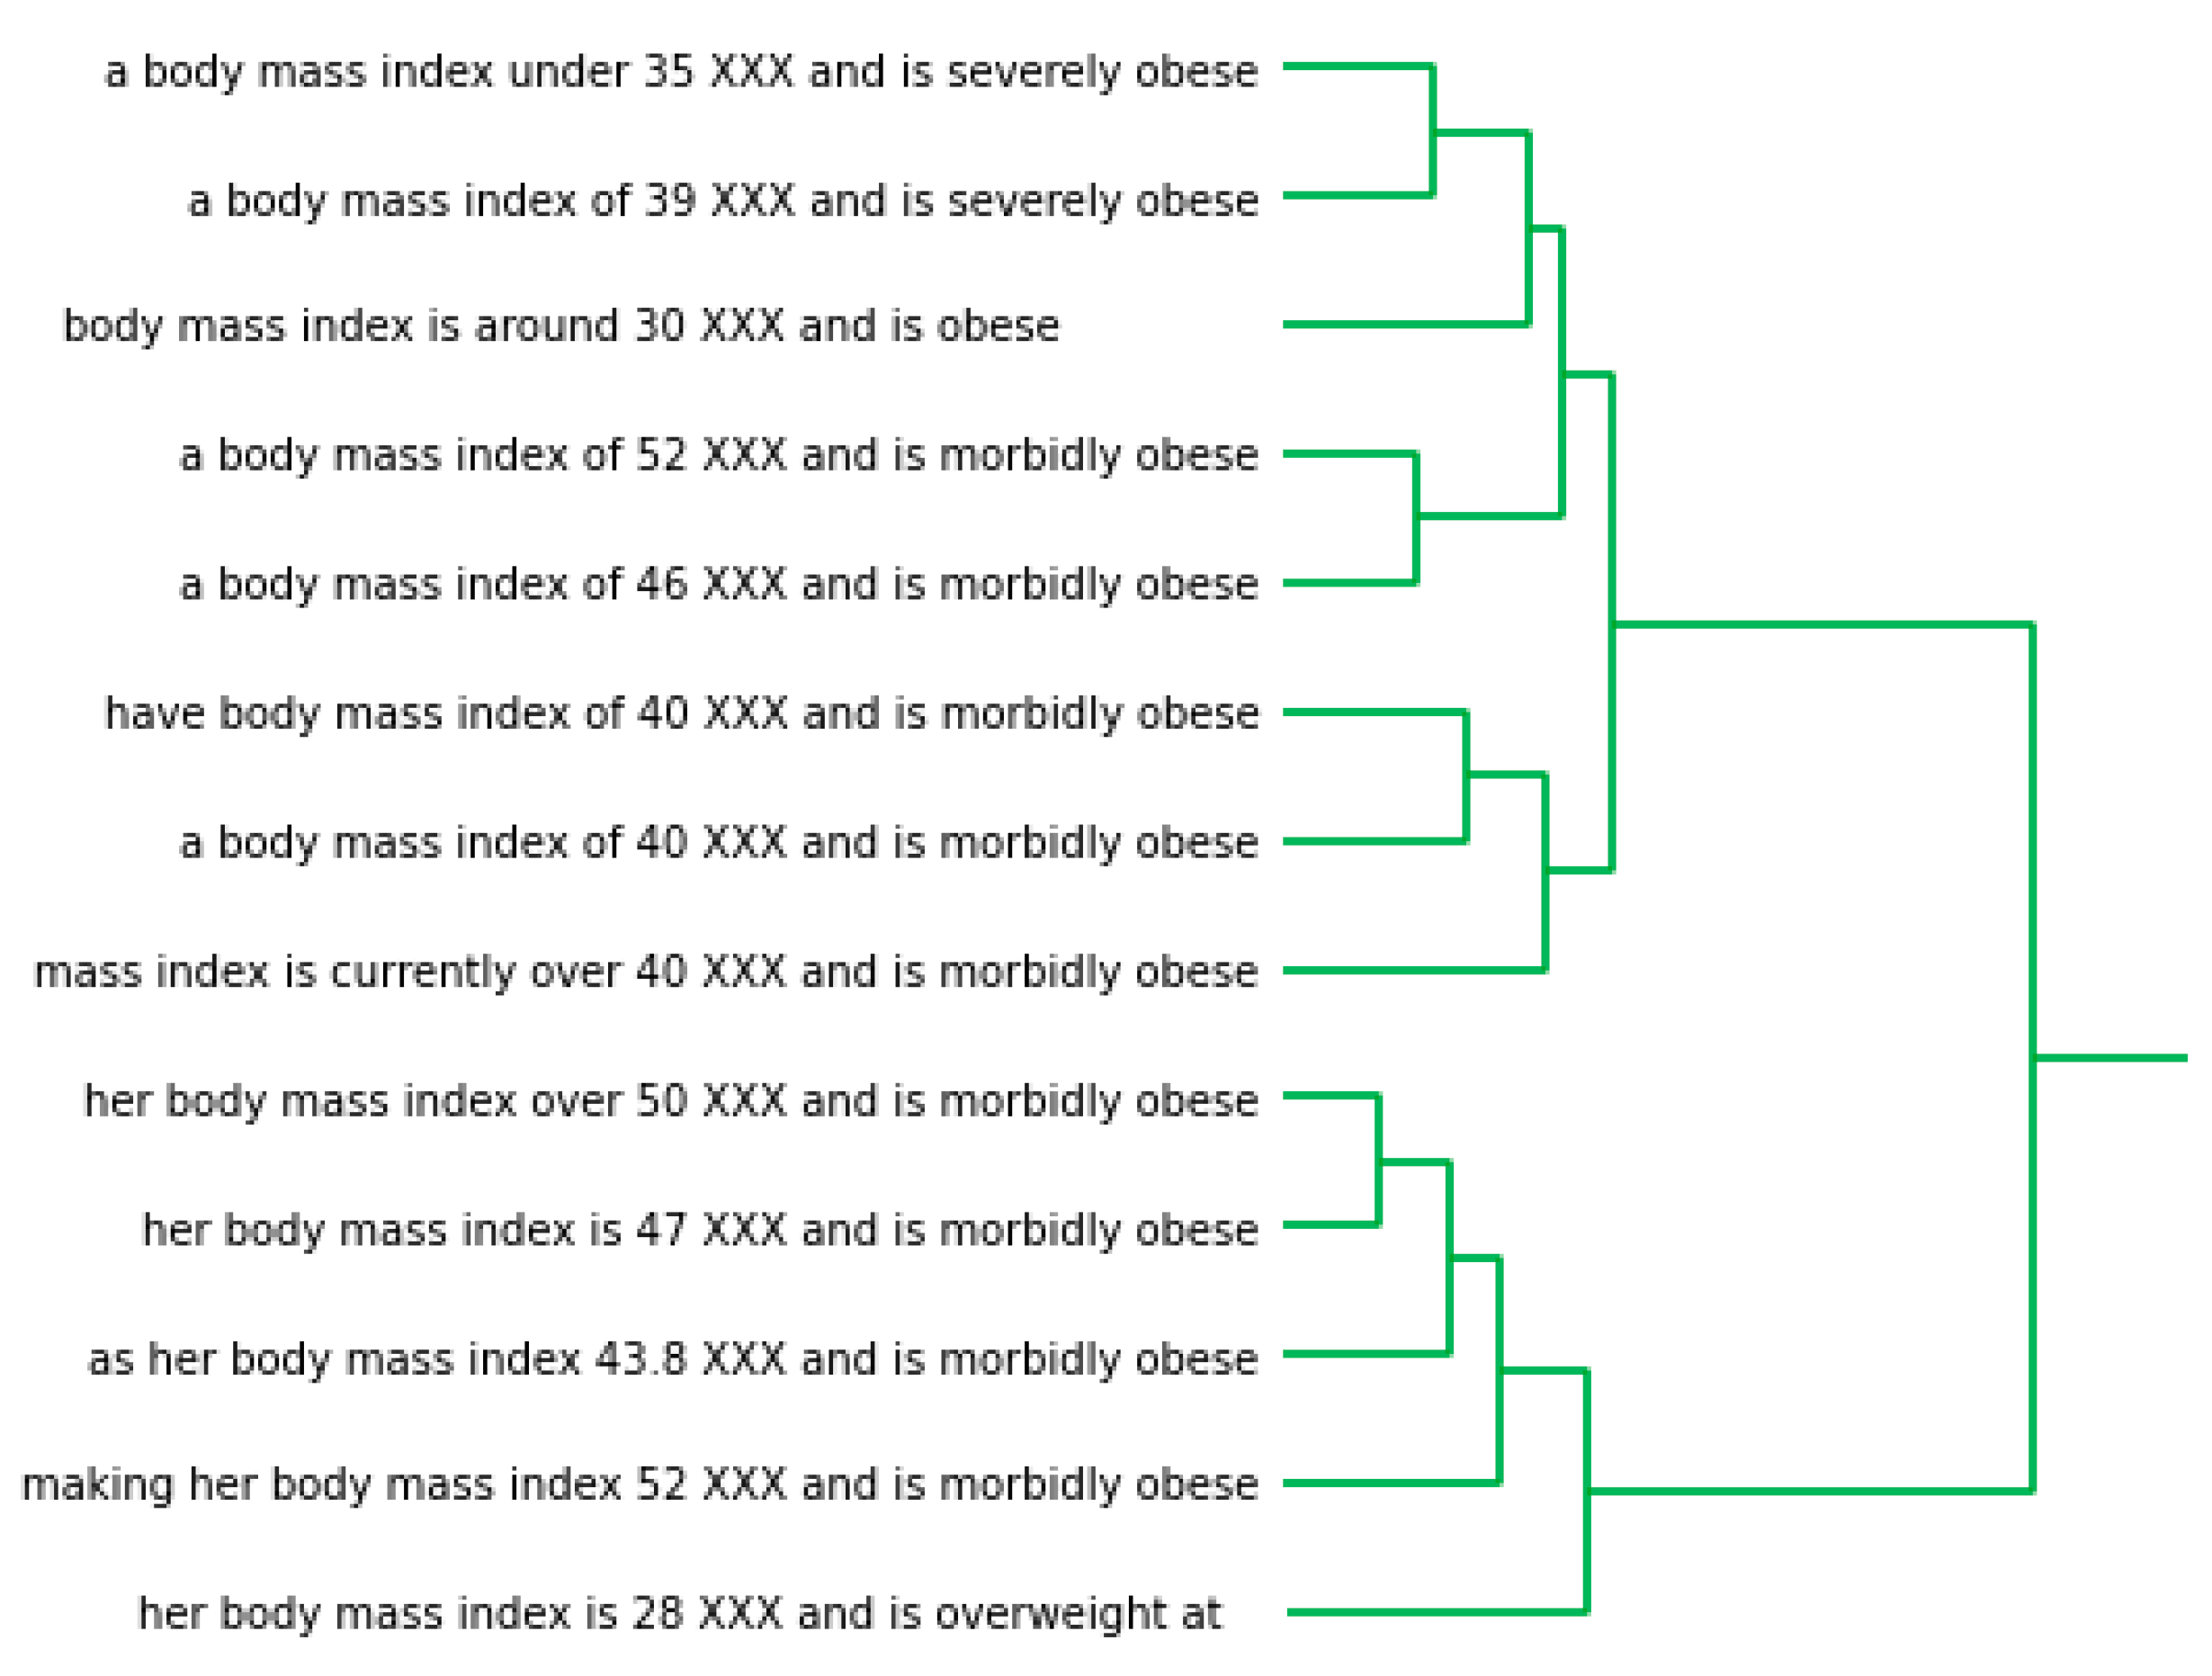
Figure 4 shows an excerpt from a dendrogram produced by hierarchical clustering, which illustrates how BMI is reported in referral letters.
Hierarchical clustering is a more flexible algorithm than k-means clustering. It can be used to find clusters of any shape, while k-means clustering can only find clusters that are spherical in shape. However, hierarchical clustering can be more computationally expensive than k-means clustering. K-means clustering, where k is a user-defined parameter, is a faster algorithm than hierarchical clustering. To facilitate interpretation of large clusters, we provide a user with a word cloud generated from the corresponding contexts.
Figure 5 shows a sample of four clusters identified in the hospital discharge summaries, which can be easily interpreted as (a) age, (b) cardiovascular health, (c) medication dosage, and (d) blood work. Multiple features can be extracted from a single cluster. For example, the medication dosage cluster can be unpacked into one feature per medication, e.g., amiodarone, simvastatin, miconazole, etc. Similarly, the blood work cluster can be unpacked into one feature per test, e.g., white cell count, hematocrit, platelet count, etc. We can also that the age cluster suggests gender as a related feature. We can unpack this into two numerical age features, one for each gender. Even better, we can unpack this into two features, one for age and the other for gender. Even though gender is a categorical feature not a numerical one, it is still worth adding it to the typed representation of numbers as it is clearly relevant for the interpretation of age. Indeed, gender is a clinically relevant variable because the corresponding biological differences can influence various aspects of healthcare including disease prevalence, symptom presentation, treatment response and overall health outcomes [
31]. It is reassuring that the data themselves suggested gender as an important factor in interpreting numerical features.
4.2.4. Analysis
We analyzed the clusters manually with the aim of defining a set of the corresponding features. Even though the features are defined manually, this process is supported by automated extraction of the supporting evidence. The five-step feature engineering process depicted in
Figure 3 is semi-automated with four steps shown in green fully automated and one manual step shown in orange. The visualization of evidence shown in
Figure 4 and
Figure 5 makes it easier for engineers to identify patterns in text data without having to manually search for them.
In our obesity case studies, we identified five features from the referral letters: gender, age, BMI, weight and daily mileage. From hospital discharge summaries, we identified 12 features: gender, age, BMI, weight, ejection fraction, blood pressure, heart rate, respiratory rate, oxygen saturation, blood sugar level, diabetes type and insulin units prescribed. We can observe four features that the two sets have in common: gender, age, BMI, weight. However, the difference between the two sets illustrates why a top-down approach to feature engineering would not be appropriate. For example, physical activity plays a significant role in both the prevention and treatment of obesity. Excess weight places increased stress on the joints, leading to various joint-related issues. Thus, physical activities such as daily runs were found to be commonly reported in orthopedic referrals but not in hospital discharge summaries. Similarly, obesity is closely linked to various physiological factors, which are commonly reported in hospital discharge summaries but not in orthopedic referrals.
4.3. Information Extraction
The output of the feature engineering process described in the previous subsection is a template that consists of a number of slots, each representing a feature. Each slot represents a specific piece of information that needs to be extracted from a text document.
Figure 6 shows a template that needs to be populated with data from a hospital discharge summary.
The tradition of IE dates back several decades and has evolved over time with advancements in computational linguistics and machine learning [
10]. The early approaches to IE were primarily rule-based systems that relied on handcrafted patterns and linguistic rules to identify and extract information from text. These rule-based systems were typically domain-specific and required significant manual effort to create and maintain. Recent developments in QA have alleviated the process of developing domain- and task-specific methods for extracting information from text [
32]. Even though off-the-shelf QA methods can in principle be used to extract answers from text, they are typically trained on data that do not capture the properties of clinical narratives [
33]. The difficulty of training clinical QA systems lies in the data annotation bottleneck [
34,
35,
36] and the instability observed in fine-tuning pre-trained language models for specific tasks in biomedical NLP [
37].
On the other hand, the preprocessing of text makes it highly regular (see
Section 4.1 for details). For example, acronyms such as YO (year old) and kg (kilogram) are already normalized to their long form. In addition, the numbers are anchored and their patterns of usage already identified during cluster analysis. Together, these properties allow for rapid development of IE rules. For example, to extract age it suffices to look for the pattern ‘XXX years? old’. Such pattern is automatically translated into a more sophisticated regular expression ‘(\d+(\.\d+)?) [a-z\s]{0,20} years? old’ that finds and extracts the corresponding number. Overall, we defined 6 and 14 simple pattern-matching rules for referral letters and hospital discharge summaries, respectively.
When multiple values are extracted, the median is selected as the slot filler. Further processing involves converting slot fillers to a common scale. For example, weights expressed in stones or pounds are converted to kilograms. Where possible, missing values are imputed using simple rules. For example, if weight is available, but BMI is not, then BMI is inferred from the weight using the default height. If weight is not specified, we add one stone to the default weight each time weight is referenced in text.
4.4. Document Representation
We performed experiments with two document representations, which include vector space model and word embeddings model. In the introduction, we discussed the shortcomings of both models when it comes to representing numbers. We, therefore, extended both models with typed representation of numbers.
4.4.1. Vector Space Model
We used a bag-of-words (BoW) model, which represents text as a collection of individual words, disregarding grammar and word order [
38]. It creates a vocabulary of unique words, except numbers and stopwords, from the training data and represents each document as a numerical vector, indicating the presence or absence of words from the vocabulary. The words were weighed using TF-IDF to reflect the importance of a word in a document within a collection or corpus [
39,
40]. It calculates the product of the term frequency (TF) and inverse document frequency (IDF) for each word in a document to assign higher weights to words that appear frequently in a specific document but infrequently across the entire corpus. To reduce the number of dimensions, we used χ
2 to select 20% (capped at 500) of features that are most likely related to the target variable.
4.4.2. Word Embeddings Model
Word embeddings can be used as a basis to embed a whole document in the same vector space. State-of-the-art methods for document embeddings are based on transformers, a type of NN composed of a stack of encoder and decoder layers. The encoder layers learn to represent the input, while the decoder layers learn to generate the output. The encoder and decoder layers are connected by attention layers, which allow the model to learn long-range dependencies [
41]. A sequence of tokens (words or even subwords) is fed into the transformer model to generate a document embedding, which can then be used for a variety of tasks including document classification.
BERT [
30] was one of the first transformer models to be released. BERT can be used to embed each token, which can then be pooled to create a single embedding for the entire sequence. Alternatively, a special token [CLS] can be used to represent the entire sequence (e.g., a single sentence or the whole document), which can be used for its classification. However, BERT imposes a limit of 512 tokens to deal with computational complexity, memory constraints and model capacity. As we can see from
Table 3 and
Table 5, both types of clinical narratives used in this study exceed this limit on average. In particular, hospital discharge summaries can exceed this limit by 50-fold. Therefore, BERT cannot be used to embed such documents, thus we considered an alternative transformer model.
Transformers are unable to process long sequences due to self-attention scaling quadratically, thus creating memory and time bottlenecks. Longformer [
42] addresses this limitation by introducing an attention mechanism that scales linearly. It combines a windowed self-attention to build contextual representations and an end-task motivated global attention to build full sequence representations. At 4096, the token limit of Longformer is significantly longer than that of BERT. Nonetheless, it still falls short of the average length of hospital discharge summaries (see
Table 5).
The slice and stride approach can be used to overcome these limitations. A document is sliced into smaller subsequences whose length allows them to be embedded. These embeddings are then combined to form a single vector representation of the document. The slice size and stride size are two important hyperparameters that can affect the quality of the document embedding. The slice size is the number of tokens in each subsequence. The stride size is the number of tokens that are skipped between each subsequence.
The quality of the document embedding can be affected by the slice size and stride size. It can also be computationally expensive to embed long documents. To avoid these issues, we opted to use SBERT [
29] to embed each sentence and then pool these embeddings into a single vector representation of the entire document. We used both mean and max pooling to capture the overall representation and the most important features of a document, respectively. Intuitively, it makes more sense to embed individual sentences for the purpose of obesity classification as the relevant evidence such as weight is likely to be reported in individual sentences and does not require taking into account long dependencies. Empirically, it has also been demonstrated that averaging sentence embeddings is suitable for text classification tasks [
43].
4.4.3. Typed Representation of Numbers
Filled IE template (see
Section 4.3 for details) can be viewed as a vector, which can be used to support typed representation of numbers. As both vector space model and word embedding representations are vectors themselves, we can easily extend them to support typed representation of numbers.
4.5. Document Classification
Once document representation is obtained, a supervised classifier can be trained. The purpose of this study is not to identify the best classifier, but to measure the difference between its performance on two document representations, which do and do not encode numbers explicitly. For that purpose, we designed a document classification framework, which is illustrated in
Figure 7. Input consists of individual documents. Each document is represented using either a BoW or word embeddings model, whose outputs are vectors whose dimensions correspond to words or latent variables, respectively. In parallel, information is extracted from the input document to fill a template, which represents a vector whose dimensions correspond to the previously engineered numerical features.
We chose to combine BoW representation with traditional machine learning. Specifically, we chose support vector machines (SVMs) because of their proven record in clinical text classification [
44].
In the spirit of transformers, we chose to combine document embeddings with a NN. We created a sequential model, a type of NN that is composed of a linear stack of fully connected layers. Overall, we built a model with fully connected layers, dropout regularization and sigmoid activation for binary classification task. The first layer in the model is a dense layer with the same number of neurons as the number of features in the input data. The second layer in the model is a dropout layer, which randomly drops neurons to prevent overfitting. The third layer in the model is another dense layer with half the number of neurons as the first layer. The fourth layer in the model is a dropout layer. The fifth layer in the model is a dense layer with a single neuron, which outputs a probability for the class label. The model is compiled using the binary cross-entropy loss function and the Adam optimizer. The model is trained for 80 epochs using a batch size of 32.
The dotted line leading from the filled template into SVM and NN, respectively indicates its optional use (see
Figure 7). In other words, for each classification algorithm considered, we trained two classification models, one using the original document representation model only and the other using a combination of the original document representation model and typed representation of numbers.
Finally, the output represents a class label of the input document. Specifically, in our case studies the class label represents a prediction of the corresponding patients’ obesity status.
5. Results
Table 6 summarizes the experiments performed. All experiments with the suffix b are baseline experiments, which did not take typed representation of numbers into account. All experiments with the suffix a are advanced experiments, which use typed representation of numbers to extend document representation. As SVM is a deterministic method, its accuracy was calculated once. Conversely, the accuracy of the NN classifier was calculated for 10 runs and the mean average reported in
Table 6. We can observe that the advanced experiments outperformed the baseline experiments to various degrees.
To test the statistical significance of the difference in performance, we first applied bootstrap sampling in all experiments with SVMs. We resampled each dataset, including both training and test data, nine times, which allowed us to train nine additional SVM classification models.
Figure 8 provides a box plot to illustrate the distribution of the accuracy achieved in each experiment defined in
Table 6. We employed the Wilcoxon test, a non-parametric statistical test that can be used to compare the medians of two independent samples [
45]. The
p-values obtained for each pair of experiments are provided at the bottom of
Figure 8. At significance level of 0.05, the results of the Wilcoxon test showed that there was a statistically significant difference between the medians of the two sets of results. In other words, the two models are not equivalent, and the one based on typed number representation is likely to produce better results.
6. Discussion
In
Figure 8, we can observe bigger accuracy improvements on hospital discharge summaries. They are much longer than referral letters (see
Table 3 and
Table 5) and naturally contain more numbers, which ultimately translate into a wider range of numerical features (see
Section 4.2.4). Nevertheless, even a handful of these features proved to make a significant difference in text classification performance. That tells us that commonly used document representations do not represent numbers in a way that machine learning algorithms can effectively utilize them as features.
Typed representation of numbers can be used as a stopgap solution, but community-wide research is required to systematically incorporate number representation into the word embedding process. Contextualized word embeddings provide an opportunity to embed numbers in a way that encodes their types and not mere values. Numbers play an integral role in our understanding of text. While their lexico-syntactic properties are fundamentally different to those of words, their representations need to be integrated into systemic representation of the semantic space that they share.
Successful representations should strive to incorporate not just numbers but other continuous domains as well. For example, gradable adjectives such as ‘mild’, ‘moderate’, and ‘severe’ exist on some cardinal scale, which can be mapped using value embeddings [
46,
47]. Clinical narratives are ripe with references to scales using adjectives (e.g., ‘high blood pressure’ versus ‘low blood pressure’) and even prefixes (e.g., ‘hypertension’ versus ‘hypotension’). Binning numbers to simple categories (e.g., low, normal and high) depending on their context can lead to improved representation of clinical narratives. For example, converting an expression such as ‘blood pressure 190/82’ to ‘high blood pressure’ can make much better use of existing language models.
Clinical NLP has an important advantage over other application domains. Its wider biomedical community has invested heavily into building knowledge resources that can help interpret text. Notable examples include the Unified Medical Language System (UMLS) [
48], Open Biomedical Ontologies (OBO) Foundry [
49] and BioPortal [
50]. For example, they host ontologies such as Systematized Nomenclature of Medicine Clinical Terms (SNOMED CT) [
51] and Logical Observation Identifiers Names and Codes (LOINC) [
52], which describe standard ways of identifying and reporting laboratory observations, including blood tests and associated reference ranges. This provides a great opportunity for NLP to use distant supervision in its efforts to learn how best to represent numbers in large language models.


