Article

Comparison of Imputation Methods for Missing Rate of Perceived Exertion Data in Rugby

1
Canadian Sport Institute, Victoria, BC V9E 2C5, Canada
2
School of Exercise Science, Physical & Health Education, Faculty of Education, University of Victoria, Victoria, BC V8P 5C2, Canada
*
Author to whom correspondence should be addressed.
Mach. Learn. Knowl. Extr. 2022, 4(4), 827-838; https://doi.org/10.3390/make4040041
Submission received: 28 July 2022 / Revised: 14 September 2022 / Accepted: 20 September 2022 / Published: 23 September 2022
(This article belongs to the Section Data)

Abstract

:
Rate of perceived exertion (RPE) is used to calculate athlete load. Incomplete load data, due to missing athlete-reported RPE, can increase injury risk. The current standard for missing RPE imputation is daily team mean substitution. However, RPE reflects an individual’s effort; group mean substitution may be suboptimal. This investigation assessed an ideal method for imputing RPE. A total of 987 datasets were collected from women’s rugby sevens competitions. Daily team mean substitution, k-nearest neighbours, random forest, support vector machine, neural network, linear, stepwise, lasso, ridge, and elastic net regression models were assessed at different missingness levels. Statistical equivalence of true and imputed scores by model were evaluated. An ANOVA of accuracy by model and missingness was completed. While all models were equivalent to the true RPE, differences by model existed. Daily team mean substitution was the poorest performing model, and random forest, the best. Accuracy was low in all models, affirming RPE as multifaceted and requiring quantification of potentially overlapping factors. While group mean substitution is discouraged, practitioners are recommended to scrutinize any imputation method relating to athlete load.

1. Introduction

A standard, and widely accepted, sport metric calculated to determine an athlete’s training and competition load is the session rating of perceived exertion (sRPE) [1,2,3]. sRPE is calculated by multiplying the athlete’s self-reported rate of perceived exertion (RPE), on a 10-point Likert scale, by the duration of the activity [1]. The RPE scale represents ten unique points, or classes, whereby each class is distinct, usually in increasing level of effort where low numbers represent low effort and the highest number, ten, represents an athlete’s maximal possible level of effort with key phrases anchoring the scale and offering a frame of reference to the levels of effort [1]. For example, 0 may have the descriptor of “rest”, 2 “easy”, 7 “very hard”, and 10 “maximal” [1]. For elite team sports, the RPE data for each session is collected through athlete self-report and the activity duration is normally collected through an athlete-worn tracking device (ATD) which collects various kinematic metrics including distance, speed, acceleration, and time [4]. While the data from the ATD can be reliably collected in training and competition with the guidance of a sport science technician, there are difficulties in athlete adherence to self-reporting RPE data. Due to these difficulties, missing RPE data is a common issue in sport training and competition environments, and therefore sRPE data cannot be dependably calculated [3,4,5,6]. Considering the small sample size of elite athlete populations, this missing data limits the statistical assessment of training and competition load to support data-driven sport decision-making [2,3].
Incomplete and potentially inaccurate athlete load data can result in several deleterious outcomes and places athletes at risk of inappropriate training recommendations, potentially leading to physical unpreparedness, injury, or burnout [7]. An important example is the female rugby sevens competition environment in which teams play five or six games in a two- or three-day tournament, often with multiple tournaments happening in a few weeks. This high volume of competition requires a critical focus on athlete management. The use of ATDs, including GPS monitors, is an option for load monitoring, as data collected from ATDs has been used to develop proprietary algorithms that model athlete load and are related to rate of perceived exertion [4]. However, these proprietary algorithms include details that are not disclosed [8,9]. Further, it has been suggested that ATD load algorithms alone may not be optimized to accurately quantify the loads experienced by female rugby athletes, leading to an increased reliance on athlete-reported RPE for the evaluation of the training load [8,9].
In order to potentially mitigate missing RPE data in sport, mathematical techniques for the imputation, or prediction, of missing values present a unique solution [3,4,5,6]. Traditionally, in sport research, missing value imputation (MVI) occurs via value substitution or through classification and regression models [5]. Substitution uses alternative values in place of the missing value [5], while classification or regression models may use other known variables to predict the missing one, and therefore, these methods may be better because of the inclusion of associated athlete-specific metrics and not just one variable [5]. In dealing with RPE from athletes, Benson et al., (2021), and Griffin et al., (2021) advocate for the use of group mean substitution, referred to as daily team mean substitution, whereby the average of the known group RPE data is used in place of a single missing athlete’s RPE value for that same day without influence from any other variables [2,3]. Carey et al., (2016) used more detailed approaches including linear regression, multivariate adaptive regression splines, random forests, support vector machines, neural networks, naïve Bayes, C5.0 decision rules, and ordered logistic regression [10]. Unfortunately, the literature is sparse in terms of comparing single imputation with machine learning methods. Benson et al., (2021) did compare single imputation methods against a least-squares boosted regression tree model, finding that this method was not as robust as daily team mean substitution. However, it must be noted that only one regression imputation strategy was used, and therefore, comparisons between alternative regression or classification strategies with group mean substitution relating to athlete load data are limited [2].
Arguments for group mean substitution focus on the ease of implementation as a team average. It is a simple calculation and preferable to a missing datapoint [2,3]. However, given that RPE reflects an individual athlete’s effort, group mean substitution may over- or underestimate training load data. Further, there is evidence from other domains that mean substitution may be inferior to other more common statistical approaches such as linear regression, random forest classification, or neural networks [10,11,12,13,14]. Given the polyphery of imputation methods available to account for missing data in many fields, from simple linear regression to alternative machine learning models, it is important to consider if an optimal method of imputation is available, and how this method may compare to the current standard of group mean substitution [4,12,13,15]. Therefore, the purpose of this investigation is to compare the current standard method of RPE imputation (daily team mean substitution) to other methods for predicting RPE data in elite women’s rugby sevens competitions.

2. Materials and Methods

Through retrospective qualitative analysis, the effectiveness of RPE missing value imputation was explored through statistical modeling of other objective metrics collected during games in a cohort, observational study. Twenty-one women’s sevens players (25.5 ± 3.90 years old, 169.4 ± 5.89 cm tall, and 71.0 ± 5.64 kg) provided RPE data for 101 international matches (2017–2020). The University of Victoria provided ethics approval for the use of voluntary data collection and the investigation complied with the principles outlined in the Declaration of Helsinki. Further, match date, match number within the tournament, and opponent were provided for each match. All data were anonymized by team staff prior to analysis.
Subjective RPE data were collected following the completion of the match using a 0–10 scale, with athletes providing one RPE rating for the whole match [16,17,18]. Additionally, objective variables from ATDs, worn between the shoulder blades in a custom harness for each athlete, which collected athlete playing time and total distance covered in each match (Apex v.2.50, StatSports, Newry, UK), were available for potential inputs into imputation models.
Footage of each match were evaluated to produce a count of all contacts (sum of tackles, carries, contested restarts, and rucks) (Sportscode v.11, Hudl, Lincoln, NE, USA). The operational definitions used to code the forms of contacts were developed by coaching and analysis staff, maintaining the team’s current analysis practices and applied by one trained analyst [19,20,21,22].
A six-match subset of 65 complete player-match datasets were coded twice by one trained analyst on two separate occasions. A two-way mixed-effects, absolute agreement, single-rater intraclass correlation (ICC 3,1) determined the reliability was 0.99 (95% Confidence Intervals at 0.98–0.99), demonstrating excellent intra-rater reliability [23].
To model the RPE relationship (dependent variable) from objective metrics available through athlete-worn ATD units, match video footage, and provided by team staff (independent variables), statistical models were used to classify and predict RPE data, before comparisons of true RPE data and model-predicted RPE data were made (R version 3.4.4, Vienna, Austria). A total of 987 datasets were used for analysis.
In all models except for daily team mean substitution, RPE data were predicted using match number, player, opponent, total distance in meters, playing time in minutes, and contact count. Prior to modeling, the residual plots and normality plots of RPE data were evaluated for normality. Further details on the explanatory variable data selected as objective variables to improve the imputation of subjective data are found in Table 1.
The models used to classify and predict RPE data were selected based on a combination of models used in the current sport literature to impute missing RPE data as well as models that can be completed using open-source software [2,3,10,11,14]. In this investigation, RPE values were classified and predicted using daily team mean substitution [2,3], regression models (linear, (R stats package) stepwise (R MASS), lasso, ridge, elastic net (lasso, ridge, and elastic net using R glmnet)), k-nearest neighbours (R FNN), random forest (R randomForest), support vector machine (R e1071), and neural network models [24,25,26,27,28,29,30,31,32,33,34,35].
Data were divided between a training and a test dataset, whereby 80% of the data were designated for training models and 20% for testing models to produce predicted RPE scores, iterated 100 times with mean values used for downstream analysis. The same equation (Equation (1)) was used for each model:
RPE = Match Number + Player + Opponent + Total Distance + Playing Time + Contact Count
Predicted RPE scores were then compared to the true RPE scores from the test dataset and the accuracies of each model were calculated. Accuracy, or the rate of correctly predicted RPE scores, R2, and root mean square error (RMSE) were identified as key metrics of interest in evaluating if the models were able to appropriately impute the RPE value in comparison to the true RPE.
The imputed values from the test dataset, at 20% missingness, were compared against the true RPE values using a paired-samples equivalence test (paired TOST) to establish statistical equivalence, or more practically, interchangeability of models [36,37]. 20% missingness was determined to be a reasonable level of missingness as practically that was the equivalent to 2–3 missing RPE values within a team of rugby sevens players which, on the advice of team staff, represented the regular outcomes of data collection [2,3]. The paired-samples equivalence test used bounds of Cohen’s d × σ, in this case using a Cohen’s d of 0.2, to represent a small effect size [37].
To explore the cases of divergence in accuracy, all imputation strategies were tested at different levels of missingness, in 5% increments, from 5% to 30% and iterated 100 times. A one-way ANOVA compared model accuracy by type, by missingness, and by the interaction of model type and missingness in recognition that the model accuracy may be dependent on the level of data missingness. This investigation hypothesized that different types of models would improve accuracy over daily team mean substitution [38,39]. Further, it was hypothesized that as levels of missingness increase, accuracy would decrease, both in general across all models as well as by particular model type.
Finally, a supervised model based on a relationship between RPE and total distance (Equation (2)) was used to identify the relevance of the model type accuracy across levels of missingness (5% increments from 0% to 30% imputed data).
RPE = Total Distance
Regressions were generated from data imputed using the different models and across different levels of missingness. One-way ANOVAs assessed the influence of model type and missingness on the slope. It was hypothesized that model type may drive particular significant differences in the regressions, especially as 0% missing data, or data with no imputed values, were included for analysis. This analysis would highlight cases where model selection diverged from the true data across levels of missingness.

3. Results

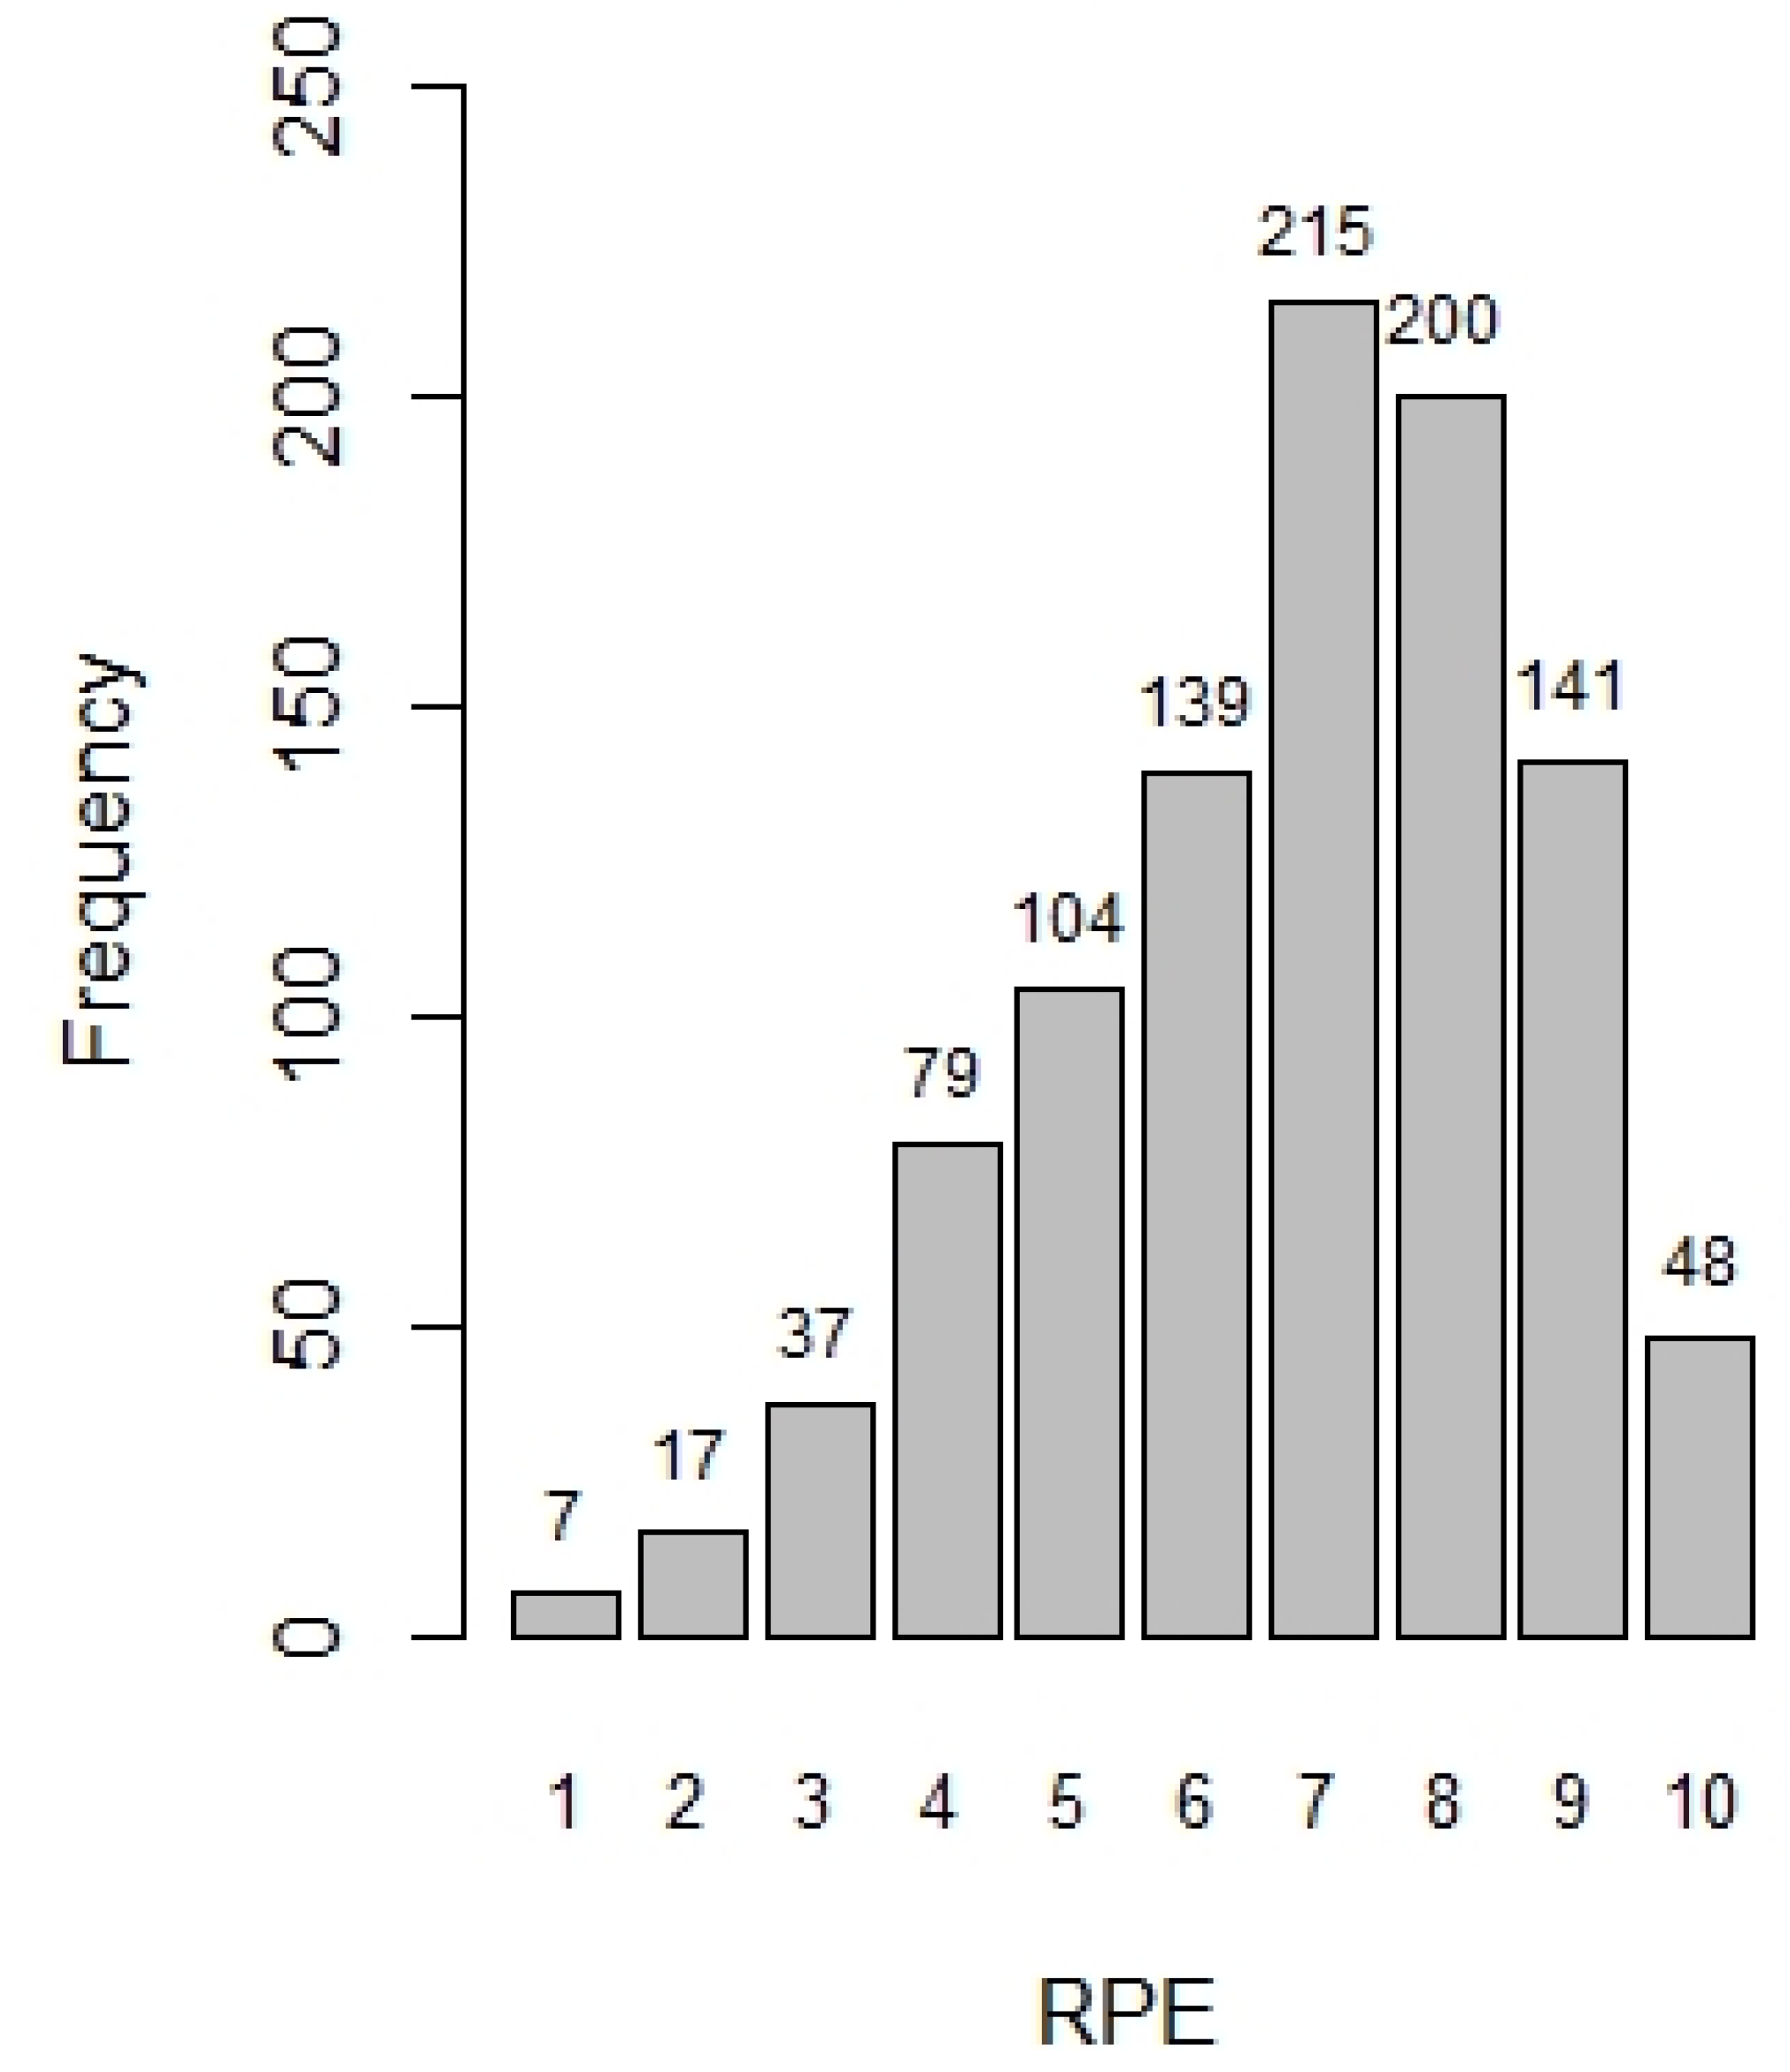
3.1. Description of Data

The frequency of athlete-reported RPE values used in developing the models is shown in Figure 1 (mean RPE = 7 ± 1.9 au). Investigation of the residual plot showed a random scatter of points, and the normality plot showed the residuals fall on a straight-line, indicating the normality assumption was appropriate for RPE. On average, athletes covered 1082.86 m of total distance (±439.78 m), played 11.04 min (±4.67 min), and experienced five contacts (±three contacts) per match.

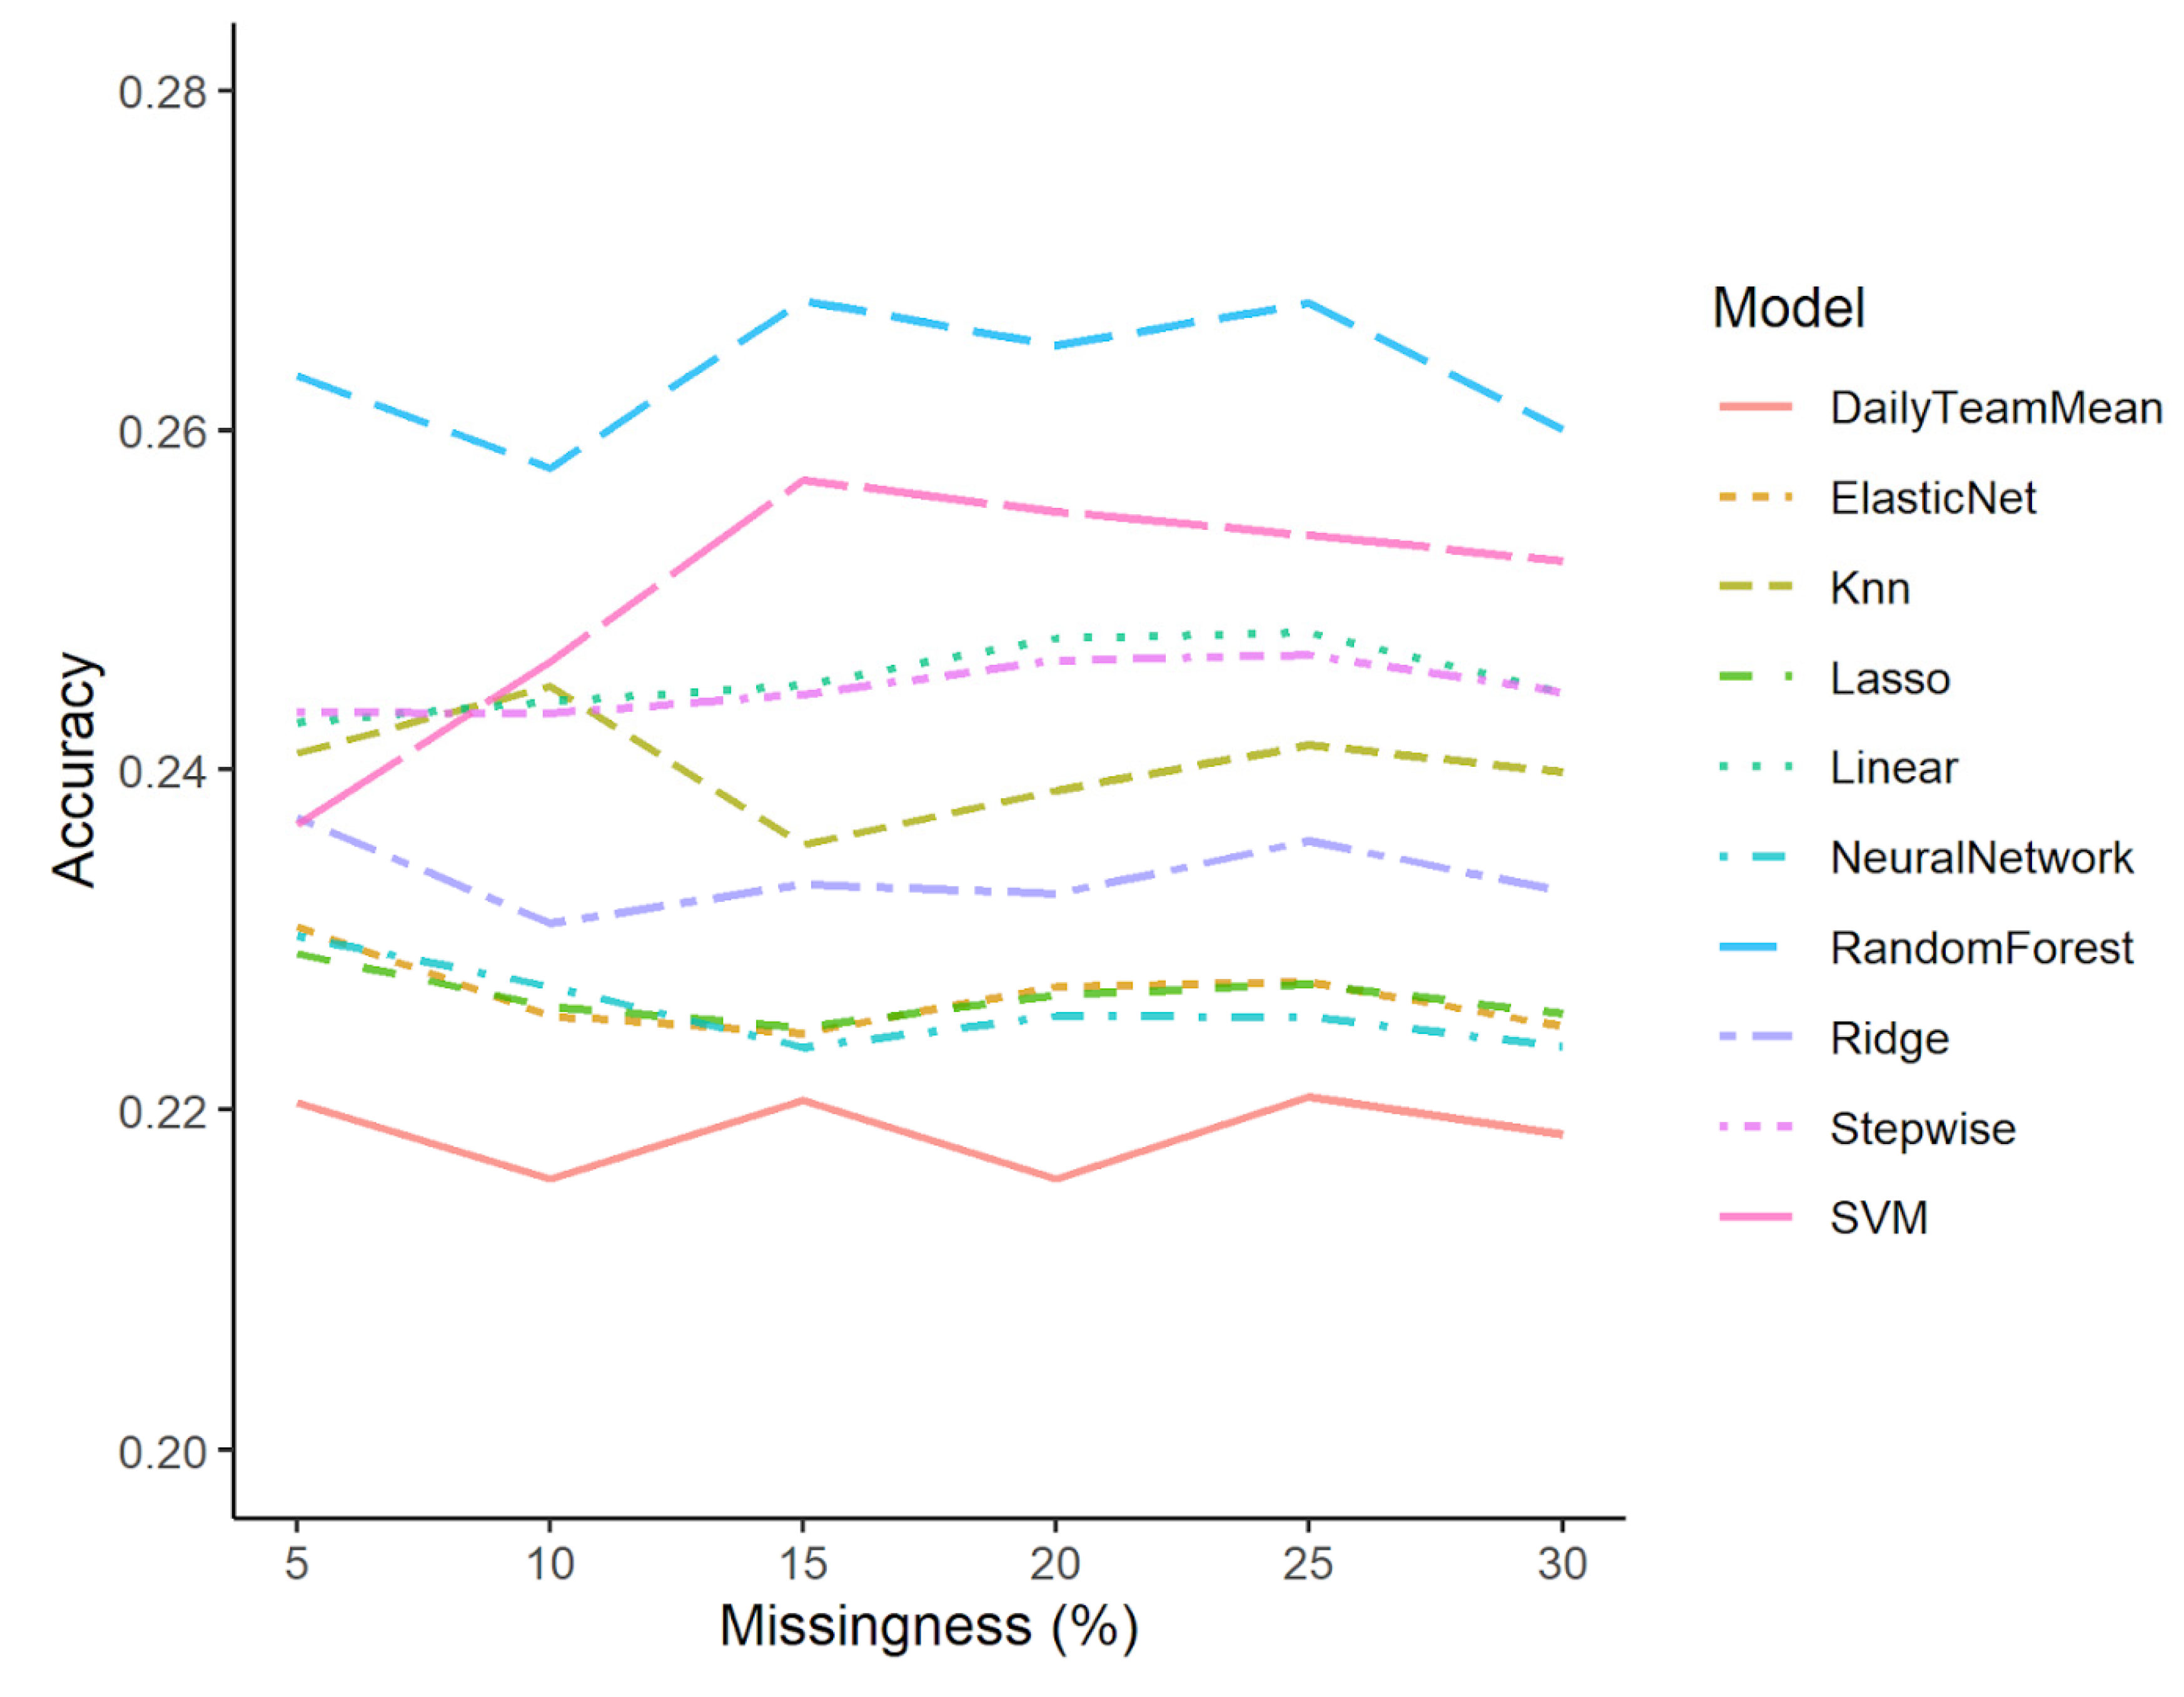
3.2. Model Performance

Imputation model accuracy, R2, and RMSE values are reported in Table 2.

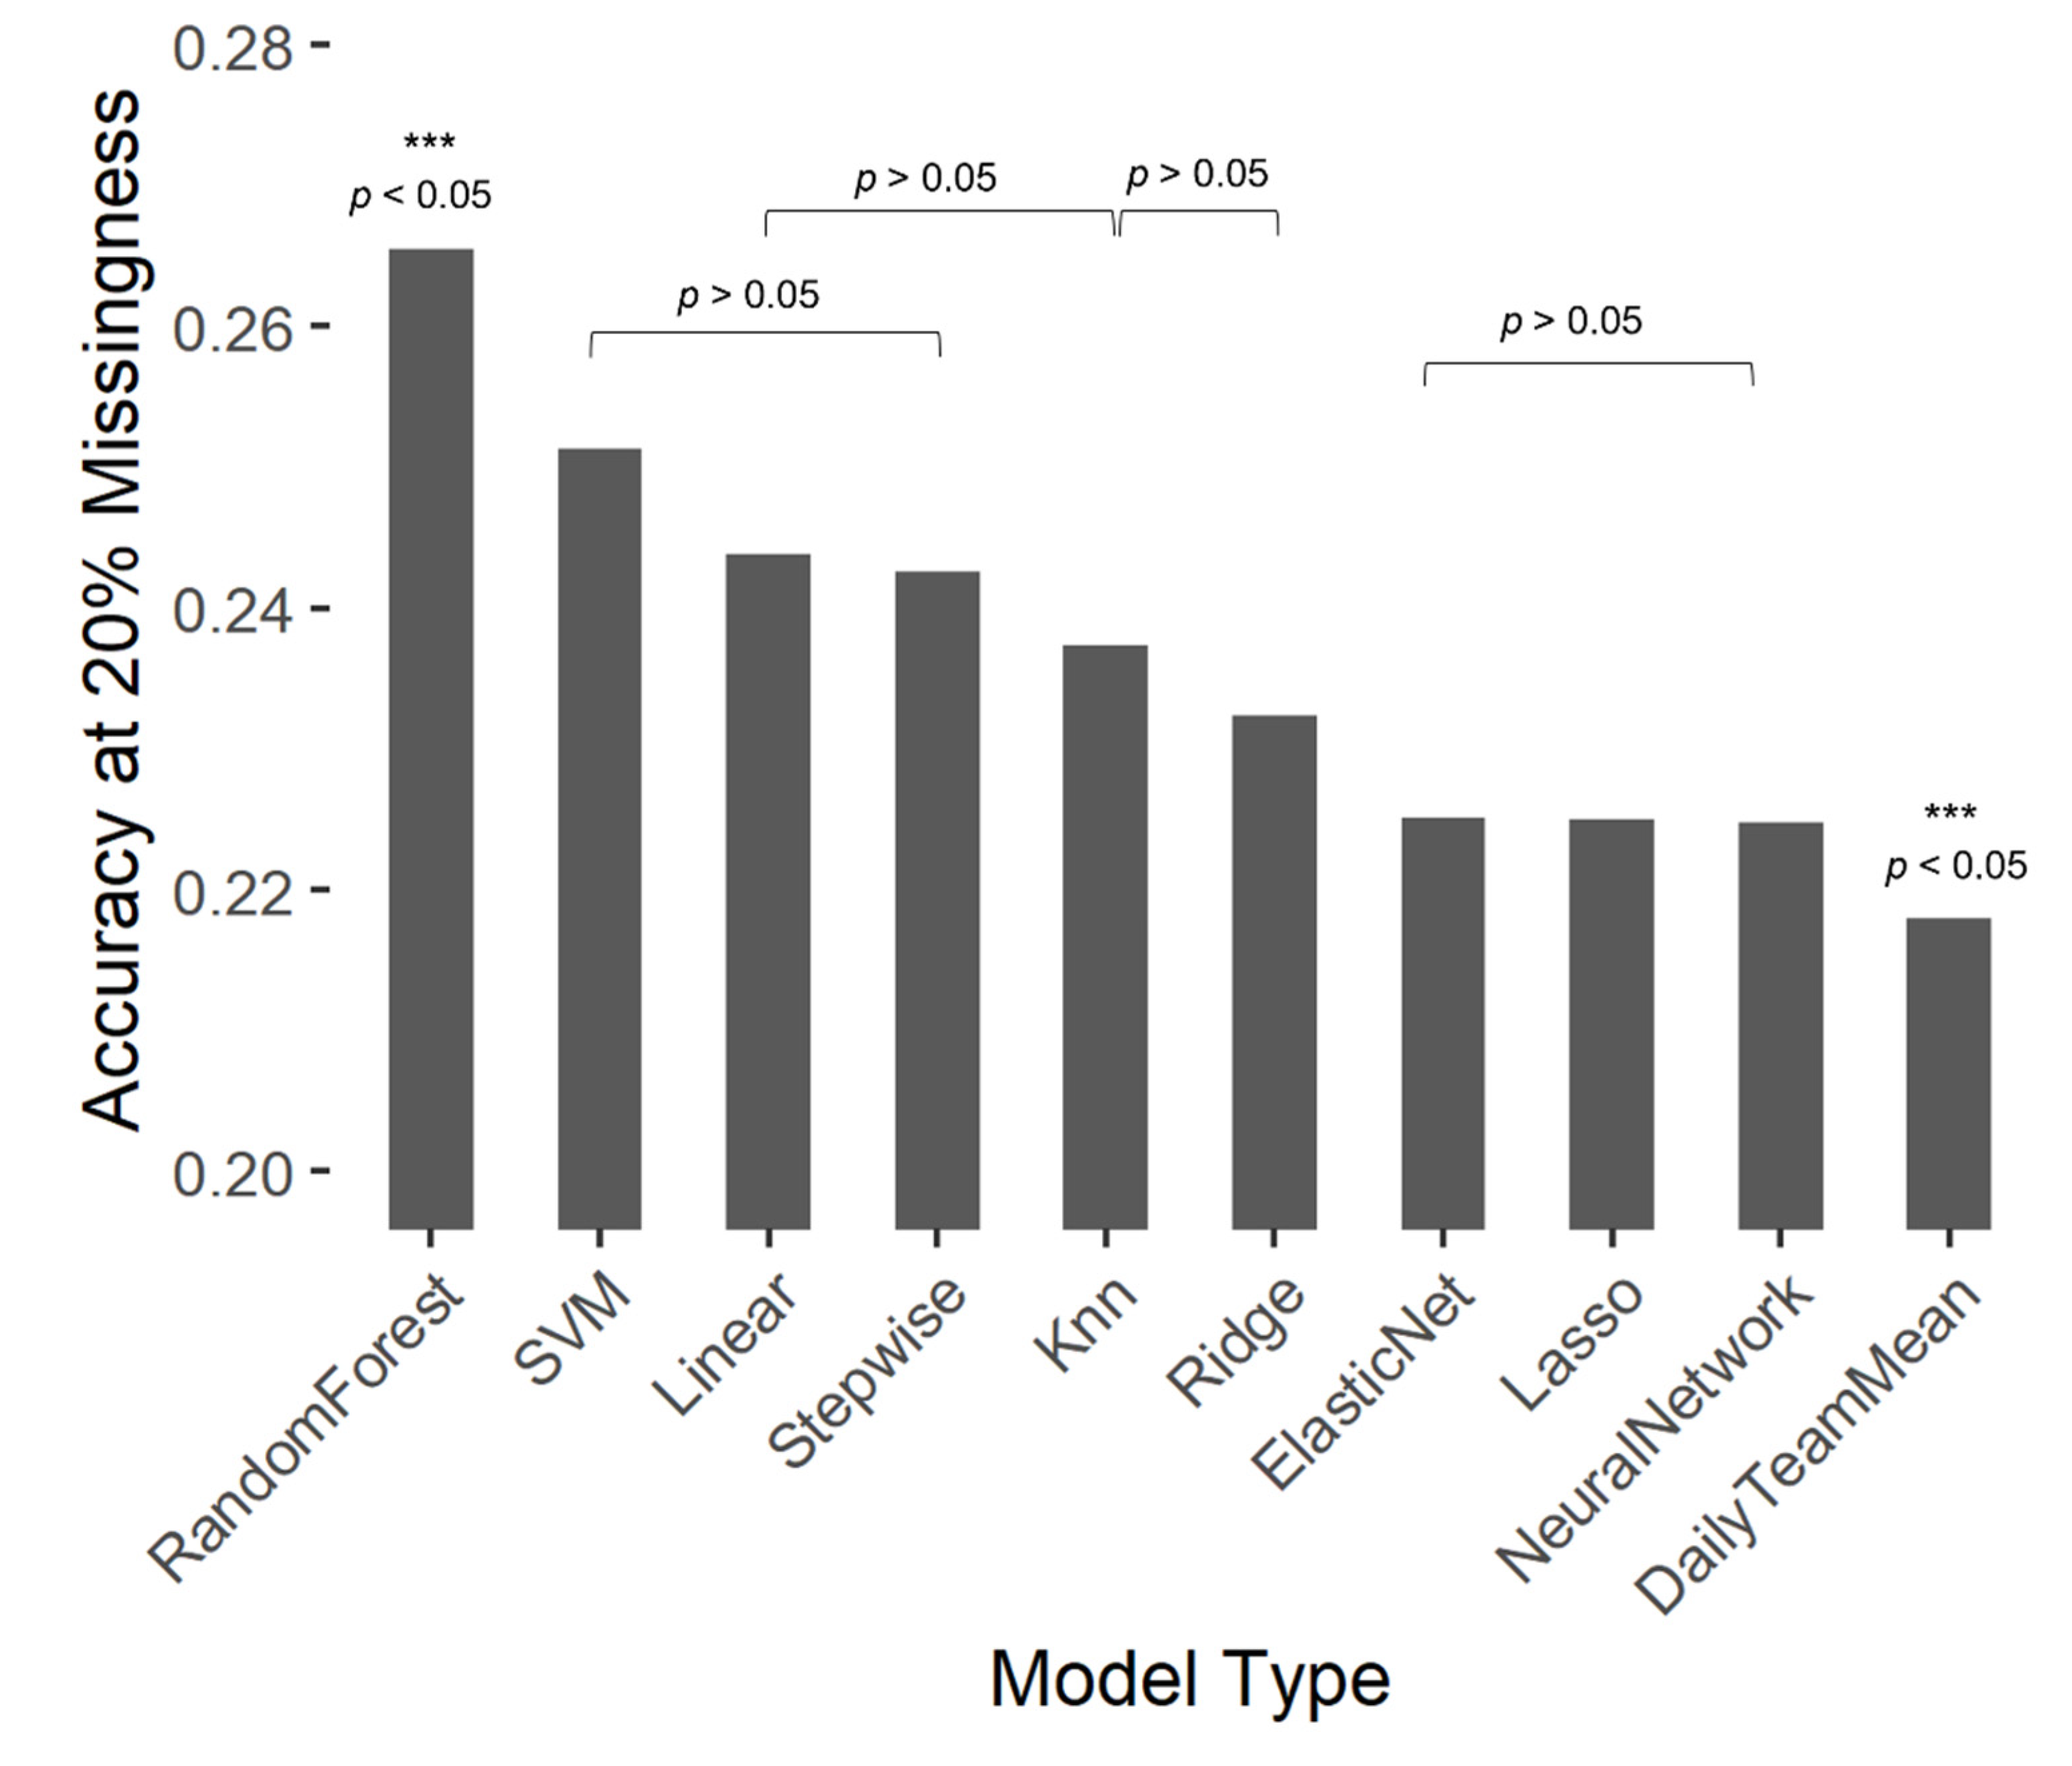
3.3. Comparison of Models

Paired-samples equivalence tests of each imputed model against the true RPE resulted in all tested models being deemed statistically equivalent to the true RPE data (p < 0.05).
The one-way ANOVA of the data at 20% missingness found a statistically significant difference in model accuracy by imputation model type (F (9, 5940) = 86.83, p < 0.05); however, it did not report statistically significant differences by missingness (F (5, 5940) = 0.99, p > 0.05) or the interaction of missingness and model type (F (45, 5940) = 0.86, p > 0.05). A Bonferroni post hoc test determined that statistically significant differences in the mean differences existed between select models (Figure 2. Both daily team mean substitution and random forest differed from all other models (p < 0.05) (Figure 3).
The accuracy of each model across cases of missingness is highlighted in Figure 3.
The one-way ANOVA of the slope of the supervised regression found statistically significant differences in slope by model type (F (9, 1454) = 1.93, p < 0.05), and by level of missingness (F (6, 1454) = 2.83, p < 0.05). A Tukey post hoc revealed that the daily team mean substitution and neural network model types were significantly different than all other models across all levels of missingness, including the complete dataset (0% imputed data).

4. Discussion

This study is the first to compare different methods of imputation across levels of missingness of RPE data in women’s rugby sevens. Overall, daily team mean substitution was outperformed by every other method in terms of accuracy, with the random forest model performing better than other models. Daily team mean substitution was not equivalent to any other model, and the limited accuracy, R2, and relatively high RMSE affirms that the team average is not a suitable proxy for individual athlete data. Furthermore, all tested models performed poorly for accuracy and RMSE across multiple levels of missingness. Overall, our results suggest that the present substitution method, as well as other common statistical models, are not suitable imputation approaches, and that the prediction of missing data may require more investigation as well as the use of more robust statistical approaches which consider the inclusion of the numerous factors affecting the individual’s performance [2,3,10,11,16].
While the popularity of daily team mean substitution stems from the efficiency of substitution over other methods, the poor accuracy, R2, and RMSE scores (Table 2) of the daily team mean substitution relative to other methods of imputation suggests that this is not the most robust option. The finding that mean substitution is a poor candidate for imputation is common in data with human subjects like those of the medical or athletic performance fields. Musil et al., (2002) performed imputation using regression and substitution models and noted that while all methods have limitations, mean substitution was the least effective and linear regression was the most effective of the imputation models [11]. Waljee et al., (2013) found that mean imputation produced the greatest error, while random forest, the least [13]. Further, in Australian football, an open-skill field sport with similar skill demands to rugby sevens, Carey et al., (2016) found success in imputing RPE data using non-linear regression models, over neural networks [10]. The very low accuracy across levels of missingness (Figure 3) suggests that daily team mean substitution consistently underperforms RPE imputation compared to methods which rely on additional athlete information [2,3]. Daily team mean substitution may be a poor method for data from individual athletes in a team sport, such a rugby sevens, due to multiple varying levels of factors that could impact the athlete’s perceived experience. For example, athletes may participate for different time periods (i.e., starting player vs. substitute player), be asked to perform specialized skills by position (i.e., kicking) and experience different levels of sprint efforts or contact [40,41]. Additionally, given the global nature of the RPE metric, tactical decision-making, mental fatigue, or other psychological states may influence perceived experience [17]. This therefore may require multiple factors to be quantified and used to contribute to imputation methods, and may account for the improved accuracy of other imputation models tested that use multiple variables for their calculation [16,41,42]. Conversely, it may be possible that daily team mean substitution may be a suitable model for sports where athletes are performing the same loads or skill demands with limited variable conditions and factors such as during race events [43,44].
The significant equivalence testing in this study further suggests that the imputed data are not different from true RPE scores. This is true for all imputation methods and could suggest that any of the models tested are comparable for RPE data imputation. However, this result needs to be considered alongside model accuracy (ANOVA) which suggests that there are significant differences between the models. These results demonstrated that daily team mean substitution and random forest were significantly different from all other imputation models, with daily team mean substitution having the lowest accuracy and random forest having the highest. Further analysis from the supervised regression model demonstrated that model type and missingness did have a significant influence on the slope of the relationship between RPE and total distance, with the daily team mean substitution and neural network model types being significantly different than all other imputation techniques, including the complete, non-imputed dataset, model. The supervised assessment demonstrates the relevance of model selection and level of data missingness on the relationship between valuable training load metrics and further highlights that daily team mean substitution and neural network are poor performing models. These results are contrary to the current recommendations for RPE imputation, suggesting that daily team mean substitution or neural network models are viable imputation techniques [2,3,10]. Taken together, the results of the ANOVAs, as well as model performance data (Table 2, Figure 2 and Figure 3) suggest that daily team mean substitution is the least robust imputation method, and random forest, the most robust of the methods evaluated. In cases of relatively low to moderate missingness, support vector, linear, or stepwise regression techniques may also be applicable. In alignment with the results of this study, Waljee et al., (2013) identified the use of random forest classification as an imputation strategy with a high accuracy in medical data missing completely at random (MCAR) [13]. Hong and Lynn (2020) noted that random forest imputation yields high predictive accuracy in cases of data missing at random (MAR) [45]. It is reasonable to suggest that RPE data falls within the case of MAR whereby an athlete’s ability to report their RPE value for a match may be affected by overall fatigue, mental stress, or physical state. Since random forest models do not require data pre-processing and can handle a wide variety of datasets without relying on distributional assumptions, these classifiers present an appealing choice for imputation [46,47]. Nevertheless, while random forest models exhibit predictive accuracy, these models cannot estimate relationships involving imputed values [45]. Therefore, imputed values from different models may need to be tested in a more supervised manner to existing, explainable situations [12,47,48]. Additionally, alternative models to those not considered in this investigation, including models using fuzzy clustering or Bayesian approaches, may be explored [12]. Fuzzy clustering may more appropriately describe outcomes, given the overlap in ranges of input data and particularly small number of possible outcomes, further improving accuracy [49].
Support vector machine regression and linear regression were secondary and tertiary top-performing models, at 20% missingness. When comparing support vector machine and random forest imputation models, Shataee et al., (2012), noted that random forest models were somewhat superior to support vector machine models, as random forest models did not necessarily require the reduction of predictors, which is sometimes required in the use of support vector machine regression [50,51]. Interestingly, Musil et al., (2002) found that linear regression was the most optimal approach with their dataset, supporting the results of this study [11]. Simple linear regression and stepwise regression outperformed other more involved models, such as lasso and elastic net regression strategies, perhaps due to the nature of penalized regression present in elastic net and lasso strategies relative to simple linear regression [52]. Further, the neural network model, a technique that is generally robust at imputation due to the presence of predictive functions within the layers enabling identification of combinations of properties, was not a top-performing model [53]. This is most likely due to the particular constraints on the neural network model used in the present study of a sigmoid function with one hidden layer. Given the range of possible imputation models presented in the literature, it is possible that particular methods may in fact be equivalent or interchangeable. Therefore, future research should seek to identify optimal imputation strategies in supervised settings that promote actionable outcomes.
Despite the presence of statistical differences by model type, accuracy was very low across all models [54]. One potential reason for this low accuracy may be the nature of the dataset, as there was low variance of RPE values (mean RPEtrue = 7 ± 1.9 au) (Figure 1). Another potential reason for this stems from the use of accuracy as the means to evaluate model performance. Accuracy assesses agreement between true and imputed scores such that if a true score is 7 and an imputed score is 7, that represents an accurate imputation; however, if the imputed score is 8, the model performed inaccurately. This is a harsh threshold, which may in fact punish models that are predicting scores within one RPE value, thereby predisposing accuracy scores to be low through the inherent limitation of binary classification. Alternatives to accuracy may include graphical-based metrics like Receiver Operating Curves or Precision-Recall Curves [55]. To counter this limitation, R2 and RMSE scores are reported (Table 2) and a supervised regression is also completed. It remains important to recognize that RPE has been found to potentially have scalar properties; in competition environments, RPE increases across competitive efforts with maximal RPEs most often reported in and around finals or standalone events [56,57,58]. Therefore, future analysis including a broader range of RPE values, such as using the RPE values generated across a season of diverse training periods, may enable improved accuracy of RPE imputation. Including additional associated variables with known relationships to RPE, sport- or individual-specific, may improve training load accuracy [16,42]. To that end, the identification of potentially overlapping factors would further enable the development of optimal strategies for working with missing athlete data [16,42].
Efficiency of analysis, for a faster dissemination of knowledge, has been identified as a key consideration for sport practitioners working in high-performance environments [59,60,61]. This means that while the results of this study suggest that several imputation models may be interchanged for the current standard of group mean substitution (daily team mean substitution) and still produce results that are not statistically different and statistically equivalent to true RPE scores, some models may be more applicable than others in the applied sport environment. This study highlights that random forest classification outperforms the existing group mean substitution standard, as well as more complex machine learning models such as neural networks in cases of low to moderate missing data. This study also offers practitioners the possibility of leveraging methods like random forest, support vector machine, or even simple linear regression or stepwise regression to complete datasets, allowing for further evaluation of training load monitoring. Practically, random forest classification, or even simple linear or stepwise regression, offer reasonable options for the prediction of missing RPE values in comparison to group mean substitution approaches, such as daily team mean substitution. Low imputation method accuracy across all methods means that any attempt to predict missing data requires care, including scrutiny of methods and data used to develop the models. Finally, practitioners are advised to prioritize data collection from athletes directly above applying any imputation methods, such as daily team mean substitution, linear regression, or otherwise, to predict missing data.

Author Contributions

Conceptualization, A.E.-S., M.K. and M.-C.T.; methodology, A.E.-S., M.K. and M.-C.T.; software, A.E.-S., M.K. and M.-C.T.; validation, A.E.-S.; formal analysis, A.E.-S., M.K. and M.-C.T.; investigation, A.E.-S.; resources, A.E.-S.; data curation, A.E.-S.; writing—original draft preparation, A.E.-S.; writing—review and editing, M.K. and M.-C.T.; visualization, A.E.-S.; supervision, M.K. and M.-C.T.; project administration, M.K.; funding acquisition, A.E.-S., M.K. and M.-C.T. All authors have read and agreed to the published version of the manuscript.

Funding

This work was part of a project funded by Mitacs. The Mitacs Accelerate PhD Fellowship has been awarded to A.E.-S., and the project was supervised by M.K. and M.-C.T.

Data Availability Statement

Data supporting the conclusion of this article may be made available by the authors upon request without undue reservation. Code used is available at: https://gitlab.com/a.eppstobbe/comparison-of-imputation-methods-for-missing-rate-of-perceived-exertion-data-in-rugby/-/blob/main/MVI_accuracy_missingness_5-30_multipleiterations.R (accessed on 25 July 2022).

Acknowledgments

The authors gratefully acknowledge Rugby Canada for their cooperation and support with this project.

Conflicts of Interest

The authors have no conflict of interest related to this study, nor does the information in this study constitute product endorsement by the authors.

References

  1. Haddad, M.; Stylianides, G.; Djaoui, L.; Dellal, A.; Chamari, K. Session-RPE method for training load monitoring: Validity, ecological usefulness, and influencing factors. Front. Neurosci. 2017, 11, 612. [Google Scholar] [CrossRef]
  2. Benson, L.C.; Stilling, C.; Owoeye, O.B.A.; Emery, C.A. Evaluating methods for imputing missing data from longitudinal monitoring of athlete workload. J. Sports Sci. Med. 2021, 20, 188–196. [Google Scholar] [CrossRef]
  3. Griffin, A.; Kenny, I.C.; Comyns, T.M.; Purtill, H.; Tiernan, C.; O’Shaughnessy, E.; Lyons, M. Training load monitoring in team sports: A practical approach to addressing missing data. J. Sports Sci. 2021, 39, 2161–2171. [Google Scholar] [CrossRef]
  4. Cummins, C.; Orr, R.; O’Connor, H.; West, C. Global positioning systems (GPS) and microtechnology sensors in team sports: A systematic review. Sports Med. 2013, 43, 1025–1042. [Google Scholar] [CrossRef]
  5. El-Masri, M.M.; Fox-Wasylyshyn, S.M. Missing data: An introductory conceptual overview for the novice researcher. Can. J. Nurs. Res. 2005, 37, 156–171. [Google Scholar]
  6. Windt, J.; Ardern, C.L.; Gabbett, T.J.; Khan, K.M.; Cook, C.E.; Sporer, B.C.; Zumbo, B.D. Getting the most out of intensive longitudinal data: A methodological review of workload–injury studies. BMJ Open 2018, 8, e022626. [Google Scholar] [CrossRef]
  7. Gabbett, T.J. The training-injury prevention paradox: Should athletes be training smarter and harder? Br. J. Sports Med. 2016, 50, 273–280. [Google Scholar]
  8. Clarke, A.C.; Anson, J.M.; Pyne, D.B. Physiologically based GPS speed zones for evaluating running demands in women’s rugby sevens. J. Sports Sci. 2015, 33, 1101–1108. [Google Scholar] [PubMed]
  9. Clarke, A.C.; Anson, J.M.; Pyne, D.B. Proof of concept of automated collision detection technology in rugby sevens. J. Strength Cond. Res. 2017, 31, 1116–1120. [Google Scholar]
  10. Carey, D.; Ong, K.; Morris, M.; Crow, J.; Crossley, K. Predicting ratings of perceived exertion in Australian football players: Methods for live estimation. Int. J. Comput. Sci. Sport 2016, 15, 64–77. [Google Scholar] [CrossRef]
  11. Musil, C.M.; Warner, C.B.; Yobas, P.K.; Jones, S.L. A comparison of imputation techniques for handling missing data. West. J. Nurs. Res. 2002, 24, 815–829. [Google Scholar] [CrossRef]
  12. Schmitt, P.; Mandel, J.; Guedj, M. A comparison of six methods for missing data imputation. J. Biomet. Biostat. 2015, 6, 1–6. [Google Scholar] [CrossRef]
  13. Waljee, A.K.; Mukherjee, A.; Singal, A.G.; Zhang, Y.; Warren, J.; Balis, U.; Marrero, J.; Zhu, J.; Higgins, P.D. Comparison of imputation methods for missing laboratory data in medicine. BMJ Open 2013, 3, e002847. [Google Scholar] [CrossRef]
  14. Celton, M.; Malpertuy, A.; Lelandais, G.; de Brevern, A.G. Comparative analysis of missing value imputation methods to improve clustering and interpretation of microarray experiments. BMC Genom. 2010, 11, 15. [Google Scholar] [CrossRef]
  15. Fox-Wasylyshyn, S.M.; El-Masri, M.M. Handling missing data in self-report measures. Res. Nurs. Health 2005, 28, 488–495. [Google Scholar] [CrossRef]
  16. Mujika, I. Quantification of training and competition loads in endurance sports: Methods and applications. Int. J. Sports Physiol. 2017, 12, S29–S217. [Google Scholar] [CrossRef] [PubMed]
  17. Eston, R. Use of ratings of perceived exertion in sports. Int. J. Sports Physiol. Perform. 2012, 7, 175–182. [Google Scholar]
  18. Comyns, T.; Flanagan, E.P. Applications of the session rating of perceived exertion system in professional rugby union. Strength Cond. J. 2013, 35, 78–85. [Google Scholar]
  19. Gabbett, T.; Kelly, J. Does fast defensive line speed influence tackling proficiency in collision sport athletes? Int. J. Sports Sci. Coach. 2007, 2, 467–472. [Google Scholar]
  20. Gabbett, T.; Kelly, J.; Pezet, T. Relationship between physical fitness and playing ability in rugby league players. J. Strength Cond. Res. 2007, 21, 1126–1133. [Google Scholar]
  21. King, D.; Hume, P.; Clark, T. Video analysis of tackles in professional rugby league matches by player position, tackle height and tackle location. Int. J. Perform. Anal. Sport 2010, 10, 241–254. [Google Scholar] [CrossRef]
  22. Wheeler, W.K.; Wiseman, R.; Lyons, K. Tactical and technical factors associated with effective ball offloading strategies during the tackle in rugby league. Int. J. Perform. Anal. 2011, 11, 392–409. [Google Scholar] [CrossRef]
  23. Koo, T.K.; Li, M.Y. A guideline of selecting and reporting intraclass correlation coefficients for reliability research. J. Chiropr. Med. 2016, 15, 155–163. [Google Scholar] [CrossRef]
  24. R Core Team. The R Stats Package. Available online: https://stat.ethz.ch/R-manual/R-devel/library/stats/html/stats-package.html (accessed on 25 August 2022).
  25. Ripley, B.; Venables, B.; Bates, D.M.; Hornik, K.; Gebhardt, A.; Firth, D. Package “MASS”. 2022. Available online: https://cran.r-project.org/web/packages/MASS/MASS.pdf (accessed on 25 August 2022).
  26. Friedman, J.; Hastie, T.; Tibshirani, R.; Narasimhan, B.; Tay, K.; Simon, N.; Qian, J.; Yang, J. Package “glmnet”. 2022. Available online: https://cran.r-project.org/web/packages/glmnet/glmnet.pdf (accessed on 25 August 2022).
  27. Tibshirani, R. Regression shrinkage and selection via the lasso. J. R. Stat. Soc. 1996, 58, 267–288. [Google Scholar] [CrossRef]
  28. Zou, H.; Hastie, T. Regularization and variable selection via the elastic net. J. R. Stat. Soc. 2005, 67, 301–320. [Google Scholar] [CrossRef]
  29. Beygelzimer, A.; Kakadet, S.; Langford, J.; Arya, S.; Mount, D.; Li, S. Package “FNN”. 2022. Available online: https://cran.r-project.org/web/packages/FNN/FNN.pdf (accessed on 25 August 2022).
  30. Liaw, A.; Wiener, M. Package “randomForest”. 2022. Available online: https://cran.rproject.org/web/packages/randomForest/randomForest.pdf (accessed on 25 August 2022).
  31. Breiman, L. Random forests. Mach. Learn. 2001, 45, 5–32. [Google Scholar] [CrossRef]
  32. Meyer, D.; Dimitriadou, E.; Hornik, K.; Weingessel, A.; Leisch, F.; Chang, C.C.; Lin, C.C. Package “e1071”. 2022. Available online: https://cran.r-project.org/web/packages/e1071/e1071.pdf (accessed on 25 August 2022).
  33. Hsu, C.; Chang, C.C.; Lin, C.J. A Practical Guide to Support Vector Classification. 2003, pp. 1396–1400. Available online: http://www.datascienceassn.org/sites/default/files/Practical%20Guide%20to%20Support%20Vector%20Classification.pdf (accessed on 25 August 2022).
  34. Fritsch, S.; Guenther, F.; Wright, M.N.; Suling, M.; Mueller, S.M. Package “neuralnet”. 2019. Available online: https://cran.r-project.org/web/packages/neuralnet/neuralnet.pdf (accessed on 25 August 2022).
  35. Riedmiller, M. Advanced supervised learning in multi-layer perceptrons—From backpropagation to adaptive learning algorithms. Comput. Stand. Interfaces 1994, 16, 265–278. [Google Scholar] [CrossRef]
  36. Lakens, D.; Scheel, A.M.; Isager, P.M. Equivalence testing for psychological research: A tutorial. Adv. Methods Pract. Psychol. Sci. 2018, 1, 259–269. [Google Scholar] [CrossRef]
  37. Lakens, D. Equivalence tests: A practical primer for t tests, correlations, and meta-analyses. Soc. Psychol. Personal Sci. 2017, 8, 355–362. [Google Scholar] [CrossRef]
  38. Hawthorne, G.; Elliot, P. Imputing cross-sectional missing data: Comparison of common techniques. Aust. N. Z. J. Psychiatry 2005, 39, 583–590. [Google Scholar] [CrossRef]
  39. Kang, H. The prevention and handling of the missing data. Korean J. Anesthesiol. 2013, 64, 402–406. [Google Scholar] [CrossRef] [PubMed]
  40. Bartlett, J.D.; O’Connor, F.; Pitchford, N.; Torres-Ronda, L.; Robertson, S.J. Relationships between internal and external training load in team-sport athletes: Evidence for an individualized approach. Int. J. Sports Physiol. Perform. 2017, 12, 230–234. [Google Scholar] [CrossRef] [PubMed]
  41. Epp-Stobbe, A.; Tsai, M.; Morris, C.; Klimstra, M. The influence of physical contact on athlete load in international female rugby sevens. J. Strength Cond. Res. 2022. [Google Scholar] [CrossRef]
  42. Mujika, I. The alphabet of sport science research starts with Q. Int. J. Sports Physiol. Perform. 2013, 8, 465–466. [Google Scholar] [CrossRef] [PubMed]
  43. Faulkner, J.; Parfitt, G.; Eston, R. The rating of perceived exertion during competitive running scales with time. Psychophysiology 2008, 45, 977–985. [Google Scholar] [CrossRef]
  44. Bonacci, J.; Vleck, V.; Saunders, P.U.; Blanch, P.; Vicenzino, B. Rating of perceived exertion during cycling is associated with subsequent running economy in triathletes. J. Sci. Med. Sport 2013, 16, 49–53. [Google Scholar] [CrossRef]
  45. Hong, S.; Lynn, H.S. Accuracy of random-forest-based imputation of missing data in the presence of non-normality, non-linearity, and interaction. BMC Med. Res. Methodol. 2020, 20, 199. [Google Scholar] [CrossRef]
  46. Kokla, M.; Virtanen, J.; Kolehmainen, M.; Paananen, J.; Hanhineva, K. Random forest-based imputation outperforms other methods for imputing LC-MS metabolomics data: A comparative study. BMC Bioinform. 2019, 20, 492. [Google Scholar] [CrossRef]
  47. Shah, A.D.; Bartlett, J.W.; Carpenter, J.; Nicholas, O.; Hemingway, H. Comparison of random forest and parametric imputation models for imputing missing data using MICE: A CALIBER study. Am. J. Epidemiol. 2014, 179, 764–774. [Google Scholar] [CrossRef]
  48. Burkart, N.; Huber, M.F. A survey on the explainability of supervised machine learning. J. Artif. Intell. Res. 2021, 70, 245–317. [Google Scholar] [CrossRef]
  49. Rahman, M.G.; Islam, M.Z. Missing value imputation using a fuzzy clustering-based EM approach. Knowl. Inf. Syst. 2016, 46, 389–422. [Google Scholar] [CrossRef]
  50. Shataee, S.; Kalbi, S.; Fallah, A.; Pelz, D. Forest attribute imputation using machine-learning methods and ASTER data: Comparison of k-NN, SVR and random forest regression algorithms. Int. J. Remote Sens. 2012, 33, 6254–6280. [Google Scholar] [CrossRef]
  51. Shen, X.; Mu, L.; Li, Z.; Wu, H.; Gou, J.; Chen, X. Large-scale support vector machine classification with redundant data reduction. Neurocomputing 2016, 172, 189–197. [Google Scholar] [CrossRef]
  52. Waldmann, P.; Mészáros, G.; Gredler, B.; Fürst, C.; Sölkner, J. Evaluation of the lasso and the elastic net in genome-wide association studies. Front. Genet. 2013, 4, 270. [Google Scholar] [CrossRef]
  53. Verpoort, P.C.; MacDonald, P.; Conduit, G.J. Materials data validation and imputation with an artificial neural network. Comput. Mater. Sci. 2018, 147, 176–185. [Google Scholar] [CrossRef]
  54. Yin, M.; Vaughan, J.W.; Wallach, H. Understanding the effect of accuracy on trust in machine learning models. In Proceedings of the 2019 CHI Conference on Human Factors in Computing Systems, Glasgow, UK, 4–9 May 2019. [Google Scholar] [CrossRef]
  55. Hossin, M.; Sulaiman, M.N. A review on evaluation metrics for data classification evaluations. Int. J. Data Min. Knowl. Manag. Process. 2015, 5, 1–11. [Google Scholar] [CrossRef]
  56. Joseph, T.; Johnson, B.; Battista, R.A.; Wright, G.; Dodge, C.; Porcari, J.P.; de Koning, J.J.; Foster, C. Perception of fatigue during simulated competition. Med. Sci. Sports Exerc. 2008, 40, 381–386. [Google Scholar] [CrossRef]
  57. Bridge, C.A.; Jones, M.A.; Drust, B. Physiological responses and perceived exertion during international taekwondo competition. Int. J. Sports Physiol. Perform. 2009, 4, 485–493. [Google Scholar] [CrossRef]
  58. Clarke, N.; Farthing, J.P.; Norris, S.R.; Arnold, B.E.; Lanovaz, J.L. Quantification of training load in Canadian football: Application of session-RPE in collision-based team sports. J. Strength Cond. Res. 2013, 27, 2198–2205. [Google Scholar] [CrossRef]
  59. Bartlett, J.D.; Drust, B. A framework for effective knowledge translation and performance delivery of Sport Scientists in professional sport. Eur. J. Sport Sci. 2021, 21, 1579–1587. [Google Scholar] [CrossRef]
  60. Brocherie, F.; Beard, A. All alone we go faster, together we go further: The necessary evolution of professional and elite sporting environment to bridge the gap between research and practice. Front. Sports Act. Living 2021, 2, 631147. [Google Scholar] [CrossRef]
  61. Coutts, A.J. Working fast and working slow: The benefits of embedding research in high performance sport. Int. J. Sports Physiol. Perform. 2016, 11, 1–2. [Google Scholar] [CrossRef] [Green Version]
Figure 1. Frequency of athlete self-reported RPE values.
Make 04 00041 g001
Figure 2. Model accuracy by type at 20% missingness, *** indicates significant difference.
Make 04 00041 g002
Figure 3. Model accuracy by data missingness from 10–50% missingness.
Make 04 00041 g003
Table 1. Details on explanatory variable data used in models.
VariableTypeMethod of Data Collection
RPEIntegerAthlete self-report,
measured in arbitrary units
Match NumberIntegerInteger reflecting match order in tournament
(i.e., first game played = 1, second game = 2, etc.)
PlayerIntegerInteger used in place of name to anonymize athlete
OpponentIntegerInteger used in place of name to anonymize opponent
Total DistanceFloatATD, measured in meters,
Playing TimeFloatATD, measured in minutes
Contact CountIntegerMatch footage, coded and evaluated by team analyst
Table 2. Imputation Model Accuracy, R2, and RMSE at 20% missingness.
ModelAccuracyR2RMSE
Daily Team Mean Substitution0.2160.0091.832
Linear Regression0.2480.3061.602
Stepwise Regression0.2470.3051.603
Lasso Regression0.2270.2641.651
Ridge Regression0.2330.2741.650
Elastic Net Regression0.2270.2651.651
k-Nearest Neighbours0.2390.2681.653
Random Forest0.2650.4071.480
Support Vector Machine0.2550.3711.541
Neural Network0.2260.1571.862
Publisher’s Note: MDPI stays neutral with regard to jurisdictional claims in published maps and institutional affiliations.

