Abstract
Optimisation of the anti-skid properties of tyres is a significant area of composite applications. For investigating the wet slip friction characteristics, the wet slip friction test of tread rubber and road surface was carried out using the comprehensive tire friction testing machine. The wet slip properties of different formulated rubbers under various working conditions such as different slip speeds, water film thicknesses and vertical loads were compared through the test. Subsequently, an orthogonal test programme was designed to investigate the degree of significant influence of each factor on the wet slip performance. A three-dimensional finite element model of tread rubber and road surface with water film was established in order to facilitate analysis of the wet slip properties. The simulation results were utilised to elucidate the pattern of the effects of different loads on the wet slip friction characteristics. Results indicate that the wet slip friction coefficient is subject to decrease in proportion to the magnitude of the vertical load; the friction coefficient of rubber block in wet slip condition exhibits a decline of approximately 26% in comparison with that of dry condition; the factor that exerts the most significant influence on the coefficient of friction is the vertical load, while the water film thickness exerts the least influence. The results obtained can serve as a reference source for the design of tire anti-skid performance enhancement.
1. Introduction
When a vehicle is braked on a wet road surface, the tyre tread produces lubricating friction with the road surface, thereby substantially reducing the friction between the two and consequently significantly increasing the risk of traffic accidents [1]. Consequently, there is a significant need to investigate the wet slip performance of tire tread rubber to improve the safety and stability of vehicle operation.
The experimental method is the most direct research tool to study the wet friction behaviour of tread rubber and road surface. Do et al. [2] developed a pavement microtexture/water depth/friction correlation model through indoor wet slip friction tests and derived the variation of tire-pavement friction with the depth of a thin water film and the effect of pavement microtexture. Sabey et al. [3] obtained a law on the effect of localized pressure on the coefficient of friction of the tread under wet conditions by means of friction tests in which spheres and cones were pressed into the tread rubber. Deleau et al. [4] conducted sliding friction tests of rubber on wet glass and analysed the effect of velocity and normal load on friction under different wetting conditions, especially the transition between wet and dry states. Licher et al. [5] proposed a pioneering experimental approach to the study of the abrasion mechanism of automobile tyres. The method of detection is based on the identification of microscopic movements associated with material damage (cracking) on the rubber tread. Zhao et al. [6] measured the friction coefficient of asphalt surface under different thicknesses of water film coverage and analysed and summarized the law of the influence of water film thickness on the friction coefficient. Greenwood et al. [7] summarized the general conclusion that sliding friction is mainly derived from deformation losses in the rubber by means of friction tests of hard sliders of spherical and other shapes on lubricated rubber. Despite the considerable number of tests conducted by the aforementioned scholars on rubber and slippery pavement, the test variables are relatively limited, presumably due to the constraints imposed by the equipment. In reality, the wet sliding performance of the tread is influenced by a multitude of factors, including the vertical load, slip speed, rubber material formulation and water film thickness, among others. There is a paucity of analysis concerning the extent to which each variable exerts an influence on the wet sliding performance of the tread. In order to address these research gaps, this paper employs a multi-variable approach to test and design orthogonal tests for the analysis of the significance of the influence of each variable.
Nonetheless, the test is characterised by its stringent requirements with regard to the test conditions. Furthermore, the expense of test equipment, the length of the cycle time, the poor stability and the other shortcomings have a detrimental effect on the results of the test. For this reason, researchers in the theoretical mechanics and other aspects of the wet slip performance of tires have carried out a lot of research. Persson et al. [8] have proposed the theory that the main friction generated by the viscoelastic deformation of rubber is reduced due to the sealing effect of the rubber on the water film substrate by means of applications related to the friction between tires and road surfaces. Persson et al. [9] proposed a theory of rubber friction and contact mechanics and discussed in detail the relationship between rubber sliding friction and the nature of the substrate surface roughness and sliding velocity. Ji et al. [10] considered the condition of reduced tire adhesion coefficient due to partial water sliding from the perspective of the principle of conservation of energy and obtained the relationship equations between the tire adhesion coefficient and the water film thickness and driving speed. Based on the hydrodynamic lubrication theory, Zhu et al. [11] established a mathematical model describing the water-sliding process of tire tread unit, introduced the film thickness ratio as the performance evaluation criterion of tires and came to the conclusion that the wet traction performance is proportional to the roughness of the road surface. In order to study the steady-state lateral deflection characteristics of tyres on ice, Zhao et al. [12] developed an enhanced tyre–pavement friction model that integrates the effects of pavement texture and water film. Guo et al. [13] established a semi-empirical model describing the lateral deflection characteristics of tires using a brush model, and the effects of ice temperature, load, and vehicle speed on the lateral force and the return moment of tyres were investigated.
In recent years, with the rapid development of computational speed and simulation software, the finite element model has been widely used in research on tyre wet slip. The finite element method is a numerical analysis tool based on the theory of continuous medium mechanics [14]. The method can provide high-precision information of stress, strain and displacement distribution, so it is particularly suitable for solving the fluid–solid coupling problem of tyre–water film interaction. Finite elements have the potential to produce more accurate results than other methods [15]. This method reduces testing costs and provides accurate and detailed results with proper calibration [16]. Jiang et al. [17] developed an integrated analytical model comprising a brush model for tyre path contact and a flexible ring model for tyre deformation, taking into account hydrodynamic forces. The interaction between these two models can be utilised to solve for both feasible contact imprints and deformed tyre profiles. The apparatus is utilised for the purpose of analysis of the friction characteristics of aircraft tyres on wet runway surfaces. Ma et al. [18] established a sliding friction factor improvement model and obtained the influence law of different road conditions and different tread rubber on the sliding friction factor change with speed through simulation analysis. In order to investigate the effects of factors such as tyre rolling and tyre tread on the water-slip process, Seta et al. [19] used finite element simulation and finite difference method to perform water-slip analysis of tyres, and applied the simulation results to the design of actual tyre tread patterns. Ong et al. [20] used basic mechanical principles and a finite element anti-skid simulation model to consider the variation of tyre skid resistance with vehicle speed, as well as the effects of wheel load, tyre inflation pressure, and water film thickness. Zhou et al. [21] used CFD method to establish a water-skiing model considering the tyre grounding impression and tread deformation characteristics and obtained the effects of water film thickness, water flow rate, longitudinal and transverse tread structure and other factors on the water-skiing performance of tyres. Yang et al. [22] used the IFS interpolation method to generate a three-dimensional asphalt pavement topography and established a tyre-pavement contact model, and analysed the skid resistance of three-dimensional rough pavement under the action of vehicle, road and environment using the adhesion coefficient as the evaluation index. However, the mechanical properties and friction coefficient of different rubber formulations vary, necessitating the use of professional equipment for the purpose of acquiring accurate data. The credibility of research relying solely on public data and simulation results of comparative research credibility is low, as it cannot be used directly to optimise tyre wet sliding performance to provide reference. For this reason, the present paper proposes a new test method for different formulations of rubber were made into specimens for wet slip performance test, this data as the basis for the establishment of a finite element model and fluid-solid coupling simulation, the test results and simulation outcomes are corroborated by supporting calculations. Recent advancements have been made in the field, with breakthroughs achieved through the limitations of the experimental site. This study aimed to efficiently and conveniently access the friction coefficient of the tread rubber on slippery road surfaces and to further analyse the change rule of wet slip performance of different formulations of rubber, road surface, and working conditions.
2. Materials and Methods
2.1. Tread Rubber Sample
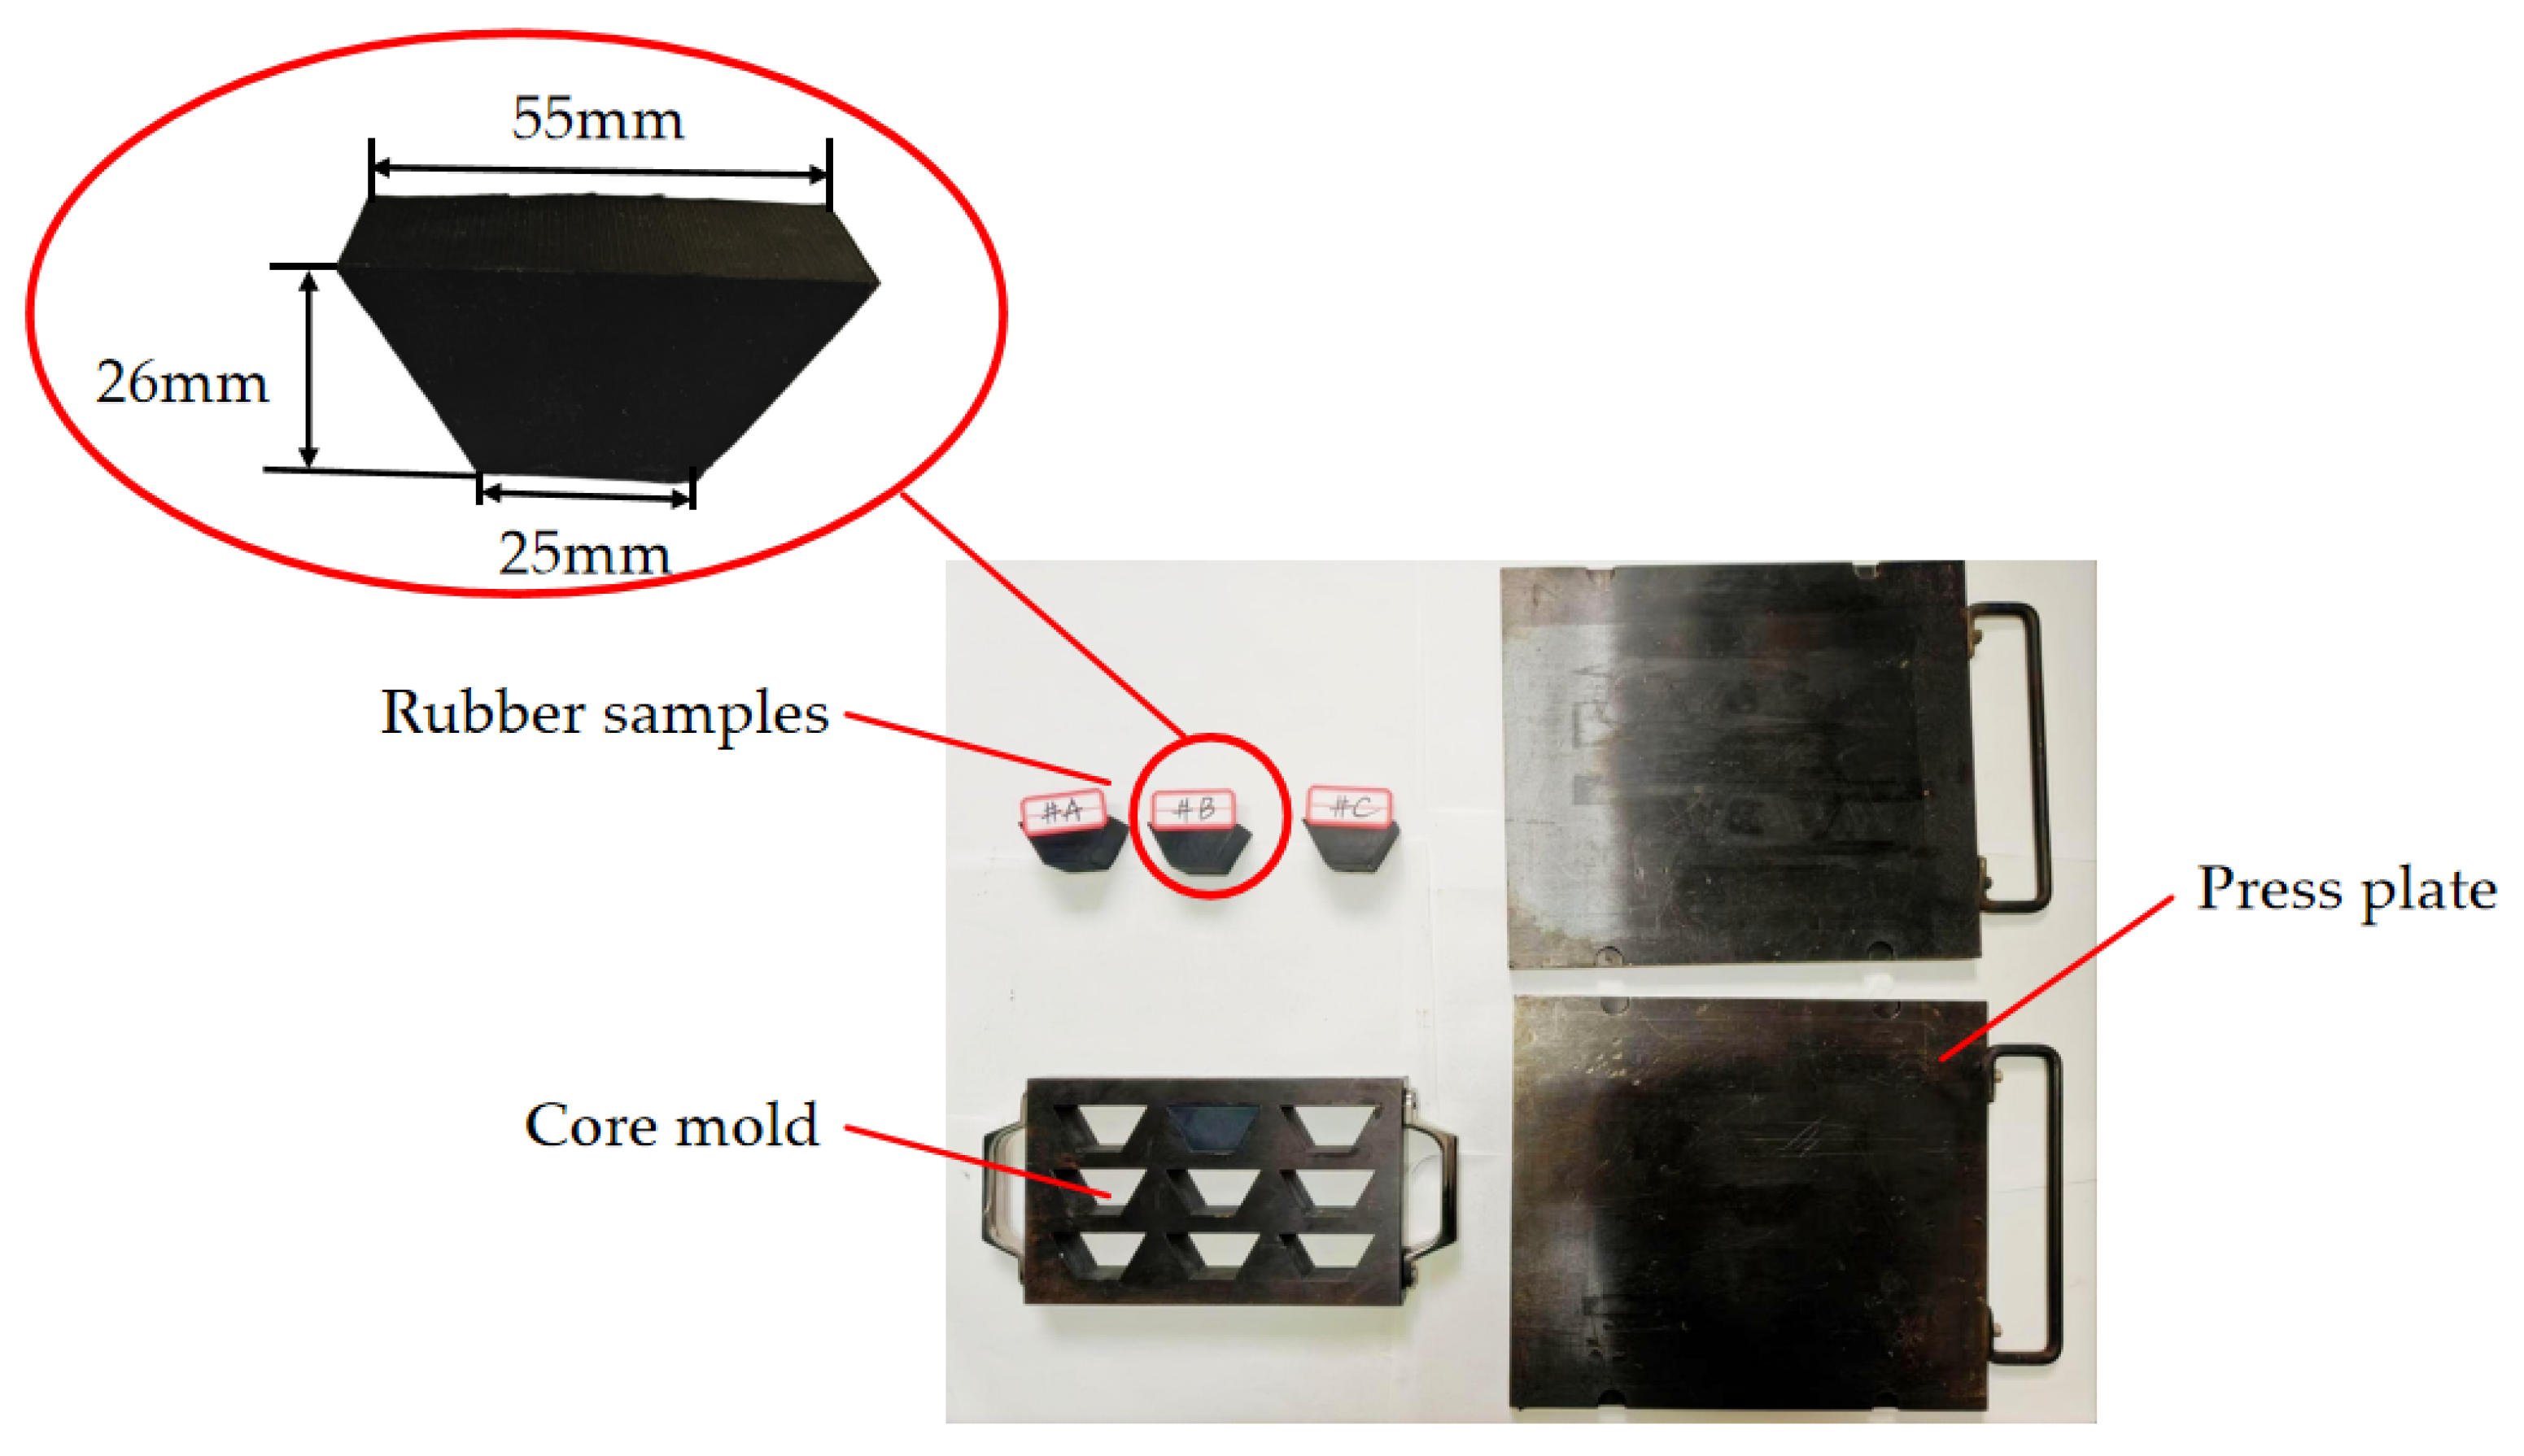
In order to study the friction characteristics of tread rubber and slippery road surface and to avoid chance results, three different formulations of tread rubber materials—A, B and C—were selected for the test (compound rubber supplied by the Guizhou Tyre Co., Ltd., Guiyang, China), and their respective sulphur curves were determined on a rubber processing analyser. According to the results, the appropriate vulcanization temperature of 150 °C and vulcanization time of 30 min were selected, and vulcanization was carried out under the vulcanization pressure of 15 MPa of the plate vulcanizing machine, and the test specimens were obtained. The test specimens of three formulations—A, B and C—were obtained; their hardness and tensile mechanical properties are shown in Table 1. Figure 1 shows the vulcanizing mould, including the core mould, upper and lower pressure plates and the three formulations of tread rubber specimens.
Table 1.
Tread rubber sample material parameters.
Figure 1.
Tread rubber samples and vulcanization mold.
2.2. Test Equipment
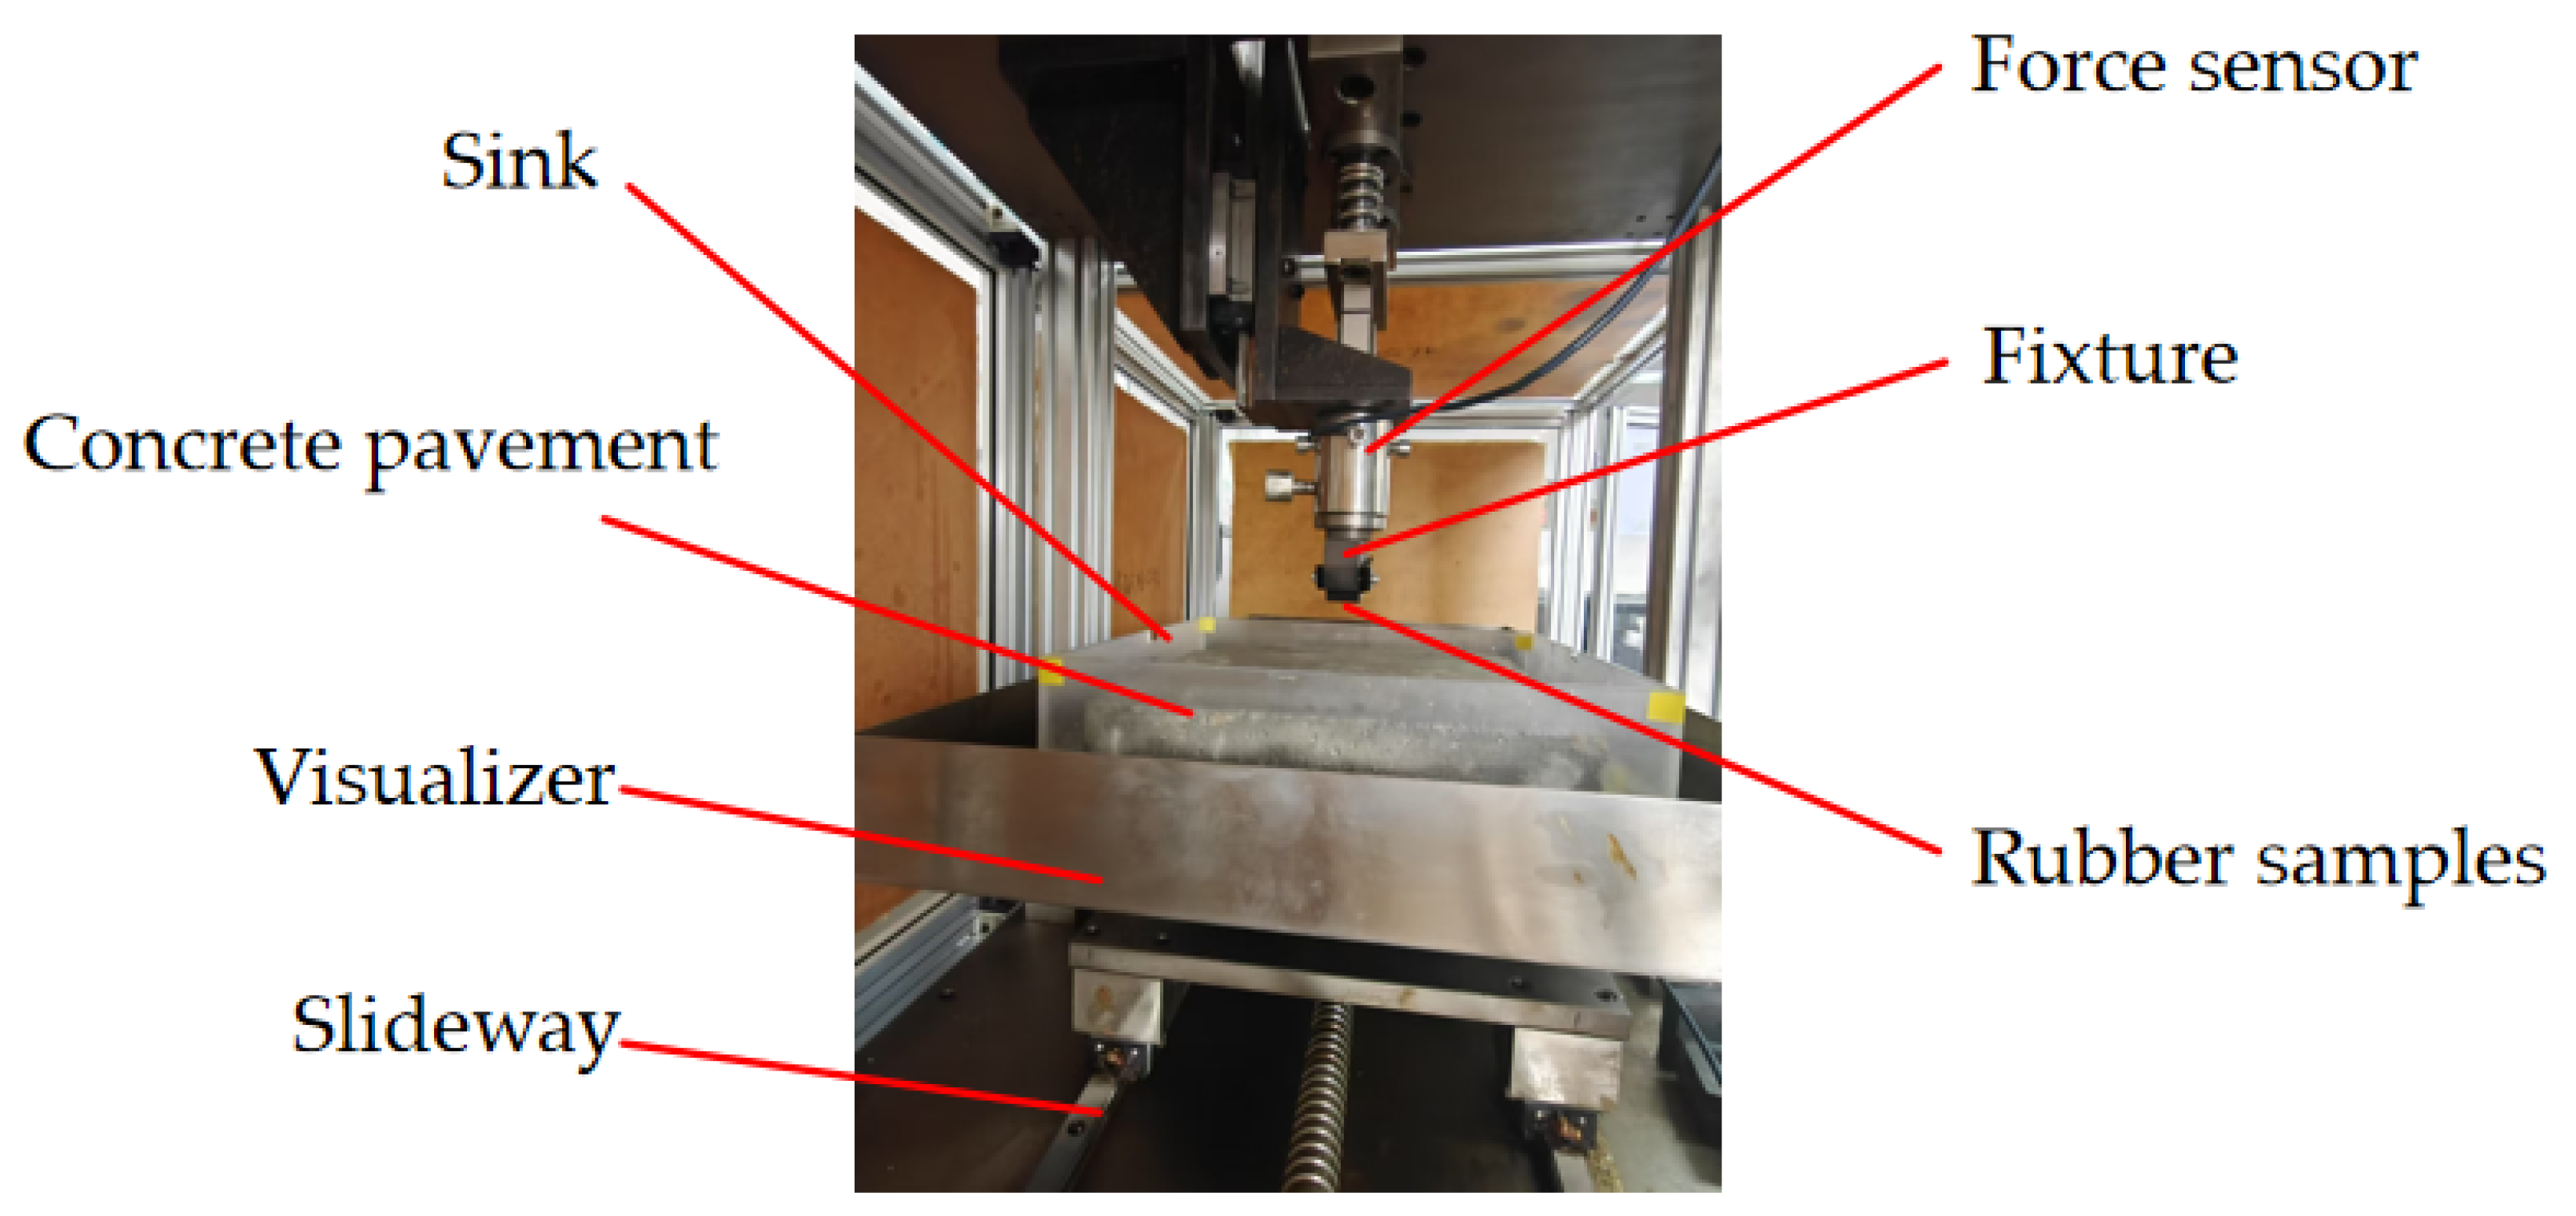
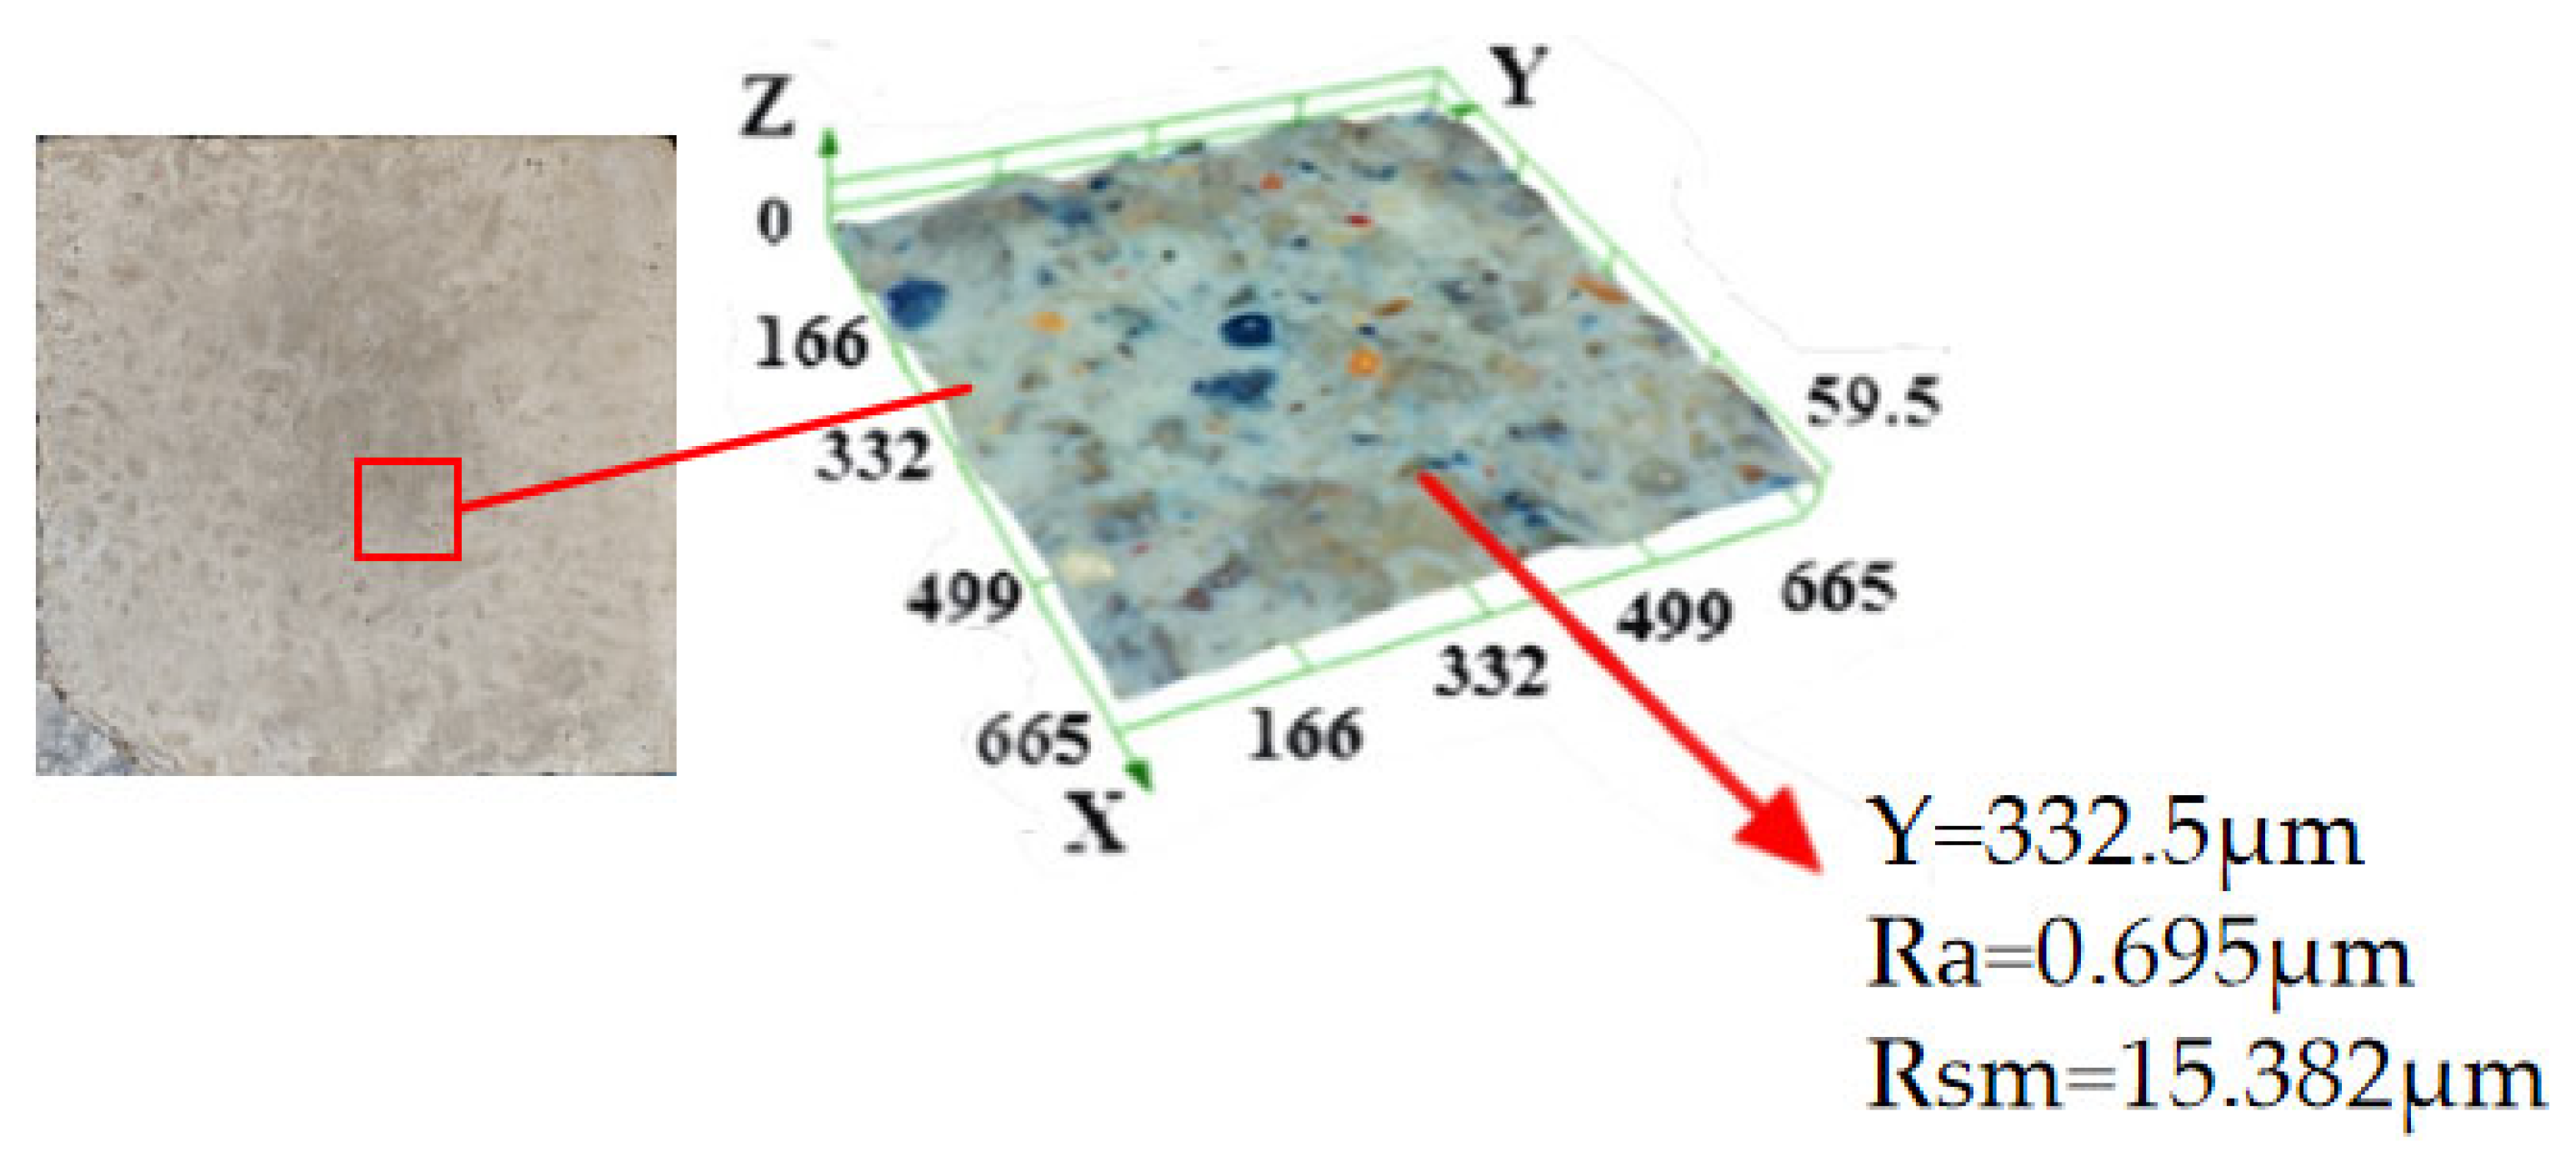
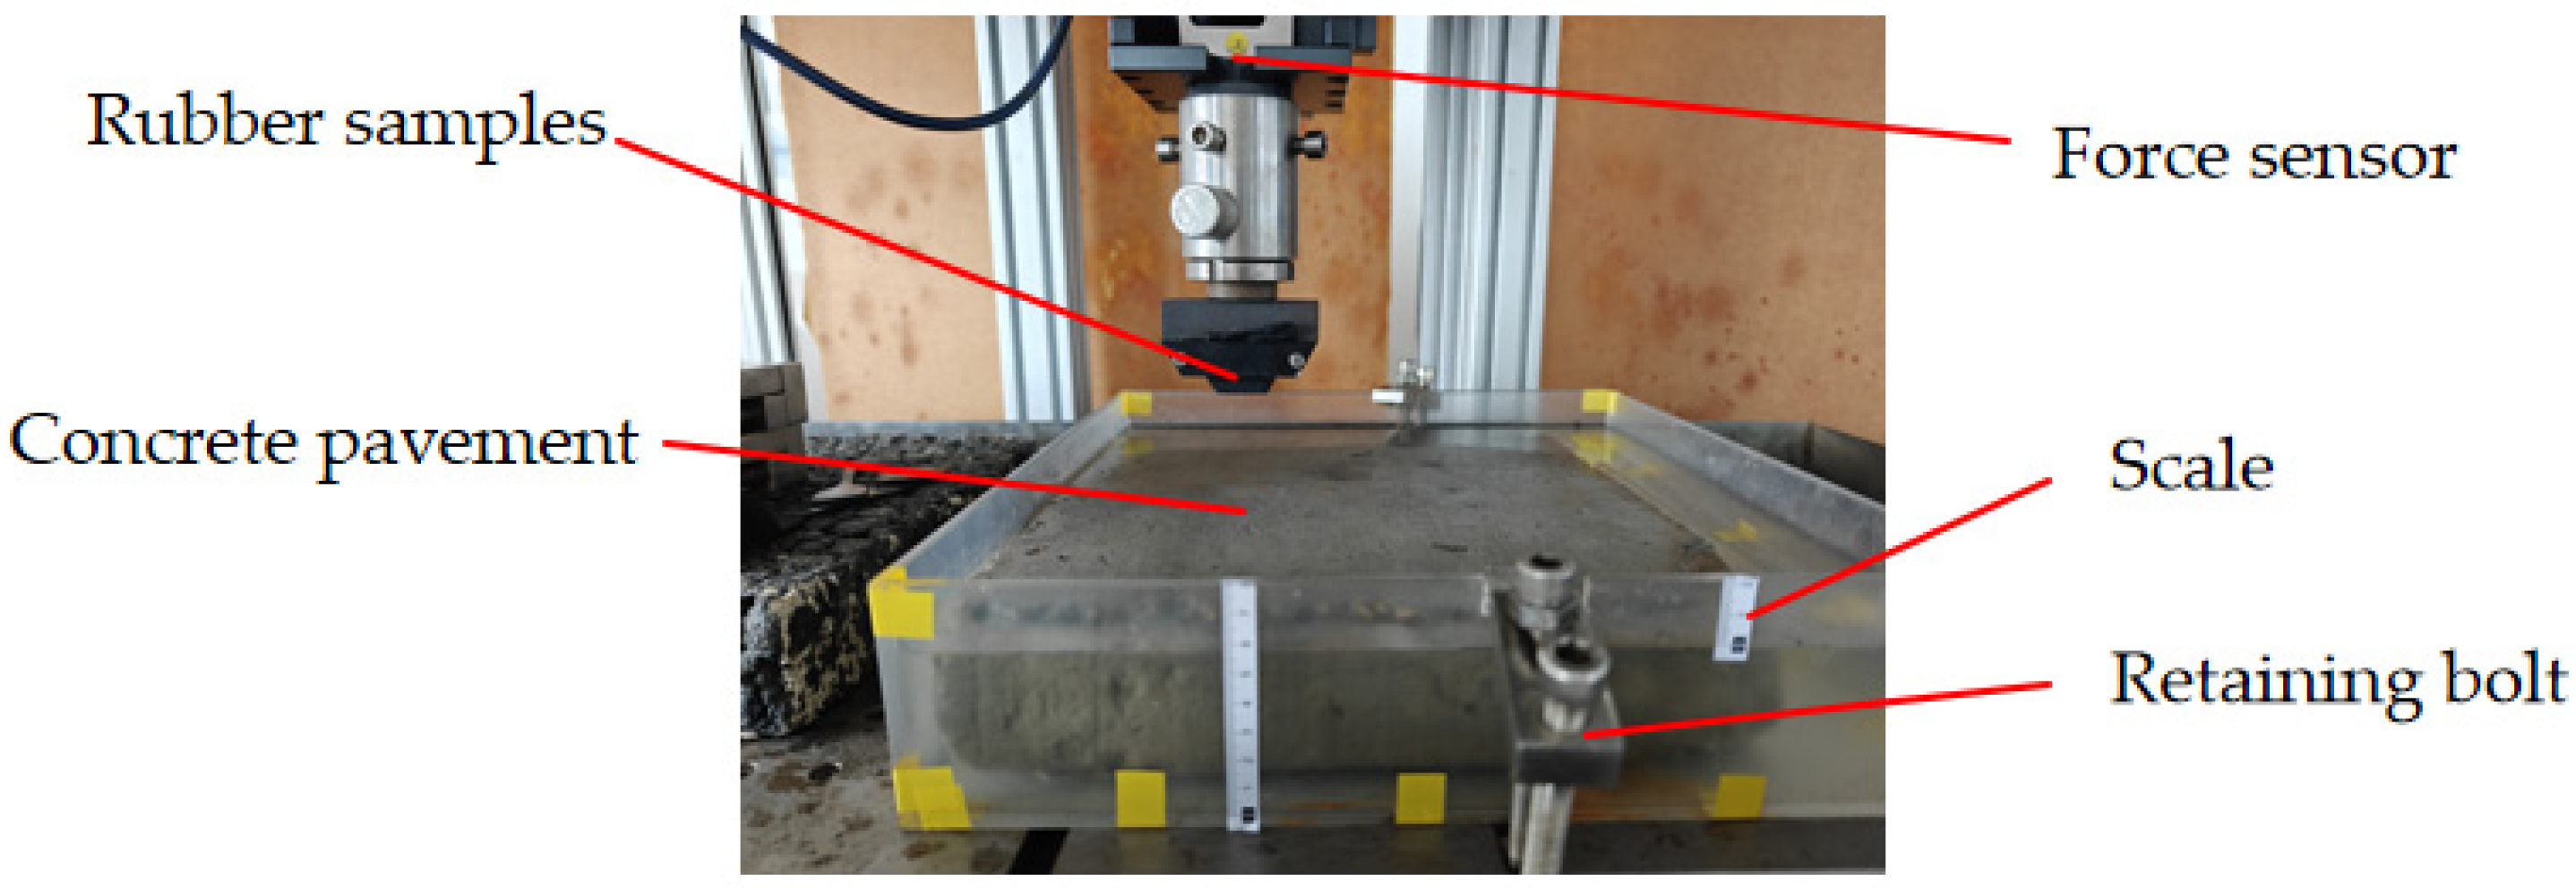
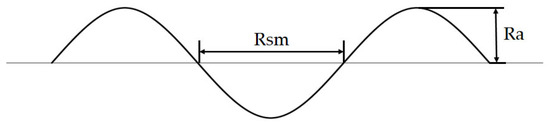
The dry and wet friction tests of tread rubber specimens are carried out on a comprehensive tyre friction testing machine; the said machine is shown in Figure 2. The device mainly consists of a specimen clamping part, a horizontal moving table and a force transducer. The fixture is used to fix the specimen in contact with the road surface and perform the wet slip resistance test under variable vertical load. The overall size of the device is 2000 mm × 500 mm × 1650 mm, and the size of the concrete pavement used for the test is 300 × mm 300 mm × 40 mm. The maximum contact pressure is about 1.2 MPa. The surface morphology of the concrete pavements utilised in the experimental setup was captured through the utilisation of OLYMPUS-DSX510 Optical Digital Microscope (Olympus, Tokyo, Japan). The arithmetic mean deviation of the profile at a specific cross-sectional height, designated as Ra, and the mean width of the profile elements, denoted as Rsm, were measured to characterise the roughness of the concrete pavements, as shown in Figure 3. The obtained data were employed to streamline the modelling and simulation of the sinusoidal pavements. The friction test data can be collected in real time by the force transducer, including the friction force and friction coefficient of the rubber block in the friction process and other important parameters.
Figure 2.
The device for wet skid resistance test.
Figure 3.
Concrete pavement surface topography and roughness.
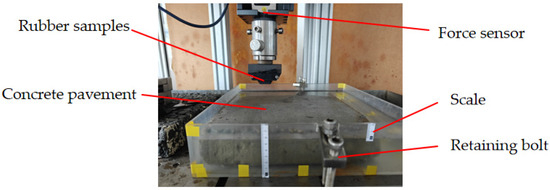
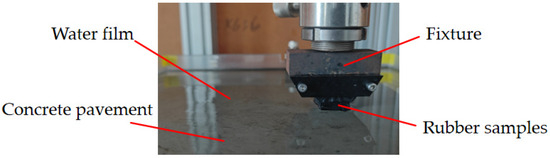
The test steps were as follows: Firstly, we fixed the tread rubber specimen on the supporting fixture, and we clamped and fixed a water tank with 0–10 mm scale on the horizontal moving table and put the concrete pavement into the water tank to limit and fix it. Fixing bolts were utilised to secure the sink to the horizontal moving table. Concurrently, a scale was affixed to the lateral aspect of the transparent sink to facilitate observation of the thickness of the water film, as shown in Figure 4. Then, according to the test requirements, we applied the weight load controlled by the hydraulic system as the normal force of the tread rubber specimen contacting with the pavement. And then, we added the different thickness of water film into the water tank according to the scale, and we controlled the horizontal moving table to drive the pavement sliding horizontally to form relative friction movement with the tread rubber specimen to carry out the wet slip friction test. Finally, different thicknesses of water film were added into the water tank according to the scale, and the horizontal moving table was controlled to drive the road surface to slide horizontally, forming relative friction movement with the tread rubber specimen to carry out the wet sliding friction test. The horizontal moving table was controlled by AC servo motor, which can drive the wet sliding cement pavement to reciprocate along the linear guideway with the speed range of 10–500 mm/min. The normal force of vertical load is obtained by the normal force sensor, and the horizontal friction force of tread rubber specimen is measured by the tangential force sensor.
Figure 4.
Horizontal moving table and fixture.
2.3. Test Methods
The wet slip performance of the tread rubber and the road surface is primarily dependent on the vertical load, slip speed, water film thickness, fillers in the formulation [23], etc. In order to investigate the effect of a single variable on the wet slip performance, vulcanized tread rubber specimens were clamped to the testing machine, and the wet slip friction coefficients were determined by changing only the vertical load, slip speed and water film thickness, respectively. The test procedure is shown in Figure 5; the test conditions are shown in Table 2.
Figure 5.
Schematic diagram of the wet friction experiment process.
Table 2.
Wet friction test conditions.
In order to investigate the significant level of the effect of each factor on the wet slip performance, the orthogonal test method was used to further design the wet slip friction test program. Three parameters were selected for investigation: vertical load, slip speed and water film thickness. The wet slip friction coefficient was selected as the dependent variable. The three-factor, three-level L9(34) orthogonal test table was selected according to the number of factors, and the levels of vertical load x1, slip speed x2 and water film thickness x3, as shown in Table 3. The wet slip friction coefficients of each group of tests were determined according to the above orthogonal test programme.
Table 3.
Orthogonal test factors and levels.
2.4. Simulation Modeling
2.4.1. Geometric Model
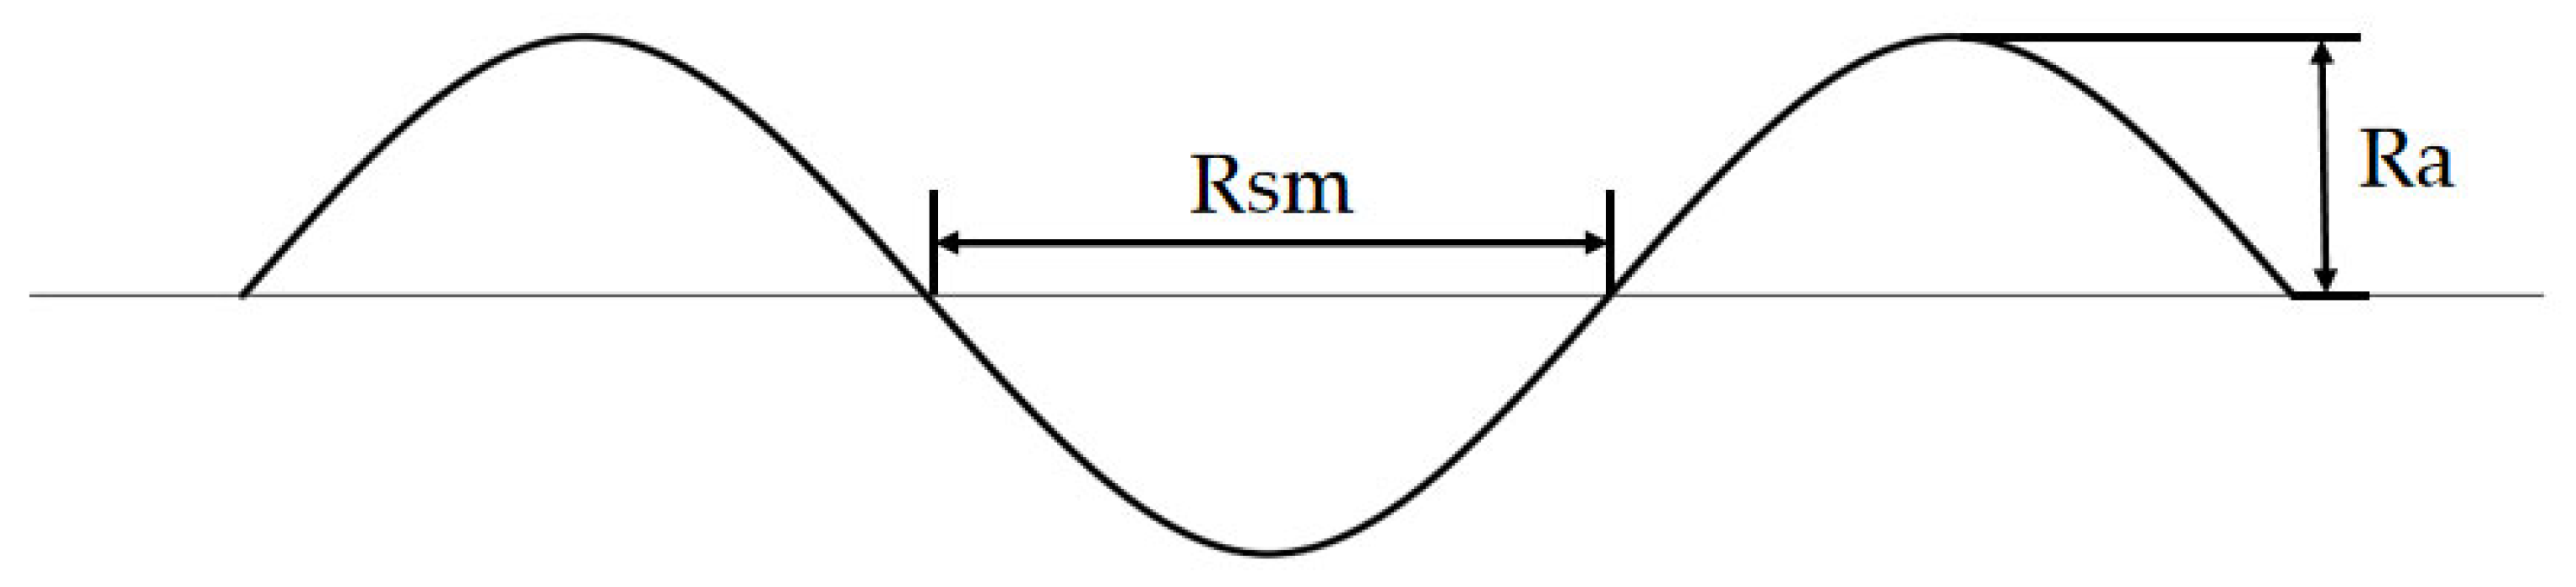
The contact between the tread and the road surface is characterised by a non-perfect fit, with contact only occurring at the bumps on the friction contact part of the two. The actual contact area constitutes a minor proportion of the theoretical contact area. Usually in the equivalent modelling process, the unevenness or bumps on the contact surface can be simplified as sinusoidal, cylindrical or hemispherical, and so on. In order to more accurately calculate the actual contact pressure between the tread rubber block and the road surface, this paper equates both the specimen surface and the uneven cross-section of the road surface to a sinusoidal curve, as shown in Figure 6. Where Ra is the amplitude of the sinusoidal curve, and Rsm is the half period of the curve, through the optical digital microscope photographed the concrete pavement morphology and the tread rubber block surface, the measurement statistics to obtain the respective contour arithmetic average deviation Ra and the average width of the contour Rsm. It can thus be concluded that the following equations are applicable in order to describe the curvature of the rough pavement:
Figure 6.
Sinusoidal equivalent model of pavement.
2.4.2. Mesh Model
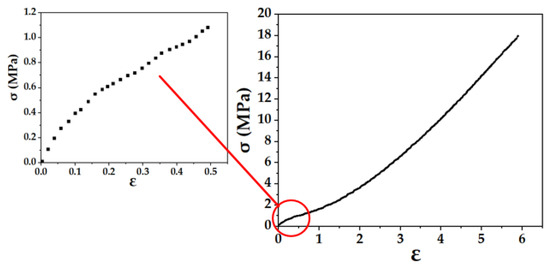
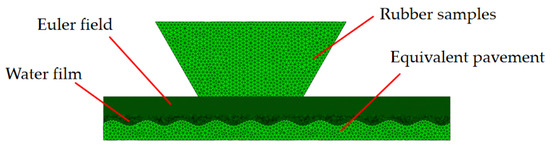
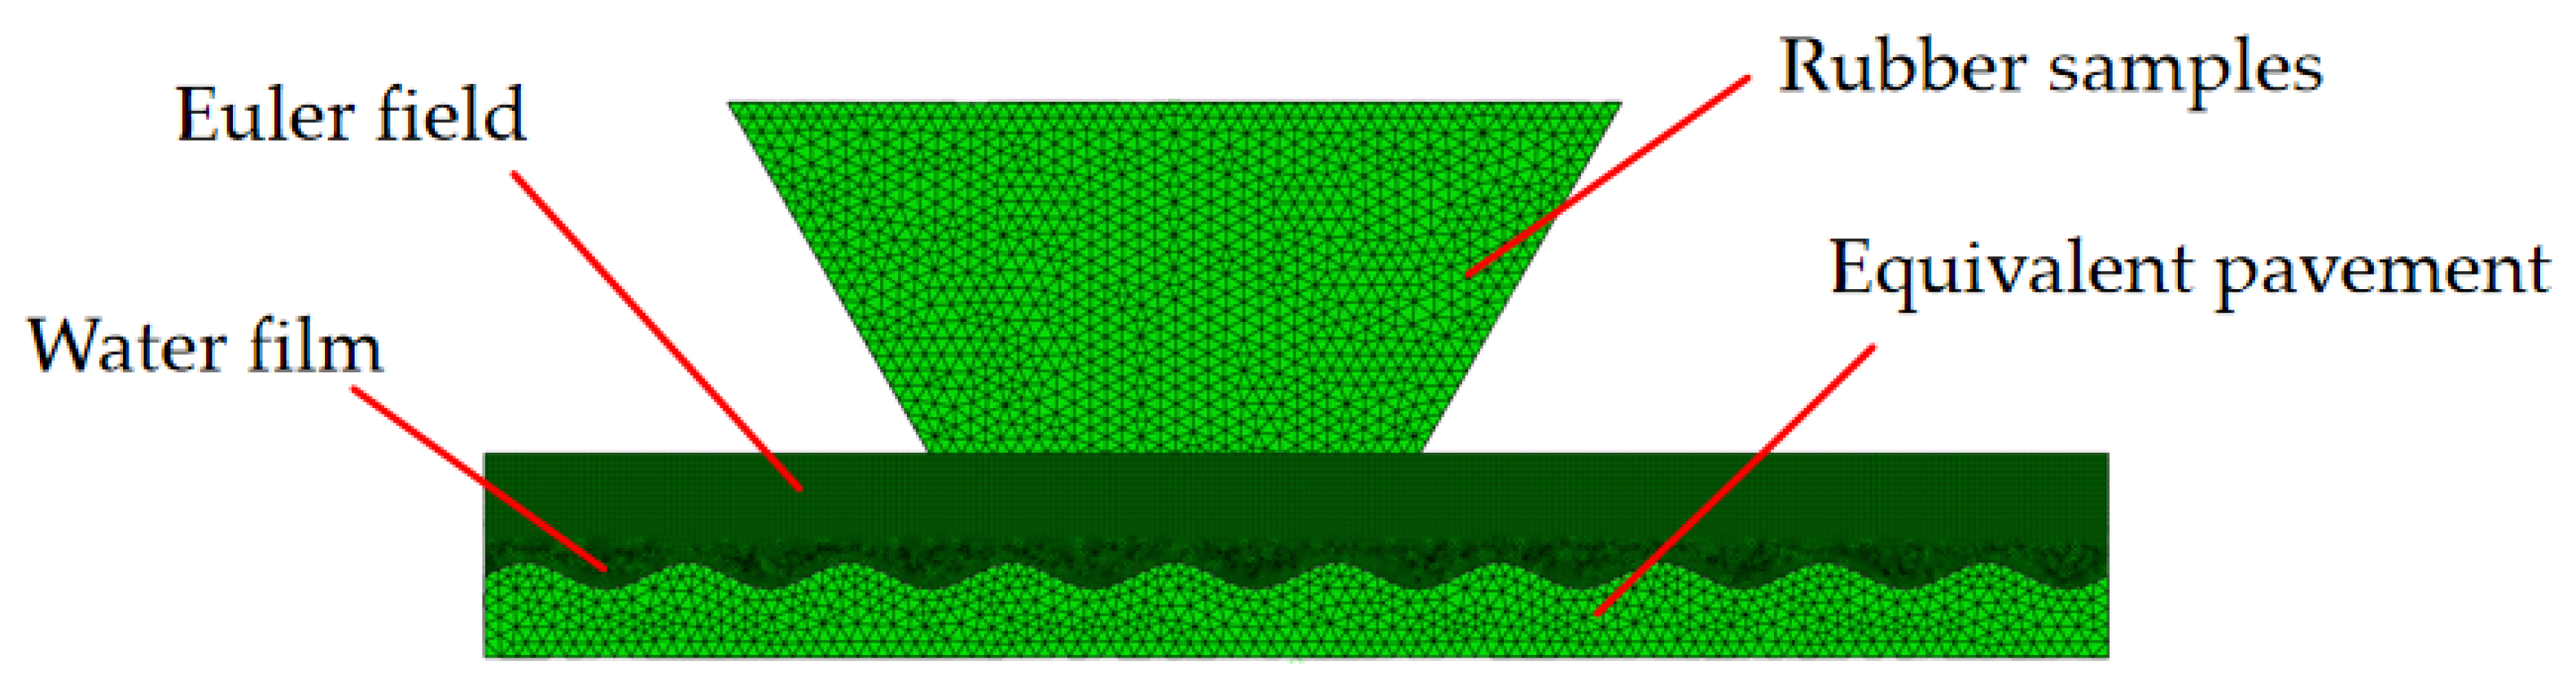
The three-dimensional finite element model of the friction between the tread rubber and the road surface is established in ABAQUS 2022. Uniaxial tensile tests were conducted on the tread rubber material to obtain its stress-strain relationship, as illustrated in Figure 7. It is evident that, owing to the absence of substantial deformation in the specimen during the wet friction experiment, the strain range is confined within the 0–30% interval. It is evident that the stress–strain relationship of the rubber material in this interval can be approximated as linear elastic. In order to simplify the modelling process, the hyperelastic model is not used for the tread rubber specimen modelling; rather, the linear elastic model is used instead. This approach ensures the credibility of the results, while concurrently achieving a substantial enhancement in the simulation calculation speed. The Young’s modulus of the simulated rubber samples was set at 5.46, and Poisson’s ratio at 0.48, according to the test data of the tread rubber. And the deformation of the road surface is negligible, which is defined as a discrete rigid body. We defined the range of Eulerian space for fluid motion and determine the thickness of the water film according to the test conditions, respectively, and limited the degrees of freedom of the water layer boundary conditions to prevent water layer loss. The rubber sample, the equivalent pavement and the Eulerian space are assembled, and then the mesh is divided, as shown in Figure 8.
Figure 7.
Stress-strain relationship of tread rubber material.
Figure 8.
Finite element mesh model.
The load and boundary conditions are set according to the test conditions. The friction coefficient of the contact between the bottom surface of the sample and the equivalent sinusoidal surface takes into account the effect of the water film, and it is set to the data measured by the friction experimental platform under the same test conditions.
3. Results and Discussion
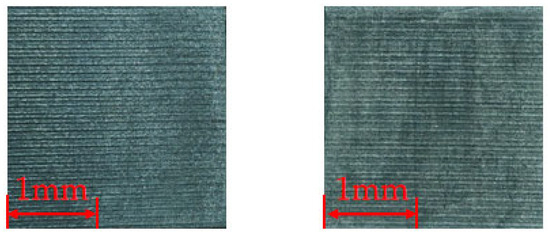
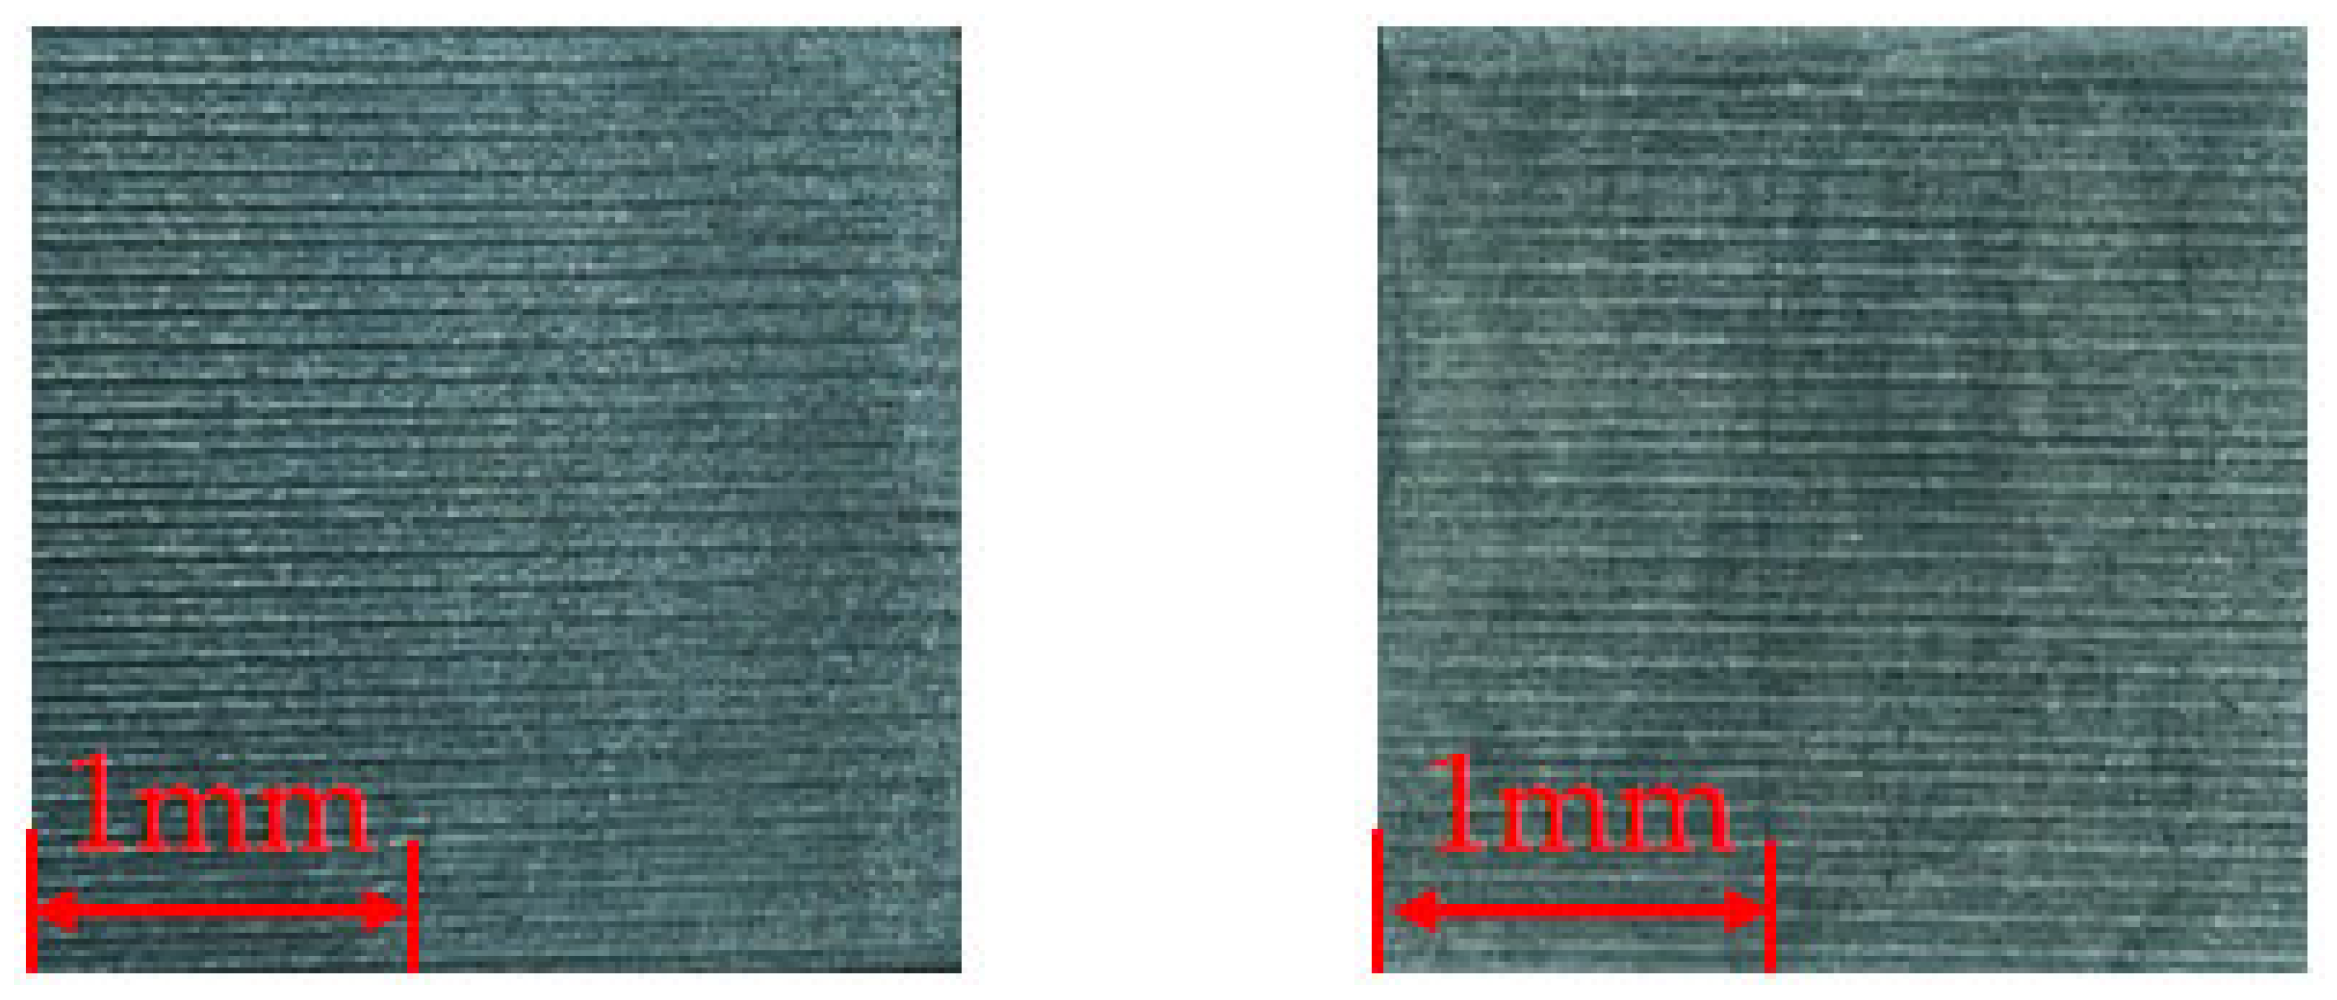
Image processing is commonly used to observe and analyse the surface morphology and structural changes of samples. Licher et al. [5] used a camera to observe the process of frictional wear on tyre surfaces and investigate tyre tread wear mechanisms. This paper presents macro-photographs of the sample surface taken before and after the test. By comparing the surface morphology of the tread rubber samples before and after the test, the macroscopic results of wet slip friction can be clearly visualised (see Figure 9). After wet friction on the surface of the sample, there are obvious scratches, and they are concentrated in the middle part of the surface, and the scratches are not uniform. This finding suggests that the actual contact between the sample surface and the pavement occurred only at the elevated regions of the friction surface. This also provides a partially realistic basis for simplifying the pavement to a sinusoidal model.
Figure 9.
Surface of the sample before and after the test.
3.1. Effect of Vertical Load
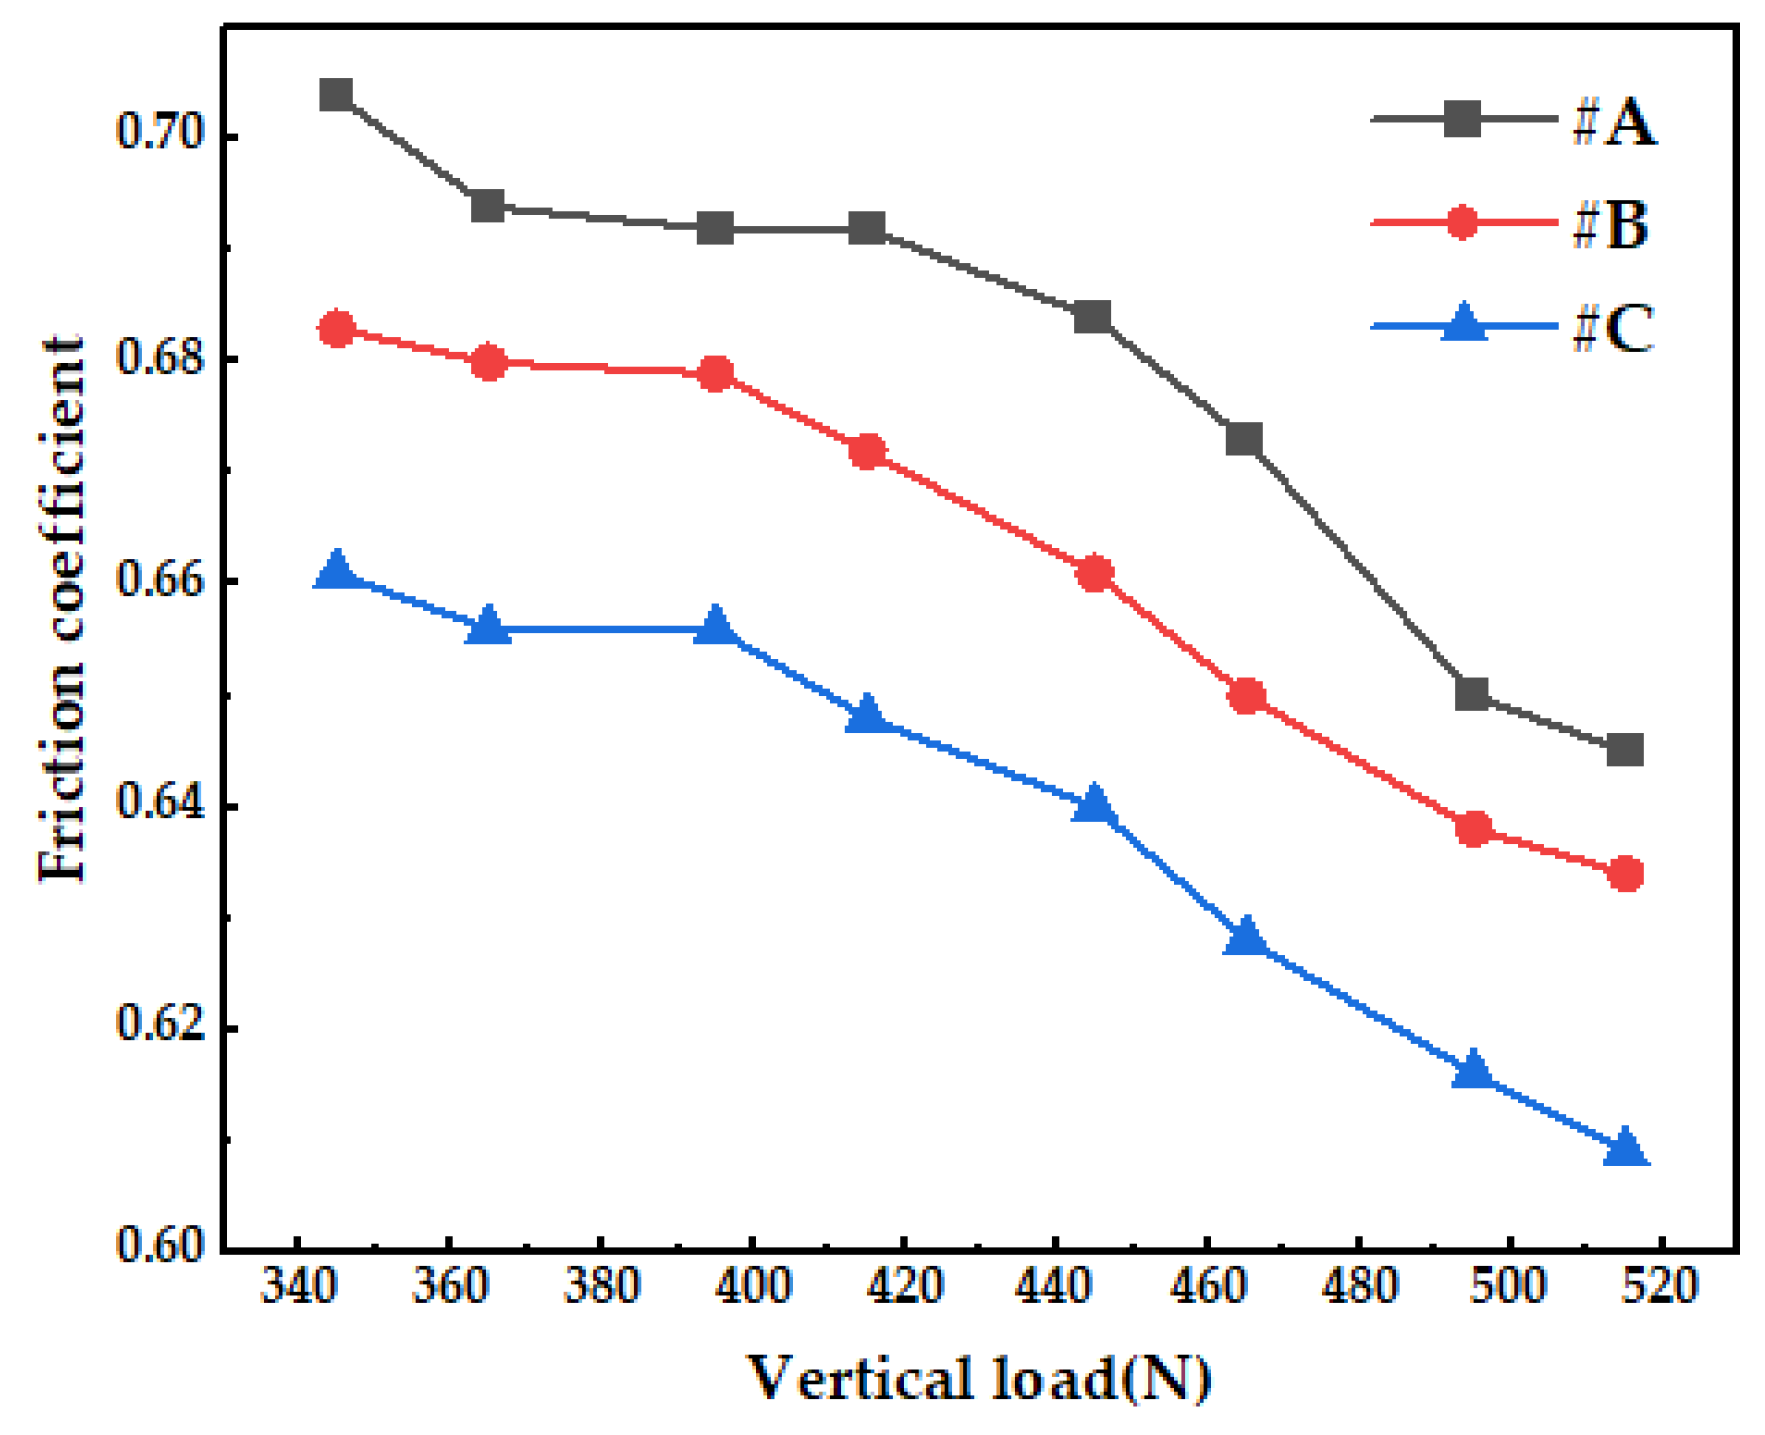
Figure 10 gives the results of the wet slip friction test of the three formulations—A, B and C trapezoidal rubber blocks—when different loads are applied under the test conditions of water film thickness of 5 mm and slip speed of 100 mm/min. Calculated from the size of the rubber block specimen and the range of variation of the applied vertical load, the surface pressure of the tread rubber in contact with the road surface ranges from 0.5 MPa to 0.8 MPa, which is close to the actual contact pressure of the tyre. It can be observed in Figure 6 that the friction coefficient under wet conditions decreases continuously with the increase of vertical load. Zhou et al. [1] used Fluent software to simulate and analyse the effect of different contact pressures on the friction coefficient of tyres in wet conditions, reaching the same conclusions as the above experiments. And the specimens of the three formulations show a 7–9% decrease in the friction coefficient under the condition of nearly 50% increase of vertical load.
Figure 10.
Effect of vertical loading on the coefficient of wet slip friction.
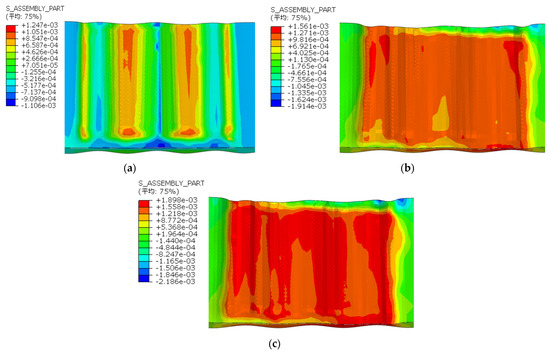
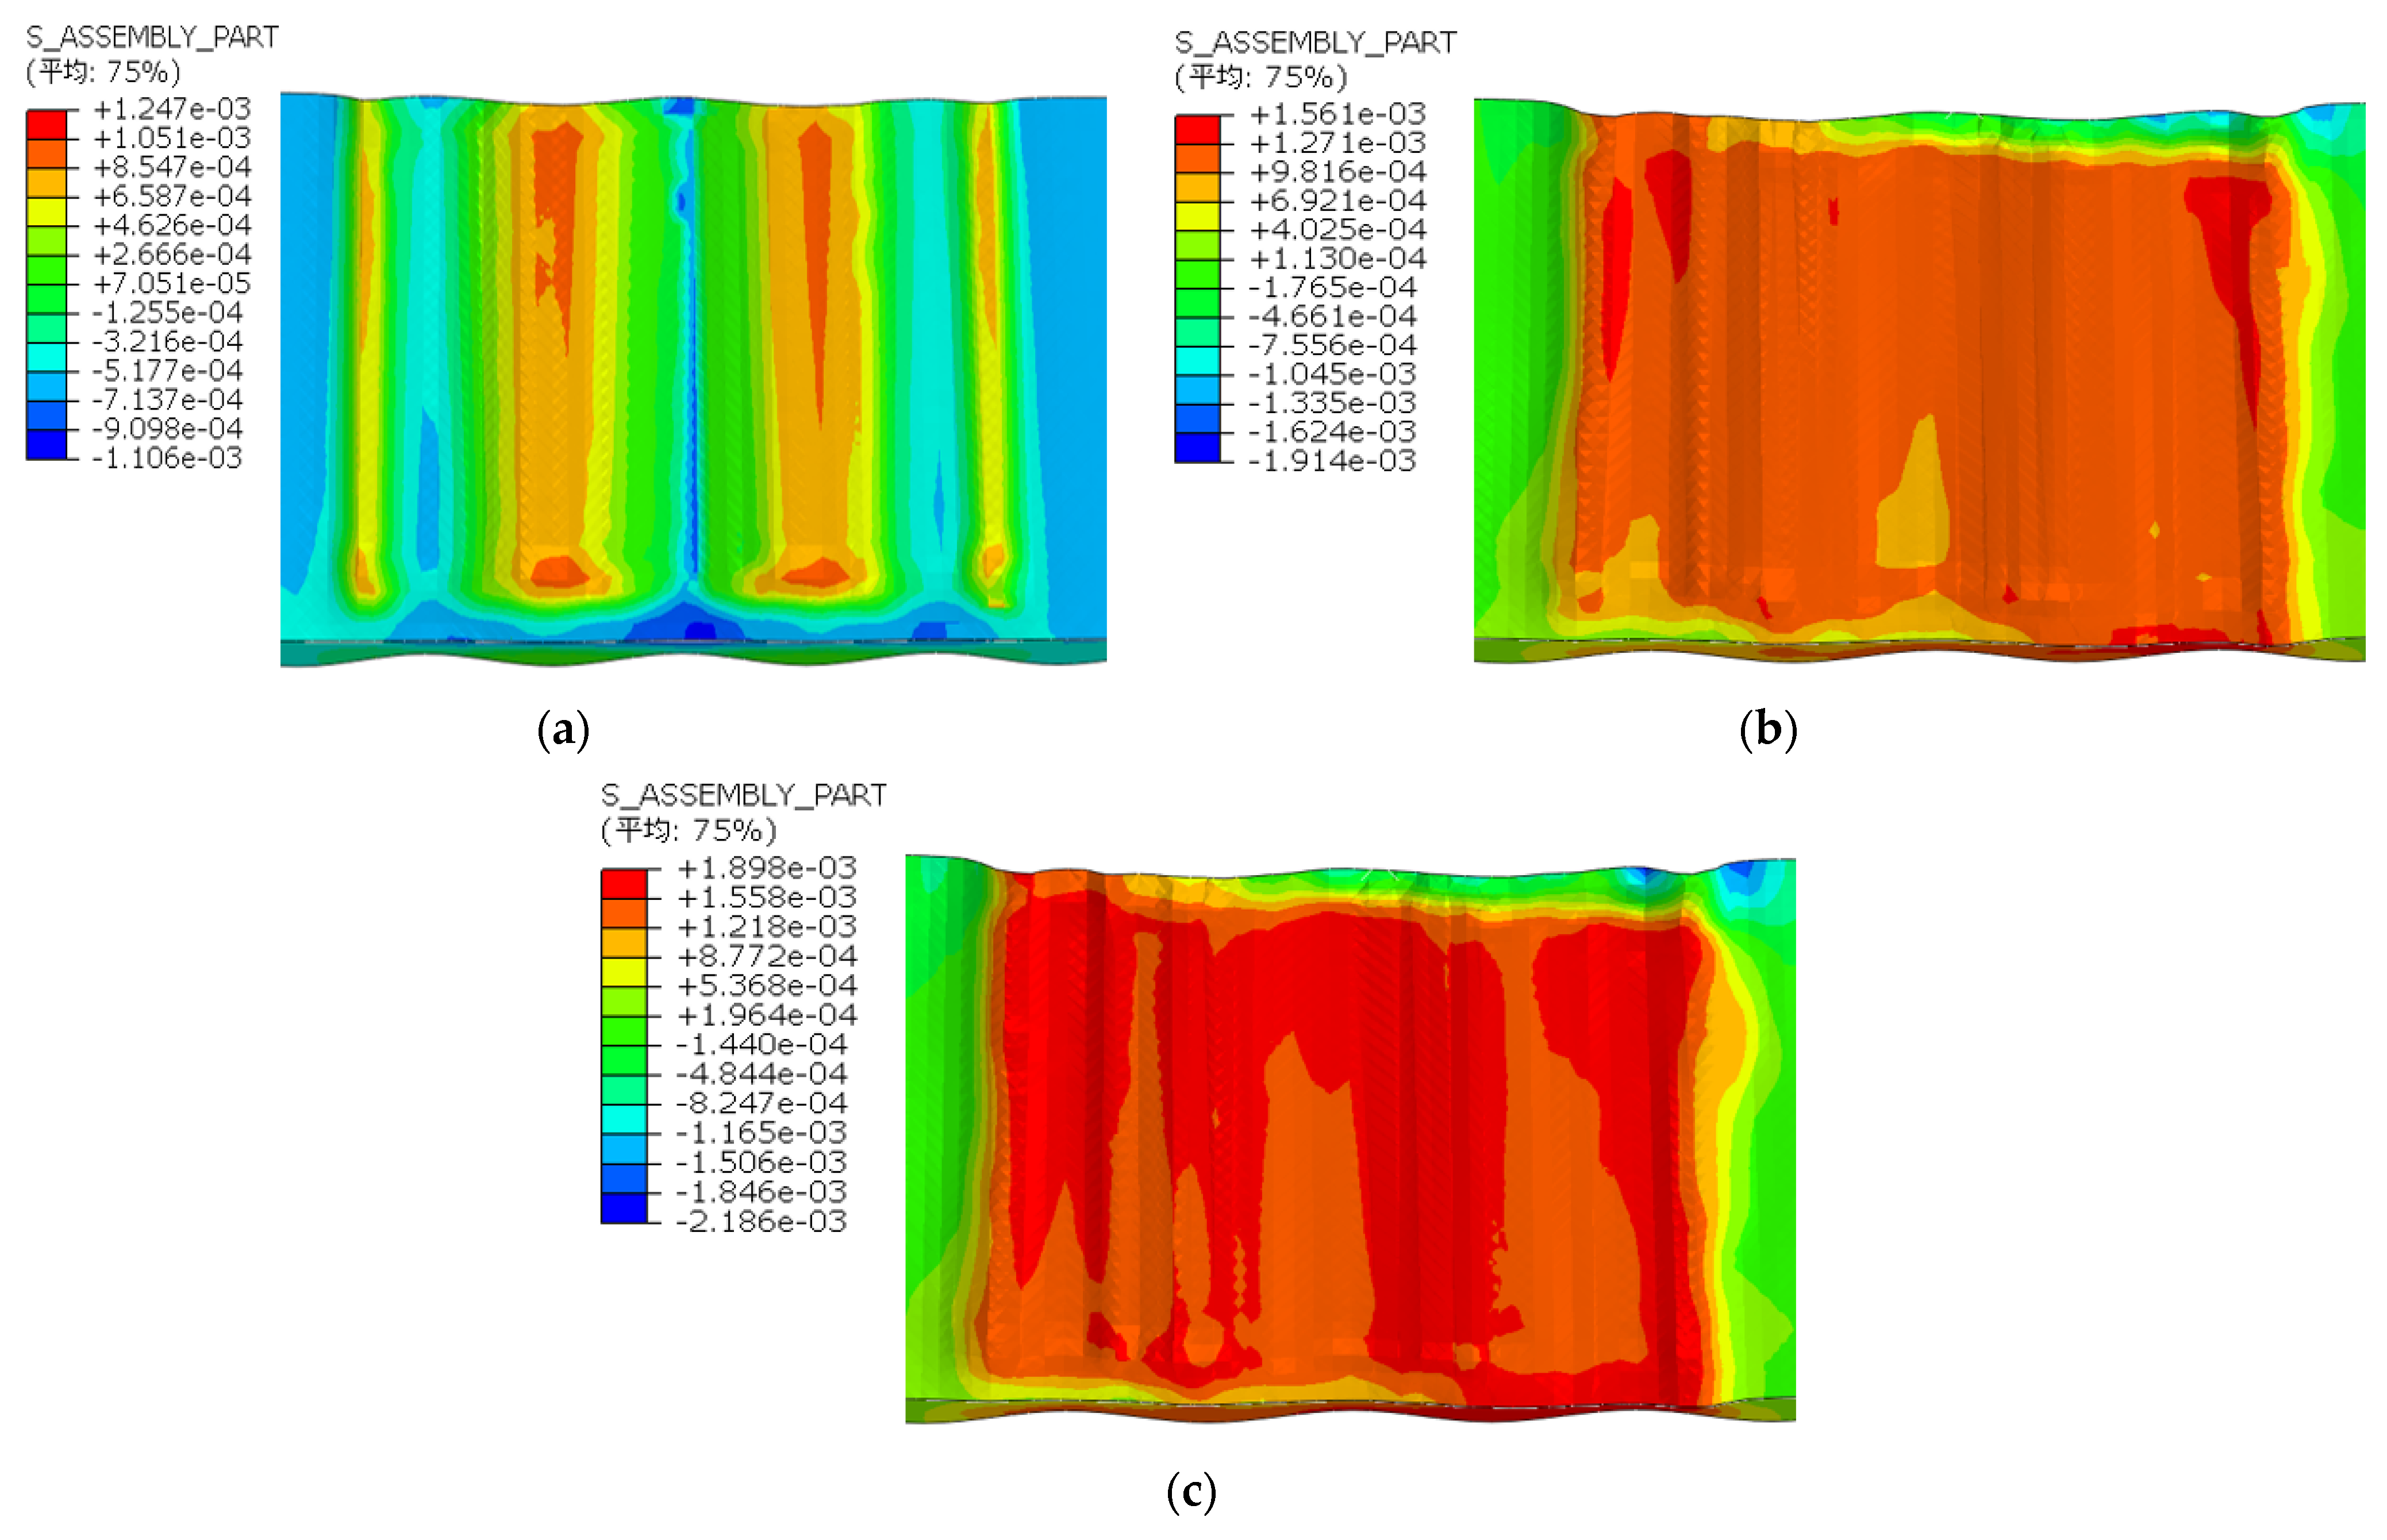
As illustrated in Figure 11, the results of 3D finite element fluid–solid coupling simulation, indicating the stress distribution formed inside the water film when the tread rubber sample is squeezed under different vertical loads. The results demonstrate that with an increase in vertical load, the stress of the water film gradually increases, indicating that the support reaction force of the water film on the tread rubber sample increases concomitantly. This results in a reduction of the support force of the road surface on the bottom surface of the sample, and eventually the wet slip friction coefficient appears to be reduced to a certain extent.
Figure 11.
Stress distribution of water film under different vertical loads. (a) Vertical load of 100 N; (b) vertical load of 300 N; (c) vertical load of 500 N.
3.2. Effect of Slip Speed
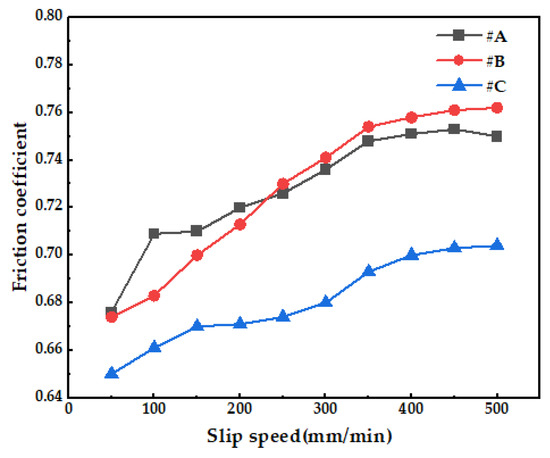
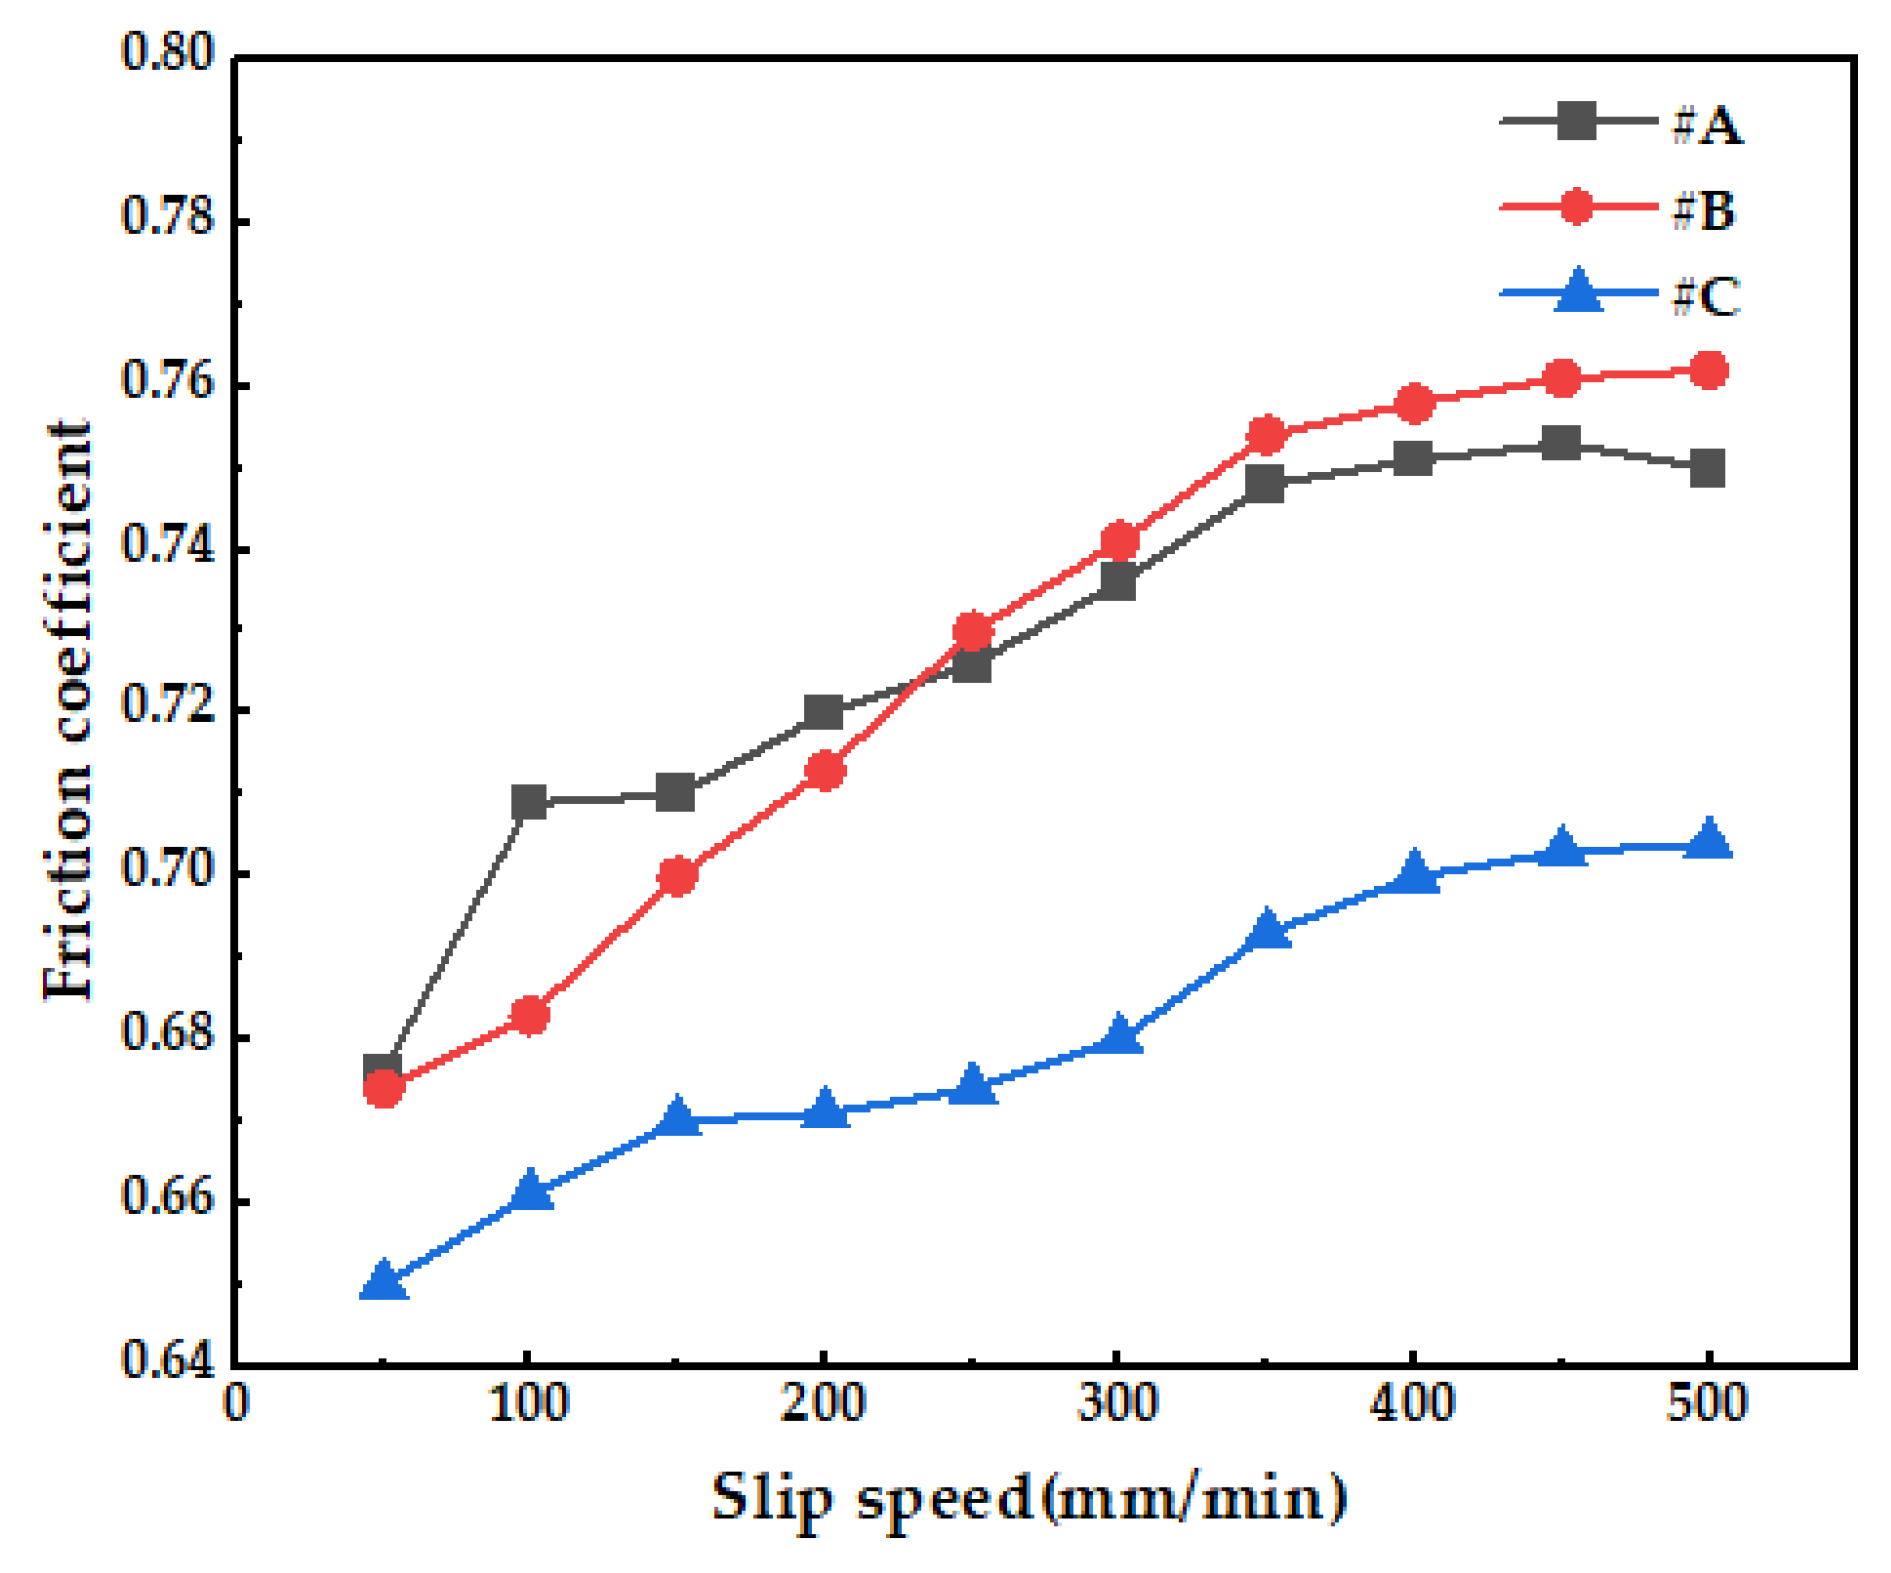
Figure 12 shows the results of the wet slip friction test of three formulations—A, B and C trapezoidal rubber blocks—under the test conditions of vertical load of 345 N and water film thickness of 5 mm, varying only the slip speed of the horizontal table. Figure 12 shows the effect of slip speed on the wet slip friction coefficient. The results show that the coefficient of friction increases with the increase of slip speed. When the slip speed increases, the degree of wetting of the water film on the contact surface decreases and the friction coefficient appears to increase.
Figure 12.
Effect of slip velocity on the coefficient of wet slip friction.
3.3. Effect of Water Film Thickness
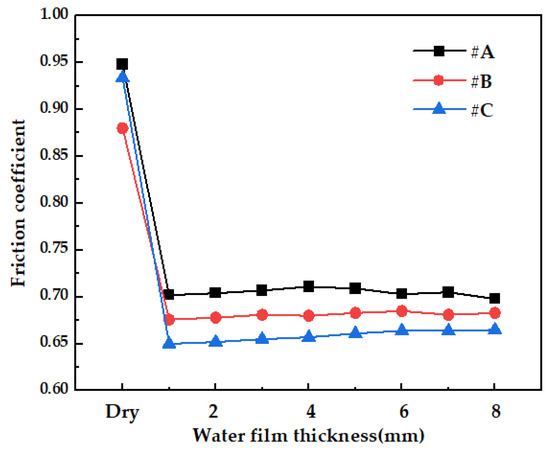
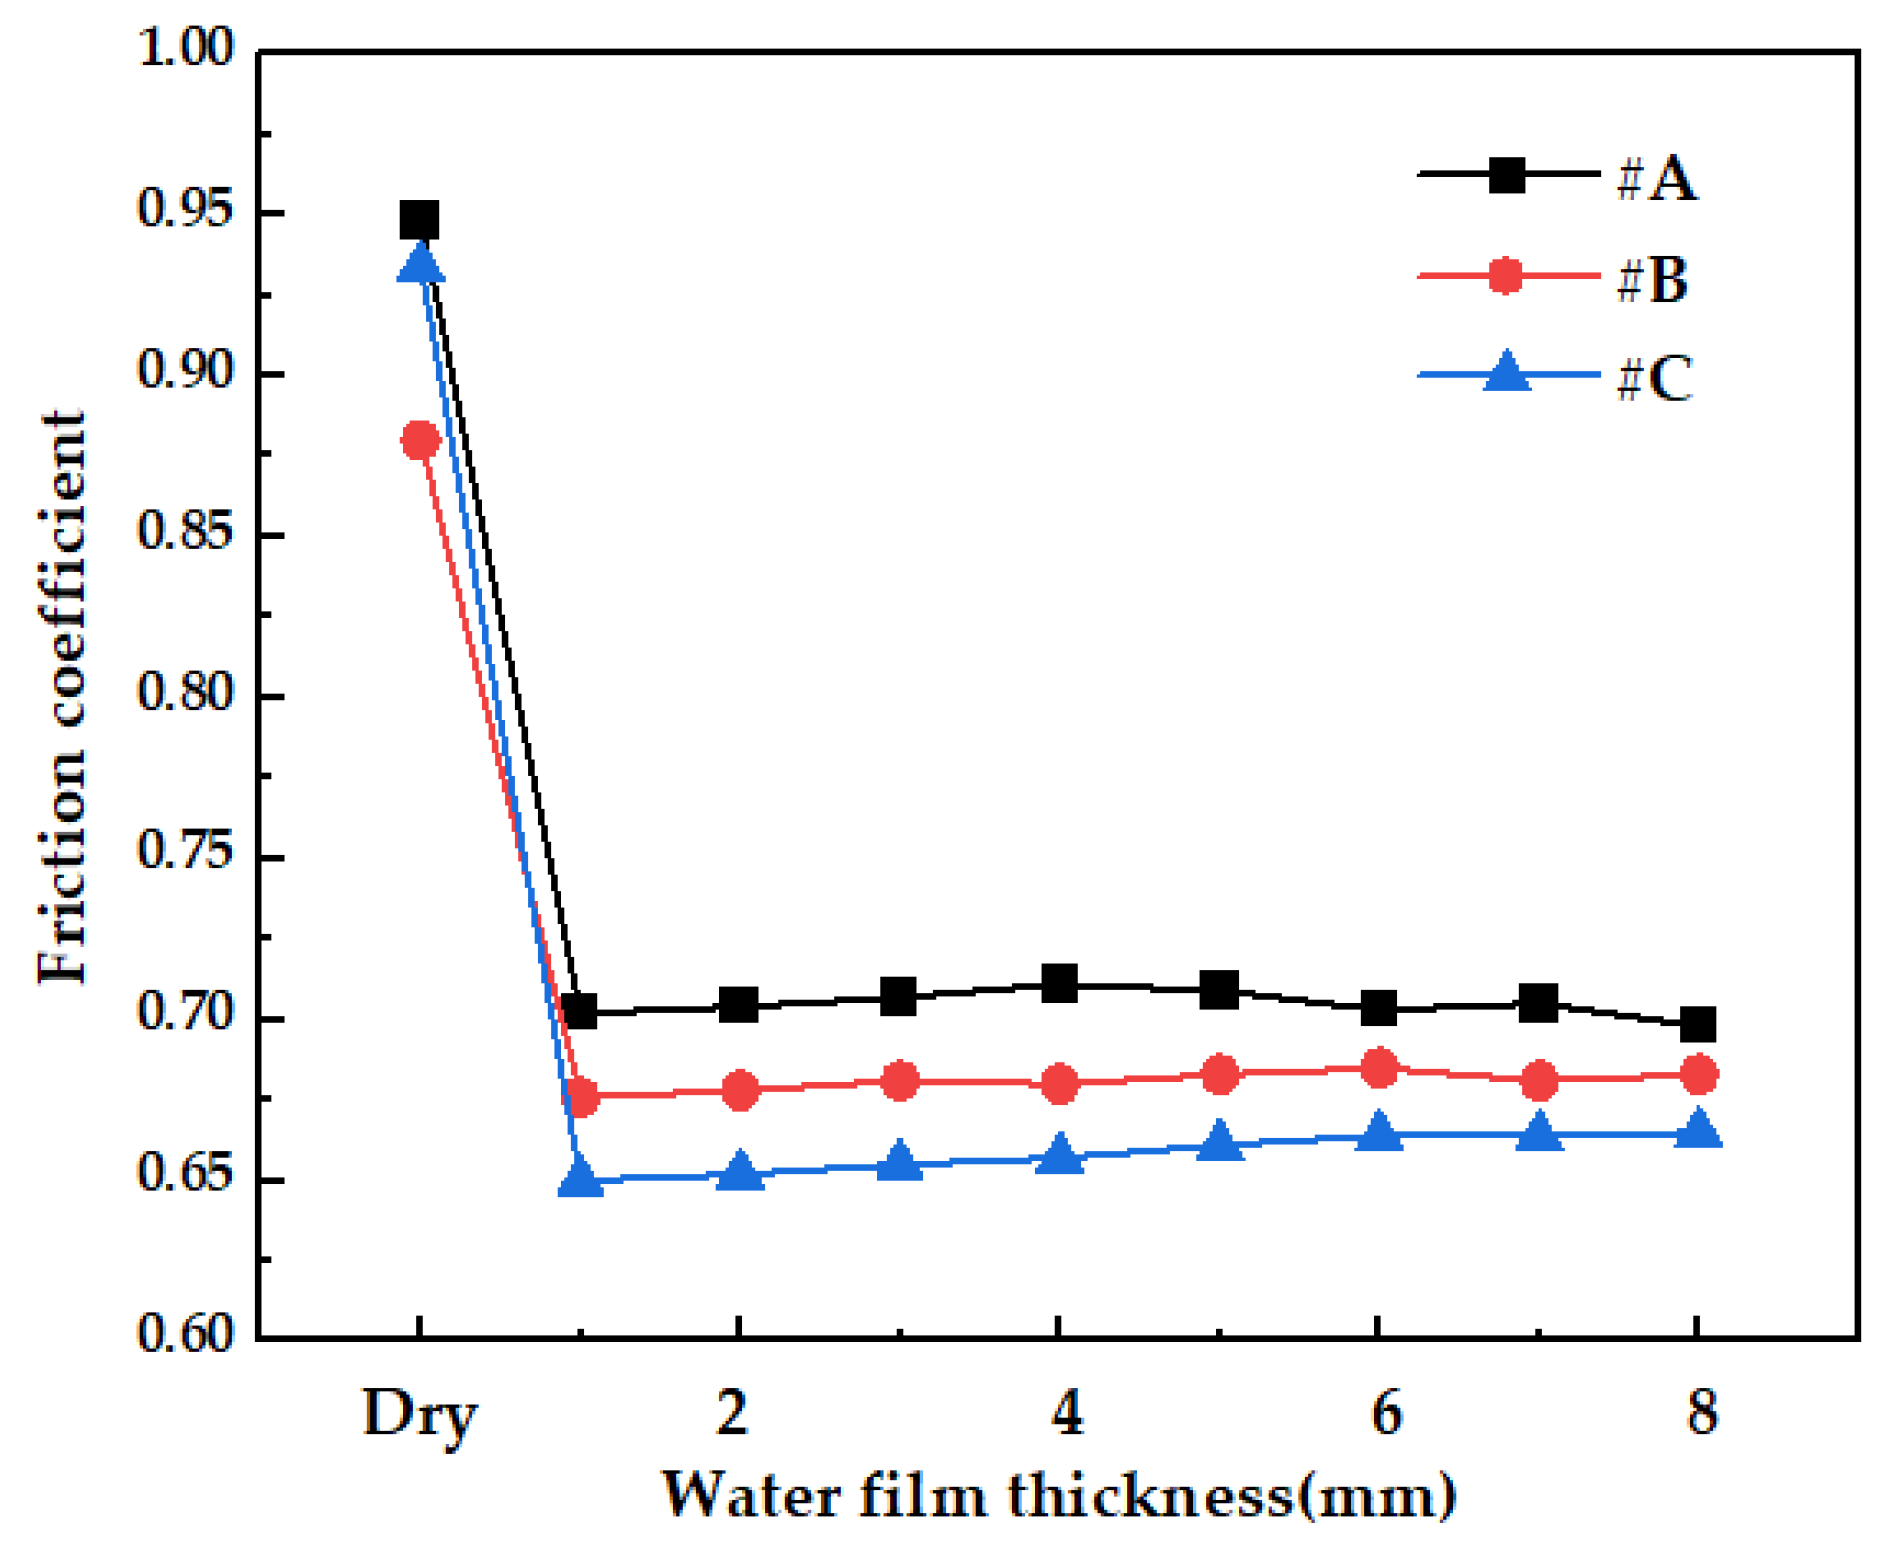
As demonstrated in Figure 13, the results of wet slip friction test of three formulations of A, B and C trapezoidal rubber blocks under the test conditions of vertical load of 345 N and slip speed of 100 mm/min, respectively, when the water film thickness is different. As can be seen from Figure 13, the friction coefficients of the three formulations of tread rubber during wet slip friction are significantly lower than the friction coefficients during dry rubbing. The decline in the coefficient of friction is especially evident following the formation of a thin water film measuring 0–1 mm. This finding aligns with the results obtained from the enhanced tyre–pavement friction model proposed by Zhao et al. [12]. And the friction coefficients of the different formulations of tread rubber decrease to different degrees, reflecting the differences in the wet slip performance of different formulations of rubber. It is evident that with an augmentation in the thickness of the water film, the wet slip friction coefficient undergoes negligible fluctuations, a phenomenon that is less perceptible in comparison to that observed on a dry road surface.
Figure 13.
Effect of water film thickness on the coefficient of wet slip friction.
3.4. Analysis of Orthogonal Test Results
According to the orthogonal factor levels and orthogonal test program in Table 3 above, the results of wet slip friction coefficient determination are shown in Table 4.
Table 4.
Orthogonal test result.
The friction coefficient of the test index was analysed by the orthogonal test results for the extreme difference, and the results of the analysis are shown in Table 5. Where Kij represents the sum of the test results of the ith level of the jth factor, kij represents the average of the sum of the test results of the ith level of the jth factor, and Rj represents the extreme deviation of the factor in which it is located. By comparing the extreme deviation of each factor, its impact weight on the test results can be obtained. As can be seen from Table 5, for the test index friction coefficient, its influence weight is vertical load > slip speed > water film thickness. Liu et al. [24] conducted orthogonal tests on these variables using tyre finite element simulation, achieving a similar ranking order. Although they did not conduct wet friction experiments, the simulation results confirmed the reliability of the aforementioned orthogonal test results. That is, within the range of values of each level of the factors shown in Table 3, the vertical load has the greatest influence on the coefficient of slippery friction, the slip speed is the second largest and the thickness of the pavement water film has the smallest influence on the coefficient of slippery friction.
Table 5.
Extreme variance analysis table.
Subsequently, analysis of variance (ANOVA) and significance analysis were performed on the extreme variance results. The results in Table 6 indicate that the effect of the vertical load on the tread on the coefficient of friction of wet slip is very significant, the slip speed has a significant effect on the coefficient of friction and the water film thickness of the road surface does not have a significant effect on the coefficient of friction, which is consistent with the results of the analysis of variance. The findings of the significance analysis demonstrate that the water film thickness does not have a significant effect on the coefficient of friction. Nevertheless, this orthogonal experimental program is to study the effect caused by changes in the thickness of the water film in the slippery condition. In reality, the coefficient of friction of the tread rubber in the dry road surface is about 26% higher than that in the slippery condition. The presence or absence of the water film on the road surface has a very significant effect on the coefficient of friction.
Table 6.
ANOVA table.
4. Conclusions
The anti-slip performance of tread rubber is of great significance to the safe driving of vehicles. This paper investigates the wet slip performance of tyre tread rubber specimens based on the self-developed test device. The results of the above analysis allow the following conclusions to be drawn:
- The wet slip performance of tread rubber and road surface in wet slip conditions is contingent on a number of factors, including vertical load, slip speed, and water film thickness, within the established range of test conditions. With an increase in vertical load applied to the rubber sample, the internal stress of the water film in contact with the bottom surface of the sample is increasing, the water film on the rubber sample of the support reaction force increases, while the coefficient of friction of the wet slip decreases with rising vertical load.
- The friction coefficient of the rubber block in the wet slip condition is obviously lower than that in the dry grinding condition, with a decrease of approximately 26%. Furthermore, the fluctuation of the friction coefficient change is minimal with increasing water film thickness. Within the parameters of the low-speed test interval allowed by the equipment, it was observed that the friction coefficient exhibited an increase in proportion to the rise in slip speed. And at very low speeds, the effect of the increase in speed on the friction coefficient is particularly obvious.
- The weights of the influence factors on the friction coefficient of each influence factor are vertical load > slip speed > water film thickness. These results are derived through polar analysis of the orthogonal test results. The results of the analysis of variance (ANOVA) and significance analysis show that the vertical load on the tread has a very significant effect on the coefficient of friction of wet slip, the slip speed has a significant effect on the coefficient of friction, and the thickness of the water film on the road surface has a non-significant effect on the coefficient of friction.
Author Contributions
Methodology, Y.W. (Yang Wan); Software, B.S.; Validation, G.H.; Investigation, Y.W. (Yang Wan); Resources, G.L.; Data curation, G.L.; Writing—original draft, Y.W. (Yang Wan); Writing—review & editing, B.S., G.L. and J.W.; Visualization, G.H.; Supervision, Y.W. (Youshan Wang); Project administration, Y.W. (Youshan Wang) and G.H.; Funding acquisition, G.H. and J.W. All authors have read and agreed to the published version of the manuscript.
Funding
This research is supported by the Taishan Scholars Foundation of Shandong Province (No. tsqn202408115) and Major Scientific and Technological Achievements Transformation Project of Guizhou Province, grant number Guizhou Sci-Tech Collaborative Achievement [2023] Major 003.
Data Availability Statement
The original contributions presented in this study are included in the article. Further inquiries can be directed to the corresponding author.
Conflicts of Interest
Author Gege Huang was employed by the company Guizhou Tyre Co., Ltd. The remaining authors declare that the research was conducted in the absence of any commercial or financial relationships that could be construed as a potential conflict of interest.
References
- Zhou, H.C.; Wang, G.L.; Jiang, Z.; Chen, X.P. Numerical Analysis Method for Friction Characteristics of Tire-pavement under Wet Slip Condition. J. Mech. Eng. 2020, 56, 177–185. [Google Scholar]
- Do, M.T.; Cerezo, V.; Beautru, Y.; Kane, M. Modeling of the connection road surface microtexture/water depth/friction. Wear Int. J. Sci. Technol. Frict. Lubr. Wear 2013, 302, 1426–1435. [Google Scholar] [CrossRef]
- Sabey, B.E. Pressure Distributions beneath Spherical and Conical Shapes pressed into a Rubber Plane, and their Bearing on Coefficients of Friction under Wet Conditions. Proc. Phys. Soc. 1958, 71, 979–988. [Google Scholar] [CrossRef]
- Deleau, F.; Mazuyer, D.; Koenen, A. Sliding friction at elastomer/glass contact: Influence of the wetting conditions and instability analysis. Tribol. Int. 2009, 42, 149–159. [Google Scholar] [CrossRef]
- Licher, J.; Schmerwitz, F.; Soleimani, M.; Junker, P. Experimental investigation of the tire wear process using camera-assisted observation assessed by numerical modeling. Tribol. Int. 2023, 189, 108918. [Google Scholar] [CrossRef]
- Zhao, H.D.; Wu, M.Z.; Wu, S.T. Variation of asphalt pavement friction coefficient with change of water film thickness. J. Civ. Aviat. Univ. China 2015, 33, 47–52. [Google Scholar]
- Greenwood, J.A.; Tabor, D. The Friction of Hard Sliders on Lubricated Rubber: The Importance of Deformation Losses. Proc. Phys. Soc. 1958, 71, 989–1001. [Google Scholar] [CrossRef]
- Persson, B.N.J.; Tartaglino, U.; Albohr, O.; Tosatti, E. Rubber friction on wet and dry road surfaces: The sealing effect. Phys. Rev. B Condens. Matter Mater. Phys. 2005, 71, 035428. [Google Scholar] [CrossRef]
- Persson, B.N.J. Theory of rubber friction and contact mechanics. J. Chem. Phys. 2001, 115, 3840–3861. [Google Scholar] [CrossRef]
- Ji, T.J.; Huang, X.M.; Liu, Q.Q. Part hydroplaning effect on pavement friction coefficient. J. Traffic Transp. Eng. 2003, 3, 10–12. [Google Scholar]
- Zhu, Y.G.; Liu, X.J.; Wang, W.; Liu, K. A Study on Tire Wet Traction Performance with Consideration of Road Roughness and Hydrodynamic Action. Automot. Eng. 2007, 29, 616–619, 629. [Google Scholar]
- Zhao, L.R.; Zhao, H.D.; Cai, J.W. Tire-pavement friction modeling considering pavement texture and water film. Int. J. Transp. Sci. Technol. 2024, 14, 99–109. [Google Scholar] [CrossRef]
- Guo, K.H.; Wu, H.D.; Lu, D. Brush model for steady-state side-slip of tire on icy road. J. Jilin Univ. (Eng. Technol. Ed.) 2007, 37, 253–258. [Google Scholar]
- Zhang, L.; Cai, Z.; Wang, L.; Zhang, R.; Liu, H. Coupled Eulerian-Lagrangian finite element method for simulating soil-tool interaction. Biosyst. Eng. 2018, 175, 96–105. [Google Scholar] [CrossRef]
- Zeng, H.; Zhao, C.; Chen, S.; Xu, W.; Zang, M. Numerical simulations of tire-soil interactions: A Comprehensive Review. Arch. Comput. Methods Eng. 2023, 30, 4801–4829. [Google Scholar] [CrossRef]
- Armin, A.; Fotouhi, R.; Szyszkowski, W. On the FE modeling of soil–blade interaction in tillage operations. Finite Elem. Anal. Des. 2014, 92, 1–11. [Google Scholar] [CrossRef]
- Jiang, B.Y.; Wang, H. An integrated analytical model for friction characteristics of aircraft tire on wet runway pavement. Tribol. Int. 2023, 185, 108501. [Google Scholar] [CrossRef]
- Ma, B.; Xu, H.G.; Liu, H.F. Effects of road surface fractal and rubber characteristics on tire sliding friction factor. J. Jilin Univ. (Eng. Technol. Ed.) 2013, 43, 317–322. [Google Scholar]
- Seta, E.; Nakajima, Y.; Kamegawa, T.; Ogawa, H. Hydroplaning analysis by FEM and FVM: Effect of tire rolling and tire pattern on hydroplaning. Tire Sci. Technol. 2000, 28, 140–156. [Google Scholar] [CrossRef]
- Ong, G.P.; Fwa, T.F. Mechanistic Interpretation of Braking Distance Specifications and Pavement Friction Requirements. Transp. Res. Rec. 2010, 2155, 145–157. [Google Scholar] [CrossRef]
- Zhou, H.C.; Chen, L.; Zhai, H.H.; Lei, L.L. Reserch on Flow Field and Influencing Factors of Tire Hydroplaning Based on CFD Method. J. Chongqing Jiaotong Univ. (Nat. Sci.) 2017, 36, 110–116. [Google Scholar]
- Yang, J.; Wang, H.P.; Wu, Q. Numerical simulation on skid resistance property of wet asphalt pavement. J. Chang. Univ. (Nat. Sci. Ed.) 2016, 36, 25–32. [Google Scholar]
- Indriasari; Kaewsakul, W.; Dierkes, W.K.; Blume, A. Defining Key Factors in Carbon Black-Filled NR/BR Compounds for Balancing Aircraft Tire Tread Properties. J. Compos. Sci. 2019, 3, 47. [Google Scholar] [CrossRef]
- Liu, C.Z.; Chen, G.; Liu, H.Z.; Ma, Q.; Xu, C.W.; Meng, H.; Wang, G.L. Tire grounding mechanical UA model on wet roads. J. Jilin Univ. (Eng. Technol. Ed.) 2024, 54, 1501–1511. [Google Scholar]


Disclaimer/Publisher’s Note: The statements, opinions and data contained in all publications are solely those of the individual author(s) and contributor(s) and not of MDPI and/or the editor(s). MDPI and/or the editor(s) disclaim responsibility for any injury to people or property resulting from any ideas, methods, instructions or products referred to in the content. |
© 2025 by the authors. Licensee MDPI, Basel, Switzerland. This article is an open access article distributed under the terms and conditions of the Creative Commons Attribution (CC BY) license (https://creativecommons.org/licenses/by/4.0/).