1. Introduction
Reinforced concrete structures utilizing reinforcing bar (rebar) are prevalent in modern infrastructure and construction. Traditionally, rebar is made from steel due to its strength, stiffness, and ductility. However, steel rebar can corrode, limiting the lifespan of reinforced concrete structures subject to environmental stressors, including freeze–thaw cycling, deicing chemicals, and marine environments. Fiber-reinforced polymer (FRP) rebar solutions are becoming more popular for corrosion-prone applications, as evidenced by durability case studies on in-service structures reaching up to twenty years of age [
1], review of their flexural performance [
2], and their adoption in design standards, notably ACI 440 [
3] and AASHTO [
4] in the United States. These standards specify the use of vinyl ester or epoxy thermoset resins and glass fiber reinforcement for FRP rebar constituent materials. However, thermosetting polymer resins cross-link during the polymerization process, resulting in a polymer matrix that cannot be reshaped once cured. Consequently, thermoset FRP rebar cannot be bent in the field [
5,
6,
7,
8], which can cause material waste, limit construction flexibility, and result in construction delays if bent bars are not fabricated accurately or must be modified based on construction changes [
9,
10,
11].
A promising solution to ensure both corrosion resistance and field bendability is to fabricate FRP rebar using thermoplastic polymers. Since thermoplastic polymers do not cross-link, they can be reshaped after forming with heat [
10,
12,
13,
14], enabling field bending of FRP rebar [
6,
15,
16,
17]. The University of Maine has been advancing research on fiber-reinforced thermoplastic polymers (FRTPs) to leverage their unique benefits, including re-formability and corrosion resistance [
18]. As part of this initiative, the Continuous Forming Machine (CFM) is being developed as an innovative method for pultruding prismatic FRTPs using pre-consolidated fiber-reinforced tapes. Thermoplastic composite rebar, which combines the advantages of thermoplastics with the CFM pultrusion process, became the first manufacturing target. Prototype rebar was subsequently subjected to bending trials, tensile testing, and full-scale 6 m beam tests to evaluate necessary improvements for applications in the construction and infrastructure sectors.
The manufacturing of conventional thermoset FRP rebar using the pultrusion process begins by pulling reinforcing fibers from a creel system through a low-viscosity polymer resin bath to saturate the fibers. Once saturated, the fibers are shaped and cured in a forming die and then cut to length after exiting the pulling system. This process is known as the pultrusion process, and it is a cost-efficient method for continuously manufacturing prismatic FRP cross-sections like FRP rebar at industrial scale [
17]. However, the high processing viscosities of thermoplastics [
10,
12,
13,
14,
17,
19] hinder fiber saturation, which makes conventional pultrusion of thermoplastic FRP rebar infeasible.
Despite this challenge, the possibility of using FRPs with weldability [
13,
14,
15,
19,
20], recyclability [
10,
13,
14,
17,
20,
21,
22], increased impact resistance [
14,
15,
20,
21], reduced volatile organic compound emissions during processing [
21,
22], and nearly indefinite shelf-life [
23] provide several incentives to develop thermoplastic pultrusion [
23]. Consequently, thermoplastic pultrusion is currently being advanced with several distinct methods, which can be broadly categorized as using reactive or nonreactive material systems [
24].
Reactive material systems use a resin that is polymerized during the manufacturing process, allowing it to be injected into a heated die to wet-out reinforcing fibers [
24]. Zoller et al. manufactured glass FRP (GFRP) thermoplastic rebar using a reactive acrylic thermoplastic resin known as Elium, produced by Arkema [
5,
13]. Wang et al. also used reactive pultrusion to manufacture thermoplastic rebar [
16].
Nonreactive material systems use polymerized resins in a variety of forms to saturate the reinforcing fibers. Melt-impregnated pultrusion uses distinct materials by injecting melted thermoplastic under pressure into the pultrusion die to saturate dry reinforcing fibers, replacing a traditional resin bath [
24]. For pultrusion processes using comingled materials, hybrid yarn, and powder-impregnated materials, the feedstock consists of a polymer that is partially mixed with the reinforcing fiber. The polymers in this feedstock are melted in the pultrusion die to fully saturate the reinforcing fibers during the consolidation process. This manufacturing method has been used to create natural fiber composite rebar [
25]. Lastly, pultrusion processes using towpregs and pre-consolidated tapes use fully consolidated fibers and matrix as the feedstock [
26,
27]. As a result, the feedstock is heated and consolidated in the pultrusion die, skipping the need to saturate the reinforcing fibers. Vedernikov et al. [
28] pultruded 6 mm diameter polypropylene glass fiber bars using pre-consolidated tapes as the feedstock, which have undergone several tests [
28,
29,
30,
31].
Some researchers experimenting with thermoplastic rebar only define the manufacturing method as pultrusion [
15,
32] or do not report the manufacturing method at all [
7,
8,
17]. Of those that did not report a manufacturing method, D’Antino reported using thermoplastic rebar from Sireg Geotech SRL [
10,
11,
33], while Abbasi and Hogg reported using thermoplastic rebar manufactured by the Dow Chemical Company [
34]. In addition to pultrusion methods, braiding [
35] and compression molding [
6] are also being utilized in the creation of thermoplastic rebar.
This paper documents recent research on the development of a new thermoplastic rebar that, in contrast with prior research, focuses on fabrication using a novel continuous forming process with nonreactive resins. Included are the initial development and details of the rebar fabrication, trials to assess the ease of field bending, tension testing to determine properties, and full-scale 6 m long beam testing to assess the potential for this new thermoplastic rebar to be used for both flexural and shear reinforcement.
2. Manufacturing
In this study, thermoplastic rebar was manufactured using pre-consolidated FRTP tapes as the feedstock, as performed by Vedernikov et al. [
28]. However, the CFM (
Figure 1) uses an initial preheating stage to rapidly heat tapes before consolidating the tapes in a single die [
18]. Using the CFM, 12.7 mm diameter bar was pultruded and manufactured at production speeds up to the research puller’s mechanical limit of 4 m/min. However, for the initial prototyping of thermoplastic rebar, a speed of 0.3 m/min was used. The initial manufacturing trials relied on PETG/E-Glass unidirectional tapes manufactured by Avient Corporation located in Englewood, IL, USA (Polystrand IE 5843.1) as the feedstock, which are inexpensive and readily available [
36]. This material has a tensile strength of 945 MPa, tensile modulus of 30,300 MPa, and fiber mass fraction of 58%, as reported in the manufacturer’s supplied technical data sheet.
The prototype rebar was manufactured by feeding nine 50.8 mm wide FRTP tapes (a combined width of 457.2 mm), heated to a temperature of 140 °C, into the pultrusion die, which had a nominal 12.7 mm diameter. Surface ridges were then formed into the bar by feeding it into a pair of rotating molds to continuously imprint shear lugs into the bar’s surface, as seen in
Figure 2a. These ridges provide a mechanical bond with concrete for strain transfer. The design for these lugs followed ISO 6935-2:2015(E) [
37] to make rebar lugs with a height of 0.254 mm, width of 4.57 mm, and a spacing of 7.62 mm. This method of manufacturing the ridges was chosen to take advantage of the formability and implementation simplicity of thermoplastics. Once manufactured, density testing and burn-off testing were conducted to help characterize the rebar. Using the average volume/length of the rebar, a diameter of 11.6 mm was determined, the fiber mass fraction of the rebar was verified to be 58%, and the void content was found to be 4.7%.
Figure 2b shows a resulting prototype rebar from this manufacturing process, which demonstrates the ability of the CFM to manufacture thermoplastic rebar.
3. Bent Rebar
Rebar must be bent for various applications. Hooks are commonly created at bar ends to act as anchors to ensure the proper development of tensile strength where needed. Stirrups, which are rebar bent into closed rectangular loops and U shapes, provide shear reinforcement and confinement in beams and columns. Additionally, bent rebar is used to reinforce joints and corners to provide structural continuity. Previous research has shown that the tensile strength of bent FRP rebar can be reduced to 21–84% of the strength of straight rebar [
7,
8,
16,
38,
39]. Currently, AASHTO [
3] and ACI [
4] assume bent rebar to be 40% weaker in tension than straight bar. Furthermore, both standards limit the tensile strain of stirrups to 0.4% for crack control, which often controls design. The limited strength is in part due to fiber buckling from bending the bars [
7,
38,
39].
For the PETG/E-Glass prototype rebar, bending trials were focused on determining a simple, field-applicable bending procedure that results in a uniform radius with minimal fiber misalignment. As the technology matures, tensile testing of bent thermoplastic rebar will need to be conducted to ensure code compliance with ASTM D7957 [
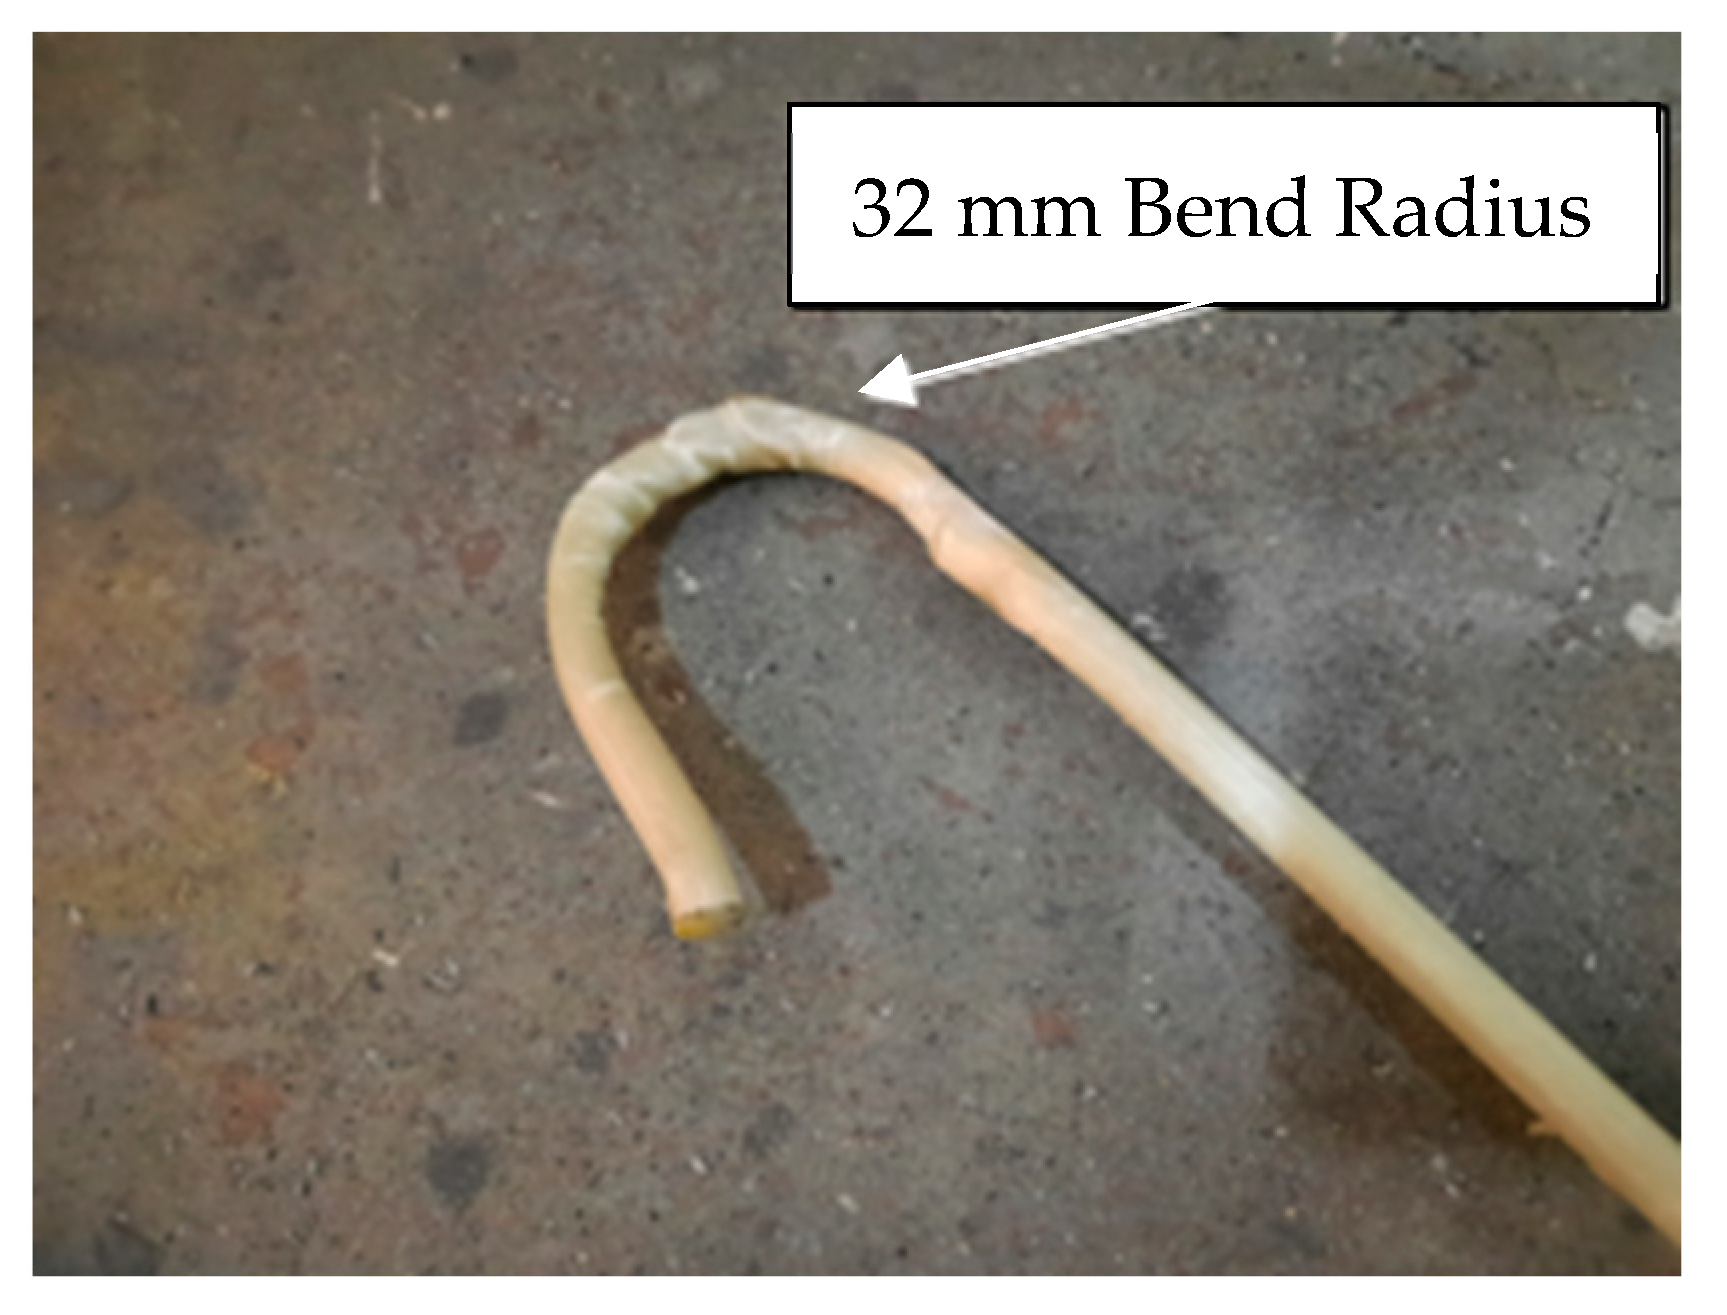
40] when investigating development lengths. Initial bending trials used a conduit bender and a manual rebar bender in conjunction with a heat gun. Bending the rebar with both tools resulted in buckling the rebar or kinking the compression fibers when used to bend the rebar, regardless of the rebar temperature, bending rate, and tension on the rebar. The large radius of the conduit bender also required a longer length of rebar to be heated than the heat gun could uniformly heat, further hurting its potential usage.
Figure 3 shows an example of a rebar deformed with a conduit bender.
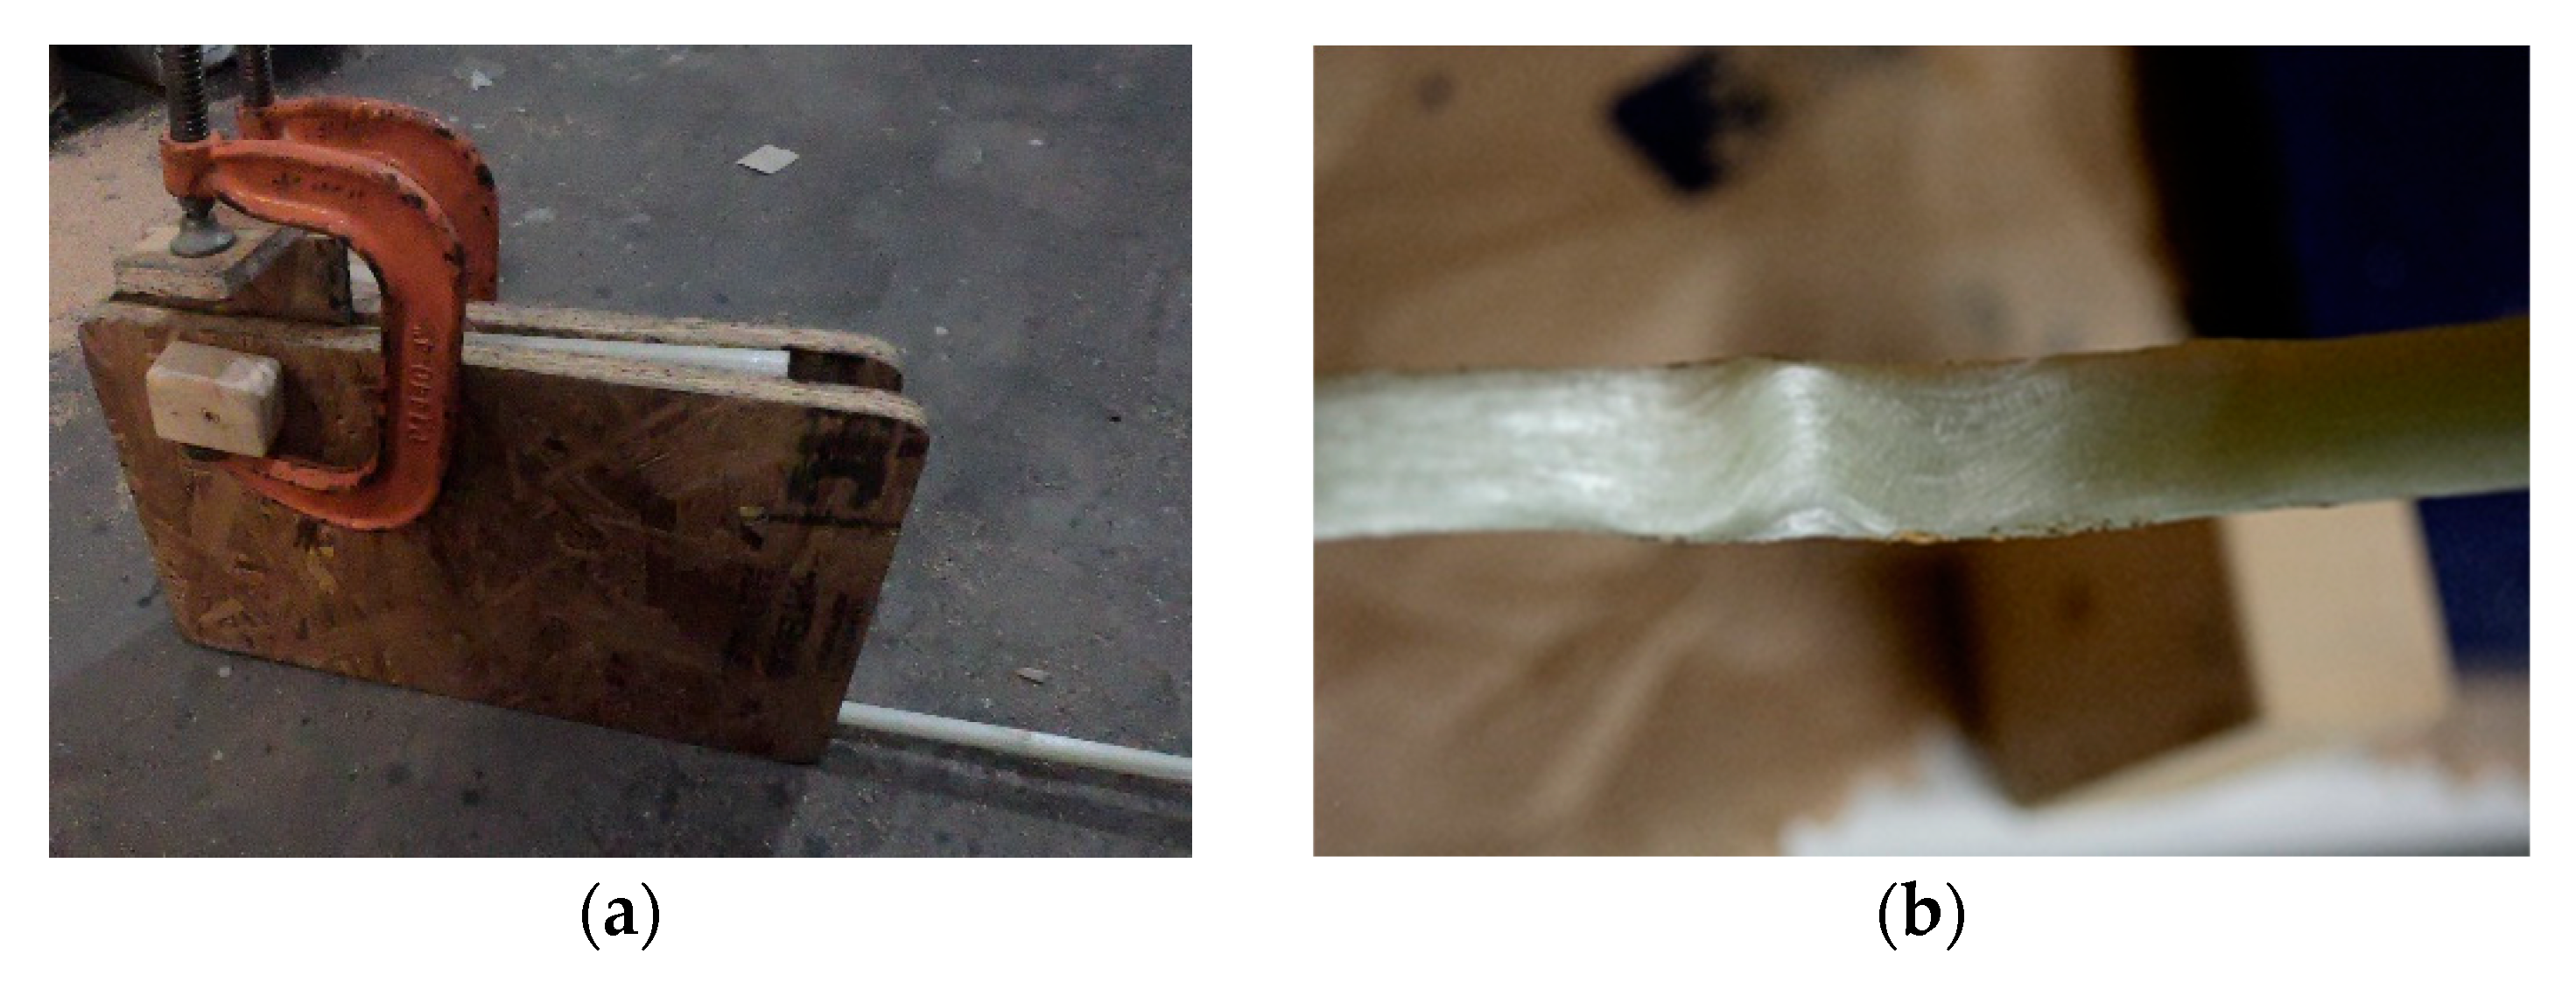
The next thermoplastic rebar bending method used a mandrel sandwiched between two sheets of wood to create the desired bend geometry, as shown in
Figure 4a. This mandrel included an attachment for clamping the rebar during the bending process, allowing the rebar to be more easily tensioned while being bent, unlike the previous methods. The mandrel corners were manufactured with a 38.1 mm radius in accordance with the minimum bend radius specified by ASTM D7957 [
40]. A standard heating length of 152.4 mm over the bend length was implemented as well as a minimum heating temperature of 150 °C, which was measured using an infrared thermometer. Once bent, tension was maintained on the rebar until it had cooled below 93 °C to prevent spring back. This process resulted in a superficially smooth bend, but closer inspection of the bend radius in
Figure 4b shows fiber kinking inward toward the middle of the bar.
The final method involved bending the rebar under tension by hand around a steel pipe, while simultaneously applying a torsional twist of 180° to 270° while the resin was soft. The heated length was reduced to approximately 127 mm for this procedure based on the experience gained during these trials. This method was simple to implement, making it amenable to field bending on a job site. The method also eliminated kinking of the fibers, with the tradeoff of intentionally misaligning the fibers relative to the axis of the bar by twisting.
Figure 5 shows a bend resulting from this procedure.
4. Determination of Bar Tensile Strength and Modulus
Tension testing of the thermoplastic composite rebar followed modified ASTM D7025/7205M-21 [
41] testing. The standard was modified to four test specimens (as the fifth specimen was damaged and a replacement was not available at the time of testing) and a 50 mm gauge-length extensometer due to availability. Specimens were grouted using Five Star DP Epoxy Grout into ASTM A500 bare steel pipe procured from MIDWEST STEEL AND ALUMINUM from Rogers, AR, USA. The pipe had a length of 762 mm with an outer diameter of 50 mm and a wall thickness of 12.7 mm. Testing was performed using a 250 kN hydraulic actuator. At 44.5 kN of load, the extensometer was removed from the rebar to prevent it from being damaged. A test diagram and typical specimen failure are shown in
Figure 6.
The tested specimens exhibited brooming failure typical of FRP rebar tension tests. Axial stress was calculated using the applied force and nominal bar cross-sectional area of 129 mm
2. The resulting average failure stress was 579 MPa, with a standard deviation of 18.2 MPa, resulting in a guaranteed tensile strength of 524 MPa (limited to four specimens) and a coefficient of variation of 3.13%. A mean elastic modulus of 23,900 MPa was calculated using linear least squares to fit the data between 0.001 and 0.006 strain, in accordance with ASTM D7205 [
41].
Figure 7 shows the actuator force–displacement curve from each test to be nearly linear to failure.
Both the ACI Committee 440 [
3] and the AASHTO [
4] specifications conform to the requirements of ASTM standards. Since the most recent release of these ACI and AASHTO standards, ASTM D8505-23, “Standard Specification for Basalt and Glass Fiber Reinforced Polymer (FRP) Bars for Concrete Reinforcement” [
42], has been released, which applies to thermoset composite rebar. ASTM D8505-23 specifies a minimum 60,000 MPa tensile modulus of elasticity for current commercially available FRP thermoset composite rebar, and it also requires a minimum guaranteed tensile force (#4 bar) of 124 kN.
The analyses of the data showed that the prototype FRTP rebar fell short of the required minimum guarantee tensile force of 124 kN tensile strength for 12.7 mm nominal diameter rebar, and the tensile modulus of elasticity of the FRTP was less than 40% the required 60,000 MPa. However, enhancements to the tensile strength and elastic modulus could be achieved by selecting engineered FRTP material feedstock. The thermoplastic composite material adopted for this study was selected to create prototype bars because of its availability, and alternative materials are being investigated for future improvements. It must also be noted that compression molding the shear lugs locally misaligned or kinked fibers near the surface of the rebar. These can result in stress concentrations and fiber breakage that reduce the bar’s tensile strength and elastic modulus. Different shear lug geometries or other surface deformation methods, as well as a larger-than-nominal bar diameter, as permitted by ASTM D7957-22 [
40] and ASTM D8505-23 [
42], may be required in addition to different material systems to achieve the necessary tensile properties. However, with these caveats, compression molding of the lugs remains a promising method of introducing surface deformations and warrants additional investigation due to its low cost and ease of incorporation in the primary manufacturing process.
6. Bending Test Setup
The beams were tested in four-point bending using a 6.1 m span with load heads located at the third points (1016 mm off-center) of the beam. The beam supports consisted of two roller-tilt tables to allow rotation and translation at the beam ends, and each beam was loaded through 102 mm by 305 mm steel plates to distribute the load from a spreader beam attached to the actuator load clevis. Additionally, at all contact points along the beam, neoprene pads were inserted to avoid potential stress concentrations from uneven load application. The final test setup showing a beam prior to testing is given in
Figure 9.
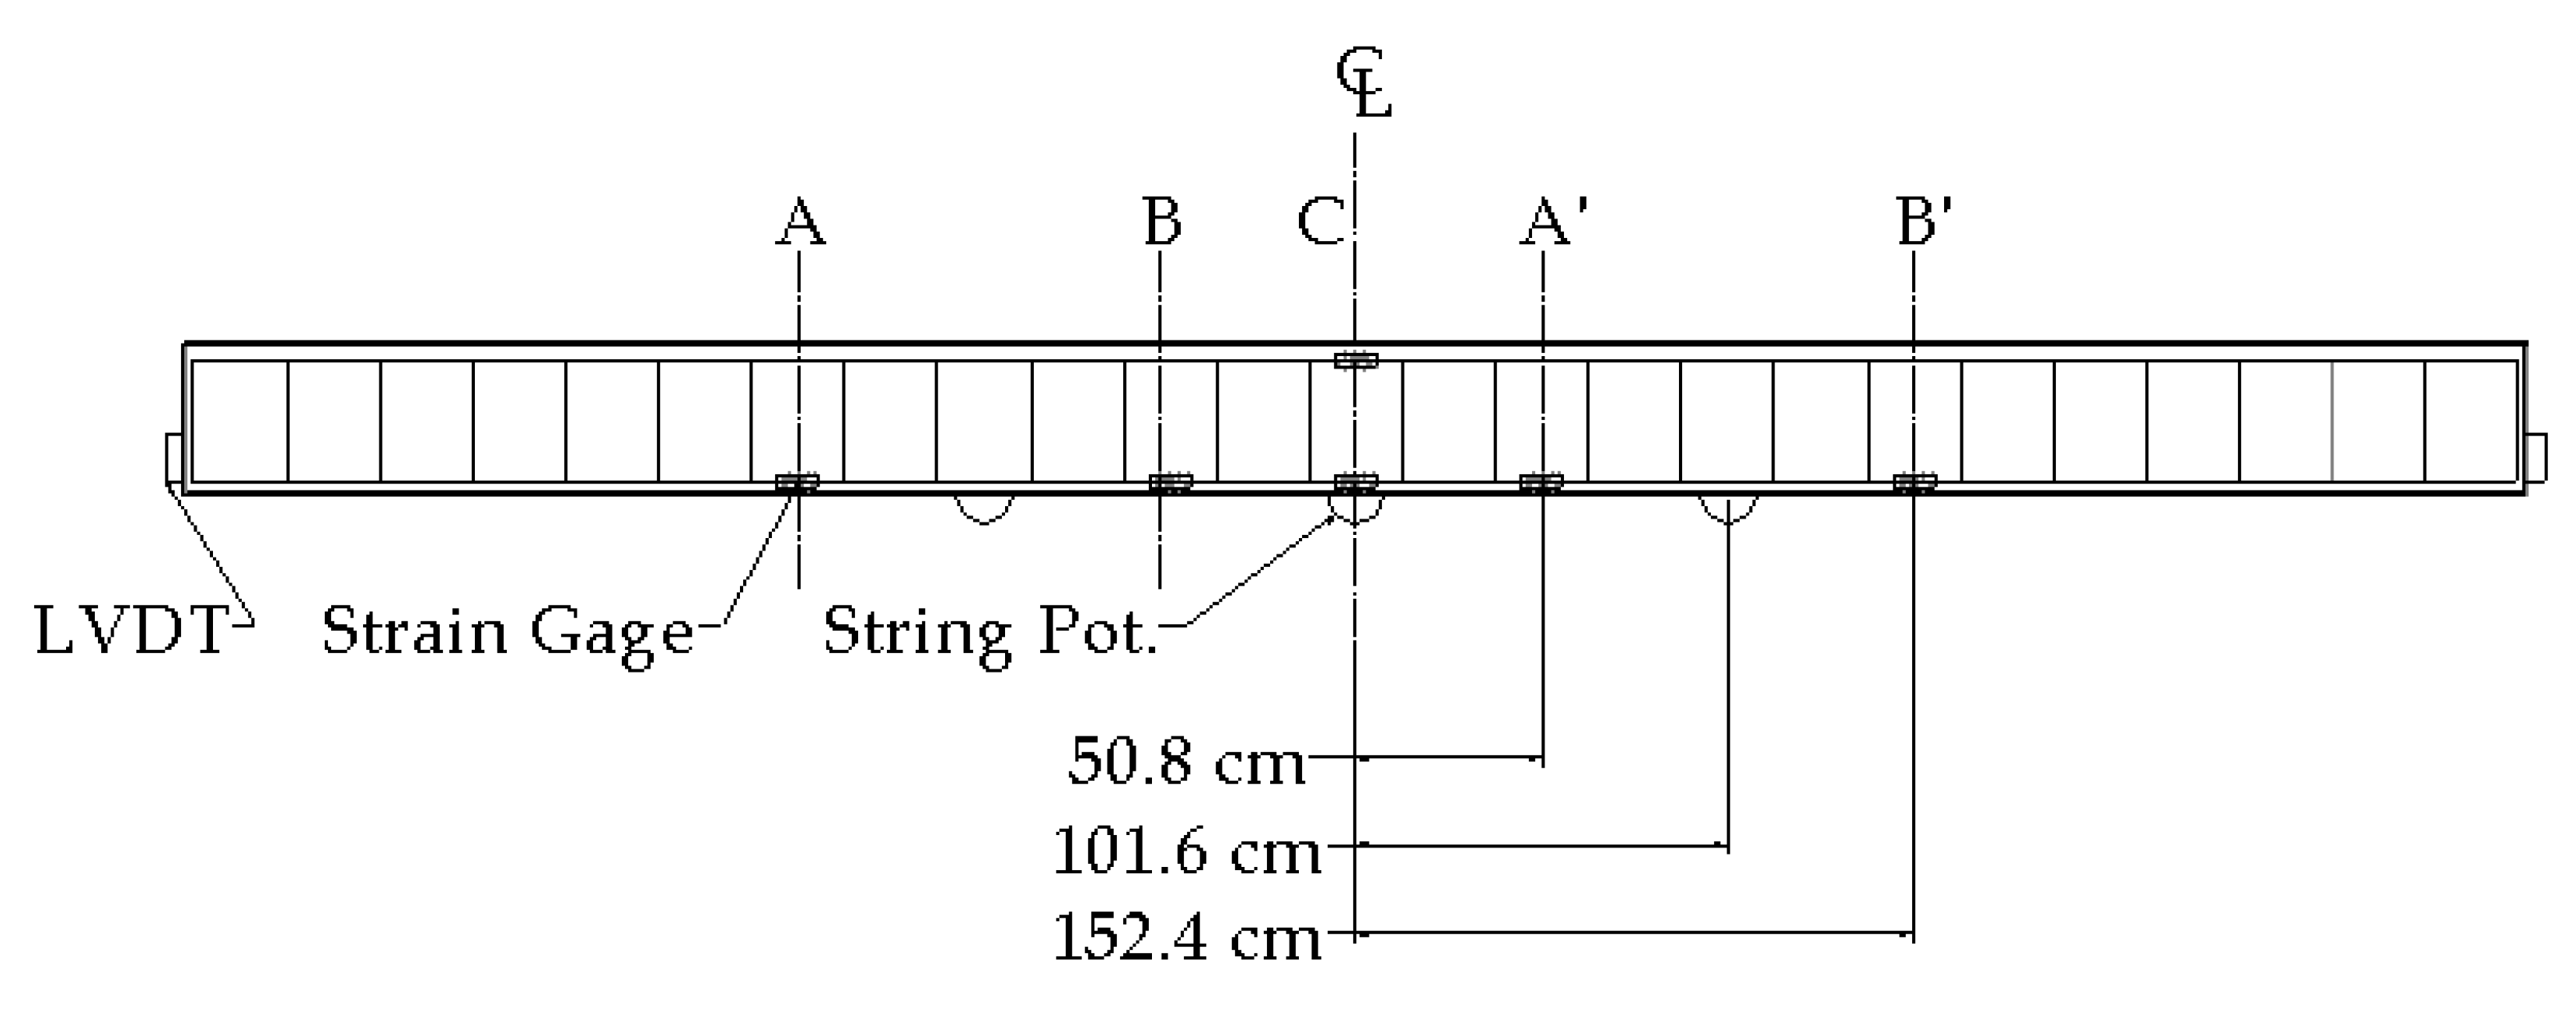
During testing, load and position data were recorded by the actuator’s internal load cell and linear variable differential transformer (LVDT). Additional deflection data were also recorded by string potentiometers at the midspan of each beam and under the load points, as indicated in
Figure 10. Rebar tensile strain data were recorded for all longitudinal bars on either side of the loading points and at midspan using strain gauges bonded directly to the rebar before concrete was cast. The cross-sections where each set of strain gauges were located are shown in
Figure 10 as A, B, C, A’, and B’. Each section’s strain gauges were sequentially located on adjacent rebars from one side of the beam’s cross-section to the other. All of the instrumentation on each beam was symmetric with respect to its center line, denotated ℄. During testing, the data from each instrument were recorded at a rate of 5 Hz.
Each beam was subjected to three distinct load levels. The first load level produced 60% of the beam’s predicted cracking moment in five minutes, followed by a two minute unload, and was repeated until three cycles were completed. This process was then repeated for a load producing the predicted cracking moment for an additional three cycles. Lastly, the beams were subjected to a position ramp to failure at a rate of 12.7 mm/min.
7. Reinforced Beam Testing Results and Discussion
Once poured, periodic compression testing was conducted on concrete samples from which the same batch the beams were cast. The average compressive strength of the concrete is shown in
Table 1. Testing of the beams started 35 days after the concrete pour and ended 42 days after the pour. The strength of the concrete during this time was approximately 44.0 MPa, which shows that the concrete reached 150% of its design strength during the time of testing.
Specimens B1 and B2, each with two tensile rebars, reached an average failure moment of 43.8 kN·m, while specimens B3 and B4, with four tensile rebars, reached an average failure moment of 83.7 kN·m. There was no concrete crushing observed at failure for any of the beams tested. Tensile rupture of the thermoplastic rebar initiated failure in all four of the beams tested, and the failures, while sudden, were mild.
Figure 11 shows the midspan concrete cracks from B4 as well as the ruptured tensile rebars. The concrete around the tensile reinforcement at failure was carefully removed where the beam failed in situ using a hammer drill to better expose the primary reinforcing bars. These results were typical of the other beams tested.
A direct comparison of the nominal moment capacity Mn was performed by analyzing reinforced concrete beams, swapping out rebar on a bar-by-bar basis. These analyses utilized AASHTO 2012 LRFD Bridge Design Specifications for Grade 60 steel rebar and AASHTO 2018 LRFD Bridge Design Guide Specifications for GFRP-Reinforced Concrete for FRP rebar [
4] (including the prototype). A reinforced concrete beam utilizing four Grade 60 steel #4 bars had a nominal moment capacity of 71.56 kN·m at yield and an ultimate capacity of 94.57 kN·m. By contrast, the same beam reinforced with V-Rod 60 FRP rebar showed a significantly higher nominal moment capacity of 155.94 kN·m. The prototype thermoplastic rebar, made from PETG/E-Glass, provided a nominal moment capacity of 94.52 kN·m, indicating that it could achieve bending performance comparable to the ultimate capacity of Grade 60 steel rebar in this configuration. However, it is important to note that the application of strength reduction and other knock-down factors will reduce these nominal capacities by different amounts when determining final design moment resistance.
Deflection data for B1 used the actuator’s LVDT while B2, B3, and B4 used the center span string potentiometer. String potentiometer deflections are typically preferred to reduce the inclusion of deflections resulting from test setup compliance whenever possible; however, the initially chosen one had too short of a stroke, necessitating the LVDT’s use. B1’s maximum measured deflection was 156 mm. B2’s maximum recorded midspan deflection was 139 mm. However, it should be noted that two through-thickness cracks were observed in B2 prior to testing, which likely affected the final recorded deflection value. B3 reached a maximum midspan deflection of 240 mm at ultimate loading and B4 at 246 mm.
Table 2 shows the measured failure moment and displacement for each beam tested.
The complete load–displacement curves for all beams tested are shown in
Figure 12, grouped by number of tensile reinforcing bars. The beams exhibited large deflections for their span-to-depth ratio, and matching beam pairs had consistent load–displacement profiles. However, B1 had a unique loading procedure due to being the first beam tested. Its observed cracking informed load corrections for the remaining beam tests to prevent premature cracking during load ramps. This test was also unloaded (twice) when considering if the beams would undergo violent, brittle failure due to stored elastic energy. The load–displacement curves for all beams tested were largely bilinear, starting with a stiff response that softened during cracking. Cracks forming in the beams tested could be observed as local valleys in their load–displacement curves. These cracks were characterized by a sharp decrease in load, followed by an accelerated increase in load until the primary bending stiffness was largely regained and the corresponding load rate resumed.
Many strain gauges functioned as expected until the beams began cracking, at which point their output values spiked to a maximum or oscillated rapidly. This behavior was likely a result of the soldered joints failing. Consequently, these erratic strain data, as well as values from gauges that recorded abnormal readings from testing onset were omitted. The remaining strain data were further processed using MATLAB’s (version R2022a) built-in Savitzky–Golay filtering function. A first-degree polynomial and 901 data point frame length were employed to reduce noise and remove abnormalities in the strain response while preserving the overall trends. Care must therefore be taken when interpreting or using the presented data, which have been included for completeness.
The data from strain gauges that had any correspondence with the applied live loads for B1 and B2 are shown in
Figure 13. Strain gauges are color coded by their distance from the beam’s center span to accentuate trends, however they are not further differentiated to keep the figure clear. Only the furthest strain gauges from midspan at cross-section A recorded usable data for B1. These data showed little strain increase in the reinforcement until the beam reached a live-load moment of 15 kN·m, and then the strain increased with load until strain gauge failure occurred. The strain in the rebar also appeared to be permanent, as it held constant during a loading cycle, indicating moderate strain discontinuity with the beam. This was also consistent with the load–displacement curve in
Figure 12, where the live load applied to B1 was fully removed twice, yet most of the deflection remained. The tensile strains in B2 were similarly restricted to strain gauges not at the beam’s centerline like B1. These data showed unequal strain developing in each of the equidistance strain gauges from the beam’s centerline, as well as permanent strains in the rebar during loading cycles. Recorded strain near failure was not achieved in either B1 or B2.
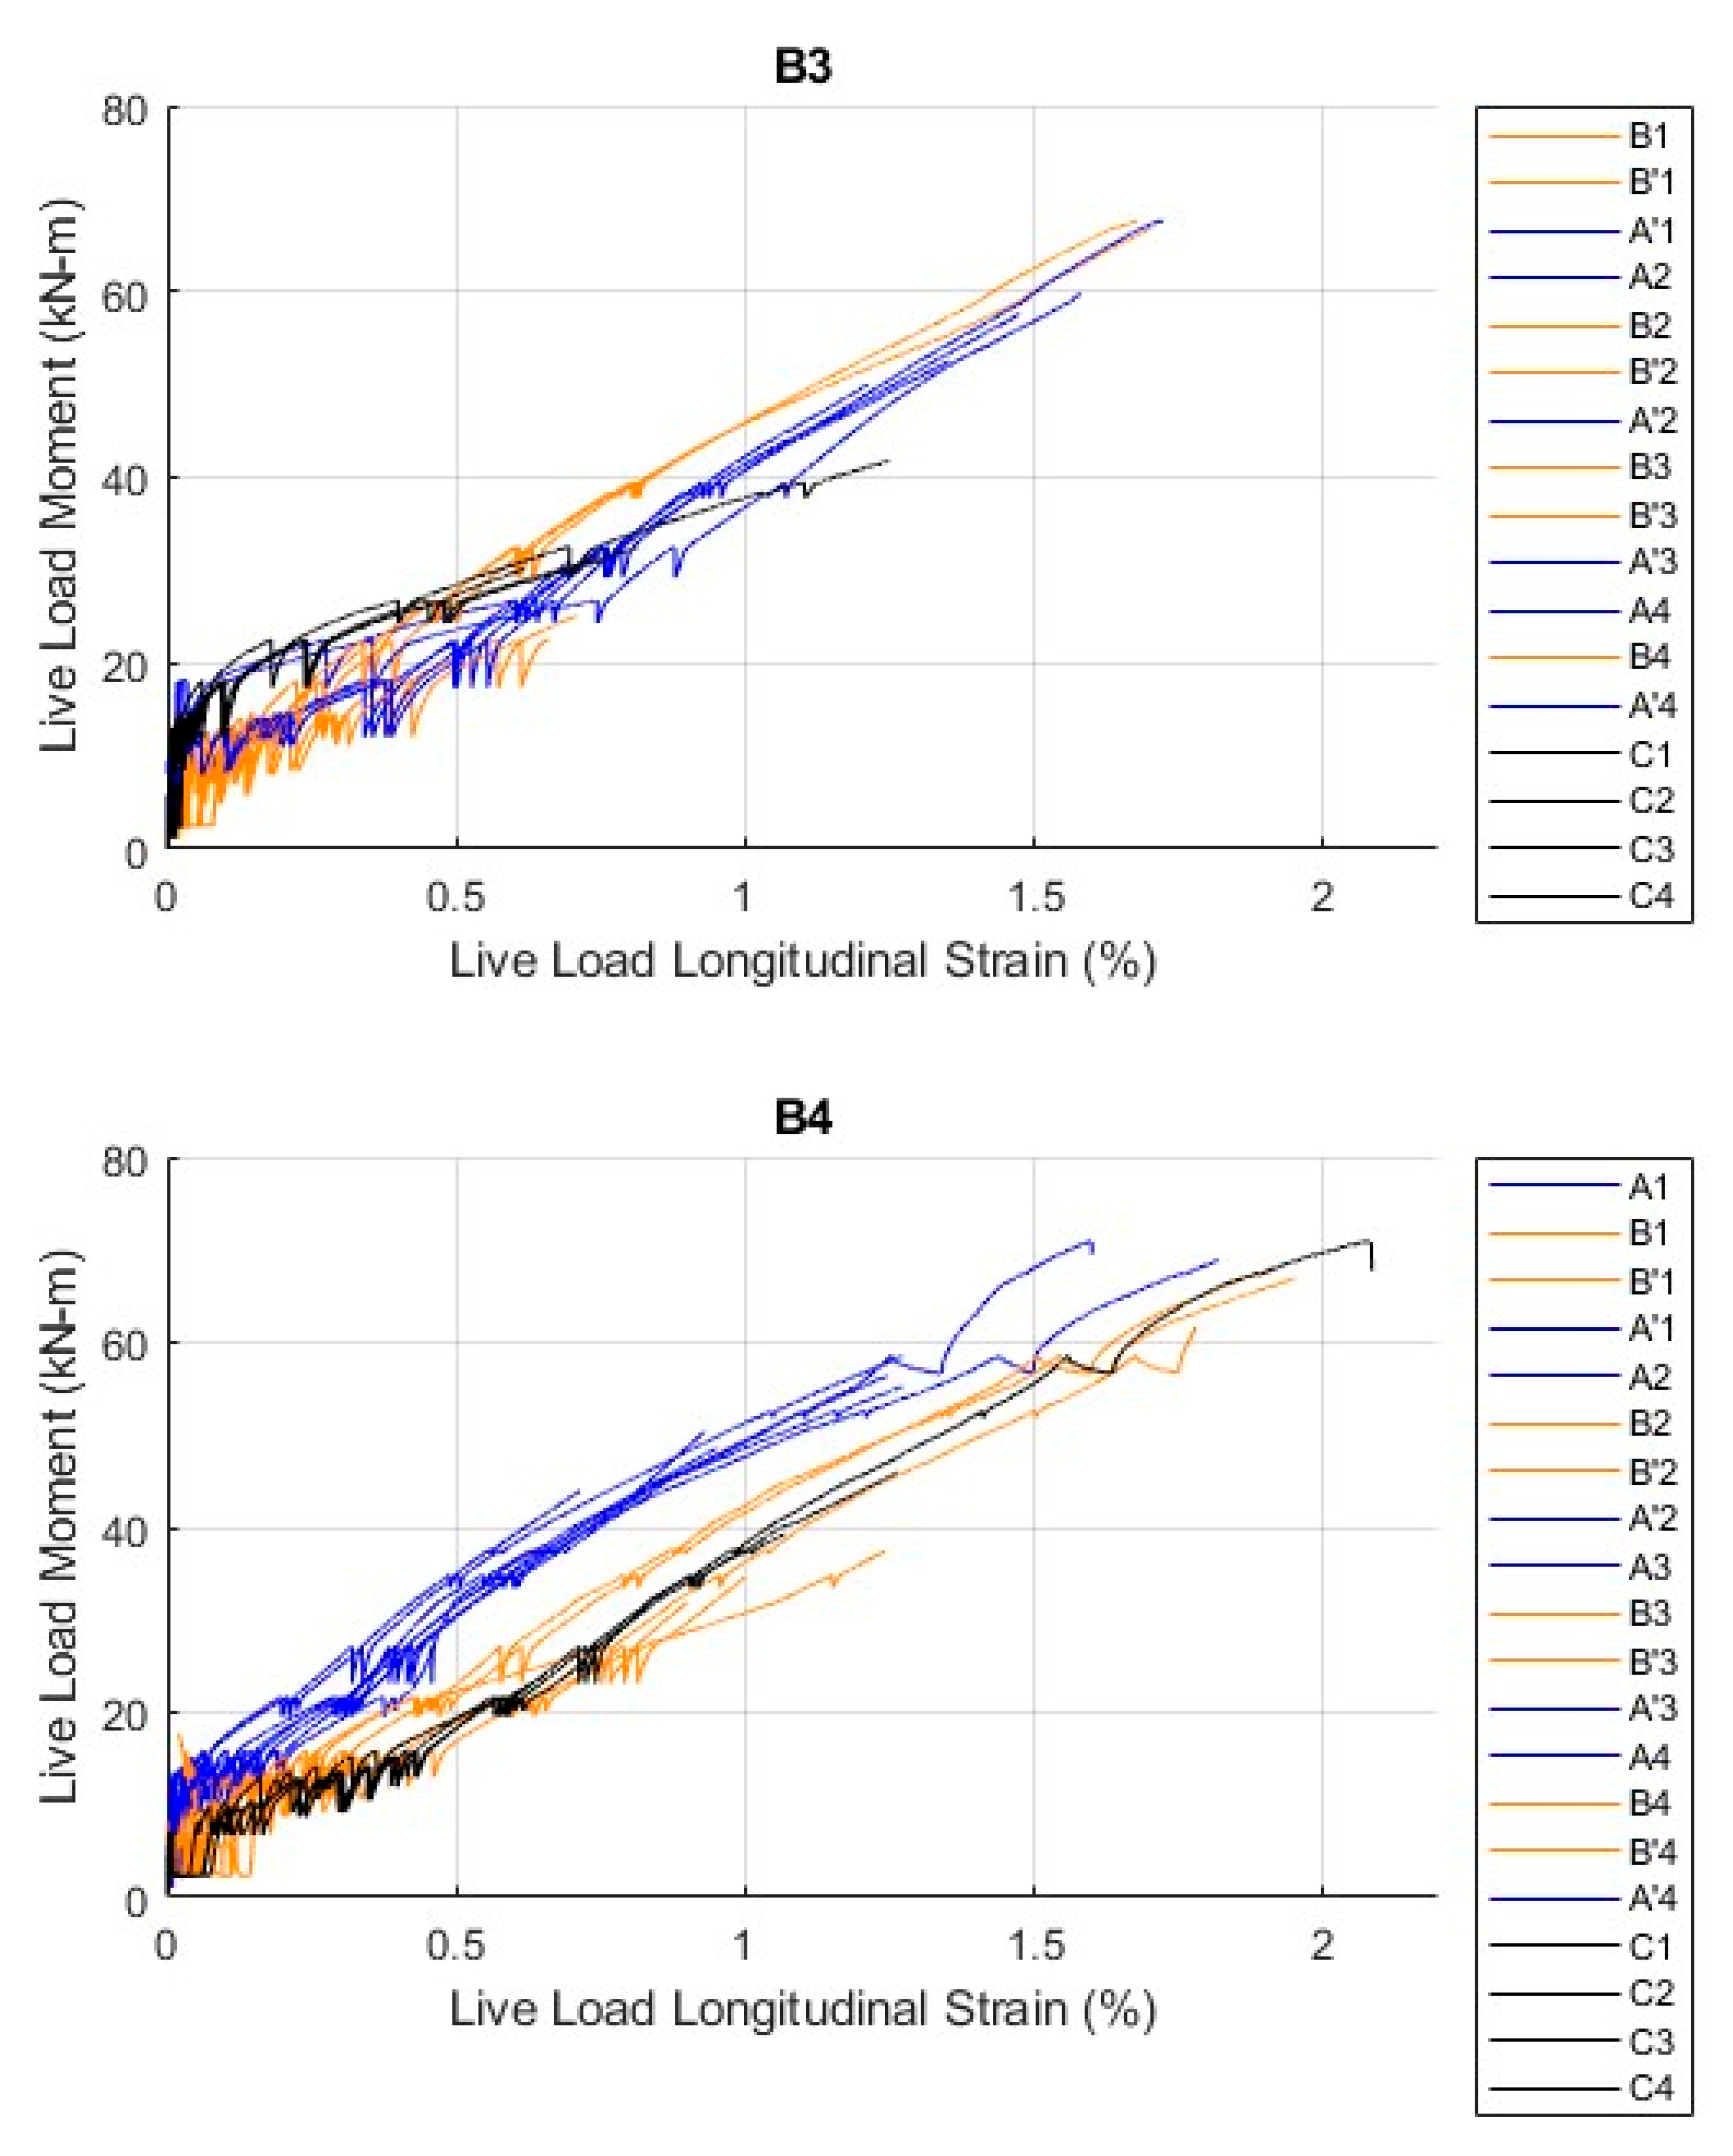
Figure 14 shows that B3 and B4 had several functional strain gauges active beyond the initial load ramps, with several recording until failure. One strain gauge in B4 reached a peak strain of around 2.11%, which corresponded with an internal stress of 510 MPa, only 12% below the 579 MPa tensile capacity of the bars determined from tensile testing. Initial vertical dips in the curves were a result of the load ramps, after which dips in the data were most likely a result of cracks forming in the beams. The strain data largely showed a highly linear live load moment–strain response until failure. The largest measured strains at a given load tended to be those at the beam’s centerline section C in B4, while B3’s centerline strains began behaving similarly between strains of 0.5% to 1%. Concurrently, both beams measured the lowest strains in the strain gauges located in sections A and A’, the furthest from the beams’ midspan. Overall, the measured strain responses of the beams tested matched the expected linear load–strain result, and peak strains occurring near the center of the beams tested indicated that the rebar was able to fully develop.
Prior to testing, a 50.8 mm spaced grid was drawn on the side of each beam within the region between the load heads. Crack characteristics, including point-to-point length, angle to the span axis, and spacing, were determined by approximating the start and end locations of cracks on this grid. These measurements were performed near failure for beams B2, B3, and B4, and post-failure for B1 using available pictures. A 25 mm accuracy for these measurements was assumed, achieved by locating points to the nearest grid or half-grid intersection. The average results for each beam are summarized in
Table 3. Generally, beams B1 and B2 exhibited fewer cracks within the region of interest but displayed longer individual crack lengths compared to beams B3 and B4. Across all tested beams, the observed cracks were predominantly flexural, appearing largely perpendicular to the beam’s span direction. Most cracks propagated linearly, although a limited number showed branching behavior between 100 to 150 mm from the top surface of the beam. In such cases, the larger branch of the crack was selected for the quantitative analysis presented in
Table 3.
During testing, precise crack width measurements were not taken. However, video footage of the gridded region was recorded during the final load ramp for beams B2, B3, and B4. A still frame within thirty seconds of failure was selected to extract the maximum width from each crack while the beam was under load. Using a web-based plot digitizer, a section of the grid local to each crack was used to determine the pixel scale, enabling crack width measurements. Due to variations in camera angles and lighting however, the measured values should be understood as approximate.
Figure 15 presents the video frame used for each beam and the corresponding measured crack widths for each beam. B4 had an average maximum crack width of 2.86 mm, B3 of 3.43 mm, and B2 of 5.10 mm. These results were consistent with the crack frequency and length findings. B2 had the lowest number of cracks, but the longest and the widest cracks, while B4 had the most cracks, but the smallest crack lengths and widths. In general, these width values were unacceptably large for serviceability requirements as they would allow chemical ingress and are unsightly. However, these measurements were from ultimate loads instead of service loads and therefore represent maximal crack widths instead of service load widths. The presence of a limited number of large cracks likely indicates the need for improved rebar-concrete bond stiffness and rebar modulus. These changes would ideally lead to more frequent, smaller cracks, improving the serviceability of beams made with the rebar.
8. Moment Curvature Analysis
Since a design code for concrete beams reinforced with thermoplastic rebar does not currently exist, the strengths of the beams were analyzed using AASHTO’s GFRP rebar design specification [
4]. This is reasonable because of the similar mechanical behavior of thermoset FRPs and thermoplastic FRPs and the fundamental force equilibrium and strain compatibility principles upon which the code provisions are based. To predict deflections, a nonlinear finite difference analysis was employed. This was done by iteratively assuming the curvatures (
) and solving for the neutral axis that satisfies force equilibrium (Equation (1)) and moment equilibrium (Equation (2)). Doing this required assuming that plane sections remained plane, and that there was a perfect bond between the rebar and concrete. The cross-section of the beam was discretized into
layers (1000 in the analysis), where the
j-th layer had a width
, height from the bottom layer
, and thickness t, and
was the stress of the concrete layer. The stress in the reinforcement was
, with an area
, and its centroid from the section bottom was
.
The moment curvature analysis relied on a Hognestad curve to simulate the compressive stress–strain response of the concrete [
43], and the concrete tensile stress–strain response was assumed to be linear with a modulus of rupture based on AASHTO specifications. The AASHTO-specified cracking stress of the concrete was reduced by 22.5% so that the model’s cracking moment agreed with the experimentally observed cracking moment. The FRP was treated as linearly elastic, with the elastic modulus and tensile strength set to the average values from tension testing described previously. The moment curvature analysis was used to derive the relationship between
and the internal bending moment
With
known at every point in the span from statics, this enabled the numerical solution of a boundary value problem for Equation (3) for vertical displacement
along the length of the beam:
The predicted moment capacity for specimens B1 and B2 with two primary reinforcing bars was 43.3 kN·m, and it was 86.6 kN·m for the specimens B3 and B4 with four primary reinforcing bars. Tensile reinforcement failure was predicted for both beam types using the measured concrete strength of the beams, with a corresponding max compressive strain of −0.0023 for all of the beams tested (this is below the typically assumed concrete crushing strain of −0.003), matching testing observations. The moment curvature model predicted nominal moment capacities of 44.5 kN·m and 87.9 kN·m for beams with two and four primary reinforcing members, respectively. Both AASHTO and the model showed very good agreement with the test results: AASHTO overpredicted strength by at most 3.3%, and the moment curvature model overpredicted strength by at most 4.8% as shown in
Table 4.
The displacement–force data for B3 and B4 as well as the model predictions are shown in
Figure 16. In addition to predicting reasonable nominal capacities, the displacements predicted by the numerical solution of Equation (3) were generally good, although the displacements were underpredicted at low moments and somewhat overpredicted at high moments.
To determine the service level behavior of the tested beams, a service load equal to 35% of the beam’s nominal moment capacity was assumed based on the available literature for concrete beams [
44,
45,
46]. This resulted in a service moment of 30.3 kN·m and corresponding actuator load of 15.9 kN for beams three and four, which had a corresponding average deflection of 40 mm. This was significantly higher than is allowed by a typical span over 360 deflection criteria, which equates to 16.9 mm under service loading. However, it was a direct consequence of the low tensile modulus of the rebar, 23,900 MPa, which was only 40% of the minimum required by ACI and AASHTO [
3,
4]. Re-running the model with increasing rebar modulus showed that meeting this deflection requirement would require an increase in the rebar modulus to 30,000 MPa, which was still only 50% of the minimum required. It is worth noting that some currently available unidirectional glass-reinforced tape material systems possess the elastic modulus required by the standards. For example, glass fiber polypropylene tape can be purchased with a tensile modulus of 60,000 MPa and glass fiber polyamide 12 tape can be purchased with a modulus of 63,000 MPa.
9. Conclusions
Properties such as formability and corrosion resistance make thermoplastic composites attractive for use in FRP rebar. This paper has demonstrated the feasibility of manufacturing thermoplastic rebar using the CFM, a novel manufacturing device capable of overcoming traditional challenges in thermoplastic pultrusion. The ease of bending the thermoplastic rebar to produce standard hooks and stirrups using simple devices and modest heat input was illustrated, and tension tests were conducted to determine the rebar’s elastic modulus and tensile strength. To illustrate its practical application, the thermoplastic FRP rebar was subsequently used to reinforce four flexural test specimens that were loaded to failure in four-point bending.
The results of strength testing concrete beams reinforced with thermoplastic rebar show good agreement with the beam capacities calculated using AASHTO and a flexural model based on fundamental beam mechanics. This good agreement demonstrated the efficacy of using existing structural analysis methods and assumptions to predict the strength of concrete beams reinforced with thermoplastic rebar. Deflections of the beam also showed reasonable agreement with the finite difference model. However, the beams did not meet service-load deflection requirements, which often controls designs using FRP rebar [
47,
48,
49,
50], where cracks and deflections tend to be larger than for beams reinforced with steel rebar [
47,
48,
50]. However, model predictions indicated that if the modulus of the rebar was increased to the current AASHTO and ACI minimum values, the beams could have met deflection limitations. This indicates that thermoplastic rebar fabricated using the CFM could be viable for future construction projects provided that higher-modulus tape feedstock is used. Research is currently underway to explore the use of higher-modulus feedstock made from several combinations of fiber and resin, as well as improved methods for producing surface deformations. Other important areas of research include quantifying bond and development length, as well as assessing the durability of thermoplastic rebar made with different polymers and fibers subjected to a range of environmental stressors.


 ,
, 


