1. Introduction
Polymers and polymer-based composites have sparked widespread interest over the years due to their unique and desirable properties, such as their ease of processing, their light weight, and their low cost [
1,
2]. These properties have pushed to replace many conventional materials in various applications, including medicine, aerospace, appliances, food processing and preservation, and many others [
3,
4]. Several research studies have been undertaken to change the characteristics of polymer composites using natural or synthetic components, such as fillers and fibers [
5,
6].
High-density polyethylene (HDPE) is a flexible and adaptable thermoplastic polymer produced from the ethylene monomer. HDPE has a remarkable strength-to-density ratio, making it robust, relative to its mass [
7]. HDPE is extensively used in the manufacturing of plastic bottles because of its exceptional durability [
8]. Furthermore, HDPE is very suitable for transporting water supply and sewage in industrial applications because of its outstanding resistance to corrosion and various solvents [
9]. In contrast to low-density polyethylene (LDPE), HDPE exhibits greater rigidity and opacity and can endure temperatures of around 120 °C for brief durations [
10,
11]. From an environmental standpoint, HDPE’s recyclability and reduced carbon footprint make it a sustainable option [
12].
Nowadays, most researchers combine polymeric materials with carbon or metallic nanomaterial additives to enable them to meet new demands from industry and to reduce costs [
13]. The selection of reinforcements in polymeric composites has shown itself to be significant for obtaining the required properties for specific designs, which explains why studying these reinforcements is important. Many researchers have paid great attention to the mechanical properties of polymeric composites [
14]. Nano-graphite particles (NGPs) are minuscule, planar graphene nanoplatelets that exhibit distinctive characteristics such as exceptional electrical and thermal conductivity, mechanical robustness, and a substantial surface area [
15]. Mingione, E. et al. [
16] investigated the thermal, electrical, and tribological performances of graphite nanoplatelets/Polyamide-12 composites produced by selective laser sintering. The findings of the study indicated that an increase in the dispersion of GnPs particles within the matrix resulted in a hydrophobic surface behavior. Moreover, significant enhancements were observed in electrical conductivity (10-7) and thermal performance (33.6%). Tribological tests showed a 25% decrease in the friction coefficient and an 80% improvement in wear resistance, compared to the PA-12 matrix.
Using NGPs in bottle production may significantly strengthen plastic bottles’ barrier characteristics, increasing their resistance to gas and moisture [
17]. This, in turn, aids in preserving the freshness and shelf-life of drinks. Furthermore, NGPs enhance the mechanical robustness and longevity of bottles, decreasing breakage and improving the overall quality [
18]. Furthermore, their high thermal conductivity facilitates the use of more effective manufacturing techniques, hence possibly reducing both production expenses and energy consumption [
16,
19].
On other hand, in relation to graphite as a filler material for polymer composites, there was a significant reduction in the tensile strengths of different polymer composites such as PPE [
20], EVA [
21], PMMA [
22], HDPE [
23], and PLA [
24], especially at 4 wt.% of graphite and higher. Also, those studies revealed that the mechanical behavior of the graphite/polymer composite depends on the interaction, the distribution, the size, and the orientation of the graphite [
25].
Combining HDPE with nano-graphite particles (NGPs) in polymer manufacturing brings notable benefits. HDPE is favored for its strength, durability, and chemical resistance, making it ideal for plastic containers. When NGPs are added to HDPE, the composite gains the unique advantages of NGPs, including high electrical and thermal conductivities, mechanical strength, and a large surface area [
26]. This combination improves the bottles’ barrier properties, enhancing their resistance to gas and moisture, which is essential for preserving beverages’ freshness and shelf-life. Additionally, the mechanical strength and durability of the bottles are increased, reducing breakage and improving overall quality [
27]. The thermal conductivity of NGPs also supports more efficient manufacturing processes, potentially lowering production costs and energy usage. Overall, the HDPE–NGP composite marks a significant advancement in bottle manufacturing, offering enhanced performance and sustainability [
28].
The market for bottles of HDPE and composites is experiencing significant growth. In 2023, the global HDPE bottle market was valued at approximately USD 53 billion and is projected to reach USD 74.7 billion by 2033, growing at a compound annual growth rate (CAGR) of 3.5% [
18,
29]. The broader HDPE market, which includes various applications beyond bottles, was valued at USD 91.73 billion in 2022 and is expected to grow to USD 145.5 billion by 2027, with a CAGR of 9.6%. This growth is driven by increasing demand for sustainable packaging solutions, HDPE’s versatility in various consumer goods, and the rising e-commerce sector, which benefits from HDPE’s durability and resistance to damage during transit [
30].
This study aims to evaluate the impacts of different NGP loadings on the thermal, mechanical, and tensile properties of HDPE. By conducting a series of differential scanning calorimetry (DSC) analyses, mechanical property evaluations, and tensile tests, we seek to identify the optimal NGP concentrations that maximize the performance of HDPE composites. The findings from this research will provide valuable insights into the development of advanced HDPE composites with enhanced properties, particularly for applications in the bottling industry, where improved material performance can lead to lighter, stronger, and more efficient packaging solutions.
3. Results and Discussion
3.1. Melt Flow Index (MFI)
It was observed that melt inclusion (MI) and density increased with the increase in the loading of NGP percentage into HDPE.
Table 3 shows the melt inclusion (MI) at 190 °C per 5.0 g per 10 min, equal to 0.48 in the control sample, and it increased to 0.5, 0.51, and 0.55 at 1%, 3%, and 5% NGP, respectively, due to the higher density of the NGP. In sample five, the HDPE with 7% NGP exhibited a decrease in melt inclusion (MI) at both 5 and 21.6 g/10 min as follows: 0.53 and 10.45, respectively. In addition, the bulk density of sample one, where the HDPE was in its pure condition, was equal to 0.5012 g/cc. It was observed that adding NGP to the HDPE increased the bulk density as follows: 0.5519, 0.05521, 0.5540, and 0.5578 for samples 2, 3, 4, and 5, respectively. Moreover, the data clearly showed the relationship between the percentage of NGP added to the HDPE and the increase in oxidative induction time (OIT); for instance, in sample one, where no NGP was added, the oxidative induction time (OIT) value was 16.5 and increased to 17.1 and 17.3 in samples two and three, where the addition percentages of the NGP were 1% and 3%, respectively.
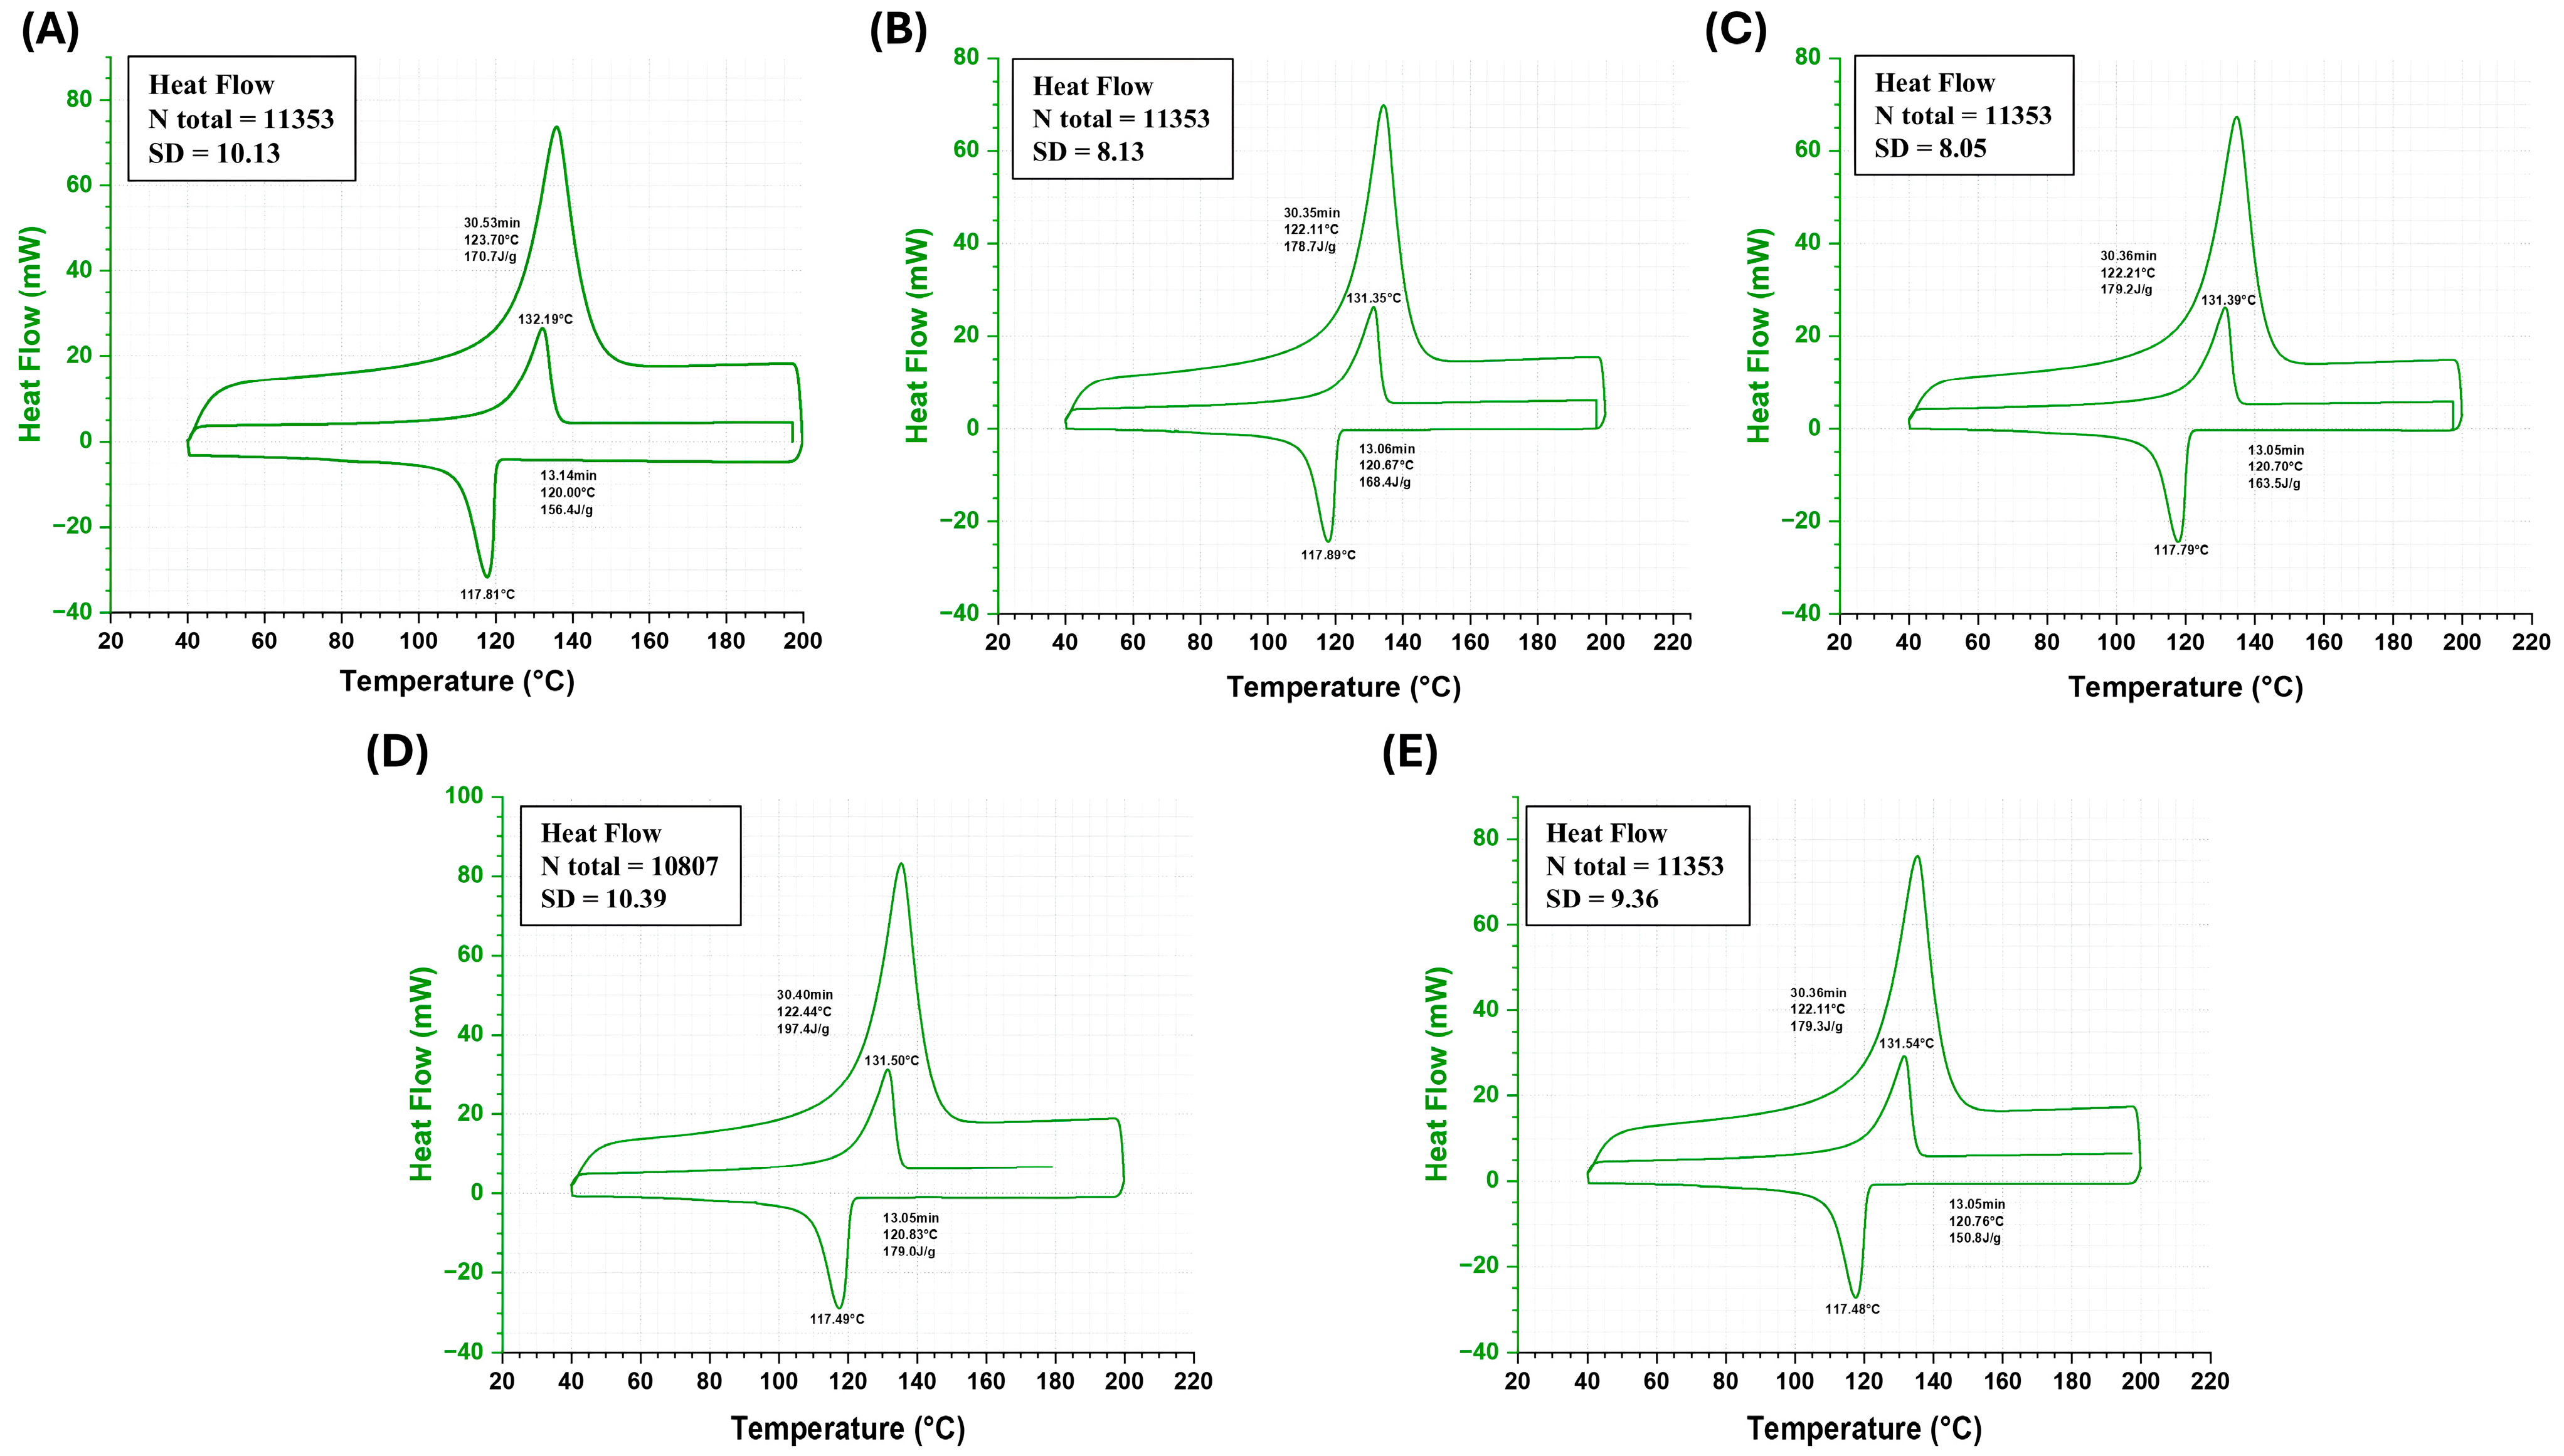
3.2. Differential Scanning Calorimetry (DSC)
The differential scanning calorimetry (DSC) curves for high-density polyethylene (HDPE) with varying percentages of nano-graphene particles (NGP) revealed significant insights into the thermal behavior of the material.
The findings of the DSC analysis of the pure HDPE and HDPE composites are shown in
Figure 2. As a result of the different composite percentages, it was noticed that there was only one melting peak and one crystallization peak during the heating curve and the cooling curve, respectively. In light of these findings, it was determined that the formation of crystals in the composite system was quite simple and that no new forms of crystals presented themselves.
Table 4 provides characteristic data of HDPE–NGP composites in melting and crystal curves, such as the melting temperature (Tm), the heat of fusion (ΔHf), the crystallization temperature (Tc), and the crystallization enthalpy (ΔHc), respectively.
The temperature in sample one, as a pure HDPE, equaled 132.19 °C and was reduced to 131.35 °C when 1% of NGP was added in sample two. Also, it is clearly shown that the Tm increased as the percentage of NGP increased in the HDPE from sample two to sample five, respectively. The ΔHf increased as the NGP percentage increased, with the lowest value found in sample one equal to 170.7 (j/g) and the highest value achieved in sample four equal to 197.4 (j/g); this was mainly attributed to the dilution effect of the NGP powder within the HDPE matrix, which affected the melting of the HDPE [
31]. Furthermore, the crystallization temperature (Tc) was almost the same in all samples, with a slight variation. The highest value was 117.89 in sample one, and the lowest was 117.48 in sample five. In addition, the crystallization enthalpy (ΔHc) increased slightly with the increase in the NGP percentage in the HDPE composite, except in samples three and five, where the ΔHc dropped to 163.5 and 150.8 (j/g), respectively. This indicates that the addition of NGP enhanced the thermal stability and crystallization behavior of HDPE, making it more resistant to thermal degradation and improving its overall thermal performance.
3.3. Rheology Properties
Figure 3 presents the rheology of pure HDPE and the composite at different percentages, also illustrating the effect of composite content on zero-shear viscosity. It was noted that the filler loading was observed to have more impact on the shear viscosity, as shown in sample one, which was pure HDPE with a value of 100,400 Pa·s, which dropped to 45,346 Pa·s in sample two, where NGP 1% was added, and increased to 46,700,47,320, and 48,270 Pa·s in samples three, four, and five, respectively. This trend suggests that small amounts of NGP reduce viscosity, possibly due to improved dispersion and lubrication effects. However, higher concentrations may lead to increased viscosity due to particle–particle interactions and agglomeration.
Moreover, in the molecular weight scenario, as demonstrated in
Figure 3B, the pure HDPE had the highest molecular weight at 1,503,000 g/mol. It decreased to 1,195,000 g/mol when 1% NGP was added to HDPE and sharply dropped to 120,000 g/mol in sample three. Then, when the NGP content increased to 5% and 7%, it increased to 1,205,000 and 1,212,000 g/mol, respectively. This indicates that the presence of NGP initially causes chain scission or degradation, reducing the molecular weight. However, at higher concentrations, the NGP may act as a nucleating agent, promoting polymerization and increasing the molecular weight.
In addition,
Figure 3C illustrates the impact of NGP percentage content on HDPE cross modules (G’). In sample one, where no NGP was added, the G’ value was 18,980 Pa and increased to 22,810, 24,350, 25,320, and 26,170 Pa when the NGP percentage content increased to 1%, 3%, 5%, and 7% in HDPE, respectively. This increase in G’ indicates that the material becomes stiffer and more rigid with the addition of NGP, likely due to the reinforcing effect of the graphene platelets, which enhanced the mechanical properties of the polymer matrix.
In contrast, the polydispersity index peak was observed in the pure HPDE sample with a value of 5.27 and started to decline when NGP content was added to 1% NGP; the PDI value decreased to 4.38, 4.11, 3.95, and 3.82 at 3%, 5%, and 7% NGP, respectively. A lower PDI indicates a more uniform molecular weight distribution, suggesting that the addition of NGP leads to a more homogeneous polymer structure, possibly due to the nucleating effect of the graphene particles, which promotes uniform polymerization.
3.4. Bottle Weight and Wall Thickness
The impact of loading different percentages of nano-graphene particles (NGP) in high-density polyethylene (HDPE) on bottle weight is illustrated in
Figure 4. The data showed a clear trend of decreasing bottle weight and wall thicknesses of manufactured bottles with increasing NGP content as shown in
Table 5. At 0% NGP, the bottle weight was approximately 34.3 g. As the NGP content increased to 1%, the bottle weight decreased to around 32.1 g. This trend continued with 3% NGP, where the weight further reduced to about 29.6 g. At 5% NGP, the bottle weight dropped to approximately 26.2 g, and the lowest weight was observed at 7% NGP, where the bottle weighed around 24.1 g.
This reduction in bottle weight with increasing NGP content can be attributed to the reinforcing effect of NGP on the HDPE matrix. The addition of NGP enhanced the mechanical properties of HDPE, allowing for the use of less material while maintaining or even improving the strength and durability of the bottles. NGPs likely enhanced the load-bearing capacity and stiffness of the HDPE, contributing to overall weight reduction. This is particularly beneficial for applications where weight reduction is crucial, such as in packaging and transportation, leading to cost savings and increased efficiency.
Furthermore, the incorporation of NGP into HDPE yielded lighter bottles, with the most significant weight reduction observed at a 7% NGP content. This finding highlights the potential of NGP to enhance the performance of HDPE for various applications. The ability to reduce material usage while maintaining or improving mechanical properties can lead to more sustainable and cost-effective solutions in the production of HDPE-based products. Further research could investigate the optimal loading of NGP to strike a balance between weight reduction and other desirable properties, such as impact resistance and thermal stability.
3.5. Top Load Test
Figure 5 illustrates the effect of loading different percentages of nano-graphene platelets (NGP) in high-density polyethylene (HDPE) on the crushing yield load, measured in Newtons (N). The x-axis represents the weight percentage of NGP, ranging from 0% to 7%, while the y-axis shows the crushing yield load, ranging from 550 to 630 N. The data points indicate that at 0% NGP, the crushing yield load was approximately 620 N. As the percentage of NGP increased to 1%, there was a slight increase in the crushing yield load to around 622 N. However, further increasing the NGP content resulted in a significant decrease in the crushing yield load; at 3% and beyond, there was a notable drop, with values being around 570 N at 3% and slightly lower at around 567 N at 5%. The lowest value observed was approximately 551 N at an addition of about 7% NGP.
The initial slight increase in the crushing yield load at 1% NGP suggests that small additions of NGP can enhance the mechanical strength of HDPE. This improvement can be attributed to the reinforcing effect of well-dispersed NGP within the polymer matrix, which enhanced the material’s load-bearing capacity. However, as the NGP content increased beyond 1%, the crushing yield load decreased significantly. This reduction in mechanical strength at higher NGP concentrations may be attributed to the agglomeration or poor dispersion of nanoparticles within the HDPE matrix, resulting in defects and weak points that compromise the material’s structural integrity under compressive loads.
In summary, incorporating up to 1% NGP into HDPE can slightly improve its compressive strength properties, as indicated by the higher crushing yield load. However, higher concentrations of NGP lead to diminishing returns and even detrimental effects on the material’s performance under compression tests. The significant decrease in crushing yield load beyond 1% NGP highlights the importance of optimizing the dispersion and concentration of NGP to achieve the desired mechanical properties. These findings underscore the need for careful consideration of NGP loading levels to balance the benefits of reinforcement with the potential drawbacks of nanoparticle agglomeration.
3.6. Flexural Testing
Figure 6 illustrates the impact of loading different percentages of nano-graphene platelets (NGP) in high-density polyethylene (HDPE) on the flexural modulus, measured in megapascals (MPa). The data points indicate that the flexural modulus of HDPE initially decreased slightly from 971 MPa at 0% NGP to 960 MPa at 1% NGP. However, as the NGP content increased to 3%, the flexural modulus rose to 980 MPa, indicating an improvement in the material’s stiffness. Beyond this point, the flexural modulus decreased again, reaching 967 MPa at 5% NGP and further dropping to 942 MPa at 7% NGP.
The initial decrease in the flexural modulus at 1% NGP suggests that small additions of NGP may not significantly enhance the stiffness of HDPE. However, the increase observed at 3% NGP indicates that this concentration provides an optimal reinforcement effect, improving the material’s rigidity. The subsequent decrease in the flexural modulus at higher NGP concentrations (5% and 7%) may be attributed to the agglomeration or poor dispersion of the nanoparticles within the HDPE matrix. This poor dispersion can lead to a reduction in the reinforcing effect and potentially introduce defects that compromise the material’s mechanical properties.
In summary, the data suggest that the optimal loading of NGP for enhancing the flexural modulus of HDPE is around 3%. At this concentration, the material exhibits the highest stiffness, which can be beneficial for applications requiring improved rigidity. However, higher concentrations of NGP may lead to diminishing returns and even detrimental effects on the flexural properties of HDPE. These findings highlight the importance of optimizing NGP dispersion and concentration to achieve the desired mechanical performance in HDPE composites. Further research could explore methods to enhance nanoparticle dispersion and investigate the impacts of various types of graphene-based fillers on the mechanical properties of HDPE.
3.7. Tensile Properties
Figure 7 presents the impacts of loading different percentages of (NGP) in high-density polyethylene (HDPE) on various tensile properties. The data revealed that the tensile strength (
Figure 7A) initially decreased from 26.4 MPa at 0 wt.% NGP to a minimum of 23.5 MPa at around 1 wt.% NGP. However, as the NGP content increased, the tensile strength gradually improved, reaching approximately 24.3 MPa at 7 wt.% NGP. This trend suggests that small additions of NGP may initially weaken the HDPE matrix, possibly due to poor dispersion or agglomeration, but higher concentrations lead to better reinforcement and improved tensile strength.
In terms of tensile elongation (
Figure 7B), the data showed a decrease from about 19.5% at 0 wt.% NGP to a minimum of around 18.2% at approximately 1 wt.% NGP. However, as the NGP content increased further, the tensile elongation significantly improved, peaking at about 20.8% around 6–7 wt.% NGP. This indicates that while small amounts of NGP may reduce the ductility of HDPE, higher concentrations enhance the material’s ability to elongate under tensile stress, likely due to the better interaction and dispersion of NGP within the polymer matrix.
The tensile strength at break (
Figure 7C) followed a similar trend to the tensile strength, initially decreasing from approximately 26.9 MPa at 0 wt.% NGP to a minimum value of around 23.7 MPa at 1 wt.% NGP. It then increased, reaching approximately 27 MPa at higher NGP percentages. The tensile strength break percentage (
Figure 7D) started high, near approximately 788%, dropped to a low point near roughly 745–750%, and then rose again, peaking close to 775–780%, before slightly decreasing again towards the end. These trends suggest that while small additions of NGP may initially weaken the HDPE, higher concentrations improve both the tensile strength and elongation at break, indicating enhanced mechanical properties and better overall performance of the composite material.
4. Conclusions
In conclusion, the findings in this study provide a comprehensive understanding of the impacts of loading different percentages of nano-graphene particles (NGP) in high-density polyethylene (HDPE) on its thermal, mechanical, and structural properties. The differential scanning calorimetry (DSC) curves indicated that the addition of NGP enhanced the thermal stability and crystallization behavior of HDPE, with the most significant improvement observed at a 5% NGP concentration. Beyond this concentration, the thermal properties did not show further enhancement, suggesting an optimal loading level for thermal performance.
The mechanical properties, as illustrated by the zero-shear viscosity, molecular weight, cross modulus, and polydispersity index, revealed that small additions of NGP can initially reduce viscosity and molecular weight, likely due to chain scission or degradation. However, higher concentrations improved the mechanical strength and rigidity of HDPE, with the cross modulus showing a significant increase. Optimal mechanical performance was observed at around 3% NGP, where the material exhibited the highest flexural modulus, indicating enhanced stiffness.
The tensile properties, including tensile strength, tensile elongation, and tensile strength at break, demonstrated that small additions of NGP may initially weaken the HDPE matrix. However, higher concentrations led to improved tensile properties, with the most significant enhancements observed at a 7% NGP concentration. This suggests that while small amounts of NGP may reduce ductility, higher concentrations enhance the material’s ability to withstand tensile stress and elongation, indicating better overall performance.
Finally, the incorporation of NGP into HDPE significantly enhanced its thermal, mechanical, and tensile properties, with optimal performance observed at specific loading levels. The findings highlight the importance of optimizing NGP dispersion and concentration to achieve the desired balance of properties for various applications. These results highlight the potential of NGP to enhance the performance of HDPE composites, making them suitable for a broad range of industrial and commercial applications. Further research is recommended to explore methods for improving nanoparticle dispersion and to investigate the effects of varying graphene-based filler concentrations on the properties of HDPE.


