Article

Performance Optimization of SBR-Modified Pervious Composite Incorporating Recycled Concrete Aggregates

1
Department of Civil and Environmental Engineering, University of Balamand, El Kourah P.O. Box 100, Lebanon
2
Department of Civil and Environmental Engineering, United Arab Emirates University, Al Ain P.O. Box 15551, United Arab Emirates
*
Author to whom correspondence should be addressed.
J. Compos. Sci. 2025, 9(7), 372; https://doi.org/10.3390/jcs9070372
Submission received: 31 May 2025 / Revised: 2 July 2025 / Accepted: 14 July 2025 / Published: 16 July 2025
(This article belongs to the Special Issue Novel Cement and Concrete Materials)

Abstract

This study aimed to optimize the performance of pervious concrete (PC) while promoting sustainability using recycled concrete aggregates (RCAs), styrene butadiene rubber (SBR) waste, and silica fume (SF). The mixtures were developed using the Taguchi approach with four mix design factors, each at three levels: the water-to-binder ratio (w/b), RCA replacement percentage by weight of natural aggregates, the cement substitution rate with SF, and the SBR addition rate by binder mass. Thus, a total of nine mixes were prepared and tested for density, porosity, permeability, compressive strength, splitting tensile strength, abrasion resistance, and resistance to freezing and thawing. The results revealed that incorporating RCA and SBR decreased density and compressive strength but increased porosity and permeability. The performance of PC enhanced with SF addition and reduced w/b. TOPSIS was then employed to find the optimum mixture design proportions by considering multiple performance criteria. The results indicated that a high-performing sustainable PC mixture, with enhanced strength and durability characteristics, was formulated with a w/b ratio of 0.30, 25% RCA, 5% SF replacement, and 4% SBR addition.

1. Introduction

In recent decades, the surging demand for concrete has driven a remarkable rise in the production of natural aggregates, which constitute nearly three-quarters of the mass of a typical concrete mix [1,2]. In fact, one of the major challenges in the construction industry is to minimize the excessive consumption of finite natural resources while maintaining steady concrete production. In response, there has been a notable shift towards recycling demolition and construction waste [3,4]. This practice not only alleviates landfill pressures but also helps conserve valuable natural resources and promotes the adoption of environmentally friendly construction methods.
The substitution of natural aggregates with waste materials like coarse recycled concrete aggregates (RCAs) in cement-based composite production is widely discussed in the literature [5,6,7]. Numerous investigations have examined the influence of substituting conventional aggregates with RCAs on the fresh and hardened properties of cement-based composites [8,9]. The performance of concrete containing RCAs is typically found to be lower than that made with natural aggregates, mainly due to the inferior physical properties of RCAs and the weaker bond between the paste and aggregates [10]. Despite these challenges, the use of RCAs sourced from demolition and construction waste presents an eco-friendlier option compared to natural aggregates. This approach not only supports the reduction in waste and conservation of natural resources but also aligns with sustainable construction practices by providing a viable substitute to natural aggregates [5,11]. For instance, Alzard et al. reported that integrating RCAs into concrete mixes led to a 29% cost reduction and a 37% decrease in global warming potential [12]. This suggests that RCAs not only contribute to environmental sustainability by lowering greenhouse gas emissions but also offers economic benefits, making them a cost-effective alternative to traditional aggregates [12]. Lu et al. explored a sustainable concrete mix by incorporating crushed waste glass from post-consumer beverage bottles as a replacement for fine aggregates and using RCAs instead of natural granite for coarse aggregates [13]. The study found that the use of crushed waste glass led to a 28% reduction in compressive strength. Liu et al. optimized the distribution of cement paste around RCAs by focusing them on the aggregate joints through saline polymer treatment. This technique achieved an improvement in compressive strength ranging from 32% to 114% while maintaining consistent permeability [14]. Veriana et al. reported that transporting RCAs requires less energy and fuel compared to natural aggregates, largely because RCAs have a lower unit weight. As such, using RCA-based concrete not only proves to be economically advantageous but also underscores their eco-friendly attributes, supporting the construction sector commitment to sustainability [15].
Frequently used in roadways, parking areas, and rooftop applications, concrete pavements contribute to increased stormwater runoff and pollutant discharge relative to other types of land [16,17]. Addressing these adverse effects requires the implementation of more sustainable solutions. Pervious concrete (PC) has been recognized as an efficient pavement material because of its advantageous features relative to conventional cement-based composite. The characteristics of PC include a density from 1600 to 2000 kg/m3, a compressive strength ranging from 3.5 to 28 MPa, a permeability ranging from 1.3 to 12.2 mm/s, and porosity varying between 10 and 35% [2,10,18]. The production of PC material usually aims for discontinuous aggregate grading, with limited or no fine aggregates. It mainly includes Portland cement, supplementary cementitious materials, coarse aggregates, admixtures, fibers, and water [18,19].

2. Context and Paper Objectives

The demand for permeable pavements has been increasing in cities around the globe. PC has been employed in Europe to resolve problems such as wet weather splashing and road noise reduction [20,21]. Similarly, in China, PC was incorporated into the sponge city initiative to alleviate the growing problem of overburdened drainage systems and urban flooding [22,23]. Indeed, as this pavement technology gains popularity, scientists have ramped up their efforts in multiple fields to tackle its critical deficiencies in strength and durability. Additionally, the porous nature of permeable pavements facilitates water infiltration through the surface and helps slow down runoff during heavy rain. Beyond supporting groundwater recharge and effective water drainage, PC also contributes to noise reduction and enhances thermal comfort [24,25].
To lessen its environmental footprint, different waste materials have been used as replacements for cement and aggregates in concrete [26,27,28]. The incorporation of supplementary cementitious materials such as metakaolin, silica fume (SF), and others has been widely documented in the literature to significantly enhance the overall performance of PC. These materials contribute to improvements in various properties, including strength, durability, and resistance to environmental factors. For instance, SF has been found to substantially enhance the mechanical properties of conventional concrete, owing to either the development of a denser interfacial transition zone (ITZ) or the reinforcement of the cement paste matrix [29,30]. Yang and Jiang reported that PC incorporating 6% SF reached a maximum compressive strength of 35 MPa, which is 157% higher than that of the control [31]. Chen et al. carried out another study in which twelve different PC mixes were analyzed, differing in cement proportions (0.80, 0.76, 0.72, and 1), SF levels (0.06, 0.08, 0.01), and water-to-cement ratios between 0.28 and 0.34. The mixes achieved a compressive strength of over 38.5 MPa at 90 days and a flexural strength above 5.1 MPa [32]. Bilal et al. showed that SF with fiber-reinforced PC exhibited the lowest mass loss based on abrasion durability performance criteria [33]. In addition, Liu et al. found that the most effective combination involved 5% SF, 0.5% superplasticizer, and a water-to-cement ratio of 0.26 to 0.3 [34]. It is important to recognize that using over 10% SF as a replacement for cement caused a decrease in strength [35]. Despite current findings, the appropriate dosage in pervious concrete has yet to be determined and demands more in-depth study under varying conditions.
Styrene butadiene rubber (SBR) is a commonly used polymer in the construction sector, particularly for enhancing selected hardened properties including abrasion, chemical exposure and resistance to freeze–thaw cycles of cement-based composites [36,37,38]. The SBR also creates a protective layer around aggregate particles, which boosts strength and minimizes surface degradation. In the context of PC, previous studies indicated that SBR significantly improved its flexural strength. The addition of SBR polymer enhanced the mechanical characteristics by connecting microcracks and improving the bond interface between aggregates and cement paste in PC [39,40,41]. Indeed, adding SBR to PC improved its compact ability, making it easier to achieve the desired void content with less energy [42]. It is important to mention that numerous highways in Europe have been built with overlays of latex-modified PC, which improved drainage and reduced tire noise [43]. Nevertheless, the combined use of SBR, SF, and RCA in PC still requires further investigation.
Securing optimal performance in PC involves a complex process with significant trial-and-error experimenting to assess the influence of different mix design factors parameters. For sustainable development, the Taguchi method offers a holistic approach to analyzing the influence of different mix design factors on the performance of the product. It systematically and efficiently optimizes experiments using orthogonal arrays, thereby decreasing the number of experiments needed to produce significant outcomes [44]. Indeed, the Taguchi technique has proven successful in establishing performance standards and limiting the number of samples, but it lacks the ability to consider multiple criteria simultaneously [45,46]. As a result, multi-response optimization approaches, like the technique for order of preference by similarity to the ideal solution (TOPSIS), have successfully identified optimal design conditions for engineering materials, by minimizing testing costs and time while taking into account multiple operational criteria.
Limited studies have addressed the impact of different mix design factors on the mechanical, durability, and hydraulic characteristics of PC incorporating RCA, SF, and SBR. Accordingly, this work aims to evaluate the effect of varying water-to-binder ratio (w/b), SF replacement level of binder, RCA substitution rate of natural aggregates, and SBR addition rates by mass on the performance of PC. The mixtures were designed using the Taguchi method, incorporating four mix design parameters at three levels: w/b, percentage of RCA replacement by weight of natural aggregate, percentage of cement replacement with SF, and the addition rate of SBR by mass of binder. The testing methods included evaluations of hardened density, porosity, compressive strength, splitting tensile strength, permeability, abrasion resistance, and resistance to freezing and thawing. The TOPSIS was used to optimize the mix proportions based on multiple performance criteria. This data could be especially beneficial to engineers and contractors aiming to produce sustainable PC with enhanced performance.

3. Experimental Program

3.1. Materials

The binding materials in this study featured Ordinary Portland Cement Type I manufactured by Holcim-Lebanon, conforming to ASTM C150 [47]. It had a specific gravity, a median particle size, and a Blaine surface area of 3.03, 21.2 µm, and 3750 cm2/g, respectively. In addition, SF that meets the specifications of ASTM C1240 [48] was utilized from commercial sources. The natural aggregates were continuously graded crushed limestone with a specific gravity of 2.72, absorption of 0.61%, fineness modulus of 6.71, and 0.42% material finer than 75 μm. The RCA, obtained by crushing and grading returned concrete from a ready-mixed batching plant, had a specific gravity of 2.41, absorption of 7.04%, fineness modulus of 6.8, and 1.04% material finer than 75 μm. Natural aggregates consisted of crushed limestone gravel (4.75–12.5 mm), with sieve passing percentages of 14.5%, 68.6%, and 94.1% for 4.75 mm, 9.5 mm, and 12.5 mm, respectively. RCAs were crushed, sieved, and graded to closely match the gradation of the natural aggregates, all in compliance with ASTM C33 [49].
A naphthalene-based high-range water reducer (HRWR) provided by Sodamco-Lebanon, adhering to ASTM C494 [50] Type F, was employed in the mix. It had a solid content of 39% and a specific gravity of 1.2. The SBR latex used herein was a carboxylate dispersion containing 60% styrene butadiene and stabilized in an aqueous medium with an anionic emulsifying system. The pH, solid content, and specific gravity of the SBR were 8.5, 52%, and 1.05, respectively. It is worth noting that the SBR used was provided by the supplier as waste material, with the understanding that it had expired and was no longer suitable for commercial use.

3.2. Mixture Proportioning and Batching

The mix design of pervious concrete followed the guidelines outlined in ACI 522R-10 [18]. Using the Taguchi method, the PC mixtures were designed with orthogonal arrays that have predetermined levels to reduce experimental variance and sample numbers. This study utilized an orthogonal array comprising four factors, each represented at three different levels, as indicated in Table 1. Therefore, a total of 9 mixtures were developed with varying levels of the w/b ratio (0.35, 0.30, and 0.25), an RCA replacement rate of natural aggregates by mass (0, 25, and 50%), an SF replacement rate of cement by mass (2.5, 5, and 7.5 kg/m3), and an SBR addition percentage of binder by mass (4%, 8%, and 12%). It is important to note that the upper limits for RCAs and SBR were set at 50% and 12%, respectively, as higher levels of these parameters significantly affect the mechanical performance of cement-based composites [37,38]. The levels of w/b content and SBR content utilized herein were determined based on published codes and past studies [18,37]. While the w/b ratio in PC was decreased from 0.35 to 0.25, the SF was added at different rates to offset the drop in compressive strength caused by the inclusion of RCAs and SBR latex [37,51]. The cement content ranged from 463.5 to 487.5 kg/m3 depending on the SF replacement rate [10].
Table 2 summarizes the proportions of the evaluated PC mixtures. The mixtures are designated as rA-sB-tC-vD, where r represents the w/b ratio, s is the RCA replacement by mass of natural aggregates (%), t is the SF replacement rate of cement, and v is the SBR addition rate as a percentage of cement mass. For example, mix 2 (0.35B-25R-5.0F-8S) signifies a PC mix with a w/b ratio of 0.35, an RCA replacement rate of 25%, an SF replacement rate of 5%, and an SBR addition rate of 8%. The HRWR dosage varied from 0.2% or 1.6% of binder mass, to secure a zero slump adequate for PC [52].
The concrete was batched in a 50 L open-pan mixer. Initially, the saturated surface dry (SSD) aggregates were combined with about 30% of the mixing water. Following this, cement, SF, and SBR were introduced into the mixture. After one minute of mixing, 50% of the water and a superplasticizer diluted in 20% of the leftover water were incorporated. The concrete mixture was then blended for another three minutes. Throughout the mixing and testing process, the temperature was controlled at 24 ± 2 °C, and the relative humidity was controlled at 50 ± 5%. The concrete mixture was placed into cylinders with a diameter of 100 mm and a height of 200 mm, then covered with a plastic sheet for the first 24 h. After 24 h, the specimens were removed from the molds and kept at a temperature of 23 ± 3 °C and relative humidity of 50 ± 10%. It is worth noting that natural materials and RCAs were used at 80–85% of their SSD condition. This approach was adopted to ensure optimal moisture content, which has been shown to yield superior strength performance compared to other aggregate moisture conditions [26,27].

3.3. Performance Evaluation

The compressive strength (Figure 1a) and splitting tensile strength of the concrete samples were measured according to the procedures specified in ASTM C39 and ASTM C496, respectively [53,54]. The hardened density of PC was determined as per ASTM C1754 [55]. In addition, the porosity of the PC samples, as shown in Figure 1b, was calculated using Equation (1).
Porosity % = ( 1 ( W S W a V × ρ w ) ) × 100 %
In this context, Ws represents the saturated mass of the sample (kg), Wa denotes the submerged mass of the sample (kg), V indicates the volume of the sample (m3), and ρw signifies the density of water (kg/m3).
The assessment of the permeability in PC involved measuring the permeability coefficient (Figure 1c), which quantifies the water flow through a unit area per unit time under a specified hydraulic gradient. The change in water level and the time taken for water to pass through the sample were recorded. Permeability testing was performed on PC specimens by the falling head and the constant head methods. In the falling head method, the specimen is contained and placed between two pipes. The time taken for the water pressure head to fall between defined levels (h0 and h1) was measured and used in Equation (2) to determine the hydraulic permeability (k).
k = α L β t ln h 0 h 1
where k is the permeability coefficient (mm/s), α represents the cross-sectional area of the pipe (mm2), β denotes the cross-sectional area of the specimen (mm2), t is the time taken for the water head to decrease from h0 to h1 (s), h0 is the initial water head (mm), and h1 is the final water head (mm).
The Los Angeles abrasion machine (as shown in Figure 1d) was employed to assess the mass loss from impact and abrasion following ASTM C1747 [56]. The weight of each specimen was assessed before and after the test, and abrasion resistance was represented as the rate of weight loss following 500 revolutions. Meanwhile, the freeze–thaw resistance of PC was tested by immersing cylindrical samples in water for 3 days to standardize saturation. Subsequently, the cylinders underwent a sequence of freeze–thaw cycles, with each cycle comprising 12 h of freezing at −20 ± 3 °C followed by 12 h of thawing in water at +20 ± 4 °C [37]. After subjecting the samples to 56 freeze–thaw cycles, the compressive strength was measured following ASTM C39 [53].

4. Results and Analysis
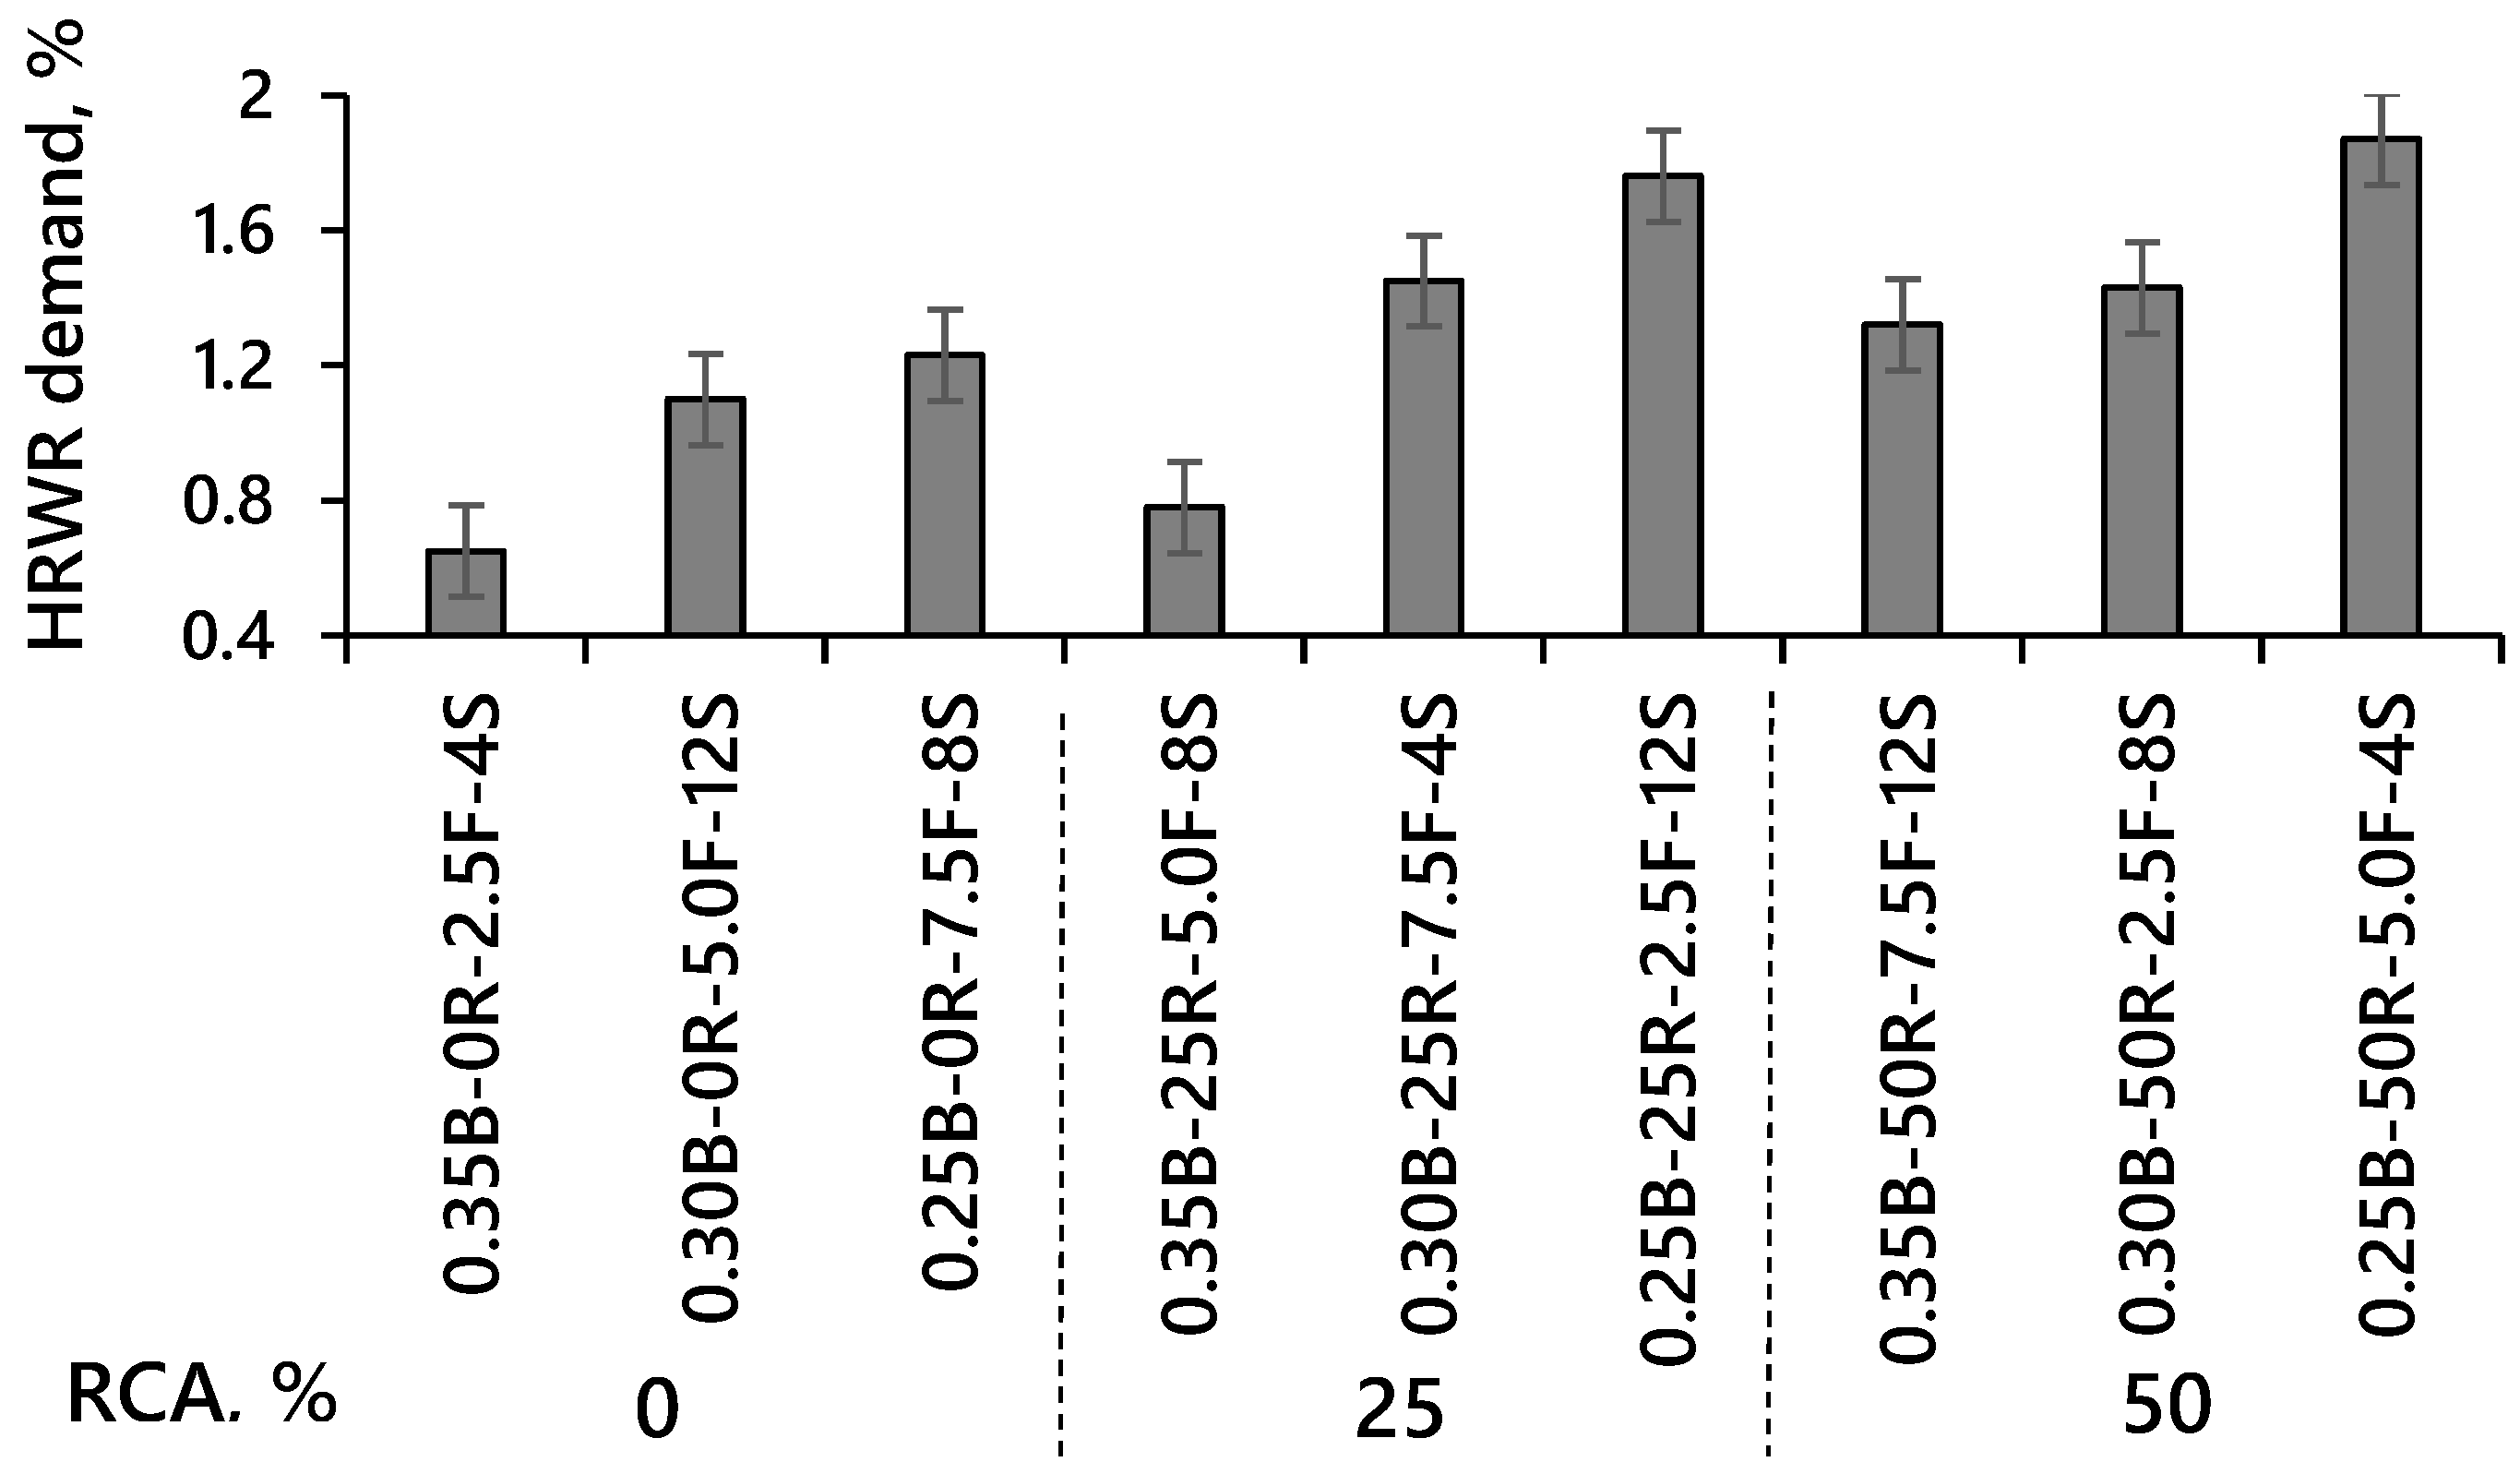
Table 3 summarizes the density, porosity, mechanical properties, and durability responses of the tested PC mixtures made with varying rates of RCAs, SF, and SBR.

4.1. HRWR Demand

The HRWR demand was adjusted to ensure that all PC mixtures achieved an acceptable level of consistency, as demonstrated by da Costa et al. [52]. It should be emphasized that the w/b ratio excludes the contribution of moisture present in aggregates under the SSD conditions. Mixtures with lower w/b ratios required an increased HRWR dosage, as the reduced free water content required more HRWR molecules to reach the target consistency (Figure 2). This response is consistent with earlier studies on concrete with expanded polystyrene [37]. Conversely, mixtures with similar w/b ratios but including RCAs demonstrated a comparatively higher HRWR demand. For example, the HRWR content increased from 1.23% in mix 0.25B-0R-7.5F-8S to 1.76% and 1.87% in mixes 0.25B-25R-2.5F-12S and 0.25B-50R-5.0F-4S containing 25% and 50% RCAs, respectively. This increase can be associated with the relatively high water absorption capacity of RCAs, which affected the level of internal friction within the concrete matrix, resulting in reduced workability and higher demand for HRWR [57]. It is worth noting that mixtures prepared with a relatively high w/b ratio of 0.35 and no RCAs resulted in the lowest HRWR demand. This is likely due to the combined influence of additional mixing water and nature of the natural aggregates, which provide lubrication to the cementitious matrix [9]. Meanwhile, the addition of SF increased the HRWR demand across mixtures, regardless of RCA content. For example, the HRWR requirement ranged from 1.1% in mix 0.30B-0R-5.0F-12S to 1.45% in mix 0.30B-25R-7.5F-4S. This is due to the high specific surface area of SF, which demands additional HRWR materials to lubricate the binder effectively and ensure the intended workability is met [29].

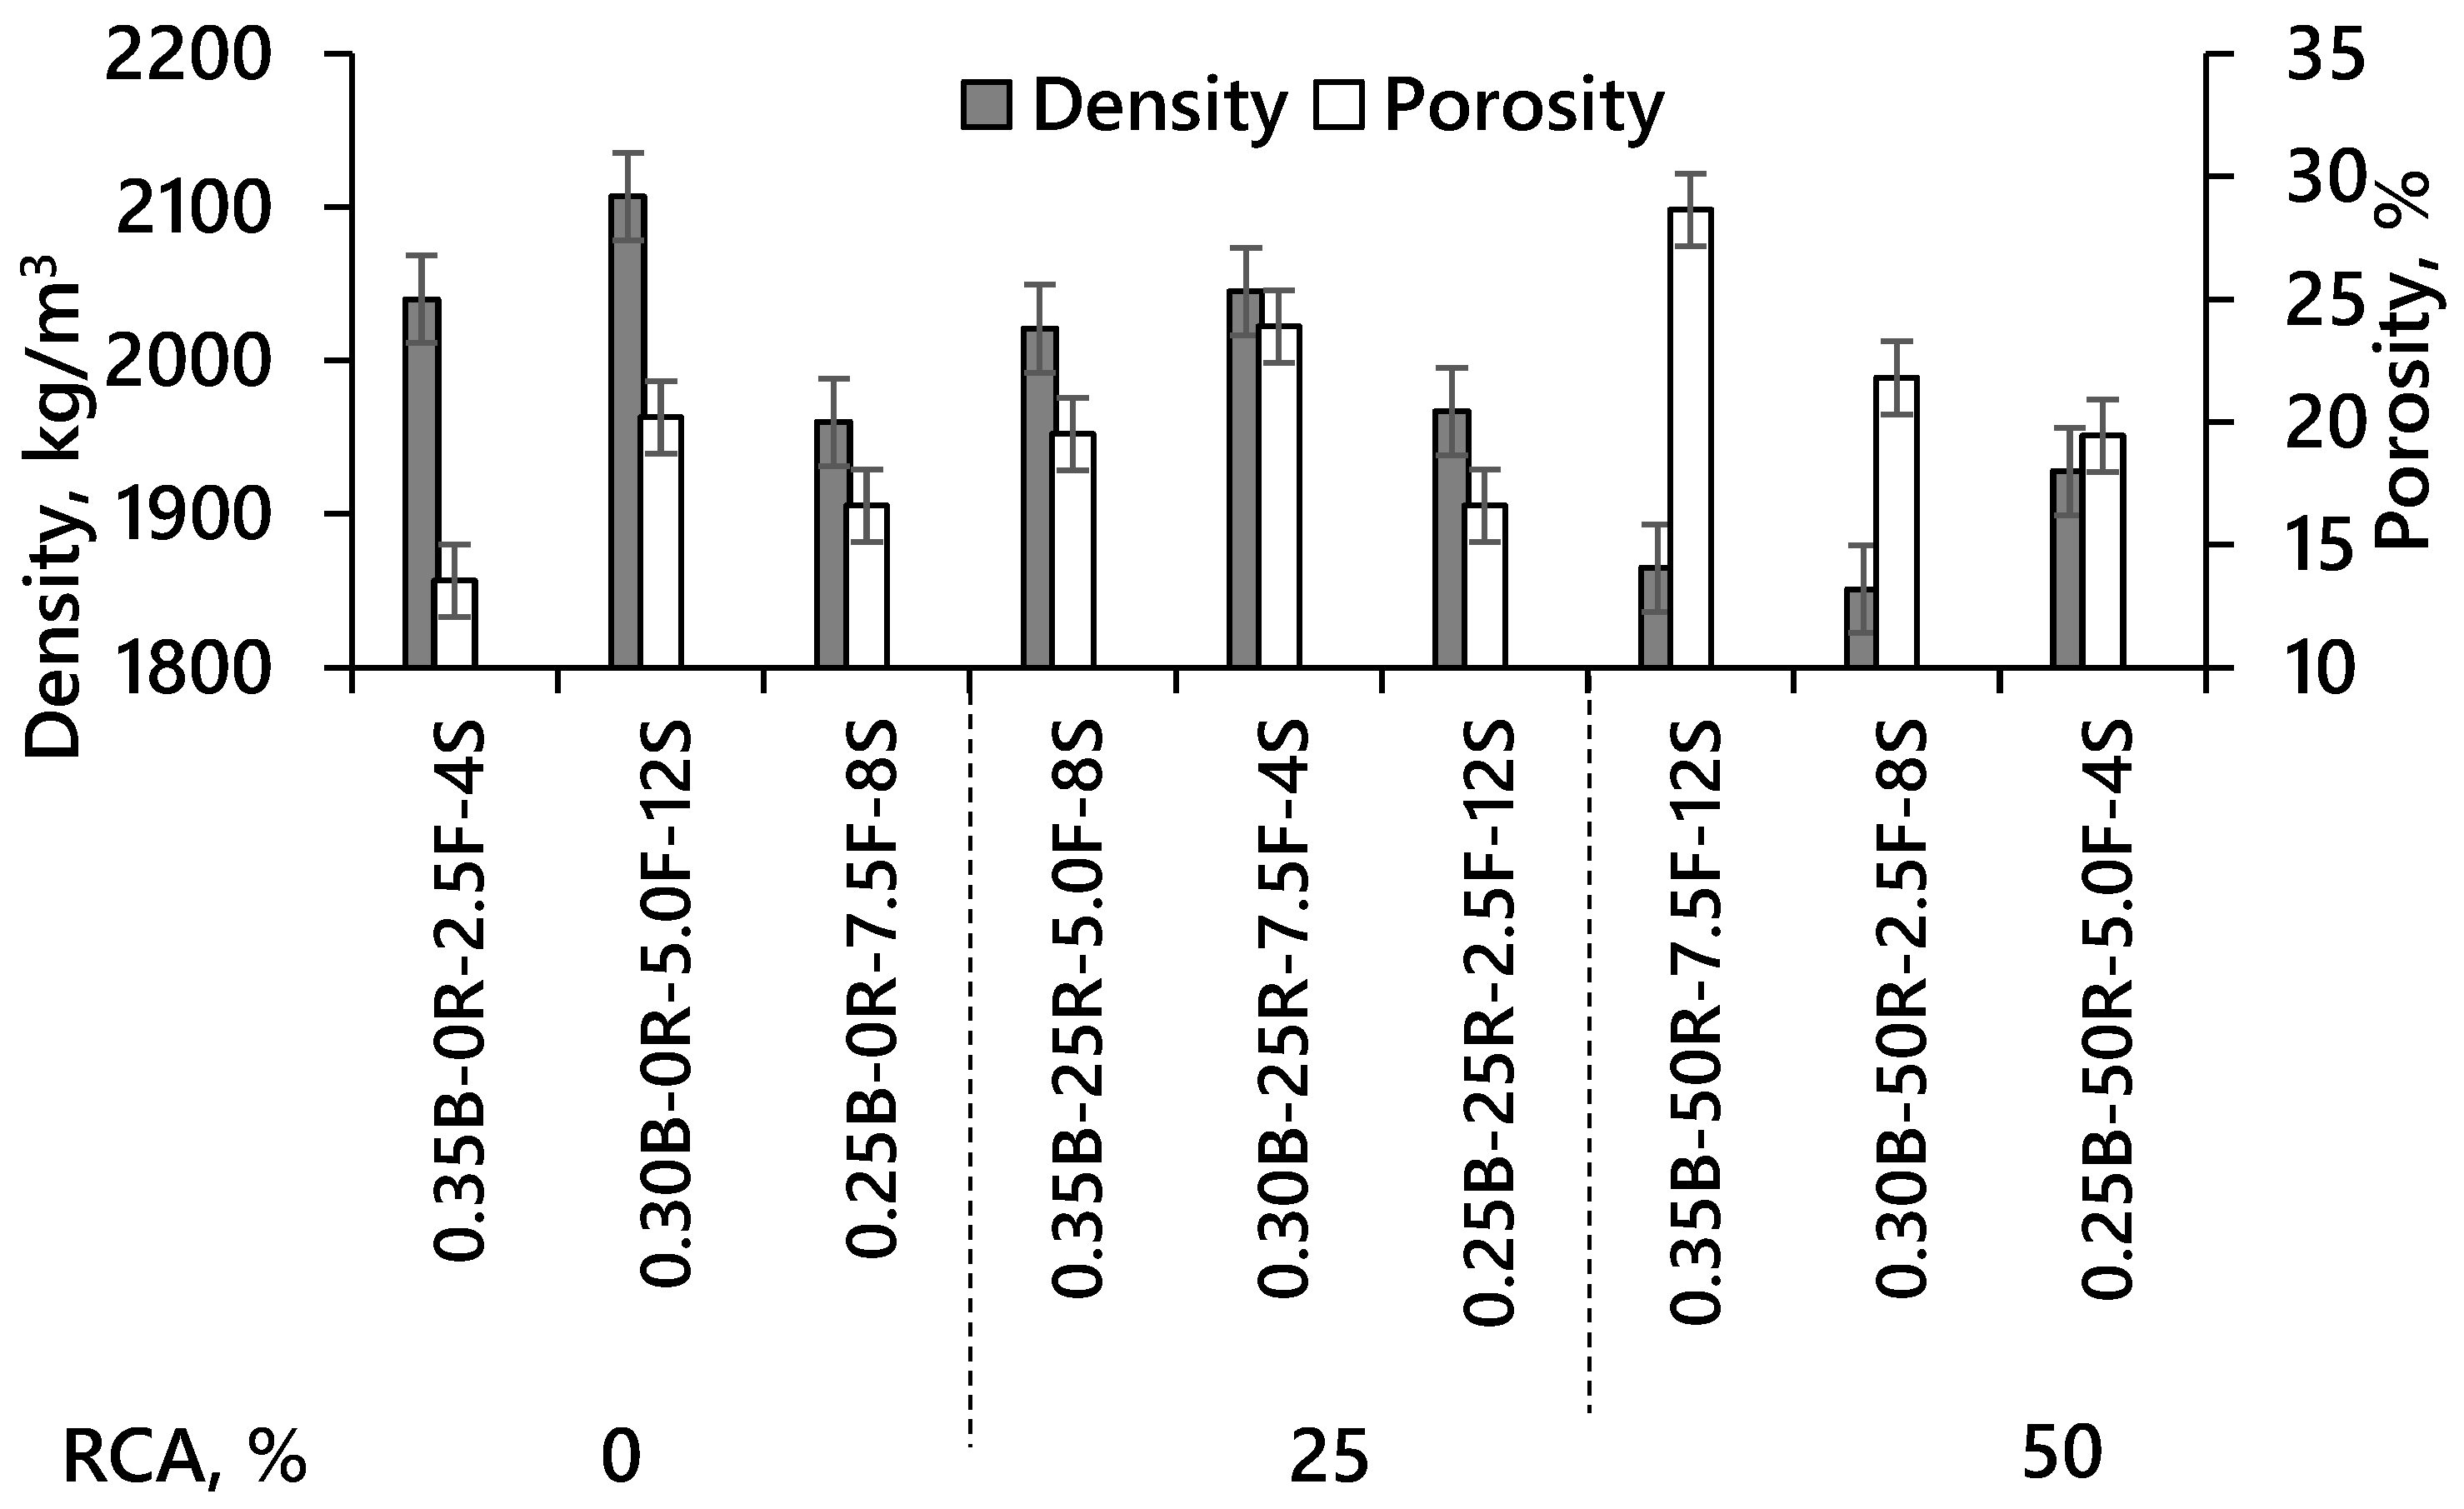
4.2. Density and Porosity

Figure 3 shows the variations in porosity and density across the PC mixtures. A clear trend shows that the gradual addition of RCAs and SBR resulted in an increase in the porosity, reaching up to 28.7%. At the same time, the mix 0.35B-50R-7.5F-12S, made with 50% RCAs and 12% SBR, showed a relatively low density of 1865 kg/m3 when compared to the mix made without RCAs. The angular shape and rough surface texture of the RCAs contributed to higher air entrapment in the PC, leading to an increase in porosity and decrease in density. Moreover, the high-water absorption of the RCAs, reflecting its absorbent properties, likely contributed to the higher porosity and lower density observed in the PC. These results corroborate previous studies [26,58], highlighting the direct impact of RCAs on the porosity of PC. It is worth noting that the average density of 2035 kg/m3 was recorded for the PC mixtures containing 0% RCAs. However, the gradual use of RCAs in PC contributed to a decrease in density of 1.2% and 7.6% when 25% and 50% of RCAs were used, respectively.
Furthermore, the addition of SBR contributed to higher porosity levels in the PC, with the 0.35B-50R-7.5F-12S mixture experiencing an increase as high as 28.7%. Earlier studies have shown that the inclusion of SBR in mortar mixes generates air bubbles, resulting in a direct increase in porosity and reduction in unit weight [41,59]. It is important to note that as SF was incrementally added to the PC mixes, the density increased. For instance, the mix 0.30B-0R-5.0F-12S, containing 5% SF, reached the highest density of 2107 kg/m3.

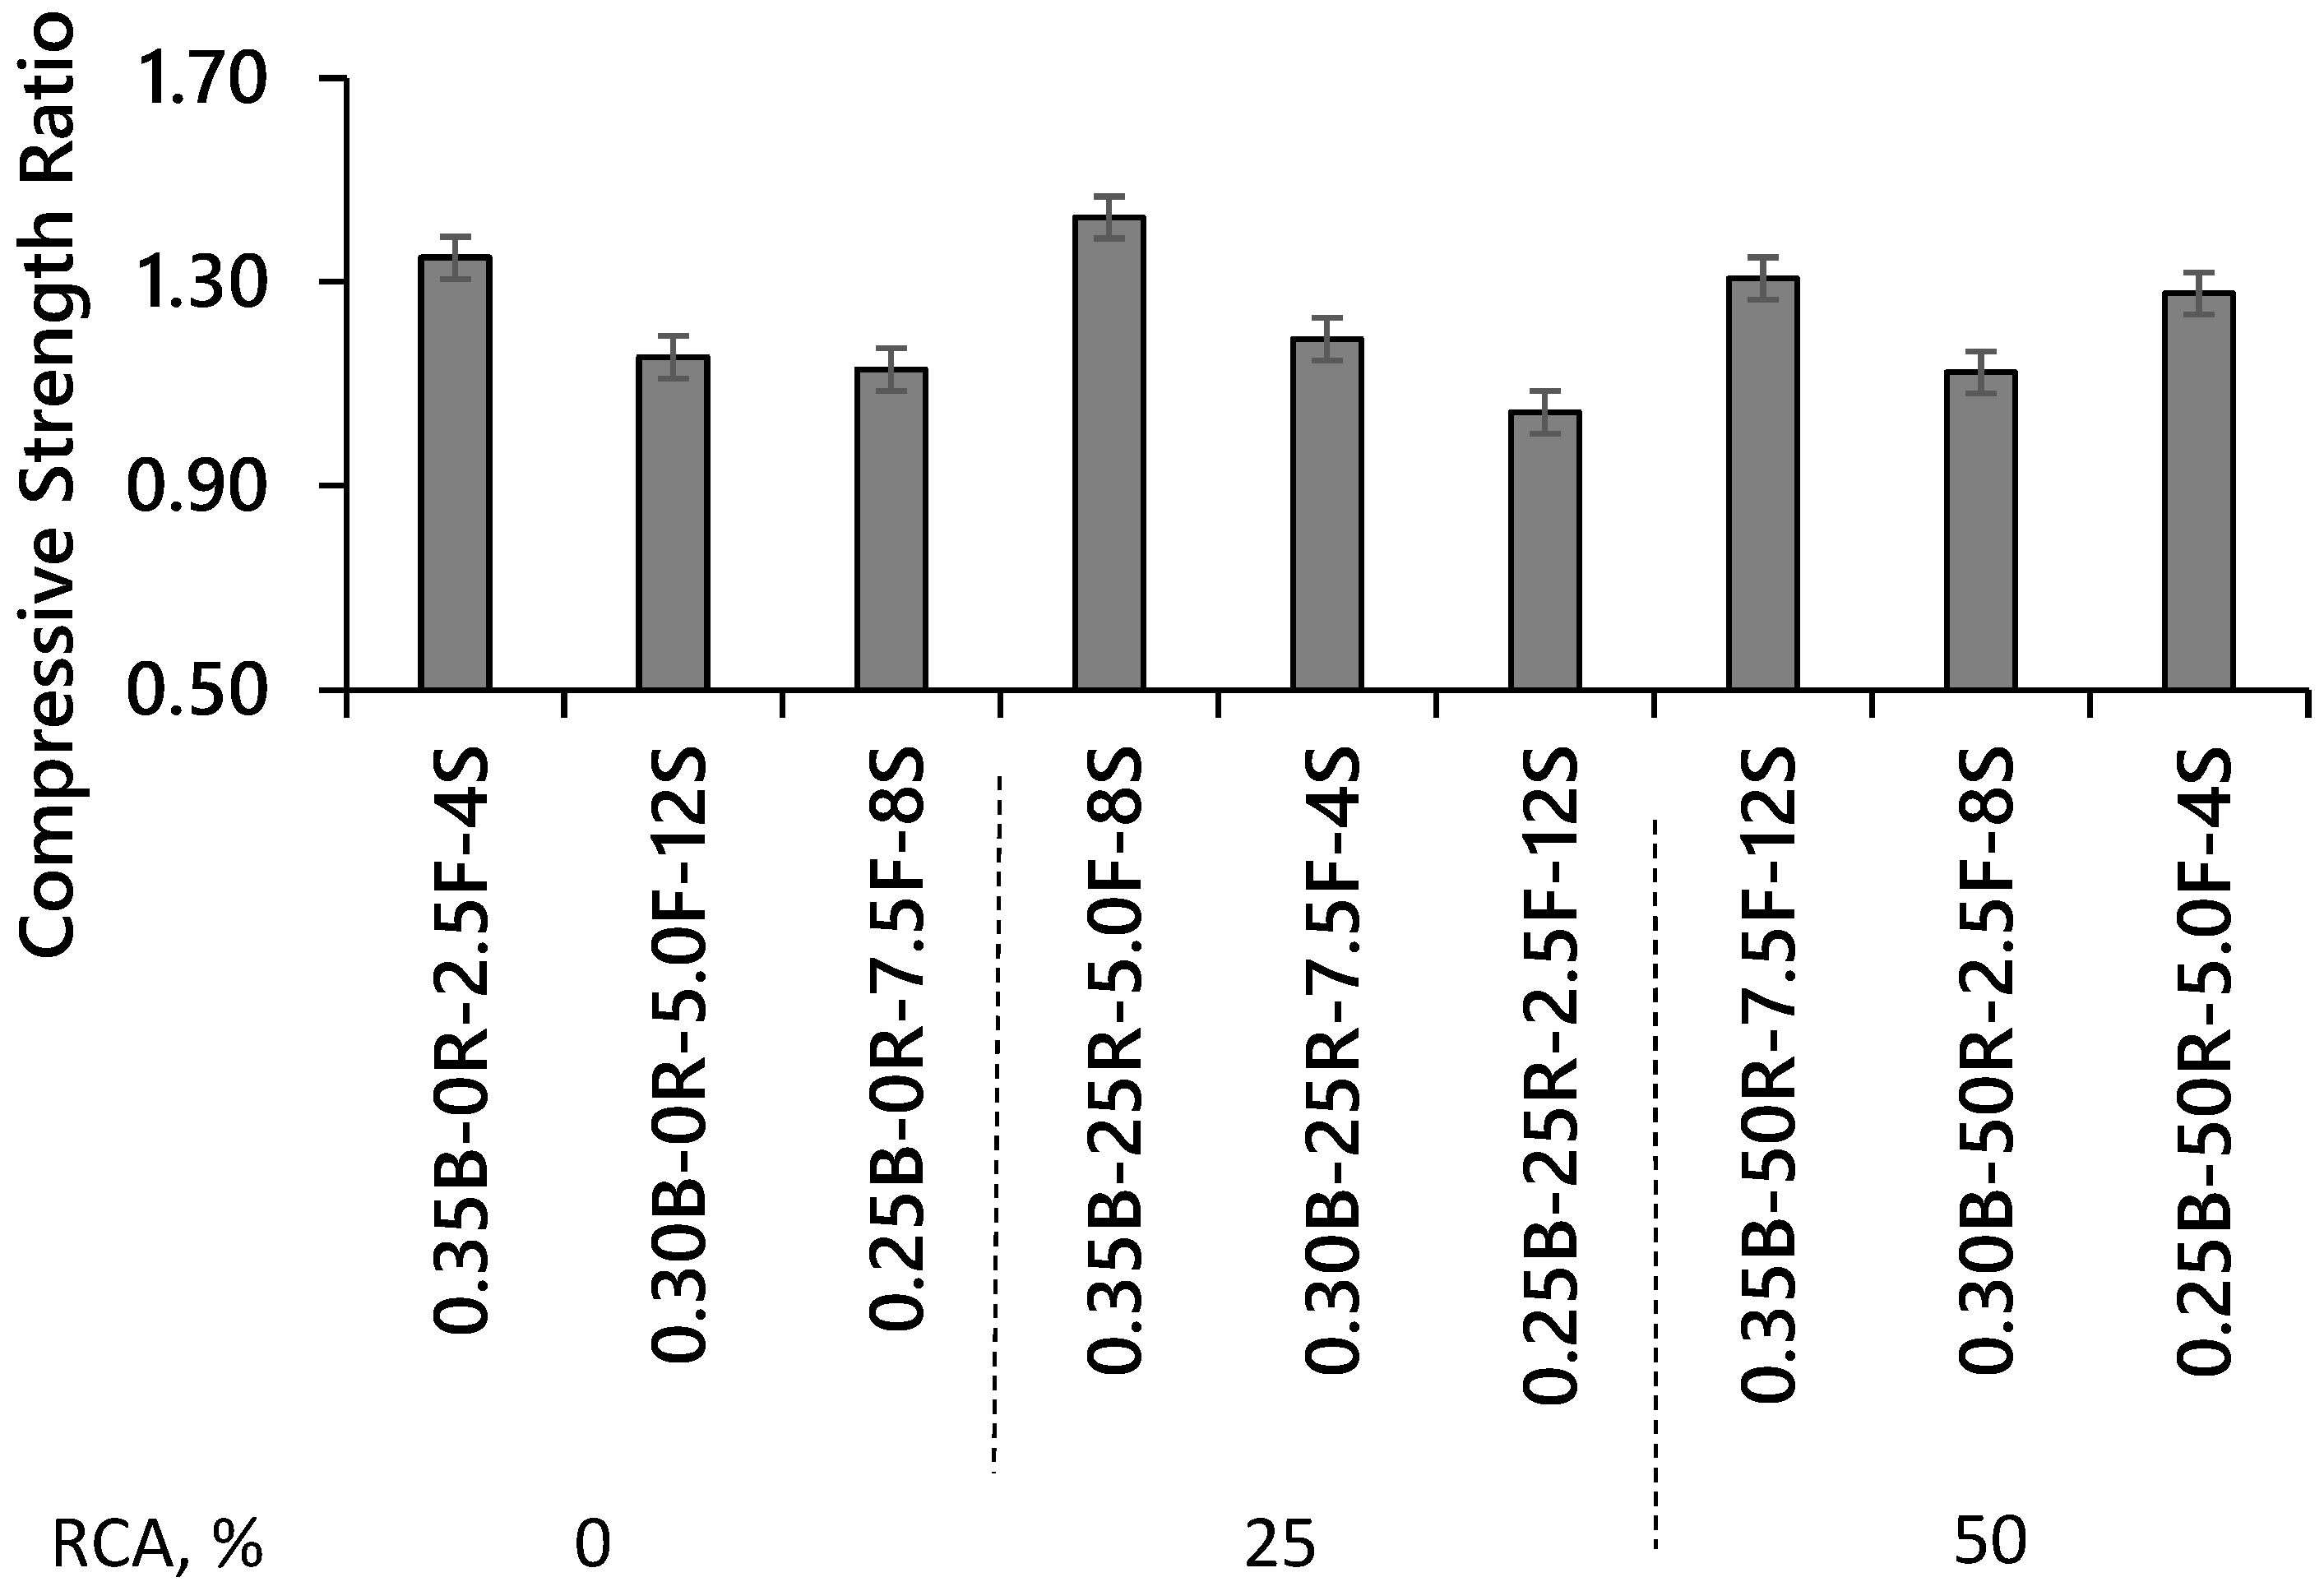
4.3. Compressive Strength

The compressive strength of the PC mixtures, shown in Table 3, varied between 7.2 and 11.5 MPa. It can be noticed that the mixture labeled 0.35B-50R-7.5F-12S, comprising a 0.35 w/b ratio, 50% RCAs, 7.5% SF, and 12% SBR, demonstrated the lowest strength at 7.2 MPa. Conversely, the mixture 0.25B-50R-5.0F-4S, with a 0.25 w/b ratio, 50% RCAs, 5% SF, and 4% SBR, showed the highest strength at 11.5 MPa. Among the mix groups with RCA rates (0%, 25%, and 50%), those with 0% RCAs achieved the highest average strength of 10.7 MPa. In contrast, mixes with 50% RCAs exhibited the lowest average strength of 8.9 MPa. These results suggest that RCA replacement rates negatively influenced the compressive strength, irrespective of the w/b, SF, and SBR addition rates.
Figure 4 displays contour plots that illustrate the impact of various mix design factors on compressive strength. The highest compressive strength was observed within certain factor ranges. Specifically, PC mixtures with a w/b ratio in the range of 0.25–0.35, RCA replacement rates of 0–50%, SF replacement of 2.5–7.5%, and SBR addition rates of 4–8% achieved compressive strengths above 10 MPa. The strength responses improved with a lower w/b ratio, owing to the dual effect of reduced void content and enhanced particle packing density [60]. Moreover, replacing cement with SF at levels of 2.5% or higher enhanced strength, due to the pozzolanic reaction between the CaO in the binding matrix and SiO2 in the SF [61]. On the other hand, increasing RCA rates led to inferior strength responses. In fact, the high water absorption of the RCAs, highlighting their porous nature, may have caused the PC to exhibit greater porosity, ultimately reducing its strength. Such responses agree with previous work [62], reflecting the direct effect of RCAs on the strength response of PC. Nevertheless, the addition of SBR at relatively high levels of 8–12% caused a reduction in compressive strength. This outcome is consistent with past studies [63] and can be attributed to the weakened cement hydration compounds in SBR-modified mixtures, along with the elastic characteristics of polymer films, which enhances concrete deformation under stress. It is worth noting that the compressive strength values obtained in this study (7.2–11.5 MPa) are in good agreement with those reported in previous investigations on PC made with recycled aggregates, which ranged from 9.44 to 11.67 MPa [5].

4.4. Splitting Tensile Strength

The splitting tensile strength of the PC mixtures, as shown in Table 3, varies between 0.57 and 1.41 MPa. Among these mixes, the mix labeled 0.25W-50R-5.0F-4S, which included a w/b ratio of 0.25, 50% RCAs, 5% SF, and 4% SBR, achieved the highest splitting tensile strength of 1.41 MPa. Conversely, the mix 0.35W-7.5F-50R-12S, made of a w/b ratio of 0.35, 50% RCAs, 7.5% SF, and 12% SBR, recorded the lowest splitting tensile strength of 0.57 MPa. The results indicate that a lower w/b ratio enhances strength due to pore structure refinement [9]. Among the mixes with RCA rates of 0%, 25%, and 50%, those with 50% RCAs achieved the lowest average splitting tensile strength of 0.97 MPa. However, at lower RCA rates of 25% RCAs, the mixes exhibited higher splitting tensile strengths, with an average value of 1.19 MPa. These findings can be linked to the mechanical properties of RCAs, which include a weak aggregate and hardened cement paste. When the cracking path traverses the aggregates, the use of weaker RCAs leads to a reduction in splitting tensile strength [17].
In addition, the incorporation of SF to the PC mixes improved the splitting tensile strength (Figure 5). In particular, mixes with more than 5% SF showed superior results among the tested mixes. For example, mix 0.25B-50R-5.0F-4S achieved a splitting tensile strength value of 1.41 MPa. It is notable that the simultaneous use of SBR also enhanced the splitting tensile strength. The formation of coalesced polymer films supports the mitigation of weaknesses by preventing crack initiation and strengthening the aggregate-binder interfacial transition zone [64]. It has been demonstrated by other researchers that latex-modified cement composites, with their improved surface smoothness, may lower ITZ porosity and create a stronger bond through micro-mechanical interlocking [65]. Nevertheless, the splitting tensile strength findings are aligned with the compressive strength results. Thus, a polynomial relationship between these properties was developed, as shown in Equation (3), where ft represents the splitting tensile strength and fc represents the compressive strength. This correlation can be utilized to estimate the permeability of PC from its compressive strength measurements with an acceptable R2 of 0.7.
ft = 0.141fc − 0.3162

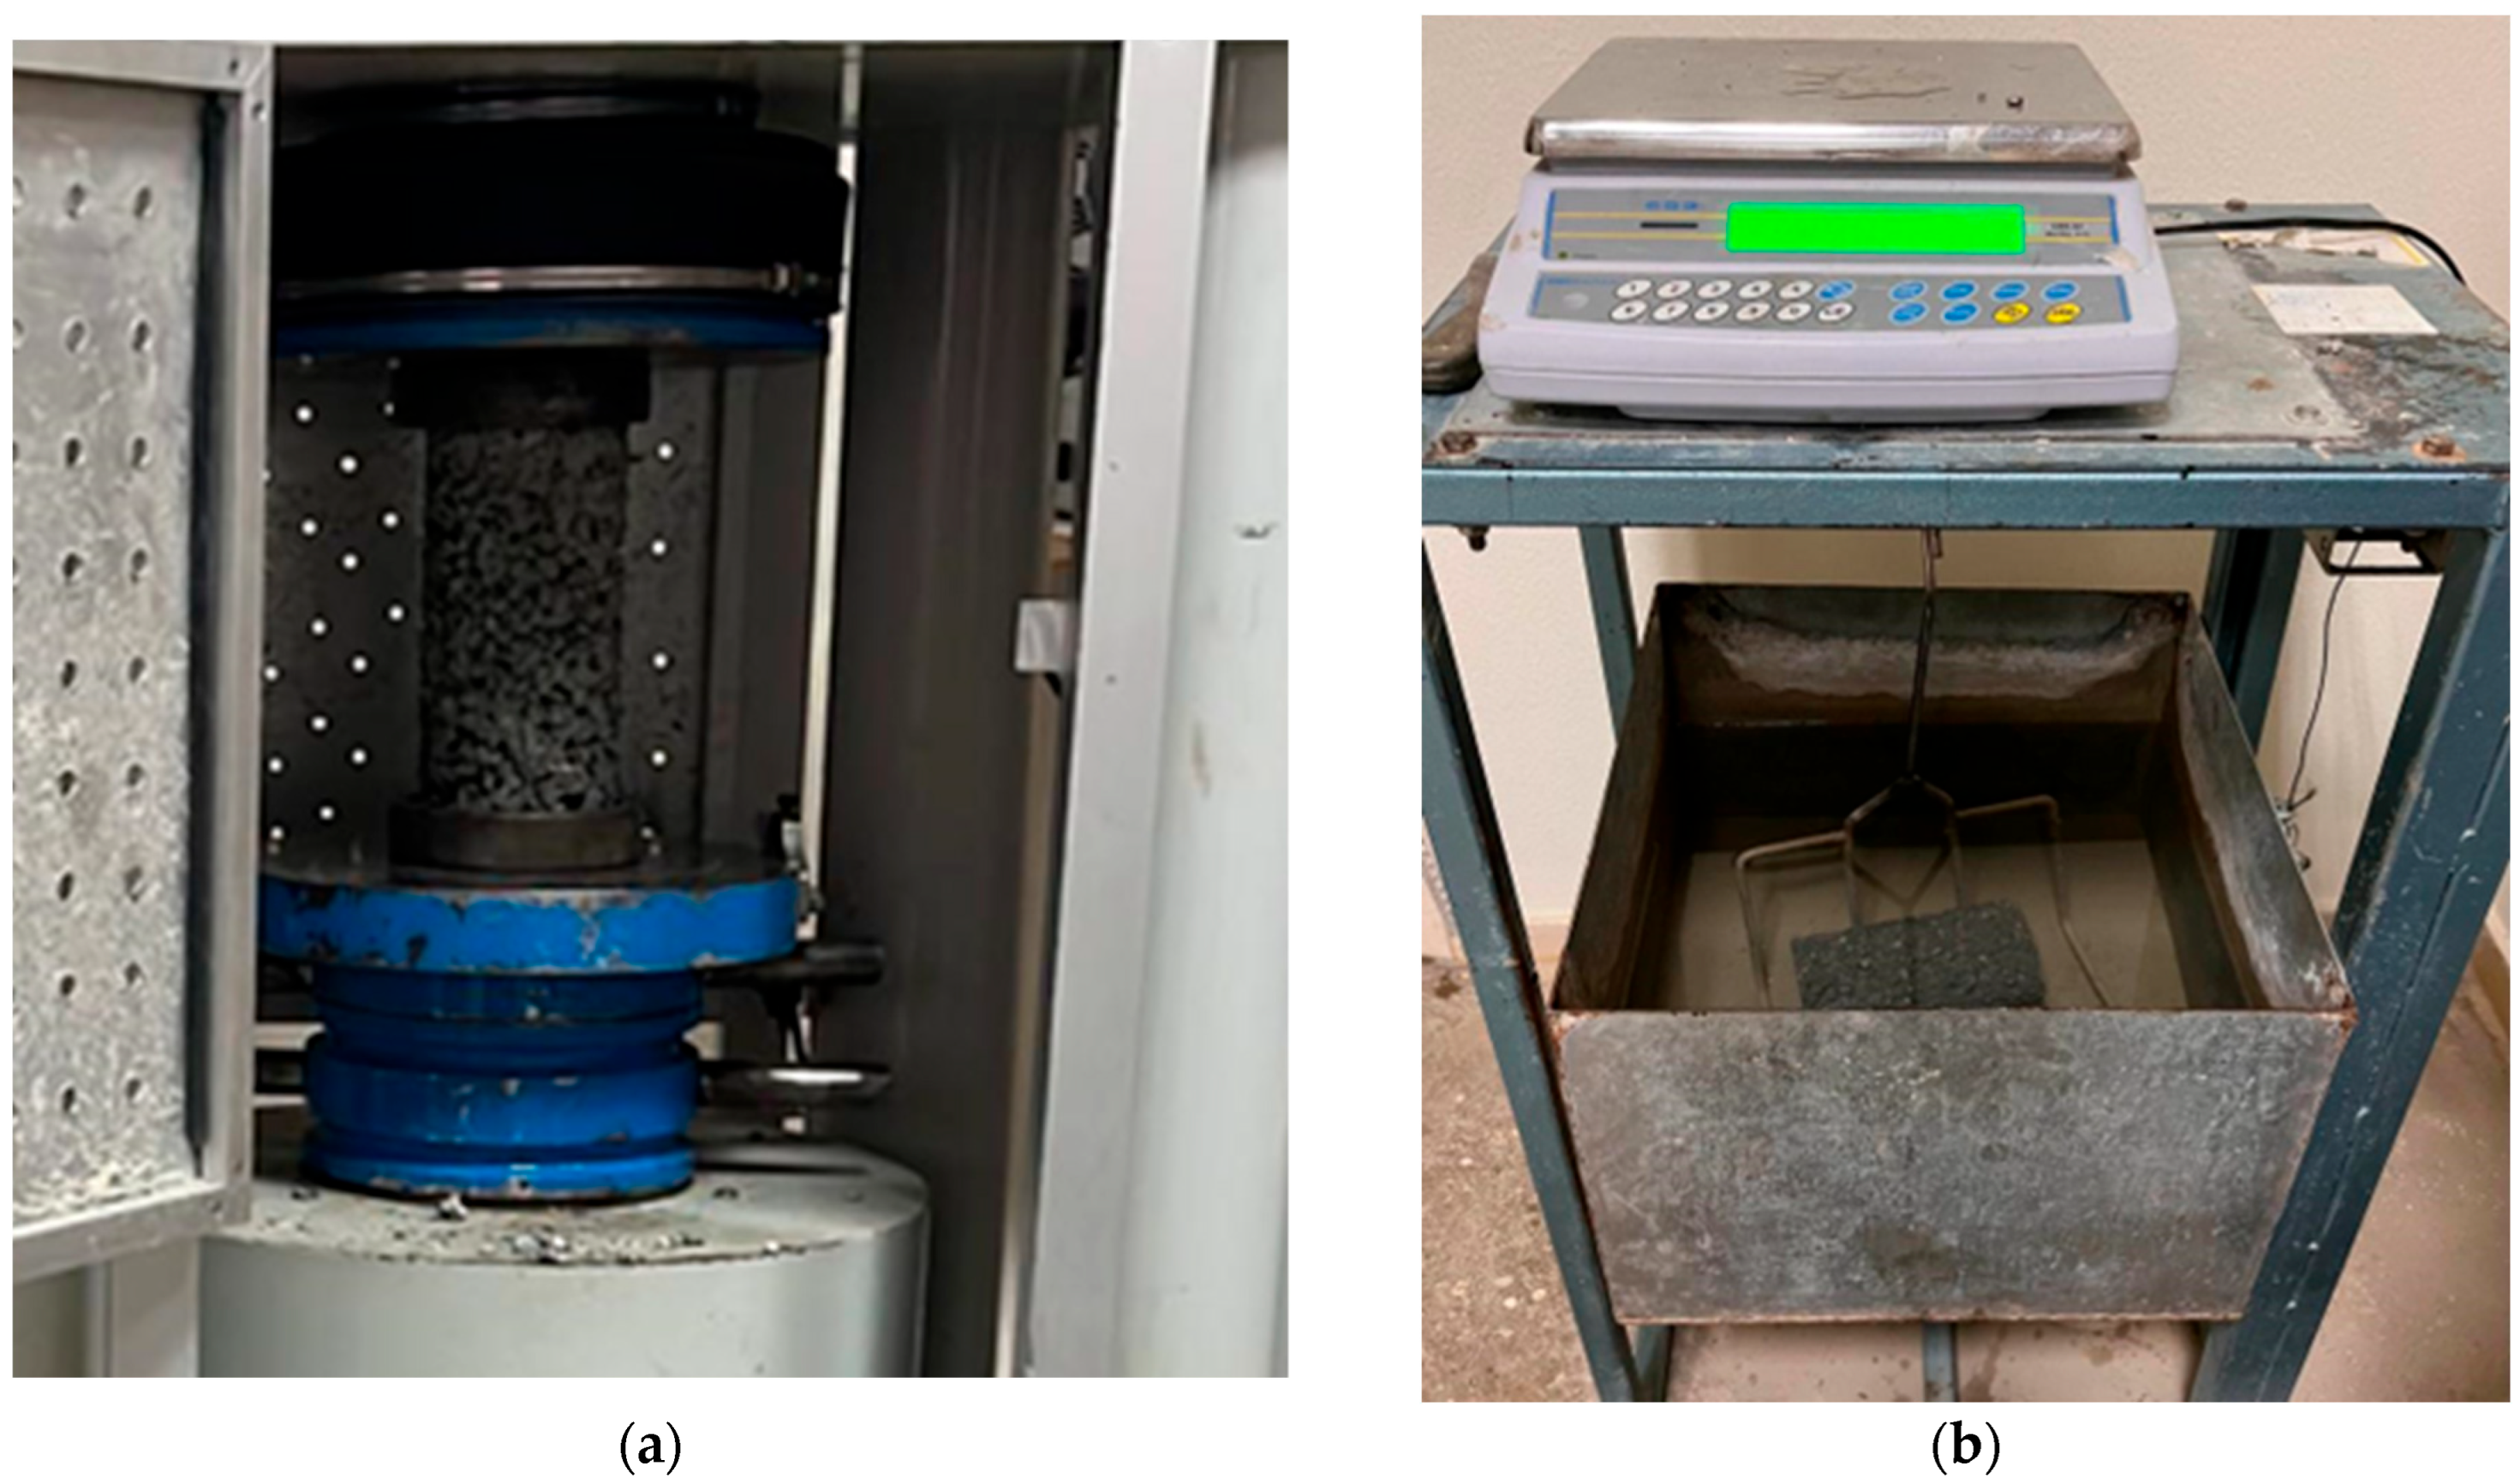
4.5. Abrasion Resistance
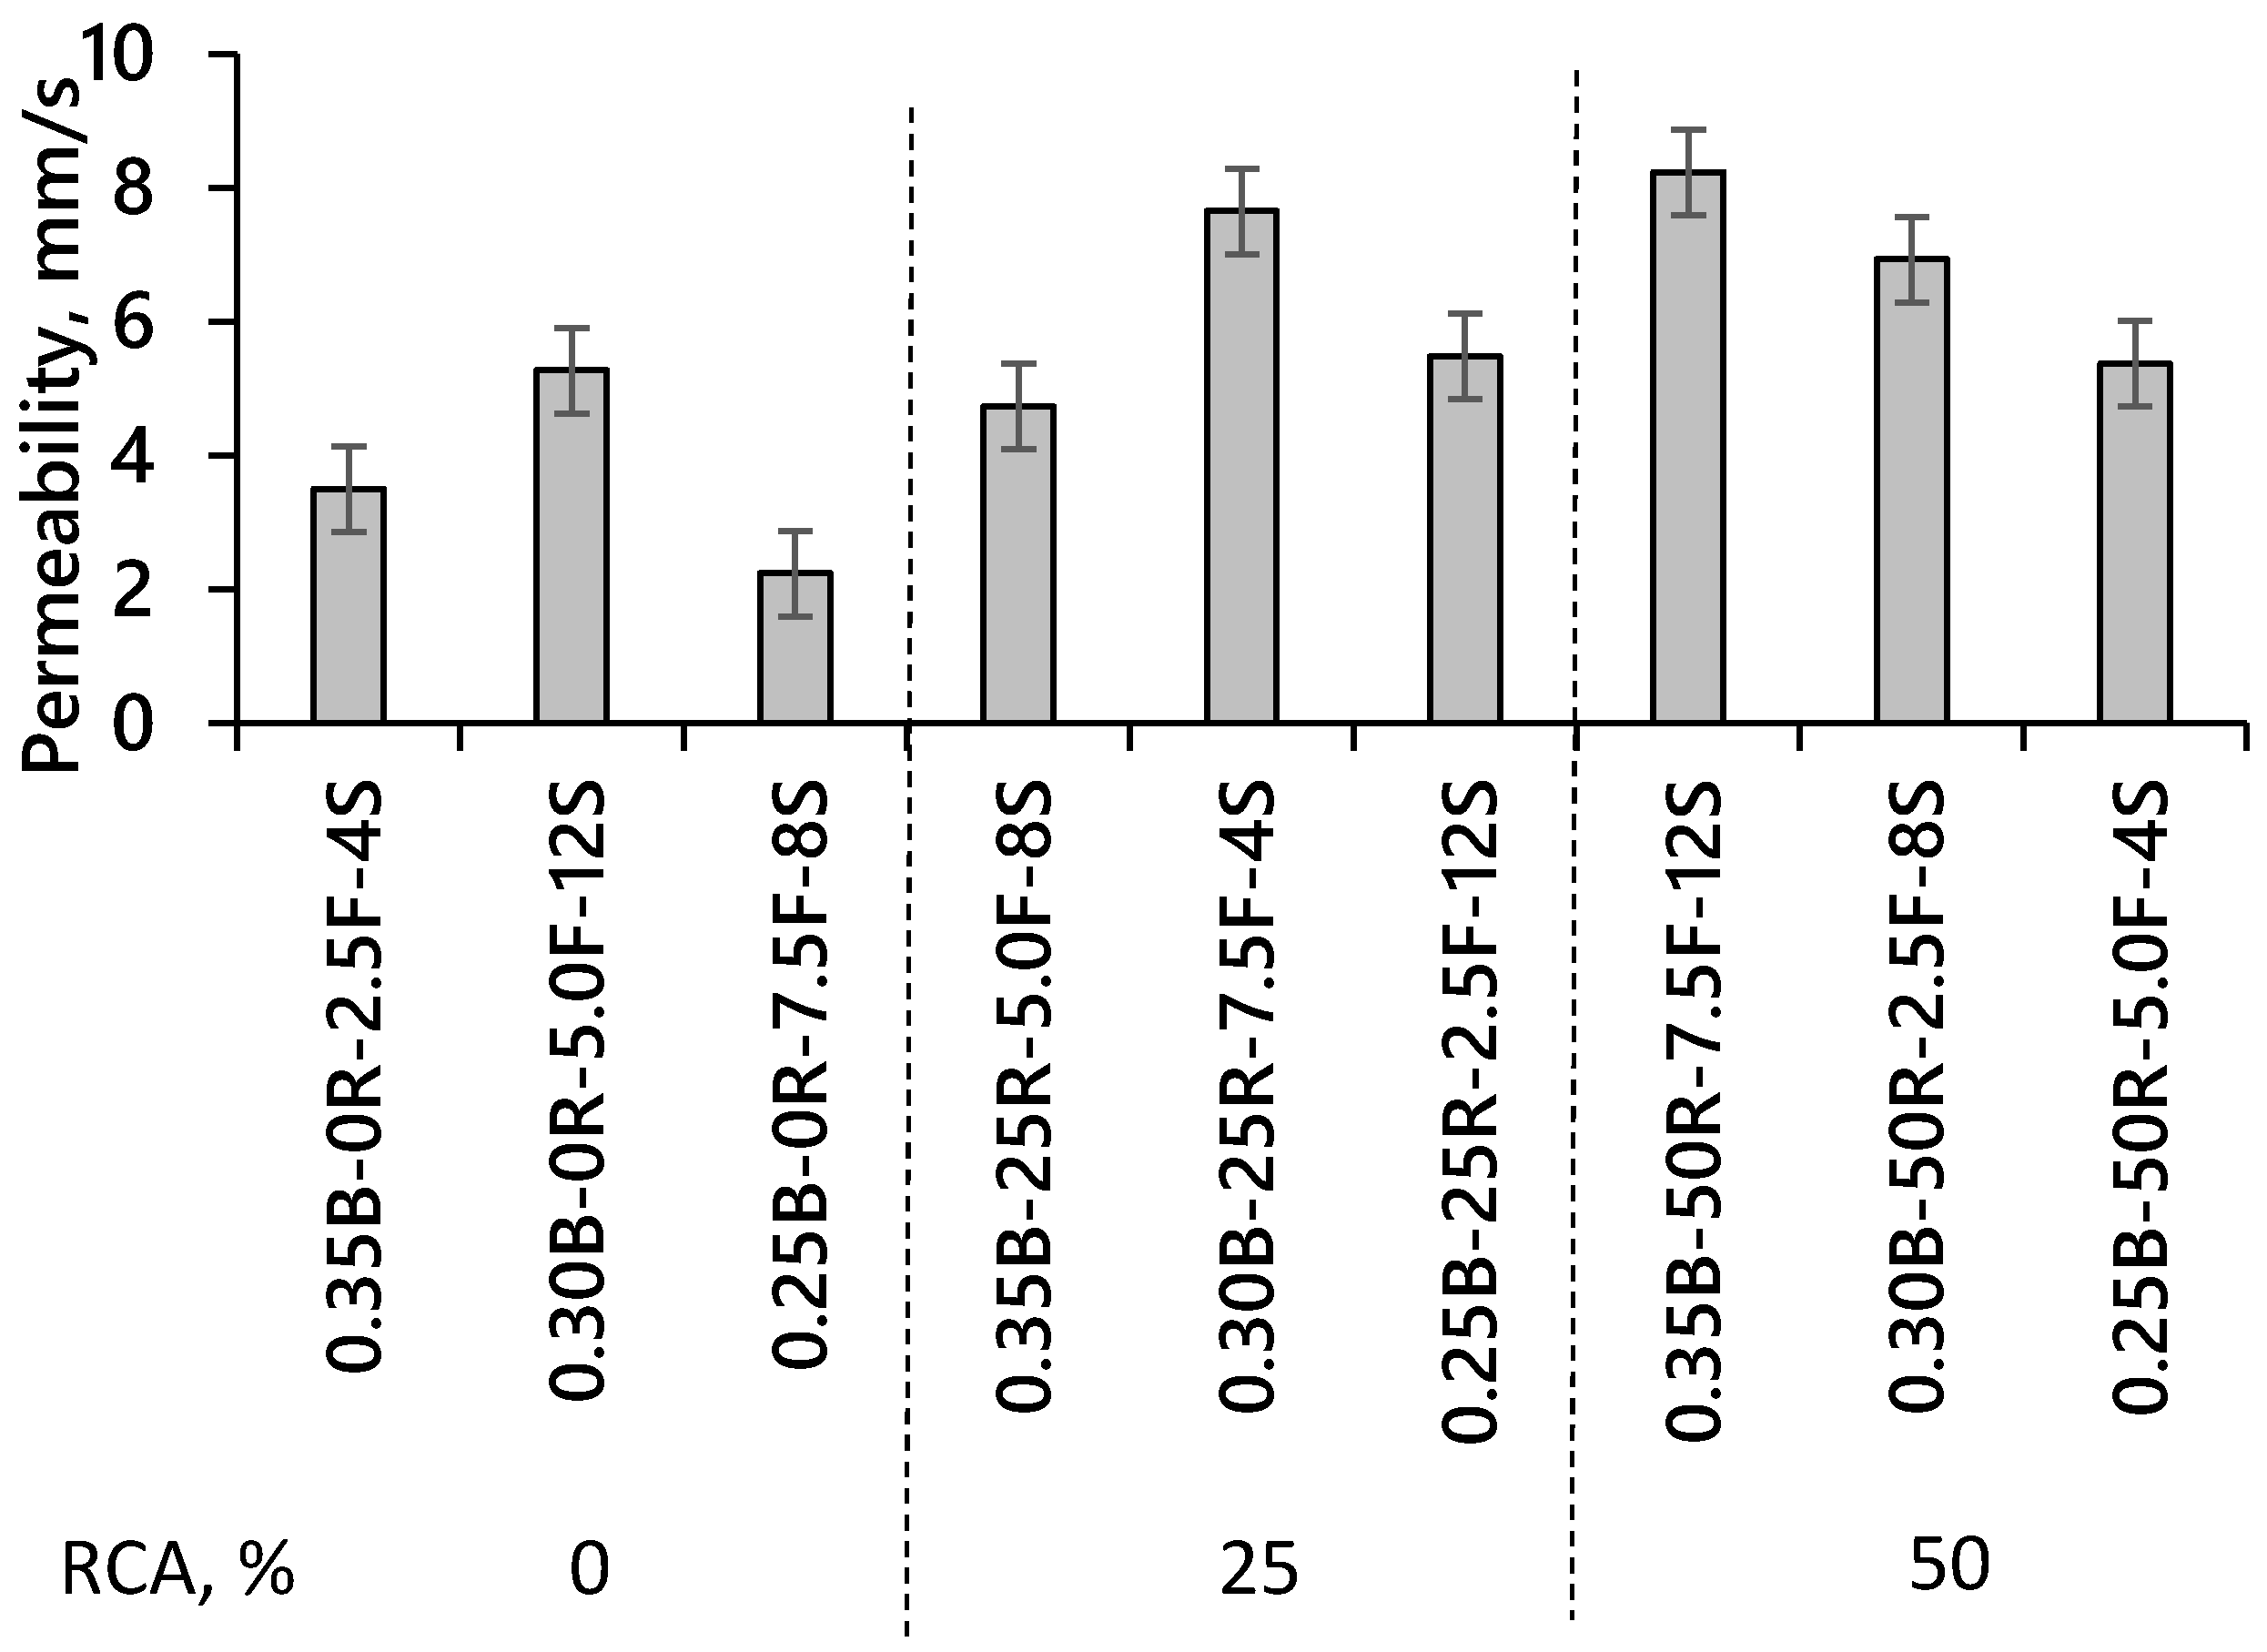
Figure 6 shows the contour plots of abrasion-induced mass losses for PC mixtures with respect to the different mix design factors, with values after 500 revolutions summarized in Table 3.
Generally, achieving impressive abrasion resistance with RCAs requires reducing the w/b ratio and adding SF. For example, mixes 0.30B-25R-7.5F-4S and 0.25B-50R-5F-4S with 25% or 50% RCAs showed superior results in their respective categories, achieving abrasion resistance values of 37.7% to 45.6% after 500 revolutions. Conversely, the use of a higher w/b ratio and RCA replacement rate in PC mixtures, such as 0.35B-50R-7.5F-12S, showed a 62.2% mass loss. Therefore, reducing the w/b ratio in PC appears crucial for minimizing abrasion mass loss, highlighting the significance of decreasing free mixing water to strengthen the concrete skeleton [37]. Meanwhile, adding SF enhanced the pozzolanic activity, resulting in improved abrasion resistance [39,66]. At the same time, increasing SBR rates improved abrasion resistance, where mixes 0.25B-50R-5.0F-4S, 0.35B-25R-5.0F-8S, and 0.30B-0R-5.0F-12S, incorporating 4%, 8%, and 12% SBR, respectively, showed corresponding abrasion mass losses of 37.7%, 46.5%, and 40.9%. In all cases, the experimental findings for mass loss due to abrasion followed a trend like that of compressive strength, with a good correlation indicated by an R2 value of 0.83, as described in Equation (4).
Mass loss = −5.123fc + 99.53

4.6. Permeability

Table 3 shows the permeability coefficients of PC made with varying w/b ratios and the RCA, SF, and SBR rates. For mixes without RCAs, the permeability coefficients ranged from 2.24 to 5.27 mm/s, whereas mixes with RCAs had values between 4.73 and 8.23 mm/s. As shown in Figure 7, the permeability coefficient showed an increase with higher RCA replacement levels, attributed to the rough surface and angularity of the RCAs, which can trap air and enhance water percolation through the concrete. For instance, for mixes made with RCAs of 0%, 25%, and 50%, the mixes with 0% RCAs attained the lowest average permeability coefficient of 3.67 mm/s. Conversely, mixes with 50% RCAs exhibited the highest permeability coefficient, averaging at 6.84 mm/s (Figure 7). These outcomes correspond with the porosity findings, with the increase in transport properties being associated with physical properties of RCAs, which contribute to greater porosity in PC [10,17].
On the other hand, the permeability of PC was reduced by using a lower w/b ratio and incorporating higher rates of SF into the cementitious matrix. As expected, replacing cement with SF at levels of 5% or higher decreased permeability responses due to the higher pozzolanic reaction capacity provided by the additional SiO2 in the binding matrix [29]. For example, mixes 0.25B-0R-7.5F-8S and 0.25B-50R-5.0F-4S, made with a relatively low w/b ratio of 0.25 and SF content greater than or equal to 5%, achieved permeability responses of 2.24 and 5.37 mm/s, respectively. Notably, the 0.25B-50R-5.0F-4S mix with 50% RCAs exhibited a similar permeability response to the 0.30B-0R-5.0F-12S mix without RCAs, both at 5.37 mm/s.
In conclusion, RCA replacement can lead to increased permeability, which is favorable for producing a more porous PC mixture that facilitates water percolation and drainage. However, it is crucial to also consider the mechanical and durability characteristics of concrete depending on its intended use. Since the upper limit of the permeability for PC is 1.3 mm/s [67], the concrete mixtures developed in this study are classified as PC and are thus appropriate for pavement applications.

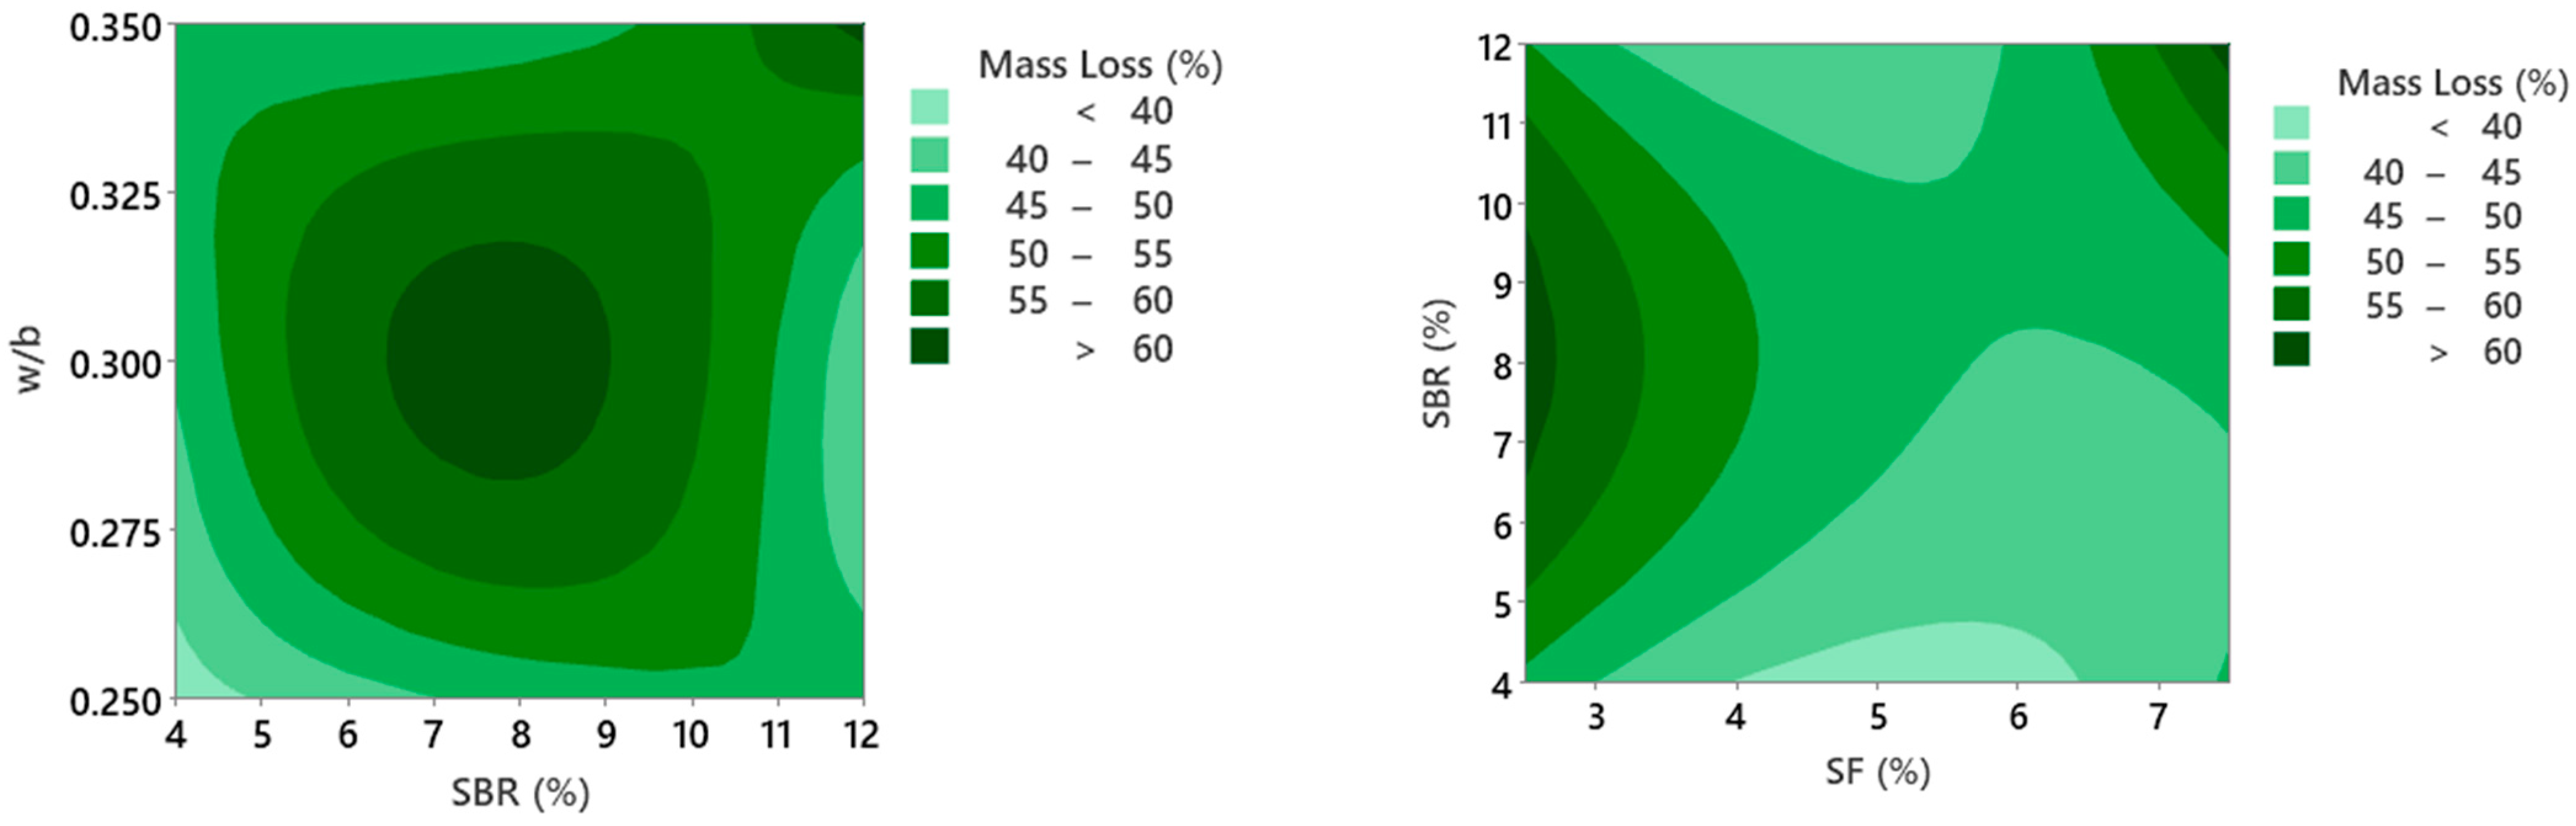
4.7. Freeze and Thaw Resistance

Figure 8 illustrates the ratios of compressive strength before to after freeze–thaw cycles. Notably, the highest ratios (1.43, 1.35, and 1.31) were noted for the PC mixtures with a 0.35 w/b ratio, suggesting a weak resistance to frost attack in these concretes. Studies have shown that interfacial zones in composite systems are marked by increased pore volume, a lower concentration of C-S-H hydrates, and larger Ca(OH)2 crystals [68,69]. Such zones are notably vulnerable to the effects of repeated freeze and thaw cycles, which can impair their interfaces and reduce their compressive strength.
Conversely, the compressive strength ratios dropped for mixtures prepared with SBR additions and/or a reduced w/b ratio. For instance, within the RCA rate groups of 0%, 25%, and 50%, the ratios were 1.13, 1.04, and 1.12 for the mixtures 0.25B-0R-7.5F-8S, 0.25B-25R-2.5F-12S, and 0.30B-50R-2.5F-8S, which contained 8%, 12%, and 8% SBR, respectively (Figure 8). Research has shown that minimizing internal damage from freeze–thaw cycles can be achieved by refining pores by lowering the w/b ratio, using pozzolanic additives, and adding polymers [68,70,71]. This process helps reduce osmotic effects, which contribute to micro-cracking and debonding during freeze–thaw cycles. It is anticipated that latex polymers will enhance elasticity and adhesion due to their strong tensile film properties, which would lead to improved bonding at interfaces and greater durability against freeze–thaw cycles [63,64].

4.8. Multi-Response Optimization

4.8.1. TOPSIS Optimization

Numerous statistical optimization techniques, including the Taguchi method, are extensively utilized to identify the best mix proportions and analyze critical factors by emphasizing one main performance criterion [44]. In contrast, recent studies in material engineering have increasingly utilized cutting-edge methods to optimize performance across various criteria, with the goal of identifying the best possible solution. In the realm of multi-response optimization problems, TOPSIS is utilized as a multi-criteria approach, assessing various alternatives against several criteria and ranking them according to their similarity to the optimal solution [72]. In this study, the TOPSIS technique was chosen to optimize PC mixtures containing RCAs, SF, and SBR at different rates by mass. This approach was selected to attain the optimal mechanical properties and durability based on the experimental results. As summarized in Table 4, the performance criteria chosen were density, compressive strength, permeability, and freeze–thaw resistance. These criteria were identified based on their relevance to the mechanical and durability properties crucial for enhancing the performance of PC. Each criterion was ranked on a scale of 1 to 9, depending on its effect on the specific criterion. In this study, all properties were equally weighted at 9, as they were all deemed essential in the optimization process for a balanced performance scenario [5].
The optimal values for PC were ascertained by employing a hybrid Taguchi–TOPSIS integrated strategy, which involved computing the signal-to-noise (S/N) ratios and the closeness coefficient for all factors. Detailed procedural steps are available elsewhere [5]. The liaison between S/N and the various factor levels is depicted in Figure 9. Using the ‘larger-is-better’ function, the optimal mix was identified to have a w/b ratio of 0.30, RCA content of 25%, an SF replacement rate of 5%, and an SBR addition rate of 4%.

4.8.2. Analysis of Variance

The impact of each mix design factor on the mechanical, hydraulic, and durability properties of the developed PC mixtures was assessed using ANOVA. In Table 5, the contributions of the mix design factors to a designated performance criterion are summarized, including a 95% confidence interval. The w/b ratio, RCA substitution percentage, and SF replacement rate were the dominant factors affecting the mechanical properties and durability of PC, while the SBR addition rate showed a lesser influence, contributing between 9.0% and 20.2%.
Indeed, the RCA replacement rate emerged as the most influential factor on density and permeability, contributing to 71.2% and 56.1%, respectively. In contrast, the w/b ratio had a more significant impact on compressive strength, abrasion resistance, and freeze–thaw resistance. At the same time, the impact of SF and SBR was lower, suggesting that SBR can be integrated into PC mixes without significantly affecting their durability. Notably, SF had a stronger effect on compressive strength than on other factors, owing to its pozzolanic activity, as noted earlier.
Given the interdependence of mechanical properties such as density, compressive strength, and splitting tensile strength, our in-depth analysis centers on density as a representative parameter (Table 6). In ANOVA, degrees of freedom (DF) indicate the number of independent comparisons for each factor, sequential sum of squares (Seq SS) measures the variation explained by a factor in the order it enters the model, adjusted sum of squares (Adj SS) reflects the variation explained by a factor after accounting for other factors, and adjusted mean square (Adj MS) is the average variation per degree of freedom, calculated by dividing Adj SS by DF. As shown in Table 6, RCAs exhibited the highest Adj MS (0.41), indicating its dominant influence on density through its impact on packing and internal pore structure. Across Table 7, Table 8 and Table 9, RCAs also governed permeability (Adj MS = 27.92), while the w/b ratio had a notable effect on permeability (13.11) and freeze–thaw resistance (5.38), emphasizing its control over porosity and moisture transport. In contrast, SF significantly enhanced abrasion resistance (Adj MS = 3.96), owing to its microstructural densification effects. SBR demonstrated moderate contributions across abrasion, permeability, and freeze–thaw resistance, likely due to its film-forming and toughening capabilities. These results highlight that different durability and performance indicators are controlled by distinct parameters, reinforcing the need for targeted mix design strategies.

5. Conclusions

This paper assessed the impact of different mix design parameters on the mechanical and durability properties of SBR-modified pervious concrete (PC) incorporating recycled concrete aggregates (RCAs). Optimization of the mixture proportions to maximize PC performance was conducted using the Taguchi–TOPSIS method. Based on the experimental results obtained in this study, the following conclusions can be drawn:
  • Mixtures with higher amounts of RCAs and SF led to an increased demand for HRWR in PC. This increase is due to the higher absorption capacity of RCAs, which increased internal friction within the concrete matrix, reducing workability and consequently requiring more HRWR.
  • The porosity of PC increased by up to 28.7% with the addition of RCAs. The lowest density, 1851 kg/m3, was observed in the mixture containing 50% RCAs and a w/b ratio of 0.3. This reduction can be attributed to the porous nature of RCAs and the increased mixing water, both of which contribute to a lower concrete density.
  • The compressive strength decreased with the addition of RCAs and SBR but was regained by incorporating SF and/or lowering the w/b ratio. Conversely, the inclusion of SBR improved the splitting tensile strength, which can be attributed to the strengthened bonding within the concrete matrix.
  • The results for abrasion resistance mirrored those of compressive strength, suggesting that preserving sufficient abrasion resistance when using RCAs requires lowering the w/b ratio and/or including SF and SBR.
  • Permeability values exceeding 7 mm/s were recorded in PC mixes containing a w/b ratio of 0.25–0.35, RCA replacement rates between 25% and 50%, SF replacement rates between 2.5% and 7.5%, and SBR addition rates ranging from 4% to 12%.
  • Regardless of the RCA levels, repeated freeze–thaw cycles damaged and weakened the Portland Cement samples, leading to reduced compressive strength. However, lowering the w/b ratio and/or adding SBR helped mitigate this damage, despite the resulting decrease in density.
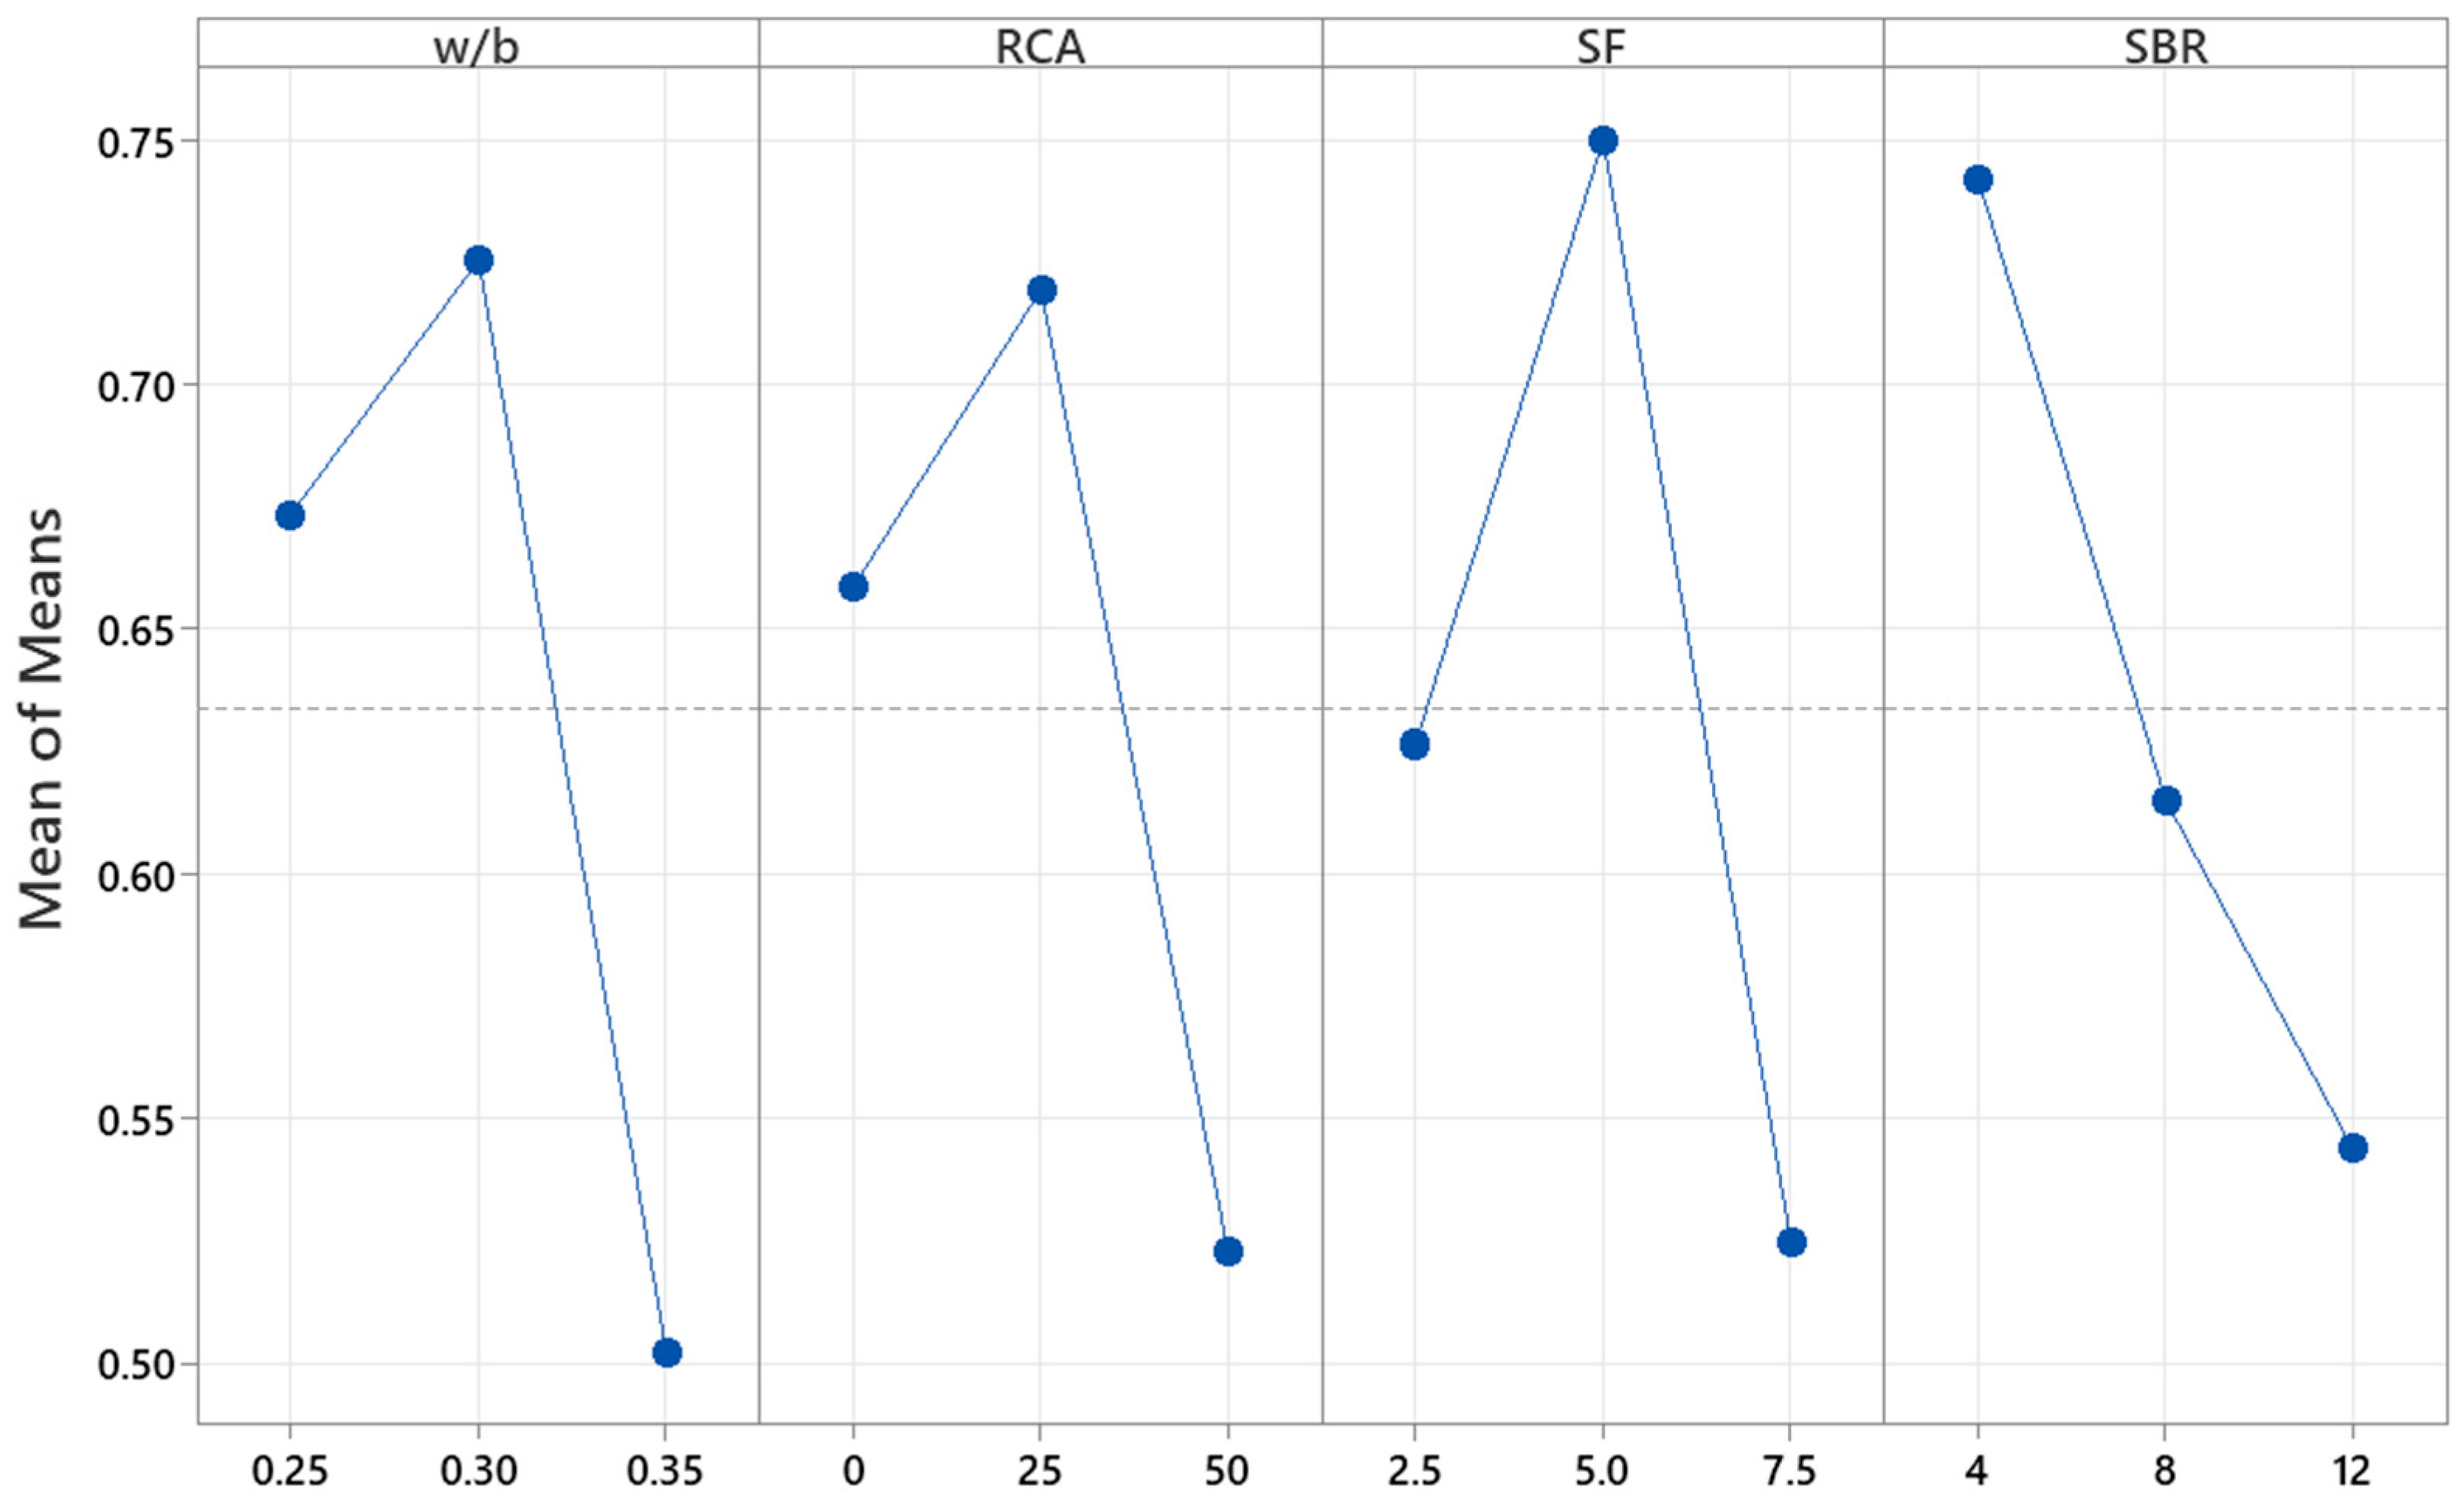
  • The multi-objective optimization analysis revealed that the best performance for PC is achieved with a w/b ratio of 0.30, RCAs of 25%, SF replacement of 5%, and SBR replacement of 4%. Meanwhile, ANOVA results revealed that the mechanical and durability properties were primarily influenced by the w/b ratio and RCA content. While the inclusion of SBR in the mix improved the mechanical performance, it had a limited impact on durability, thereby promoting its use in PC incorporating RCAs.

Author Contributions

Conceptualization, A.E.-M. and J.J.A.; methodology, A.E.-M., P.T. and H.E.-H.; software, F.B. and D.N.; validation, A.E.-M., H.E.-H. and M.G.; formal analysis, H.E.-H. and A.E.-M.; investigation, A.E.-M., P.T., D.N., F.B. and H.E.-H.; resources, A.E.-M.; data curation, P.T. and A.E.-M.; writing—original draft preparation, P.T. and A.E.-M.; writing—review and editing, J.J.A., D.N., F.B. and H.E.-H.; visualization, P.T. and M.G.; supervision, A.E.-M. and J.J.A.; project administration, A.E.-M. and J.J.A.; funding acquisition, A.E.-M. All authors have read and agreed to the published version of the manuscript.

Funding

The authors acknowledge the financial support of the University of Balamand (UOB) under research grant RGA/FOE/22-23/006.

Data Availability Statement

Data is available upon request from the corresponding author.

Acknowledgments

The technical support of the laboratory engineer and staff at UOB is also acknowledged and greatly appreciated.

Conflicts of Interest

The authors declare no conflicts of interest.

References

  1. Abina, A.; Puc, U.; Zidanšek, A. Challenges and Opportunities of Terahertz Technology in Construction and Demolition Waste Management. J. Environ. Manag. 2022, 315, 115118. [Google Scholar] [CrossRef] [PubMed]
  2. Uratani, J.M.; Griffiths, S. A Forward Looking Perspective on the Cement and Concrete Industry: Implications of Growth and Development in the Global South. Energy Res. Soc. Sci. 2023, 97, 102972. [Google Scholar] [CrossRef]
  3. El-Dieb, A.S.; Taha, M.R.; Kanaan, D.; Aly, S.T. Ceramic Waste Powder: From Landfill to Sustainable Concretes. Proc. Inst. Civ. Eng.-Constr. Mater. 2017, 171, 109–116. [Google Scholar] [CrossRef]
  4. Jahami, A.; Younes, H.; Khatib, J. Enhancing Reinforced Concrete Beams: Investigating Steel Dust as a Cement Substitute. Infrastructures 2023, 8, 157. [Google Scholar] [CrossRef]
  5. Yavuz, D.; Yazıcı, Ş. Experimental Study of Aggregate Size and Gradation on Pervious Concretes’ Mechanic, Hydraulic, and Surface Properties. Struct. Concr. 2023, 24, 5451–5464. [Google Scholar] [CrossRef]
  6. Ouyang, K.; Shi, C.; Chu, H.; Guo, H.; Song, B.; Ding, Y.; Guan, X.; Zhu, J.; Zhang, H.; Wang, Y.; et al. An Overview on the Efficiency of Different Pretreatment Techniques for Recycled Concrete Aggregate. J. Clean. Prod. 2020, 263, 121264. [Google Scholar] [CrossRef]
  7. Zhan, P.; Xu, J.; Wang, J.; Zuo, J.; He, Z. A Review of Recycled Aggregate Concrete Modified by Nanosilica and Graphene Oxide: Materials, Performances and Mechanism. J. Clean. Prod. 2022, 375, 134116. [Google Scholar] [CrossRef]
  8. Majhi, R.K.; Nayak, A.N.; Mukharjee, B.B. Development of Sustainable Concrete Using Recycled Coarse Aggregate and Ground Granulated Blast Furnace Slag. Constr. Build. Mater. 2018, 159, 417–430. [Google Scholar] [CrossRef]
  9. Matar, P.; Assaad, J.J. Concurrent Effects of Recycled Aggregates and Polypropylene Fibers on Workability and Key Strength Properties of Self-Consolidating Concrete. Constr. Build. Mater. 2019, 199, 492–500. [Google Scholar] [CrossRef]
  10. El-Hassan, H.; Kianmehr, P.; Zouaoui, S. Properties of Pervious Concrete Incorporating Recycled Concrete Aggregates and Slag. Constr. Build. Mater. 2019, 212, 164–175. [Google Scholar] [CrossRef]
  11. Maduabuchukwu Nwakaire, C.; Poh Yap, S.; Chuen Onn, C.; Wah Yuen, C.; Adebayo Ibrahim, H. Utilisation of Recycled Concrete Aggregates for Sustainable Highway Pavement Applications; a Review. Constr. Build. Mater. 2020, 235, 117444. [Google Scholar] [CrossRef]
  12. Alzard, M.H.; El-Hassan, H.; El-Maaddawy, T. Environmental and Economic Life Cycle Assessment of Recycled Aggregates Concrete in the United Arab Emirates. Sustainability 2021, 13, 10348. [Google Scholar] [CrossRef]
  13. Lu, J.X.; Yan, X.; He, P.; Poon, C.S. Sustainable Design of Pervious Concrete Using Waste Glass and Recycled Concrete Aggregate. J. Clean. Prod. 2019, 234, 1102–1112. [Google Scholar] [CrossRef]
  14. Liu, T.; Wang, Z.; Zou, D.; Zhou, A.; Du, J. Strength Enhancement of Recycled Aggregate Pervious Concrete Using a Cement Paste Redistribution Method. Cem. Concr. Res. 2019, 122, 72–82. [Google Scholar] [CrossRef]
  15. Verian, K.P.; Ashraf, W.; Cao, Y. Properties of Recycled Concrete Aggregate and Their Influence in New Concrete Production. Resour. Conserv. Recycl. 2018, 133, 30–49. [Google Scholar] [CrossRef]
  16. AlShareedah, O.; Nassiri, S. Pervious Concrete Mixture Optimization, Physical, and Mechanical Properties and Pavement Design: A Review. J. Clean. Prod. 2021, 288, 125095. [Google Scholar] [CrossRef]
  17. Güneyisi, E.; Gesoğlu, M.; Kareem, Q.; İpek, S. Effect of Different Substitution of Natural Aggregate by Recycled Aggregate on Performance Characteristics of Pervious Concrete. Mater. Struct. Constr. 2016, 49, 521–536. [Google Scholar] [CrossRef]
  18. ACI Committee 522. Pervious Concrete; Report No. 522R-10; American Concrete Institute: Farmington Hills, MI, USA, 2010; p. 40. [Google Scholar]
  19. Akand, L.; Yang, M.; Gao, Z. Characterization of Pervious Concrete through Image Based Micromechanical Modeling. Constr. Build. Mater. 2016, 114, 547–555. [Google Scholar] [CrossRef]
  20. Zhang, Y.; Li, H.; Abdelhady, A.; Yang, J. Comparative laboratory measurement of pervious concrete permeability using constant-head and falling-head permeameter methods. Constr. Build. Mater. 2020, 263, 120614. [Google Scholar] [CrossRef]
  21. Schaefer, V.R.; Wang, K. Mix Design Development for Pervious Concrete in Cold Weather Climates. Available online: https://www.cptechcenter.org/research/completed/mix-design-development-for-pervious-concrete-in-cold-weather-climates/ (accessed on 1 May 2025).
  22. Zhong, R.; Leng, Z.; Poon, C. Research and Application of Pervious Concrete as a Sustainable Pavement Material: A State-of-the-Art and State-of-the-Practice Review. Constr. Build. Mater. 2018, 183, 544–553. [Google Scholar] [CrossRef]
  23. Wang, Y.; Sun, M.; Song, B. Public Perceptions of and Willingness to Pay for Sponge City Initiatives in China. Resour. Conserv. Recycl. 2017, 122, 11–20. [Google Scholar] [CrossRef]
  24. Zhang, Y.; Li, H.; Abdelhady, A.; Yang, J. Effect of Different Factors on Sound Absorption Property of Porous Concrete. Transp. Res. Part D Transp. Environ. 2020, 87, 102532. [Google Scholar] [CrossRef]
  25. Haselbach, L.; Poor, C.; Tilson, J. Dissolved Zinc and Copper Retention from Stormwater Runoff in Ordinary Portland Cement Pervious Concrete. Constr. Build. Mater. 2014, 53, 652–657. [Google Scholar] [CrossRef]
  26. Brand, A.S.; Roesler, J. Interfacial Transition Zone of Cement Composites with Recycled Concrete Aggregate of Different Moisture States. Adv. Civ. Eng. Mater. 2018, 7, 87–102. [Google Scholar] [CrossRef]
  27. Brand, A.S.; Roesler, J.R.; Salas, A. Initial Moisture and Mixing Effects on Higher Quality Recycled Coarse Aggregate Concrete. Constr. Build. Mater. 2015, 79, 83–89. [Google Scholar] [CrossRef]
  28. Jahami, A.; Zeaiter, N.; Cheaib, M. Reviewing the Potential: A Comprehensive Review of Natural Fibers (NFs) in Structural Concrete and Their Multifaceted Influences. Innov. Infrastruct. Solut. 2024, 9, 102. [Google Scholar] [CrossRef]
  29. Siddique, R. Utilization of Silica Fume in Concrete: Review of Hardened Properties. Resour. Conserv. Recycl. 2011, 55, 923–932. [Google Scholar] [CrossRef]
  30. Hama, S.M.; Hamadi, E.F.; Jahami, A. Structural Behavior of Reinforced Fibrous Concrete Beams Incorporating Nano Silicon Dioxide Powder. Eng. Rep. 2025, 7, e13078. [Google Scholar] [CrossRef]
  31. Yang, J.; Jiang, G. Experimental Study on Properties of Pervious Concrete Pavement Materials. Cem. Concr. Res. 2003, 33, 381–386. [Google Scholar] [CrossRef]
  32. Chen, Y.; Wang, K.; Wang, X.; Zhou, W. Strength, Fracture and Fatigue of Pervious Concrete. Constr. Build. Mater. 2013, 42, 97–104. [Google Scholar] [CrossRef]
  33. Bilal, H.; Gao, X.; Cavaleri, L.; Khan, A.; Ren, M. Mechanical, Durability, and Microstructure Characterization of Pervious Concrete Incorporating Polypropylene Fibers and Fly Ash/Silica Fume. J. Compos. Sci. 2024, 8, 456. [Google Scholar] [CrossRef]
  34. Liu, R.; Liu, H.; Sha, F.; Yang, H.; Zhang, Q.; Shi, S.; Zheng, Z. Investigation of the Porosity Distribution, Permeability, and Mechanical Performance of Pervious Concretes. Processes 2018, 6, 78. [Google Scholar] [CrossRef]
  35. Fu, T.C.; Yeih, W.; Chang, J.J.; Huang, R. The Influence of Aggregate Size and Binder Material on the Properties of Pervious Concrete. Adv. Mater. Sci. Eng. 2014, 2014, 963971. [Google Scholar] [CrossRef]
  36. Selvakumar, M.; Geetha, S.; Muthu Lakshmi, S. Optimization of Pervious Concrete with Polymer for Efficient Storm Water Run-Off. Mater. Today Proc. 2022, 64, 995–999. [Google Scholar] [CrossRef]
  37. Assaad, J.J.; El Mir, A. Durability of Polymer-Modified Lightweight Flowable Concrete Made Using Expanded Polystyrene. Constr. Build. Mater. 2020, 249, 118764. [Google Scholar] [CrossRef]
  38. Grinys, A.; Augonis, A.; Daukšys, M.; Pupeikis, D. Mechanical Properties and Durability of Rubberized and SBR Latex Modified Rubberized Concrete. Constr. Build. Mater. 2020, 248, 118584. [Google Scholar] [CrossRef]
  39. Bilal, H.; Chen, T.; Ren, M.; Gao, X.; Su, A. Influence of Silica Fume, Metakaolin & SBR Latex on Strength and Durability Performance of Pervious Concrete. Constr. Build. Mater. 2021, 275, 122124. [Google Scholar] [CrossRef]
  40. Borhan, T.M.; Al Karawi, R.J. Experimental Investigations on Polymer Modified Pervious Concrete. Case Stud. Constr. Mater. 2020, 12, e00335. [Google Scholar] [CrossRef]
  41. Peng, Y.; Zhao, G.; Qi, Y.; Zeng, Q. In-Situ Assessment of the Water-Penetration Resistance of Polymer Modified Cement Mortars by μ-XCT, SEM and EDS. Cem. Concr. Compos. 2020, 114, 103821. [Google Scholar] [CrossRef]
  42. Giustozzi, F. Polymer-Modified Pervious Concrete for Durable and Sustainable Transportation Infrastructures. Constr. Build. Mater. 2016, 111, 502–512. [Google Scholar] [CrossRef]
  43. Pindado, M.Á.; Aguado, A.; Josa, A. Fatigue Behavior of Polymer-Modified Porous Concretes. Cem. Concr. Res. 1999, 29, 1077–1083. [Google Scholar] [CrossRef]
  44. Kantasiri, T.; Kasemsiri, P.; Pongsa, U.; Posi, P.; Chindaprasirt, P. Optimization of Concrete Containing Waste Crumb Rubber Mix Design for Thermal Insulating Applications Using Taguchi Method. Constr. Build. Mater. 2024, 434, 136636. [Google Scholar] [CrossRef]
  45. Yildizel, S.A.; Özkılıç, Y.O.; Yavuz, A. Optimization of Waste Tyre Steel Fiber and Rubber Added Foam Concretes Using Taguchi Method and Artificial Neural Networks. Structures 2024, 61, 106098. [Google Scholar] [CrossRef]
  46. Vinod, B. Characterization and Preparation of Eco-Friendly Foamed Concrete Using a Foaming Agent: Optimizing the Design by Taguchi Analysis. J. Build. Eng. 2024, 88, 109068. [Google Scholar] [CrossRef]
  47. ASTM C150; Standard Specification for Portland Cement. ASTM: West Conshohocken, PA, USA, 2020.
  48. ASTM C1240; Standard Specification for Silica Fume Used in Cementitious Mixtures. ASTM: West Conshohocken, PA, USA, 2015.
  49. ASTM C33/C33M; Standard Specification for Concrete Aggregates. ASTM: West Conshohocken, PA, USA, 2023.
  50. ASTM C494; Standard Specification for Chemical Admixtures for Concrete. ASTM: West Conshohocken, PA, USA, 2017.
  51. El-Mir, A.; Nehme, S.; Assaad, J. Magazine of Civil Engineering Feasibility of Concrete Mixtures Containing Coarse and/or Fine Recycled Brick Aggregates. Mag. Civ. Eng. 2022, 116, 11603. [Google Scholar] [CrossRef]
  52. Pereira da Costa, F.B.; Haselbach, L.M.; da Silva Filho, L.C.P. Pervious Concrete for Desired Porosity: Influence of w/c Ratio and a Rheology-Modifying Admixture. Constr. Build. Mater. 2021, 268, 121084. [Google Scholar] [CrossRef]
  53. ASTM C39; Standard Test Method for Compressive Strength of Cylindrical Concrete Specimens. ASTM: West Conshohocken, PA, USA, 2020.
  54. ASTM C496; Standard Test Method for Splitting Tensile Strength of Cylindrical Concrete Specimens. ASTM: West Conshohocken, PA, USA, 2017.
  55. ASTM C1754; Standard Test Method for Determining Potential Resistance to Degradation of Pervious Concrete by Impact and Abrasion. ASTM: West Conshohocken, PA, USA, 2011.
  56. ASTM C1747; Standard Test Method for Density and Void Content of Hardened Pervious Concrete. ASTM: West Conshohocken, PA, USA, 2021.
  57. Safiuddin, M.D.; Salam, M.A.; Jumaat, M.Z. Effects of Recycled Concrete Aggregate on the Fresh Properties of Self-Consolidating Concrete. Arch. Civ. Mech. Eng. 2011, 11, 1023–1041. [Google Scholar] [CrossRef]
  58. Xu, C.; Li, Q.; Wang, P.; Fan, Q.; Kong, Z.; Wang, L.; Yue, G.; Zheng, S.; Shao, C.; Guo, Y. Theoretical Porosity Design, Mechanical Properties, and Durability of Large-Pore Sandy Recycled Concrete. Case Stud. Constr. Mater. 2024, 21, e03655. [Google Scholar] [CrossRef]
  59. El-Mir, A.; Fayad, T.; Assaad, J.J.; Ezzedine El Dandachy, M.; Khatib, J.; El-Hassan, H. Multi-criteria optimization of SBR-modified mortar incorporating polyethylene terephthalate waste. Case Stud. Constr. Mat. 2024, 20, e03295. [Google Scholar] [CrossRef]
  60. Kevern, J.T.; Schaefer, V.R.; Wang, K. Mixture Proportion Development and Performance Evaluation of Pervious Concrete for Overlay Applications; American Concrete Institute: Farmington Hills, MI, USA, 2011; Available online: https://www.concrete.org/publications/internationalconcreteabstractsportal.aspx?m=details&id=51683117 (accessed on 1 May 2025).
  61. Siddique, R.; Bennacer, R. Resources, Conservation and Recycling Use of Iron and Steel Industry by-Product (GGBS) in Cement Paste and Mortar. Resour. Conserv. Recycl. 2012, 69, 29–34. [Google Scholar] [CrossRef]
  62. Seifeddine, K.; Amziane, S.; Toussaint, E. State of the Art on the Mechanical Properties of Pervious Concrete. Eur. J. Environ. Civ. Eng. 2022, 26, 7727–7755. [Google Scholar] [CrossRef]
  63. Ribeiro, M.S.S.; Gonçalves, A.F.; Branco, F.A.B. Styrene-Butadiene Polymer Action on Compressive and Tensile Strengths of Cement Mortars. Mater. Struct. Constr. 2008, 41, 1263–1273. [Google Scholar] [CrossRef]
  64. Ohama, Y. Handbook of Polymer-modified Concrete and Mortars: Properties and Process Technology; Noyes Publications: Saddle River, NJ, USA, 1995. [Google Scholar]
  65. Sakka, F.E.; Assaad, J.J.; Hamzeh, F.R.; Nakhoul, C. Thixotropy and Interfacial Bond Strengths of Polymer-Modified Printed Mortars. Mater. Struct. Constr. 2019, 52, 79. [Google Scholar] [CrossRef]
  66. Xiao, S.; Cheng, H.; Que, Z.; Liu, T.; Zou, D. Enhancing Marine Anti-Washout Concrete: Optimal Silica Fume Usage for Improved Compressive Strength and Abrasion Resistance. Constr. Build. Mater. 2024, 428, 136262. [Google Scholar] [CrossRef]
  67. Tennis, P.; Leming, M.L.; Akers, D.J. Pervious Concrete Pavements; Portland Cement Association and National Ready Mixed Concrete Association: Skokie, IL, USA; Silver Spring, MD, USA, 2004; Available online: https://trid.trb.org/View/813983 (accessed on 1 May 2025).
  68. Doğan, M.; Bideci, A. Effect of Styrene Butadiene Copolymer (SBR) admixture on high strength concrete. Constr. Build. Mater. 2016, 112, 378–385. [Google Scholar] [CrossRef]
  69. Ebrahimi, K.; Daiezadeh, M.J.; Zakertabrizi, M.; Zahmatkesh, F.; Habibnejad Korayem, A. A Review of the Impact of Micro- and Nanoparticles on Freeze-Thaw Durability of Hardened Concrete: Mechanism Perspective. Constr. Build. Mater. 2018, 186, 1105–1113. [Google Scholar] [CrossRef]
  70. Craeye, B.; Cockaerts, G.; Kara De Maeijer, P. Improving Freeze–Thaw Resistance of Concrete Road Infrastructure by Means of Superabsorbent Polymers. Infrastructures 2018, 3, 4. [Google Scholar] [CrossRef]
  71. Zheng, X.; Wang, Y.; Zhang, S.; Xu, F.; Zhu, X.; Jiang, X.; Zhou, L.; Shen, Y.; Chen, Q.; Yan, Z.; et al. Research Progress of the Thermophysical and Mechanical Properties of Concrete Subjected to Freeze-Thaw Cycles. Constr. Build. Mater. 2022, 330, 127254. [Google Scholar] [CrossRef]
  72. El-Mir, A.; Najm, O.; El-Hassan, H.; El-Dieb, A.; Alzamly, A. Enhancing the electrical conductivity of concrete using metal-organic frameworks. Constr. Build. Mater. 2024, 425, 136061. [Google Scholar] [CrossRef]
Figure 1. Photos of the (a) compression machine; (b) porosity test; (c) permeability setup [44]; (d) abrasion machine.
Jcs 09 00372 g001aJcs 09 00372 g001b
Figure 2. Variation in HRWR demand for different PC mixtures.
Jcs 09 00372 g002
Figure 3. Variation in density and porosity for different PC mixtures.
Jcs 09 00372 g003
Figure 4. Contour plots of compressive strength vs. different design factors.
Jcs 09 00372 g004
Figure 5. Contour plots of splitting tensile strength vs. different design factors.
Jcs 09 00372 g005aJcs 09 00372 g005b
Figure 6. Contour plots of mass loss due to abrasion vs. different design factors.
Jcs 09 00372 g006aJcs 09 00372 g006b
Figure 7. Permeability vs. different design factors.
Jcs 09 00372 g007
Figure 8. Ratio of compressive strength after freeze–thaw cycles vs. various design factors.
Jcs 09 00372 g008
Figure 9. Effect of the design factors on the mean S/N ratio of TOPSIS.
Jcs 09 00372 g009
Table 1. Factors with specified levels were established for the SBR-modified PC containing RCAs.
Factor, FLevels
123
F1: w/b, by mass0.350.300.25
F2: RCA replacement, % by mass02550
F3: SF replacement rate, % by mass2.55.07.5
F4: SBR addition rate, % by mass4812
Table 2. Proportions of investigated PC mixtures containing RCAs, SF, and SBR.
Mix
No.
Mix Code *w/b RCA Replacement,
% Mass
SF Replacement
Rate, % Mass
SBR Addition
Rate, % Mass
10.35B-0R-2.5F-4S0.3502.54
20.35B-25R-5.0F-8S0.352558
30.35B-50R-7.5F-12S0.35507.512
40.30B-0R-5.0F-12S0.300512
50.30B-25R-7.5F-4S0.30257.54
60.30B-50R-2.5F-8S0.30502.58
70.25B-0R-7.5F-8S0.2507.58
80.25B-25R-2.5F-12S0.25252.512
90.25B-50R-5.0F-4S0.255054
* w/b-RCA%-SF replacement rate of % cement mass-SBR addition rate.
Table 3. Summary of properties of PC mixtures.
Mix
Codification
Density,
kg/m3
HRWR, %Porosity, %Compressive
Strength,
MPa
Splitting
Tensile Strength,
MPa
Permeability,
mm/s
Abrasion Resistance,
%
* Residual
Compressive
Strength, MPa
0.35B-0R-2.5F-4S20400.5113.510.91.13.5048.58.1
0.35B-25R-5.0F-8S20210.7819.59.81.34.7346.56.9
0.35B-50R-7.5F-12S18650.9028.77.20.68.2362.35.5
0.30B-0R-5.0F-12S21071.1020.211.11.25.2740.99.7
0.30B-25R-7.5F-4S20451.6023.911.21.37.6545.79.5
0.30B-50R-2.5F-8S18510.8721.88.20.96.9361.97.3
0.25B-0R-7.5F-8S19600.4316.610.11.02.2446.59.0
0.25B-25R-2.5F-12S19670.2316.68.91.05.4850.28.6
0.25B-50R-5.0F-4S19281.3019.411.51.45.3737.79.0
* Compressive strength results after freeze–thaw cycles.
Table 4. Role of various factors on PC properties.
Performance IndicatorS/N Goal ResponseRank (r)Normalized r
DensitySmaller is better90.167
Compressive StrengthLarger is better90.167
PermeabilityLarger is better90.167
Freeze and thaw resistanceSmaller is better90.167
Table 5. Percentage of contribution of parameters to mechanical and durability properties.
Propertyw/bRCASFSBR
Density5.571.213.99.5
Compressive strength41.828.320.99.0
Splitting tensile strength 10.021.236.232.6
Permeability26.356.10.117.5
Abrasion resistance47.116.216.520.2
Freeze–thaw resistance52.928.84.014.4
Table 6. Summary of ANOVA components for density.
SourceDFSeq SSAdj SSAdj MS
w/b20.060.060.03
RCA20.810.810.41
SF20.160.160.08
SBR20.110.110.05
Table 7. Summary of ANOVA components for permeability.
SourceDFSeq SSAdj SSAdj MS
w/b226.2326.2313.11
RCA255.8555.8527.92
SF20.050.050.03
SBR217.4717.478.74
Table 8. Summary of ANOVA components for abrasion resistance.
SourceDFSeq SSAdj SSAdj MS
w/b22.782.781.39
RCA22.722.721.36
SF27.927.923.96
SBR23.403.401.70
Table 9. Summary of ANOVA components for freeze–thaw resistance.
SourceDFSeq SSAdj SSAdj MS
w/b210.7610.765.38
RCA25.875.872.93
SF20.810.810.40
SBR22.932.931.46
Disclaimer/Publisher’s Note: The statements, opinions and data contained in all publications are solely those of the individual author(s) and contributor(s) and not of MDPI and/or the editor(s). MDPI and/or the editor(s) disclaim responsibility for any injury to people or property resulting from any ideas, methods, instructions or products referred to in the content.

