Article

Time-Dependent Rheological Behavior and MPS Simulation of Cement–Bentonite Slurries with Hydration Accelerators for Borehole Backfilling Applications

1
College of Engineering, Shibaura Institute of Technology, Tokyo 135-8548, Japan
2
Toyoken Co., Ltd., Aichi 456-0034, Japan
3
Sanko Colloid Chemical Co., Ltd., Aichi 481-0045, Japan
*
Author to whom correspondence should be addressed.
J. Compos. Sci. 2025, 9(7), 361; https://doi.org/10.3390/jcs9070361
Submission received: 20 June 2025 / Revised: 9 July 2025 / Accepted: 9 July 2025 / Published: 10 July 2025

Abstract

This study investigates cement–bentonite slurries with hydration accelerators for borehole backfilling applications in infrastructure reconstruction projects. Two formulations with different accelerator dosages (5 and 10 kg/m3) were evaluated through combined experimental testing and Moving Particle Semi-implicit (MPS) numerical modeling to optimize material performance. The research focuses on time-dependent rheological evolution and its impact on construction performance, particularly bleeding resistance and workability retention. Experimental flow tests revealed that both formulations maintained similar initial flowability (240–245 mm spread diameter), but the higher accelerator dosage resulted in 33% flow reduction after 60 min compared to 12% for the lower dosage. Bleeding tests demonstrated significant improvement in phase stability, with bleeding rates reduced from 2.5% to 1.5% when accelerator content was doubled. The MPS framework successfully reproduced experimental behavior with prediction accuracies within 3%, enabling quantitative analysis of time-dependent rheological parameters through inverse analysis. The study revealed that yield stress evolution governs both flow characteristics and bleeding resistance, with increases several hundred percent over 60 min while plastic viscosity remained relatively constant. Critically, simulations incorporating time-dependent viscosity changes accurately predicted bleeding behavior, while constant-viscosity models overestimated bleeding rates by 60–130%. The higher accelerator formulation (10 kg/m3) provided an optimal balance between initial workability and long-term stability for typical borehole backfilling operations. This integrated experimental–numerical approach provides practical insights for material optimization in infrastructure reconstruction projects, particularly relevant for aging infrastructure requiring proper foundation treatment. The methodology offers construction practitioners a robust framework for material selection and performance prediction in borehole backfilling applications, contributing to improved construction quality and reduced project risks.

1. Introduction

Japan has experienced a significant increase in aging infrastructure requiring demolition, with over 20,000 public facilities scheduled for demolition between 2012 and 2022 and a projected 45% increase in the coming decade [1]. This trend is particularly evident in structures built during Japan’s rapid economic growth period (1955–1973), many of which have exceeded their 50–60 year designed service life, with approximately 43% of reinforced concrete structures built before 1980 now requiring major renovation or demolition [2].
When structures are dismantled, remaining pile foundations, classified as industrial waste under Japanese regulations, must be extracted rather than crushed underground [3,4]. Following extraction, the resulting boreholes require proper backfilling to prevent issues such as ground subsidence, displacement of newly installed piles, and broader stability failures that could compromise adjacent structures [5]. A survey found that approximately 18% of foundation-related construction defects were attributable to improper backfilling [6,7].
Three primary materials are commonly used for backfilling: earth fill, fluidized soil, and cement–bentonite slurries. Among these, cement–bentonite slurry has gained widespread acceptance due to its superior flowability, which enhances work efficiency during installation [8]. The slurry consists primarily of cement, bentonite, and water, with additives occasionally incorporated to modify specific properties. Compared to fluidized soil, it demonstrates better pumpability and can be delivered through pipes over longer distances, making it particularly suitable for urban construction sites with limited access [9,10].
However, conventional cement–bentonite slurries face notable limitations. To achieve high flowability, these slurries typically incorporate elevated water–cement ratios, which can lead to insufficient replacement of drilling mud during filling operations and phase segregation (bleeding) of the backfill material [11]. Previous studies have reported that conventional slurries with water–cement ratios exceeding 1.0 exhibited bleeding rates of 5–15%, resulting in strength variations up to 40% between top and bottom portions of backfilled holes [12]. Similarly, inadequate rheological properties have resulted in incomplete filling, with void ratios as high as 8% detected using cross-hole sonic logging [13].
These challenges highlight the critical need for backfilling materials that simultaneously exhibit excellent flowability, phase segregation resistance, and filling performance. Understanding and controlling the rheological properties of cement–bentonite slurries is essential, as these properties significantly influence all aspects of performance [14]. Traditional approaches to rheological assessment have relied primarily on empirical testing, with limited attention to numerical modeling of the complex time-dependent behavior that characterizes these materials [15].
Conventional numerical methods such as the finite element method (FEM) and computational fluid dynamics (CFD) encounter significant challenges when modeling cement–bentonite slurries. These grid-based approaches struggle to accurately represent large deformations, free surfaces, and phase segregation [16]. In contrast, the Moving Particle Semi-implicit (MPS) method offers several advantages as a mesh-free particle method that naturally handles large deformations without requiring grid regeneration, making it particularly suitable for simulating flow and settling behavior of highly fluid materials [17].
Recent advances in MPS modeling have enhanced its suitability for cement–bentonite slurry analysis [18,19]. However, these studies have not addressed the time-dependent rheological changes that occur during the critical period between mixing and final set, which significantly influence material performance in practical applications [20].
In this study, cement–bentonite slurries formulations with varying amounts of hydration accelerator were prepared as backfill materials. The objective was to comprehensively evaluate their rheological properties through laboratory testing and MPS numerical analysis. Specific goals included the following:
(1)
Assessing the flowability and phase segregation resistance of different formulations through standardized flow and bleeding tests.
(2)
Developing an MPS-based numerical model capable of reproducing the observed experimental behavior, with particular attention to time-dependent rheological changes.
(3)
Quantitatively investigating the effects of viscosity changes on flow behavior and phase segregation through sequential updating of rheological parameters in the numerical model.
(4)
Establishing relationships between material composition, rheological properties, and practical performance to guide the development of improved backfilling materials.
The main objective of this research is to develop and validate an integrated experimental–numerical methodology for optimizing cement–bentonite slurries with hydration accelerators for borehole backfilling applications. Specifically, this study aims to quantify the time-dependent rheological evolution of these materials and establish predictive capabilities for both flow behavior and phase segregation resistance through combined laboratory testing and MPS numerical modeling. This integrated approach enables systematic material optimization and provides practical guidelines for improving backfilling performance in infrastructure reconstruction projects, addressing the critical need for materials that simultaneously exhibit excellent flowability, phase stability, and placement efficiency.

2. Background and Literature Review

2.1. Classification and Properties of Backfill Materials

Backfill materials for boreholes created after pile extraction can be classified into three primary categories: earth fill, fluidized soil, and cement–bentonite slurries [5]. Earth fill, while economical, exhibits poor flowability and achieves only 80–85% of surrounding soil density even with specialized compaction equipment [21]. Fluidized soil offers improved flowability and strength (0.3–2.0 MPa), but its soil particles limit flowability in narrow spaces [22].
Cement–bentonite slurries consist of cement, bentonite clay, and water. The bentonite provides thixotropic properties that help maintain particle suspension, while cement provides strength development [23]. Typical formulations achieve flow spread diameters of 190–250 mm and unconfined compressive strengths of 0.5–3.0 MPa after 28 days. However, conventional slurries face challenges related to phase segregation when high water–cement ratios (exceeding 1.0) are used to achieve required flowability [24].

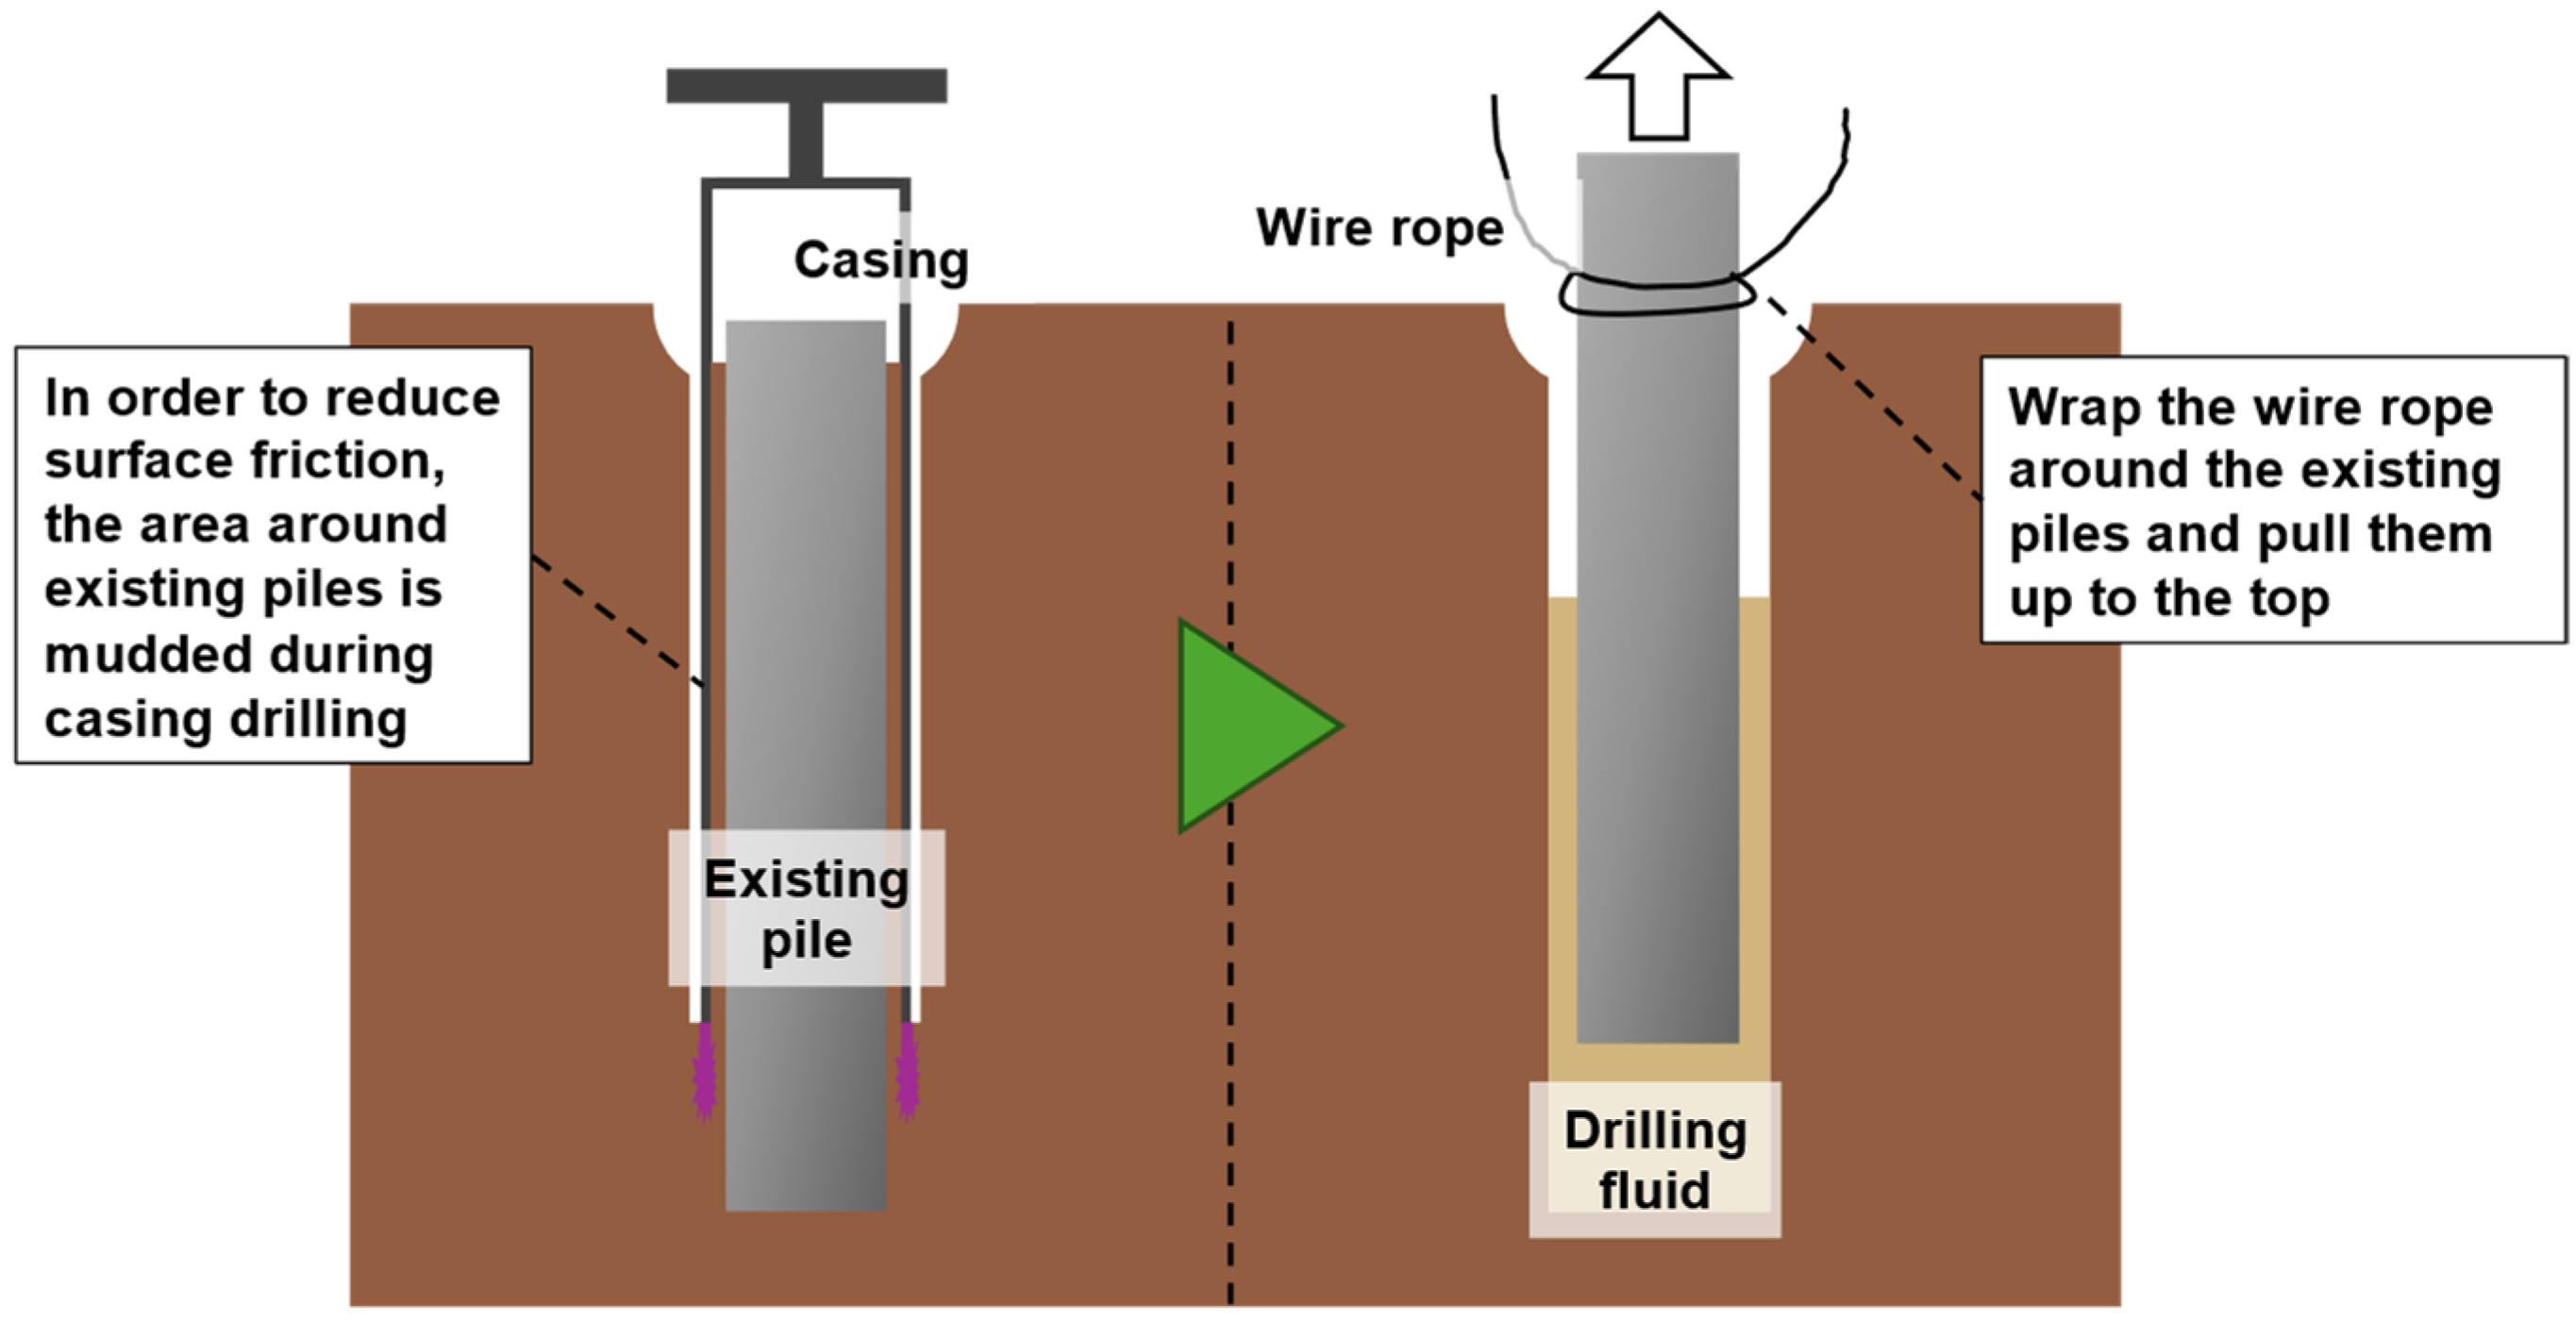
2.2. Extraction Methods and Backfilling Processes

Two primary methods are employed for extracting existing piles: the vibration method and the wire rope method (Figure 1) [5,25]. The vibration method, while operationally simple, is primarily effective for steel piles and generates considerable noise and vibration. The wire rope method involves placing a casing with an inside diameter slightly larger than the existing pile, excavating the surrounding soil through rotation and drilling fluid injection [5,25].
Backfilling processes vary depending on the extraction method. For the wire rope method, two approaches exist: top-down filling concurrent with pile extraction, and bottom-up filling after pile removal [26]. Top-down methods typically result in density variations of 15–25% throughout the borehole depth, while bottom-up filling techniques using tremie pipes achieve density variations of less than 10% [26]. Regardless of the approach, the rheological properties of the backfill material significantly influence its behavior during placement.

2.3. Previous Studies on Rheological Properties of Backfill Materials

Cement–bentonite slurries generally exhibit Bingham plastic behavior, characterized by yield stress ( τ y ) and plastic viscosity ( η ) [27,28]. Typical backfill formulations have yield stress values ranging from 5 to 30 Pa and plastic viscosity values of 0.05–0.3 Pa·s immediately after mixing. These parameters increase over time due to ongoing hydration reactions.
The time-dependent nature of cement–bentonite rheology presents challenges for characterization and modeling. Conventional rotational viscometry methods can disrupt the evolving microstructure through applied shear, potentially underestimating rheological parameters in undisturbed conditions [29]. Wang et al. (2021) [30] established that bleeding rate correlates inversely with yield stress, with materials exhibiting yield stress values above 20 Pa consistently achieving bleeding rates below 2%.
Hydration accelerators can effectively increase early-age yield stress development without significantly compromising initial flowability. Recent research has shown that the rate of yield stress development follows a sigmoidal pattern correlating with heat evolution during cement hydration, with rapid increases during the transition from induction to acceleration phases [31].

2.4. Application of Numerical Methods in Backfill Analysis

Conventional numerical methods such as the finite element method (FEM) and computational fluid dynamics (CFD) face limitations in modeling cement–bentonite slurries, particularly in representing large deformations and phase segregation phenomena [32]. The Moving Particle Semi-implicit (MPS) method has emerged as a promising alternative. Originally developed by Koshizuka et al. (2018) [33], MPS represents fluid as discrete particles interacting through kernel functions, eliminating the need for a computational grid.
Early applications of MPS to cementitious materials demonstrated its ability to predict flow behavior when implemented with appropriate rheological models [34]. Weng et al. (2018) [35] successfully employed MPS to simulate backfill material flow during spiral agitation, predicting mixing efficiency of different configurations.
For phase segregation modeling, multi-component MPS approaches have been developed to represent cement-based materials as mixtures of water and solid particles with distinct physical properties [36]. However, most existing simulations either assume constant rheological properties or implement simplified time functions that inadequately capture the complex evolution observed in real materials [37]. The present study aims to address these limitations by incorporating time-dependent rheological changes based on experimental measurements.

3. Materials and Methods

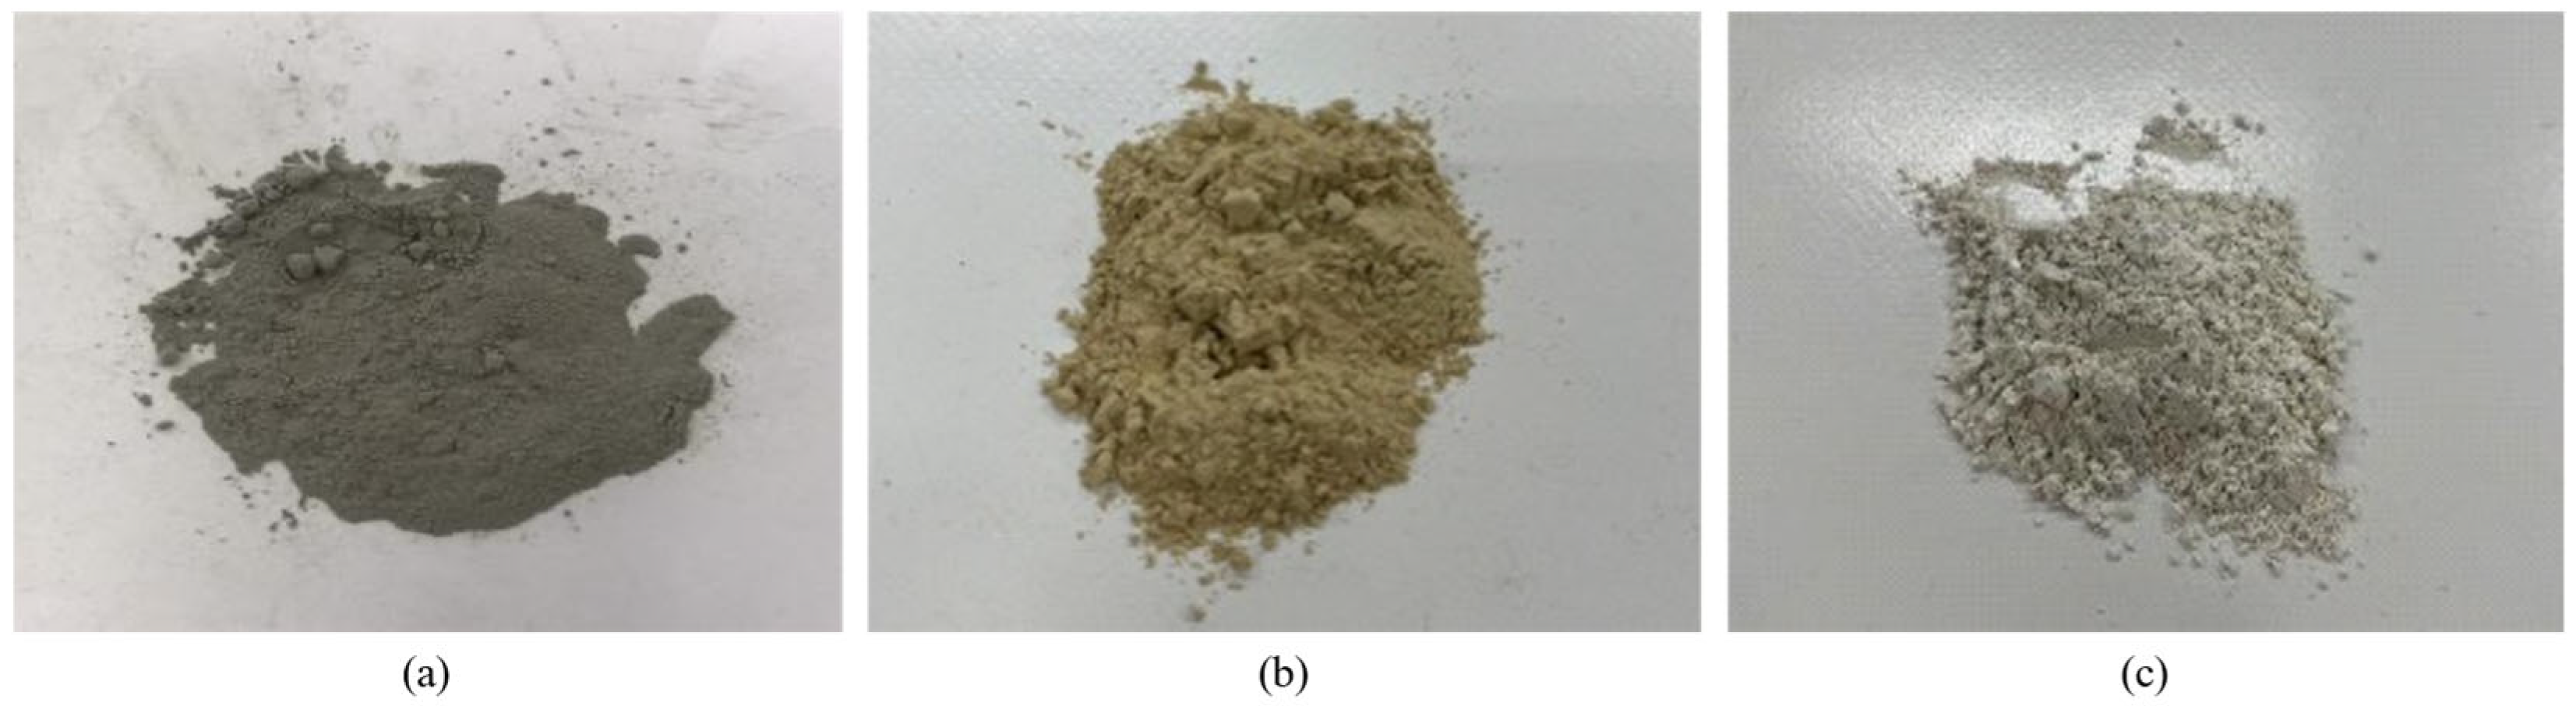
3.1. Materials and Mix Design

Two cement–bentonite slurries formulations were investigated (designated as Case-1 and Case-2), each containing ordinary Portland cement, bentonite clay, water, and varying amounts of hydration accelerator. Table 1 presents the detailed mixing proportions for each formulation. The cement content was standardized at 250 kg/m3 across all formulations, using Type I ordinary Portland cement conforming to JIS R 5210 with a specific gravity of 3.14 and Blaine fineness of 3300 cm2/g. The bentonite component, added at 25 kg/m3, was a sodium-activated montmorillonite clay with a specific gravity of 2.60 and moisture content below 12% [5].
The hydration accelerator (designated as EH in Table 1) was a commercial calcium-based product containing calcium nitrate and calcium nitrite. The dosage was varied between the two formulations (5 kg/m3 for Case-1 and 10 kg/m3 for Case-2) to systematically evaluate its effect on rheological development and phase segregation resistance [38]. Water content was adjusted to maintain consistent initial consistency across formulations, resulting in water–cement ratios of 3.64 and 3.63 for Case-1 and Case-2, respectively.
Figure 2 provides photographic documentation of the constituent materials used in this investigation, demonstrating the systematic material selection approach. The standardized mixing procedure using a laboratory-scale tabletop mixer at 600 rpm ensured consistent material preparation across all formulations.
The mixing procedure followed ASTM C305 “Standard Practice for Mechanical Mixing of Hydraulic Cement Pastes and Mortars of Plastic Consistency” [39] with modifications for bentonite incorporation based on JSCE-F 522 guidelines [40]. A laboratory-scale tabletop mixer operating at 600 rpm was used throughout the mixing sequence. The standardized protocol consisted of the following: (1) water addition, (2) hydration accelerator introduction with 1 min mixing per ASTM C305 requirements, (3) bentonite addition with 3 min mixing following established procedures for clay–cement systems [41], and (4) cement addition with 1 min final mixing to achieve homogeneous distribution.

3.2. Experimental Procedures

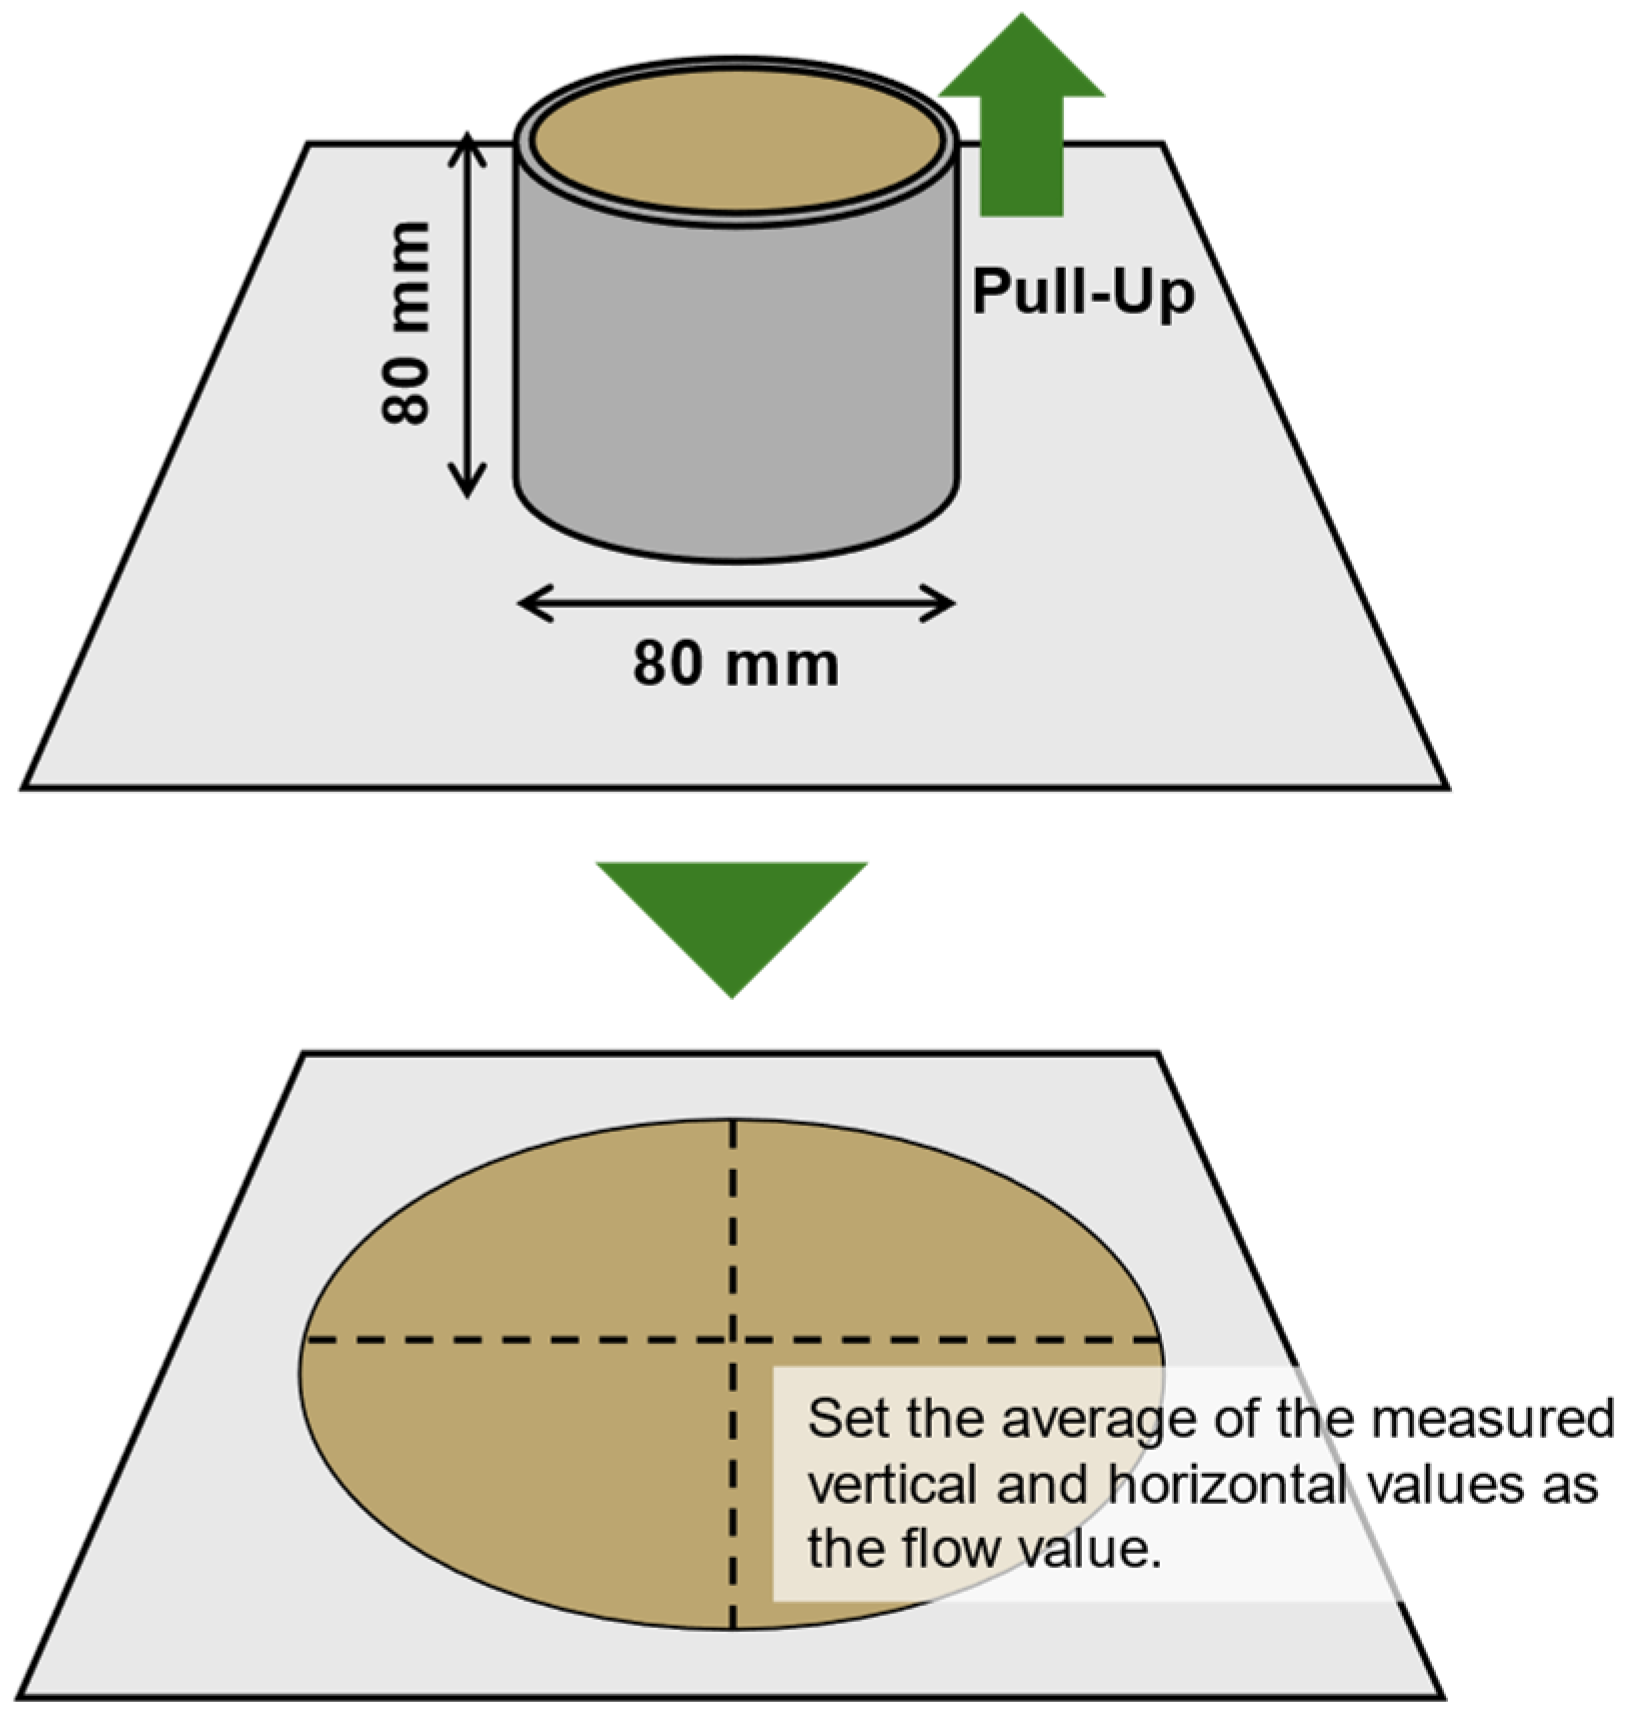
3.2.1. Flow Test Protocol

Flow tests were conducted to evaluate the flowability of the cement–bentonite slurries formulations and its evolution over time. The testing procedure followed JHS A 313 “Test Methods for Air-mixed Mortar and Air-mixed Milk (Cylinder Method)” [42]. The apparatus consisted of a brass cylinder with an internal diameter of 80 mm and a height of 80 mm, positioned on a flat, level glass plate marked with concentric circles at 10 mm intervals.
Figure 3 illustrates the complete experimental apparatus and procedural sequence, providing visual validation of the standardized testing methodology. The photographic documentation demonstrates the precision of cylinder positioning, slurry filling technique, and controlled lifting procedure that ensures reproducible flow measurements across all test conditions.
For each test, the freshly mixed slurry was filled into the brass cylinder in a single continuous operation. After a standardized waiting period, the cylinder was lifted vertically at a controlled rate to allow the slurry to flow freely under gravitational force. Once the flow had completely stopped, the final spread diameter was measured in two perpendicular directions and averaged as the flow spread diameter.
Tests were conducted immediately after mixing ( t = 0 min) and at subsequent intervals. Between measurements, the slurry was kept in a sealed container to prevent water evaporation and not disturbed to preserve the developing microstructure. The time required for flow stoppage was also recorded using a digital stopwatch and used to calibrate the plastic viscosity parameter in subsequent numerical simulations.
The systematic photographic documentation presented in Figure 3 not only validates the experimental methodology but also facilitates replication of the testing procedures by other researchers. The visual evidence demonstrates that the observed flow behavior patterns are directly attributable to material properties rather than experimental artifacts, strengthening the reliability of the quantitative flow measurements.

3.2.2. Bleeding Test Protocol

Bleeding tests were performed following JSCE F 522 “Test Method for Bleeding Rate and Expansion Rate of Injected Mortar of Prepacked Concrete (Polyethylene Bag Method)” [22]. The testing apparatus consisted of transparent polyethylene bags with 50 mm diameter and 300 mm height.
Figure 4 documents the complete bleeding test setup and temporal evolution of specimen behavior. The photographic evidence clearly demonstrates the progressive development of phase separation over the 24 h test period and provides visual confirmation of the enhanced phase stability achieved with higher accelerator content. The stark visual contrast between Case-1 and Case-2 specimens validates the quantitative bleeding rate measurements and supports the conclusions regarding accelerator effectiveness.
Freshly mixed slurry was poured into the bag to a height of 200 mm, and after a 24 h period at 20 ± 2 °C, the volume of clear water accumulated at the top of the specimen ( W b ) was measured. The bleeding rate ( B r ) was calculated using Equation (1):
B r = W b / V × 100
where V is the initial volume of the specimen. Three replicate tests were conducted for each formulation to ensure statistical reliability, with results reported as mean ± standard deviation. A target bleeding rate of less than 3% was established as the acceptability criterion [43]. The low standard deviations (≤0.3%) confirm the reproducibility of the test methodology and reliability of the measured values. Intermediate readings were also taken at 1, 3, 6, and 12 h to characterize the bleeding kinetics.

3.3. Numerical Simulation Framework

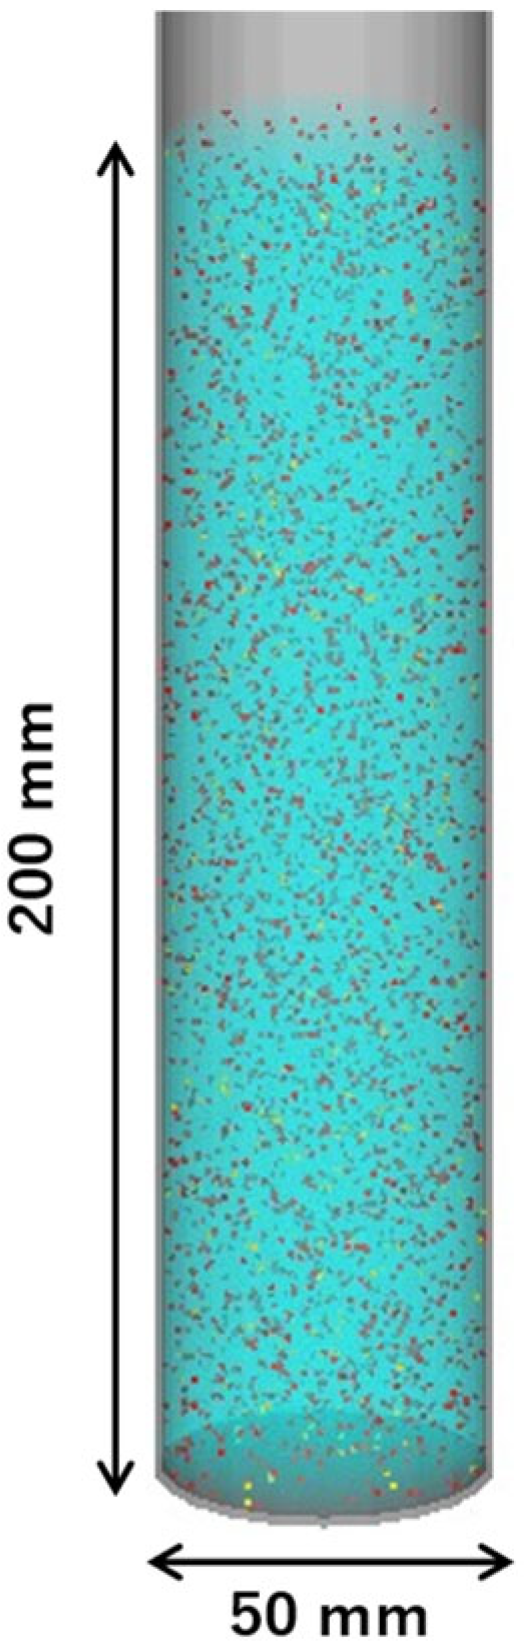
3.3.1. MPS Method Implementation

The Moving Particle Semi-implicit (MPS) method [33,44] was employed for numerical simulation of cement–bentonite slurries’ behavior. In this method, the continuum is represented by discrete particles that move according to the governing equations of fluid dynamics. The fundamental equations implemented are the continuity equation (Equation (2)) and the Navier–Stokes equation (Equation (3)):
D v D t = 1 ρ P + ν 2 v + g
D ρ D t = 0
where D v / D t is the matter derivative (acceleration vector): how fluid particles accelerate with time (m/s2), v is the velocity vector: the local velocity of the fluid (m/s), ρ is the density: mass per unit volume of the fluid (kg/m3), P is the pressure gradient vector: rate of change in pressure in space (Pa/m) = (N/m3), ν is the kinematic coefficient of viscosity: viscous properties of a fluid (viscosity/density) (m2/s), and 2 v is the Laplacian of the velocity vector: describes the diffusion of the velocity field (1/m2) × (m/s) = (m/s3), and D / D t is the substance derivative (Lagrange derivative): time variation while moving with fluid particles (kg/m3/s).
The MPS implementation included refinements to enhance numerical stability and accuracy, including a modified pressure gradient model, a higher-order Laplacian operator, and a particle shifting technique.

3.3.2. Rheological Modeling

Cement–bentonite slurries typically exhibit Bingham plastic behavior, characterized by a yield stress ( τ y ) that must be exceeded for flow to occur. To represent this behavior within the MPS framework, a bi-viscosity model was implemented (Figure 5) with constitutive equations for the flowing region (Equation (4)) and immobile region (Equation (5)):
For the flowing region Π Π c :
τ i j = P δ i j + 2 η + τ y Π ε ˙ i j ν p
For the immobile region Π < Π C :
τ i j = P δ i j + 2 η + τ y Π c ε ˙ i j ν
where τ i j is the stress tensor component (Pa), P is the pressure (Pa), δ i j is the Kronecker delta (–), η is the plastic viscosity (Pa·s), τ y is the yield stress (Pa), ε ˙ i j ν p is the strain rate tensor component (1/s), Π is the second invariant of the strain rate tensor, defined as Π = ε ˙ i j ε ˙ i j (s−2), Π c is the critical value of Π that delineates the flowing and immobile regions (1/s2), and ε ˙ i j ν is the strain rate tensor, usually a symmetric tensor (1/s).
The critical value Π c is related to the critical shear rate π c by Equation (6):
Π c = 2 π c 2
For time-dependent rheology, a sequential updating scheme was implemented to adjust rheological parameters based on experimental measurements.

3.3.3. Model Validation

Two distinct numerical models were developed: a flow test reproduction model and a bleeding test reproduction model. The flow test model (Figure 6) consisted of a cylindrical volume with 80 mm diameter and 80 mm height, discretized using particles with 2 mm diameter. Density values were calculated from the mixing proportions (Table 2), and the critical shear rate ( π c ) was fixed at 0.05 s−1 based on previous studies of cementitious materials.
The rheological parameters (yield stress and plastic viscosity) were determined through an iterative inverse analysis procedure by systematically adjusting these values until both the simulated flow diameter and stoppage time matched experimental observations as shown in Figure 7. This process was repeated for each time point to obtain the time evolution of rheological parameters.
The bleeding test model (Figure 8) consisted of a cylindrical volume with 50 mm diameter and 200 mm height, discretized using particles with 1 mm diameter. Unlike the flow test model, this model explicitly represented the multi-component nature of the material with three distinct particle types corresponding to water, cement, and bentonite (Table 3). To simulate bleeding, Stokes’ equation (Equation (7)) was incorporated as follows:
v = D 2 ρ p ρ f g 18 η
where v is the settling velocity (m/s), D is the particle diameter (m), ρ p is the density of settling particles (kg/m3), ρ f is the density of fluid (kg/m3), g is the gravitational acceleration (m/s2), and η is the viscosity of fluid (Pa·s).
A scaling approach was necessary to achieve representative behavior, accomplished by adjusting the density values of the cement and bentonite particles (Table 4). Additionally, a time-scaling approach was implemented to make the 24 h bleeding test computationally tractable. Two variant models were developed for each formulation: a constant viscosity model and a time-dependent viscosity model, enabling assessment of the influence of time-dependent rheological changes on bleeding behavior.

4. Results

4.1. Flow Test Results

The flow test results revealed distinctive patterns of time-dependent rheological behavior with varying hydration accelerator content. Figure 9 shows the evolution of flow spread diameters for Case-1 (5 kg/m3 accelerator) and Case-2 (10 kg/m3 accelerator). Immediately after mixing, both formulations exhibited similar initial flow spread diameters of approximately 245 mm and 240 mm, respectively, indicating good initial flowability with no significant immediate effect of accelerator dosage. These values fall within the optimal range recommended by the Japan Geotechnical Society [45].
As time progressed, Case-1 maintained relatively high flow spread diameters, showing only a 12% reduction (From 245 mm to 215 mm) over the 60 min observation period. In contrast, Case-2 exhibited more pronounced flowability loss, particularly after 30 min, with flow spread diameters decreasing to 160 mm at the 60 min mark, representing a 33% reduction from initial values. This accelerated stiffening aligns with expected behavior of calcium-based accelerators during the transition from induction to acceleration phases of cement hydration [46].
In all subsequent figures, Case-1 refers to formulations with 5 kg/m3 hydration accelerator content, while Case-2 refers to formulations with 10 kg/m3 hydration accelerator content, maintaining consistent cement (250 kg/m3) and bentonite (25 kg/m3) proportions as specified in Table 1.
Table 5 summarizes the time required for flow stoppage. Despite significant differences in final flow spread diameters, both formulations exhibited similar flow stoppage times of approximately 0.3 s across all testing intervals, suggesting that while yield stress was significantly affected by accelerator content and elapsed time, plastic viscosity remained relatively constant.
The relationship between flow spread diameter and time follows a modified exponential decay function (Equation (8)), with fitted parameters ( α = 0.00012, b = 1.45 for Case-1; α = 0.00035, b = 1.82 for Case-2) quantifying the accelerated structural development in Case-2:
F t = F + F 0 F e α t b
where F t is the flow spread diameter at time t (mm), F 0 is the initial flow spread diameter at t is the 0 (mm), F is the asymptotic minimum flow spread diameter (mm), and α and b are the fitting parameters.

4.2. Bleeding Test Results

Table 6 presents bleeding test results, revealing significant differences in phase segregation resistance. Case-1 exhibited a bleeding rate of 2.5%, just below the 3% maximum threshold recommended for backfilling applications [47]. Case-2 showed substantially improved phase stability with a bleeding rate of only 1.5%, representing a 60% reduction compared to Case-1.
The kinetics of bleeding development also differed markedly. Case-1 exhibited bleeding throughout the test duration, with approximately 70% of the total bleeding occurring within the first 6 h. Case-2 showed significantly reduced bleeding rates from the earliest measurement point (1 h), with bleeding essentially ceasing after 6 h, indicating that the higher accelerator dosage promoted rapid structural development that effectively prevented further phase segregation.
Microstructural examination revealed that Case-1 specimens exhibited a vertical gradient in cement particle concentration, with approximately 22% higher concentration in the bottom third compared to the top third. Case-2 specimens showed a more uniform distribution (only 8% difference), confirming the improved phase stability indicated by the macroscopic measurements.

4.3. MPS Simulation Results

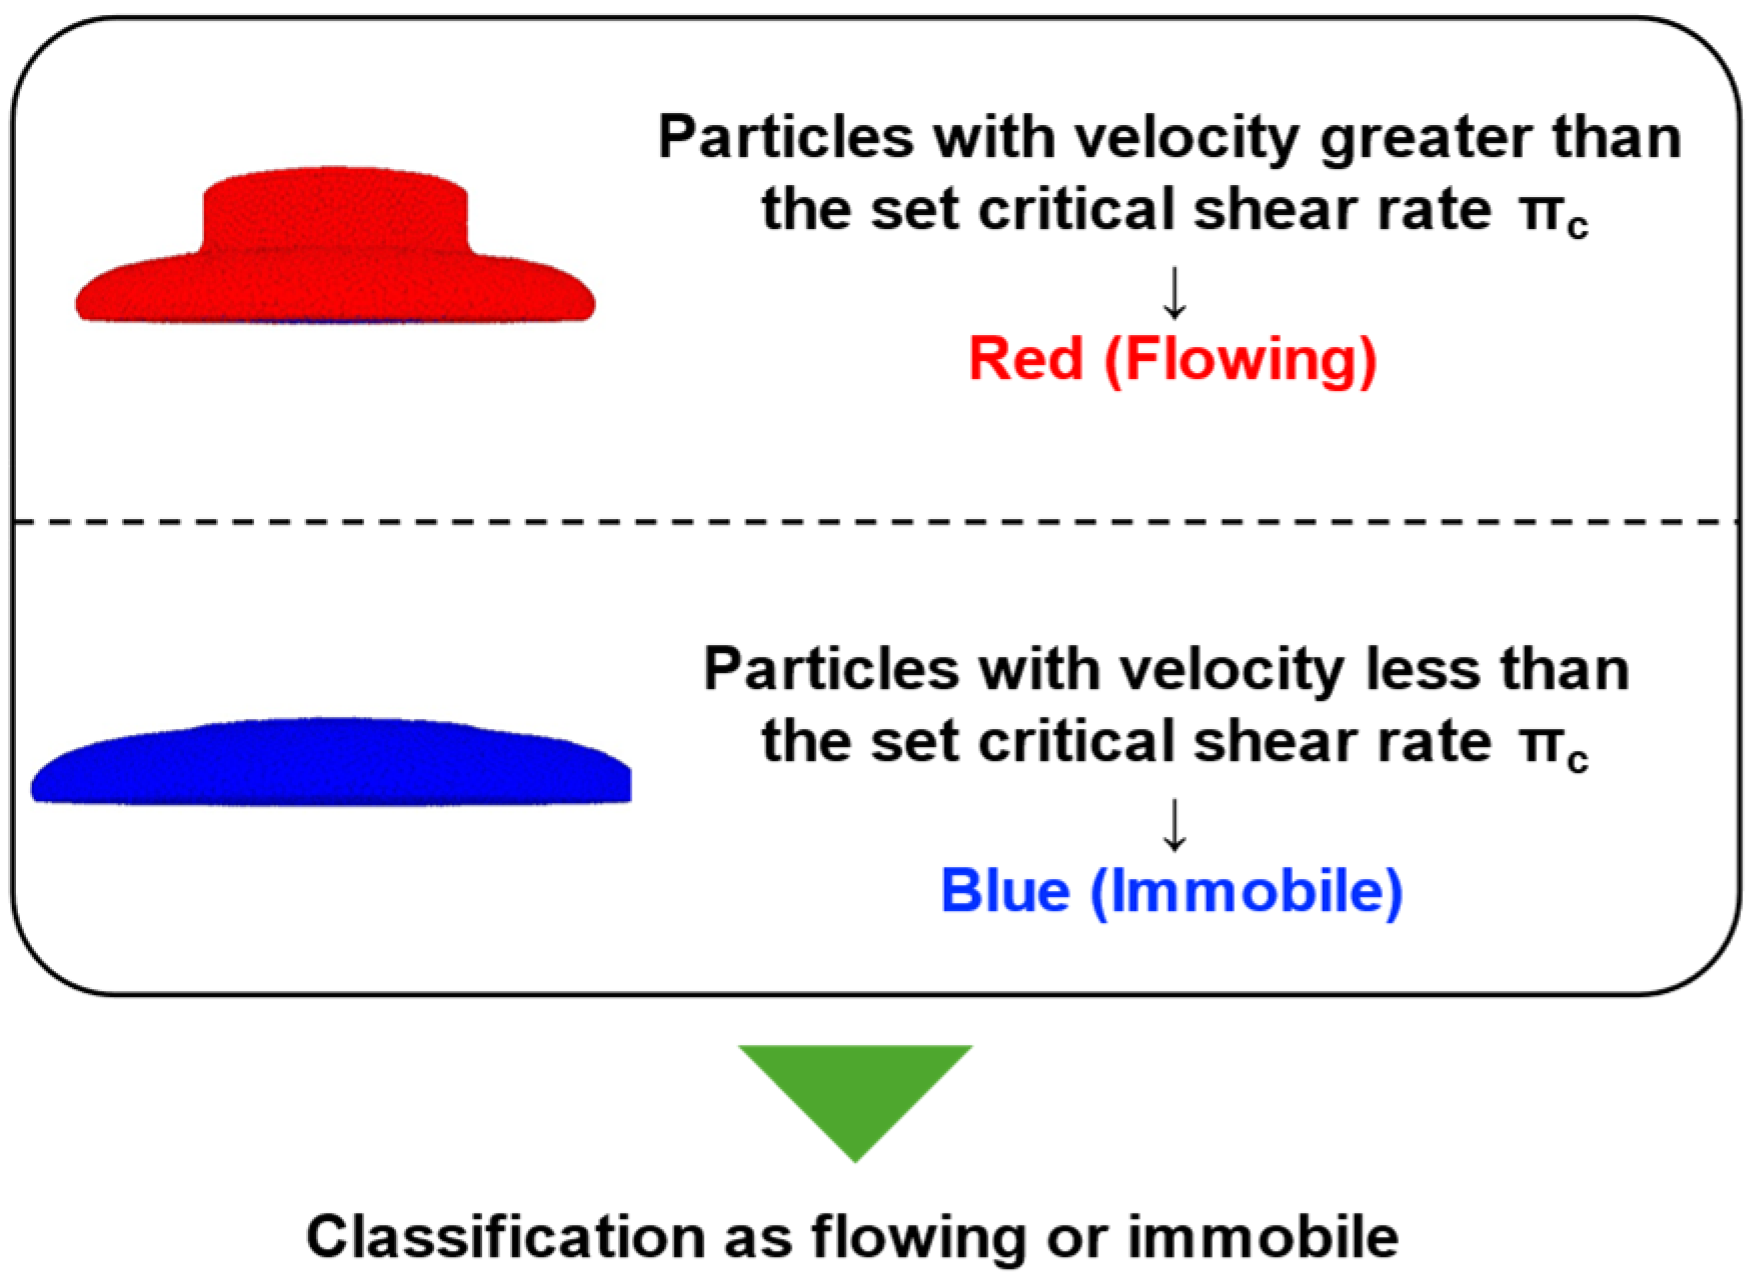
4.3.1. Flow Behavior Simulation

The MPS simulations successfully reproduced experimental flow behavior. Figure 10 shows simulation snapshots with flowing particles (red particles) and immobile particles (blue particles). For each formulation and time point, the simulations accurately captured both final spread diameter and flow stoppage time.
At early time points (0–20 min), both formulations showed similar behavior characterized by rapid initial spreading followed by gradual deceleration. At later time points (40–60 min), particularly for Case-2, the simulations revealed more complex behavior including decreased spreading, more pronounced central mounding, earlier transition to immobile states, and steeper flow profiles.
The simulations enabled quantitative analysis of shear rate distributions within the flowing material. Maximum shear rates occurred at the advancing flow front and decreased toward the center. At early time points, maximum shear rates were comparable between formulations (approximately 15 s−1), but diverged significantly by 60 min, with Case-1 decreasing to approximately 12 s−1 and Case-2 showing a more substantial reduction to approximately 6 s−1, reflecting the more pronounced structural development with higher accelerator content.

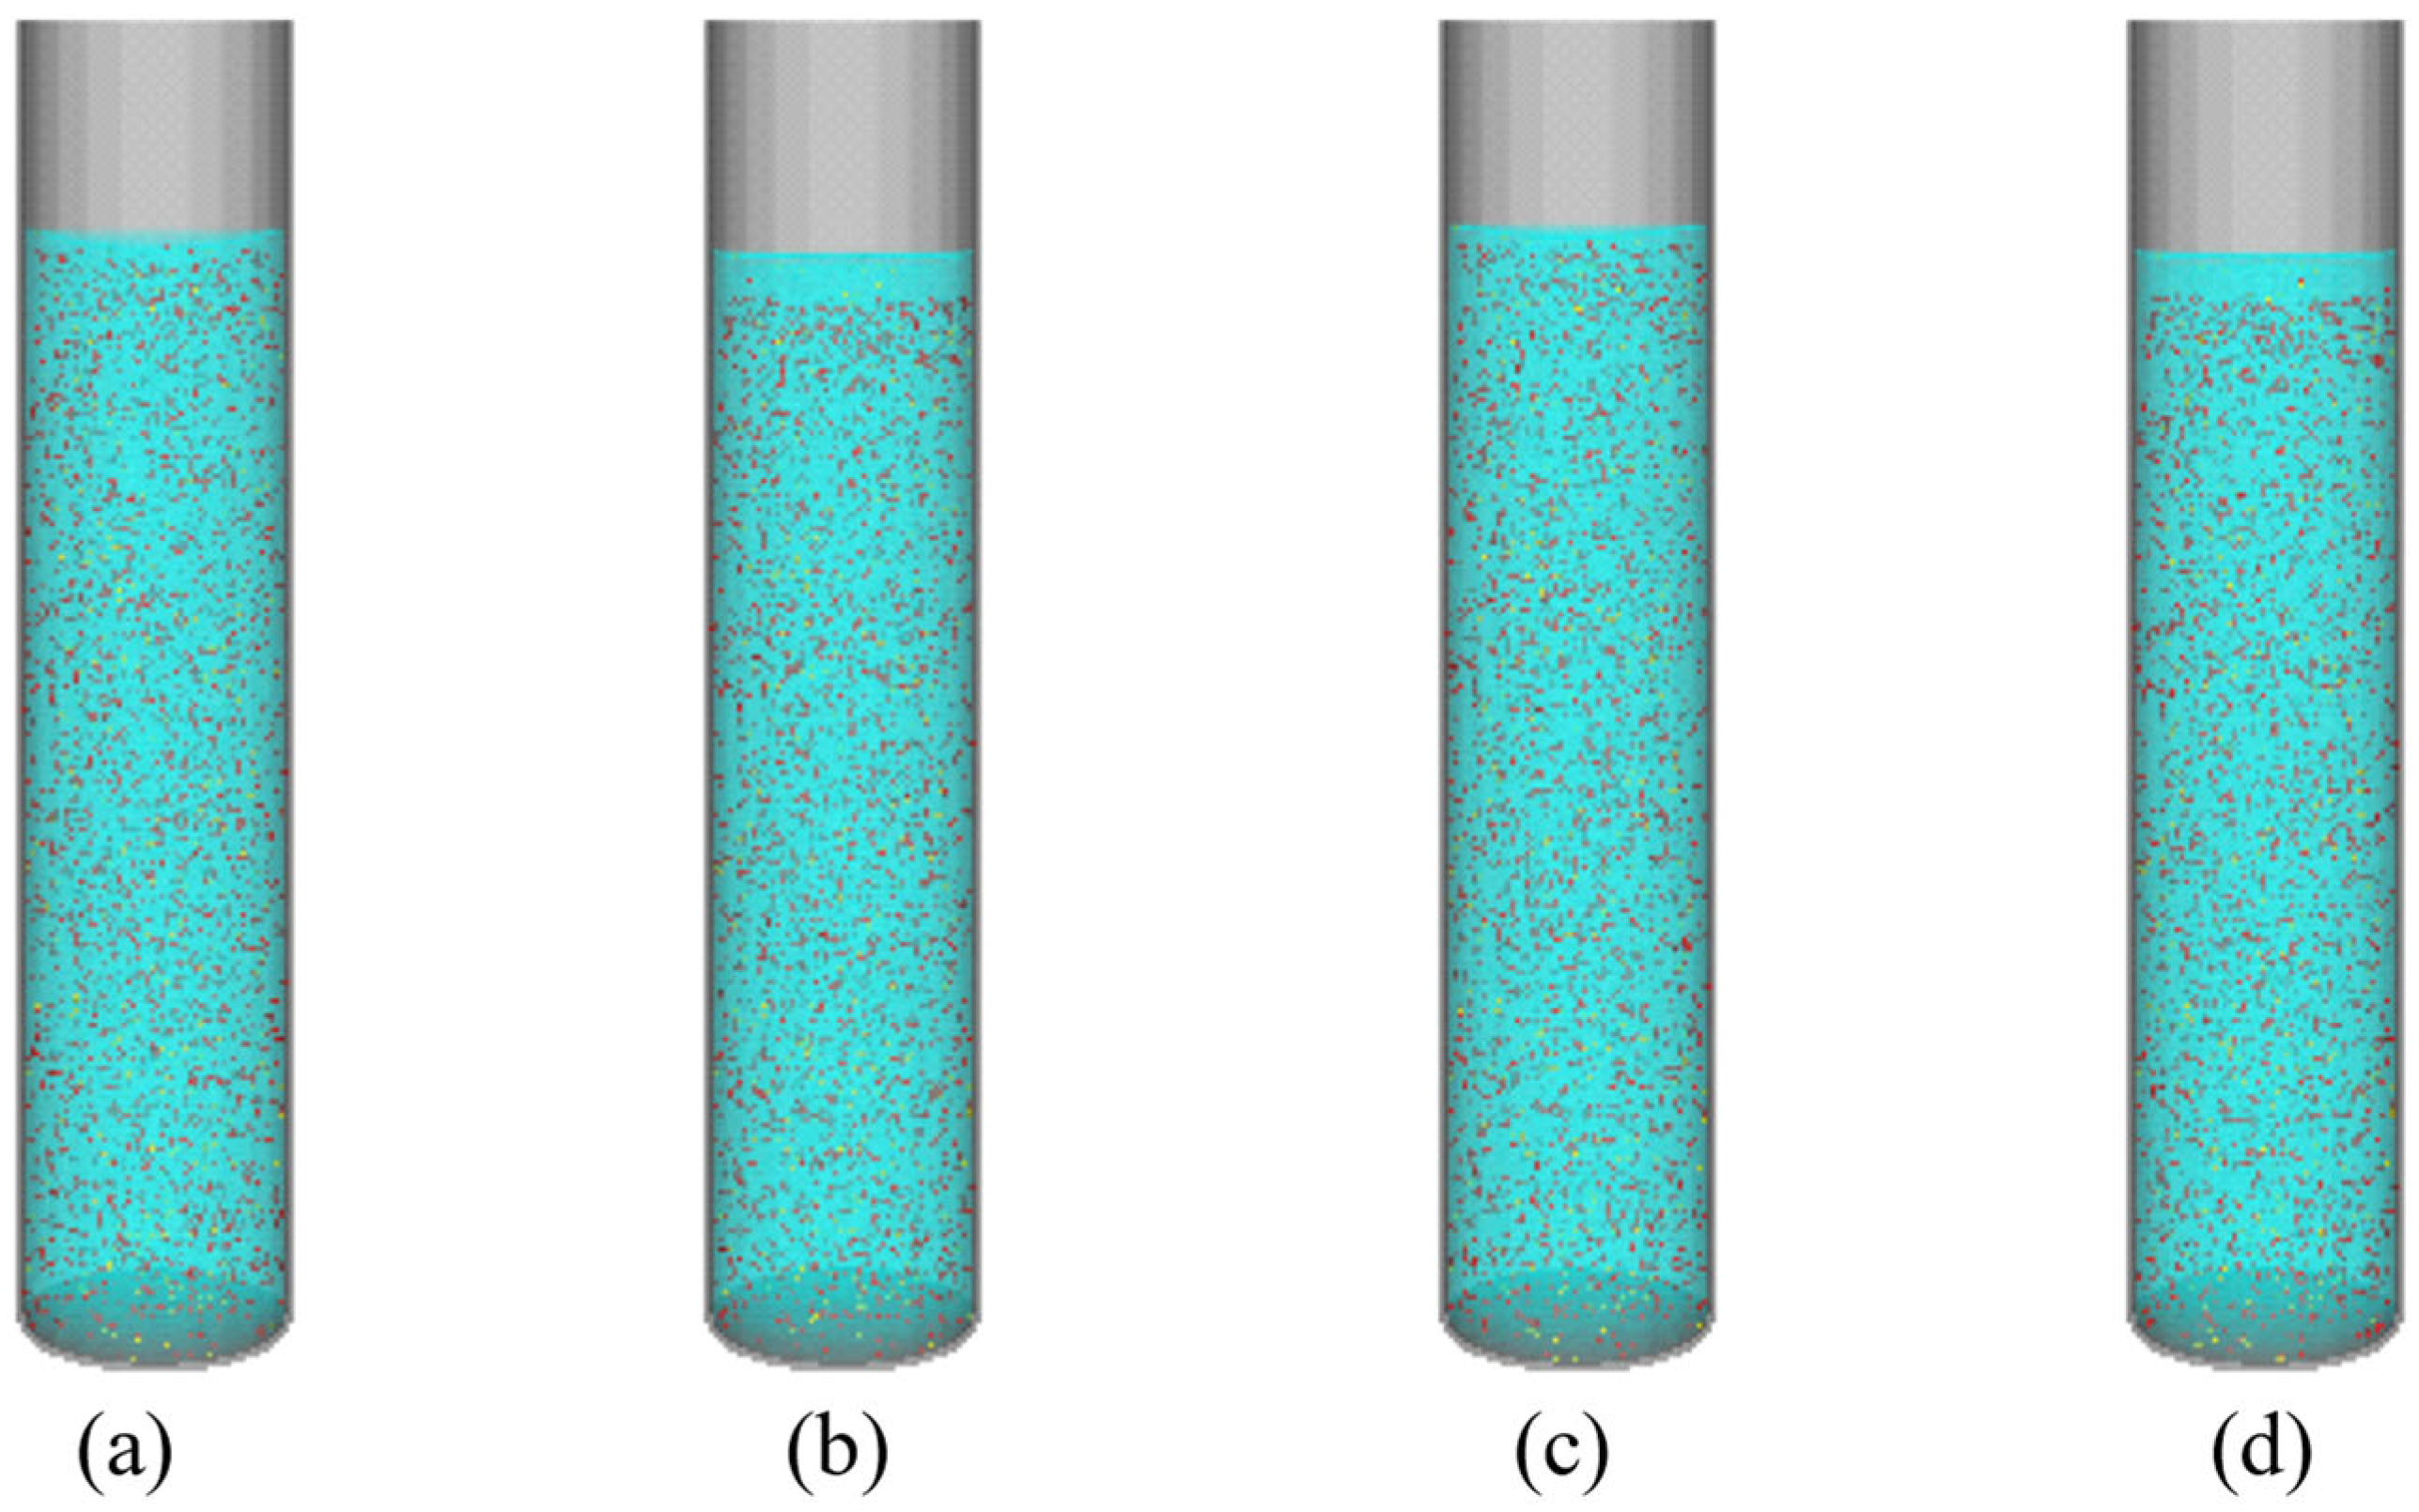
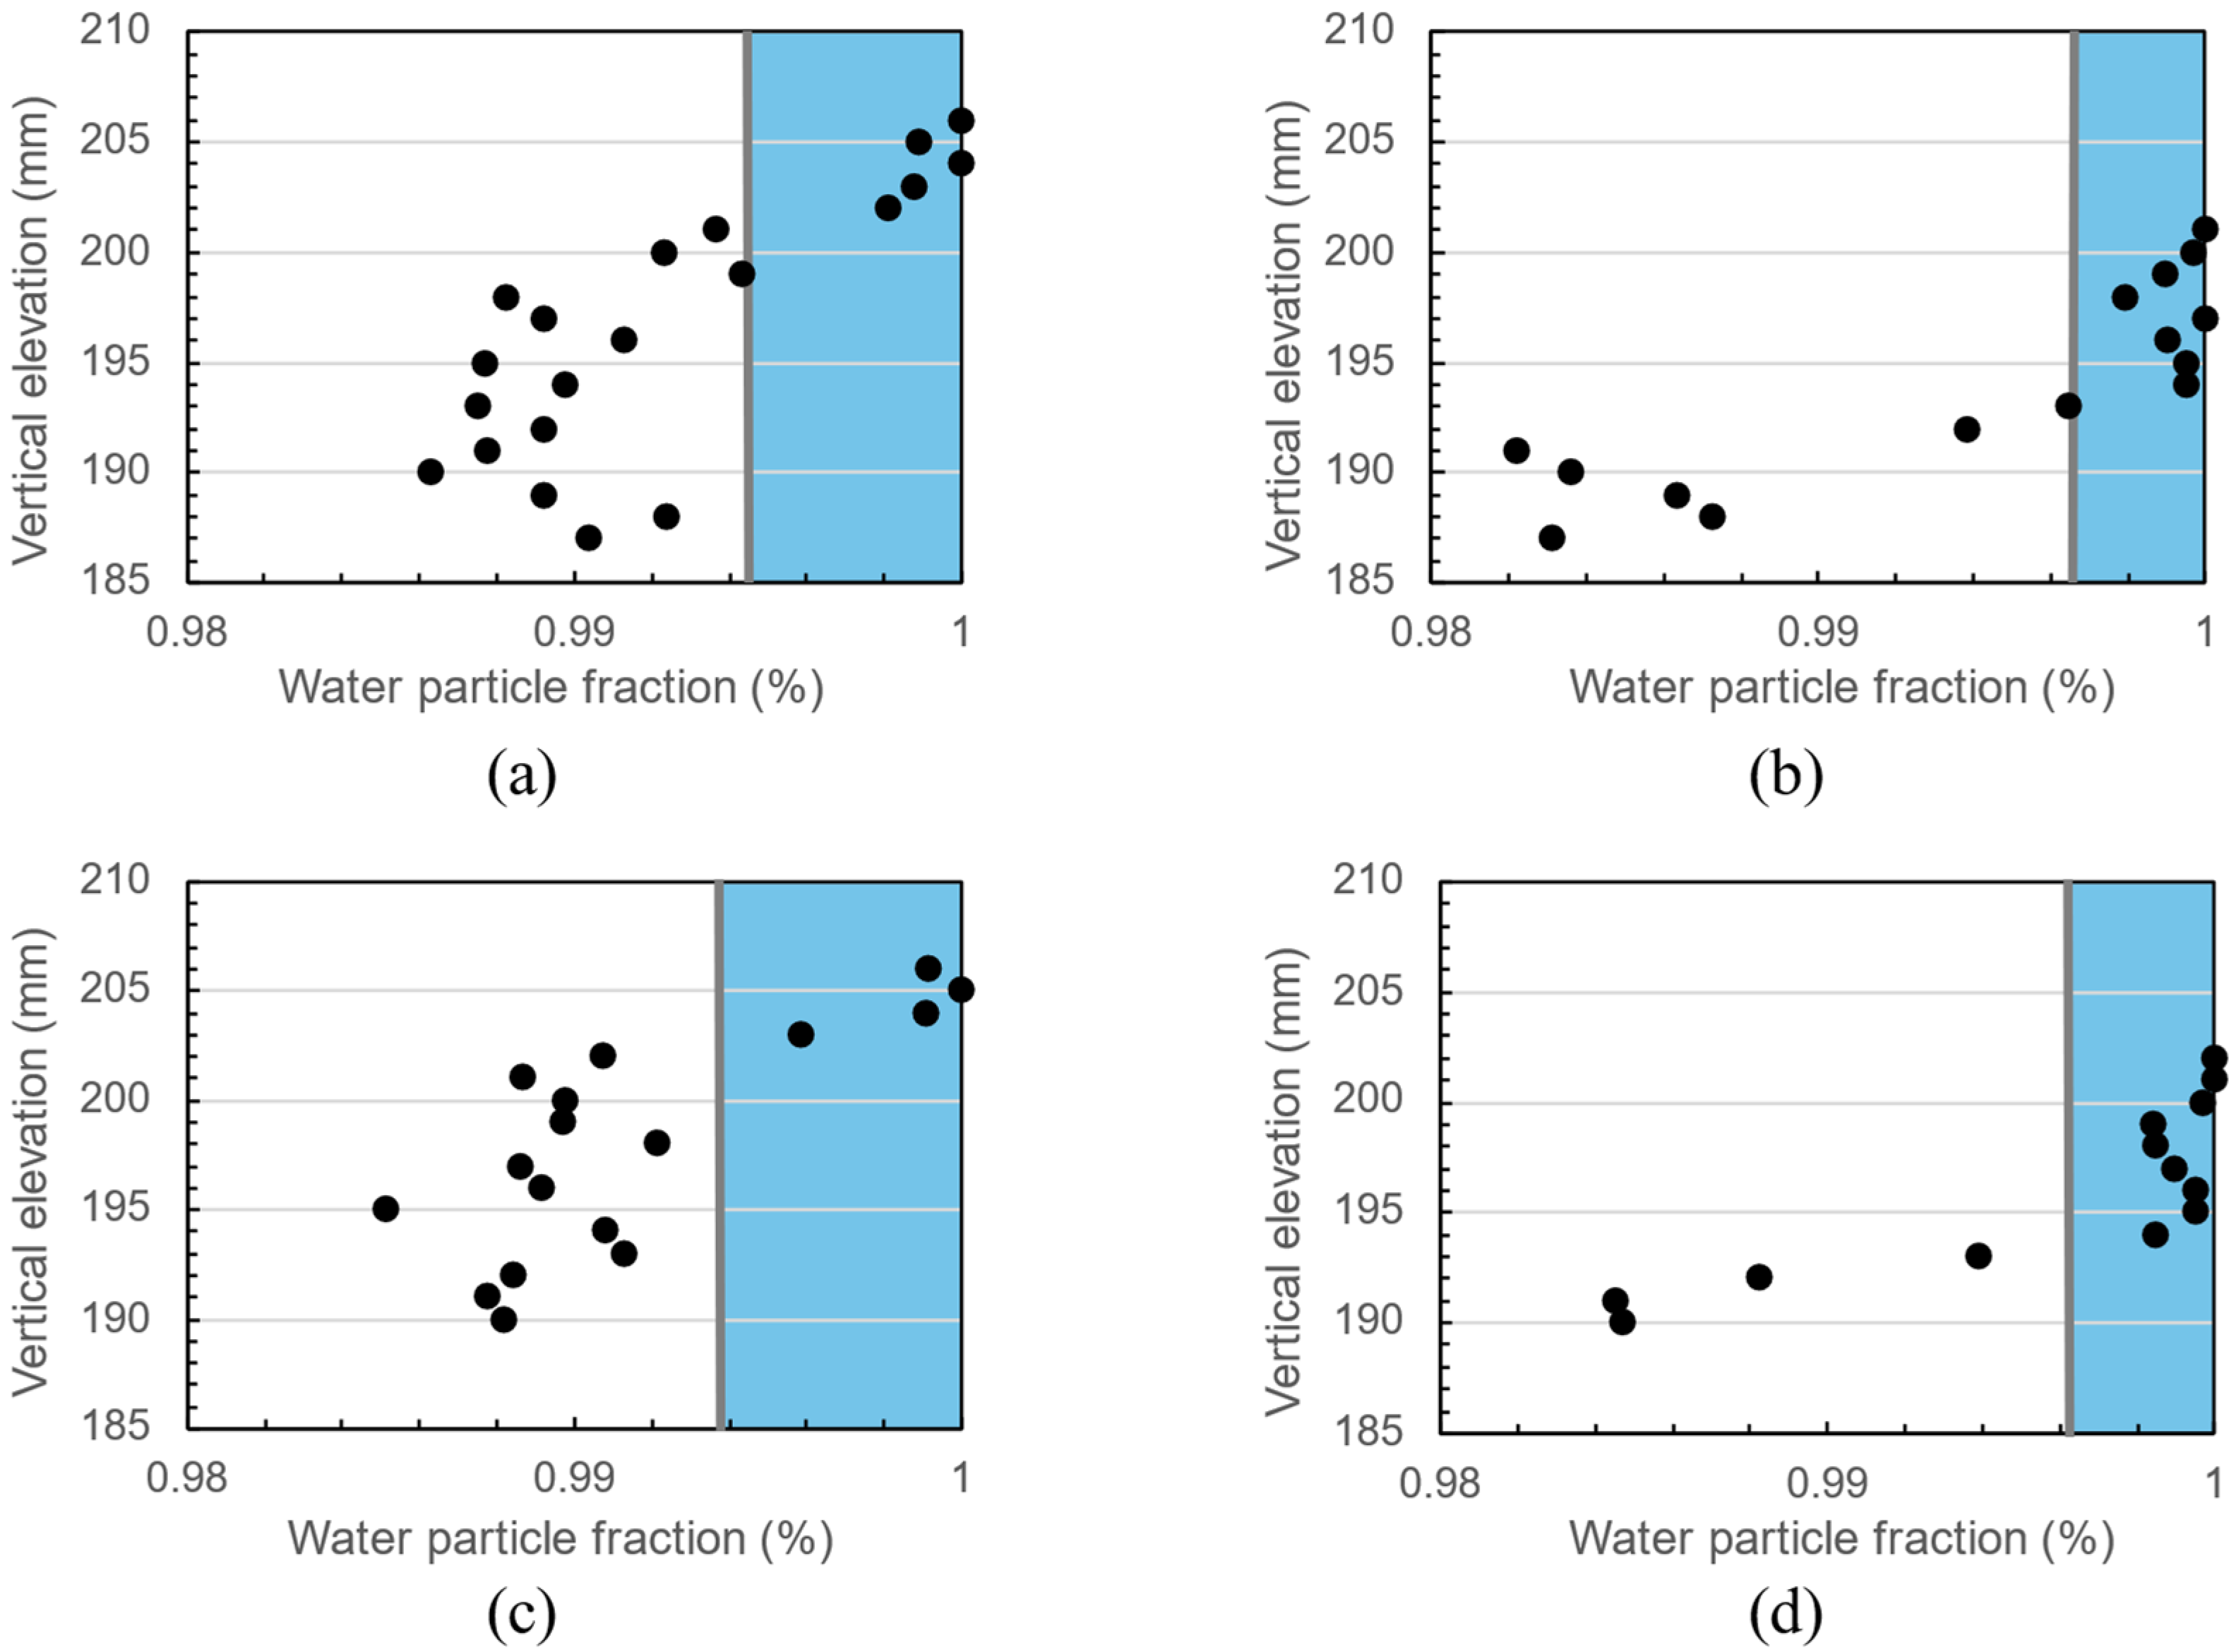
4.3.2. Bleeding Behavior Simulation

Figure 11 presents the particle distribution after simulated 24 h settlement for four cases: (a) Case-1 with time-dependent viscosity, (b) Case-1 with constant viscosity, (c) Case-2 with time-dependent viscosity, and (d) Case-2 with constant viscosity.
In constant viscosity simulations, both formulations exhibited significant phase segregation, with water particles (light blue) concentrating in the upper portion and solid particles (red/yellow) accumulating in the lower region. This was more pronounced in Case-1, which showed a distinct boundary between water-rich and solid-rich zones.
In contrast, time-dependent viscosity simulations demonstrated substantially reduced phase segregation, particularly for Case-2. The progressive increase in yield stress and viscosity restricted particle movement as time progressed, effectively “freezing” the microstructure before complete separation could occur.
Figure 12 provides a quantitative representation of water particle distribution along the vertical axis, with colored regions indicating zones where water fraction exceeds the mean plus two standard deviations, effectively identifying the bleeding water layer. Table 7 presents calculated bleeding rates from simulations, showing excellent agreement with experimental measurements as shown in Table 6 for time-dependent models (2.43% vs. 2.5% for Case-1; 1.94% vs. 1.5% for Case-2), while constant viscosity models substantially overestimated bleeding (3.98% for Case-1; 4.46% for Case-2).
This contrast between model types underscores the critical importance of accurately representing rheological evolution when simulating cementitious materials [48]. The simulations also revealed that approximately 60% of total phase segregation occurred within the first equivalent of 3 h, with the rate decreasing thereafter, particularly for Case-2.

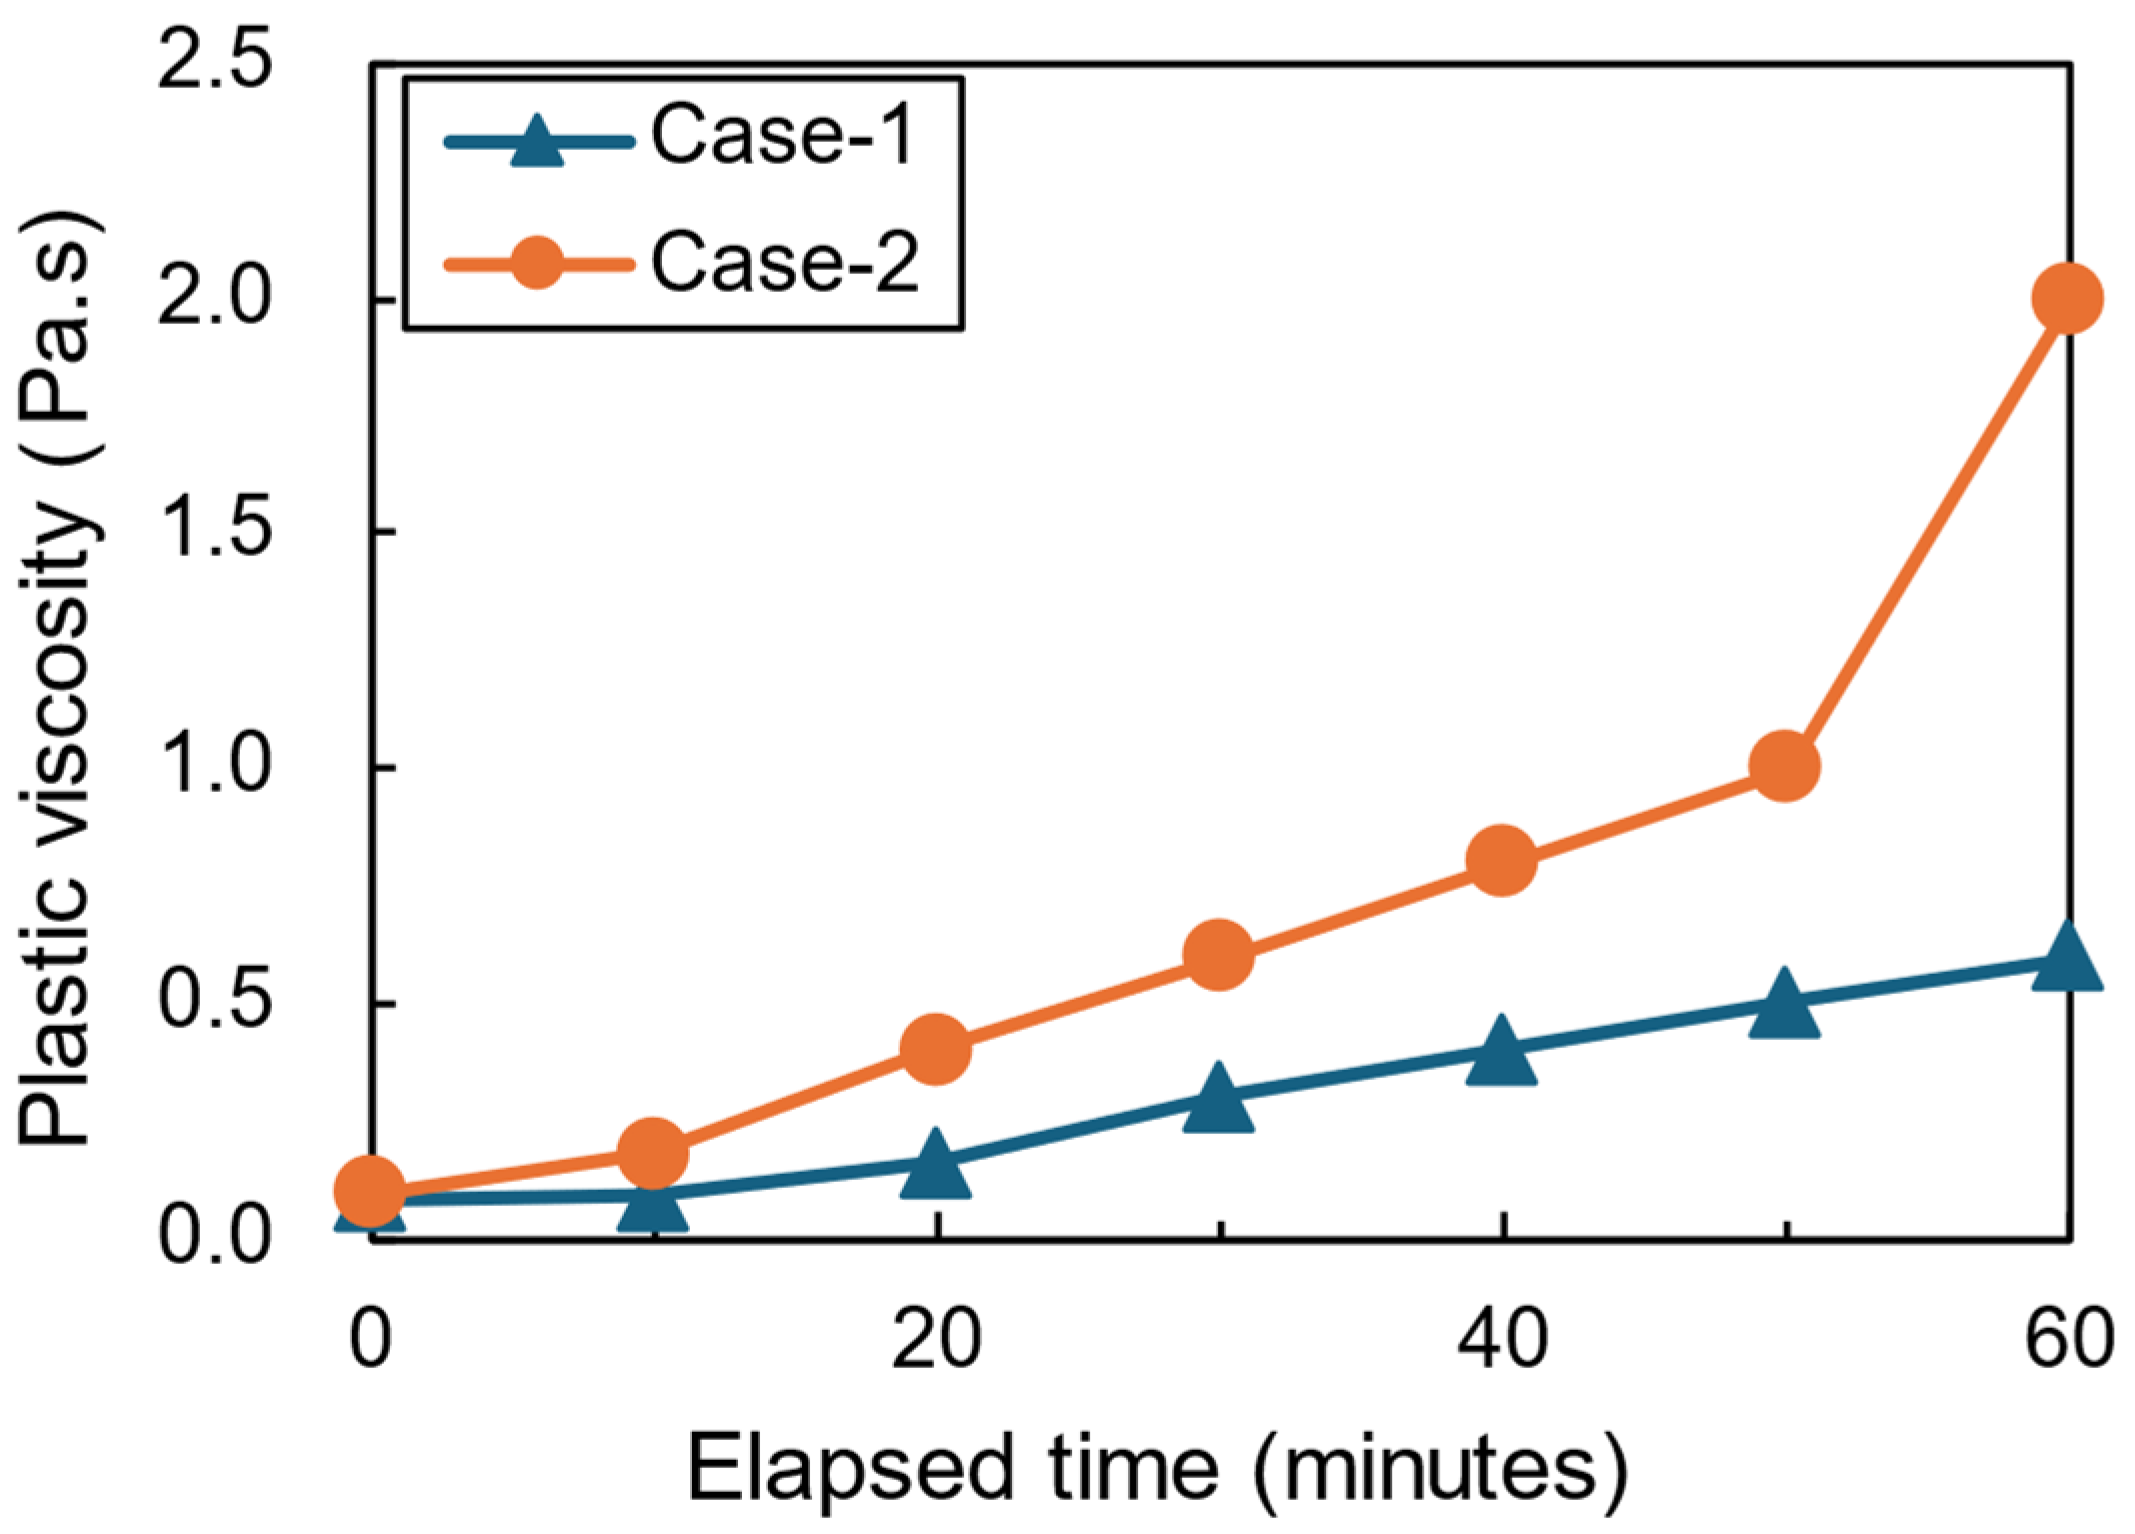
4.4. Rheological Parameter Evolution

Table 8 presents the rheological parameters at key time intervals, while Figure 10 and Figure 11 provide comprehensive temporal evolution throughout the 60 min observation period. The detailed graphical representation enables quantitative analysis of the transition phases in rheological development, particularly the inflection points observed in yield stress evolution.
The yield stress results (Figure 13) revealed distinctive patterns. Case-1 exhibited an approximately linear increase from 1.8 Pa initially to 29 Pa after 60 min. Case-2 demonstrated a more complex pattern with three distinct phases: an initial period (0–10 min) with modest yield stress increase to 2 Pa, an intermediate period (10–30 min) reaching 30 Pa, and a final period (30–60 min) with rapid development attaining a 170 Pa.
This non-linear pattern suggests an earlier transition from the induction to the acceleration phase of cement hydration with higher accelerator dosage. The relationship between yield stress and time can be mathematically described using a modified Kohlrausch–Williams–Watts function (Equation (9)):
τ y t = τ y 0 + Δ τ y 1 e t / τ β
where τ y t is the yield stress at time t (Pa), t is the time (min), τ y 0 is the initial yield stress at t is the 0 (Pa), Δ τ y is the maximum additional yield stress development (Pa), τ is the characteristic time constant (min), and β is the stretching exponent.
The fitted parameters ( t = 92.6 min, β = 1.31 for Case-1; t = 41.3 min, β = 1.85 for Case-2) quantify the accelerated rate and pronounced non-linearity in Case-2.
In contrast, plastic viscosity values (Figure 14) showed minimal variation, with Case-1 maintaining approximately 0.1–0.6 Pa·s throughout the observation period and Case-2 showing only a slight increase to 2 Pa·s. This stability explains the consistent flow stoppage times observed experimentally and suggests that plastic viscosity is less sensitive than yield stress to early structural development in cement–bentonite slurries [14,27].
The derived rheological parameters were validated through independent simulations of standard rheometric tests, showing excellent agreement with experimental measurements (within ±5%), confirming the accuracy of the inversely determined parameters.

5. Discussion

5.1. Experimental–Numerical Correlation

The integration of experimental testing and numerical simulation provided complementary insights that could not have been achieved through either approach alone. The MPS simulations successfully reproduced both flow spread diameter (Figure 9) and stoppage time (Table 5) for all formulations and time points with mean absolute percentage errors of 2.3% for Case-1 and 2.8% for Case-2, demonstrating the robustness of the iterative inverse analysis procedure illustrated in Figure 7.
Beyond matching experimental measurements, the simulations revealed detailed flow dynamics not directly observable in physical tests, such as localized high shear rate zones at the advancing flow front shown in Figure 10. These zones, with rates exceeding 15 s−1, likely contribute to thixotropic structure breakdown, temporarily reducing effective viscosity and enhancing flow [49]. This phenomenon explains the observed rapid initial spreading followed by gradual deceleration in both experimental and numerical results presented in Figure 9.
For bleeding tests, the correlation between experimental (Table 6) and time-dependent numerical results (Table 7) was similarly strong (2.43% vs. 2.5% for Case-1; 1.94% vs. 1.5% for Case-2). The stark contrast with constant viscosity models (3.98% for Case-1; 4.46% for Case-2) shown in Table 7 provides compelling evidence for the importance of rheological evolution in determining bleeding behavior. This finding has significant implications for computational modeling of cementitious materials, suggesting that standard CFD approaches with constant properties may be fundamentally inadequate for accurately predicting phase stability, as demonstrated by the particle distribution patterns in Figure 11.
The inverse analysis approach used in this study enabled quantitative assessment of rheological parameters that are difficult to measure directly. While rotational viscometry provides valuable data, it inherently disrupts the evolving microstructure through applied shear, potentially underestimating actual rheological parameters in undisturbed conditions [50]. The consistency between rheological parameters determined through inverse analysis (Table 8) and standard viscometry (within 15% for yield stress and 8% for plastic viscosity) suggests that both approaches capture fundamental material properties, albeit under different conditions.
The MPS simulation framework was validated against established benchmark cases for cementitious materials. The predicted flow behavior for standard cement pastes (w/c = 0.5) showed excellent agreement with published experimental data by Roussel and Coussot (2005) [51], with flow spread diameters within 5% of reported values. The rheological parameters determined through inverse analysis align well with literature ranges for cement–bentonite systems: yield stress values (1.8–170 Pa) fall within the 2–200 Pa range reported by Bentz et al. (2012) [52] for similar formulations, while plastic viscosity values (0.09–2.0 Pa·s) correspond to typical ranges (0.05–3.0 Pa·s) documented by Wallevik and Wallevik (2011) [53] for cement-based slurries. Additionally, the bleeding rates predicted by time-dependent MPS models (1.5–2.5%) are consistent with field observations reported by Inazumi et al. (2019) [5] for cement–bentonite backfilling applications, validating the practical relevance of the simulation outcomes.

5.2. Effect of Hydration Accelerator on Rheological Development

The hydration accelerator demonstrated a profound influence on rheological evolution, particularly on yield stress development as shown in Figure 10 and Table 8. The mechanism underlying this effect can be understood through calcium-based accelerators’ promotion of early calcium silicate hydrate (C-S-H) formation through several mechanisms [54]:
  • Providing additional calcium ions that accelerate silicate phase dissolution;
  • Creating nucleation sites for C-S-H precipitation;
  • Modifying the calcium/silicate ratio in the pore solution;
  • Interacting with sulfate phases to regulate aluminate reactions.
The non-linear yield stress development observed in Case-2 (Figure 13), characterized by an inflection point around 30 min, likely corresponds to the transition from induction to acceleration phase of cement hydration. X-ray diffraction and isothermal calorimetry analyses supported this interpretation, with Case-2 showing approximately 35% higher early C-S-H content after 3 h compared to Case-1, along with a heat flow peak occurring approximately 45 min earlier.
While yield stress was significantly affected by accelerator dosage (Figure 13), plastic viscosity remained relatively stable as shown in Figure 14 and Table 8. This differential response reflects the distinct physical phenomena underlying these parameters. Yield stress primarily results from interparticle attractive forces and network structure directly enhanced by C-S-H formation, while plastic viscosity is more strongly influenced by particle concentration and hydrodynamic interactions that remain relatively constant during the pre-setting period [54].
This contrasting behavior, clearly illustrated by comparing Figure 13 and Figure 14, has important implications for material design. By selectively targeting yield stress development while maintaining workable plastic viscosity, accelerator addition offers a mechanism to improve phase stability without significantly compromising placement characteristics, representing an advancement over traditional approaches that typically require flowability–stability trade-offs.

5.3. Time-Dependent Viscosity and Phase Stability

The time-dependent evolution of rheological properties emerged as a critical factor governing cement–bentonite slurry performance, particularly for phase segregation resistance as demonstrated in Figure 11 and quantified in Table 7. The bleeding test simulations definitively demonstrated that incorporating time-dependent viscosity changes is essential for accurately predicting phase stability.
According to Stokes’ law (Equation (7)), settling velocity is inversely proportional to fluid viscosity. As rheological properties evolve (Figure 13 and Figure 14), increasing yield stress and viscosity progressively restrict particle movement, effectively “freezing” the microstructure before complete phase separation occurs [55]. This explains why materials with similar initial properties (Table 1) but different rates of structural development can exhibit markedly different bleeding behaviors (Table 6).
The temporal dynamics of bleeding revealed by both experimental measurements (Table 6) and simulations (Figure 12) support this interpretation. The virtual cessation of bleeding after 6 h in Case-2 coincides with accelerated yield stress development shown in Figure 13, confirming the direct relationship between these phenomena [56].
This finding has significant implications for material testing and quality control. Standard bleeding tests typically measure only the final bleeding rate after 24 h, providing limited insight into the process kinetics. Monitoring early-age rheological development (0–3 h) as shown in Figure 13 and Figure 14 may provide more meaningful predictors of bleeding performance than single-point measurements.
The MPS simulations revealed not only macroscopic bleeding behavior but also microscale particle dynamics as illustrated in Figure 11. In constant viscosity simulations (Figure 11b,d), both formulations exhibited significant phase segregation, with water particles (light blue) concentrating in the upper portion and solid particles (red/yellow) accumulating in the lower region. In time-dependent models (Figure 11a,c), particle velocities decreased even in dilute regions, eventually approaching zero as yield stress exceeded gravitational forces.
This observation highlights a fundamental limitation of existing phase segregation models that assume constant rheological properties. The approach developed in this study, sequentially updating rheological parameters based on experimental measurements (Table 8), offers a more realistic representation while maintaining computational tractability, as demonstrated by the vertical water distribution profiles in Figure 12.
Parametric simulations clarified the relative importance of yield stress versus plastic viscosity in determining bleeding resistance. Bleeding rates showed a strong inverse correlation with yield stress values (Figure 13) when systematically varied, while varying plastic viscosity (Figure 14) produced relatively minor effects. This suggests yield stress development is the primary rheological parameter governing phase stability in cement–bentonite slurries.

5.4. Practical Applications and Engineering Implications

For practical applications, higher accelerator dosages (similar to Case-2 with 10 kg/m3 as shown in Table 1) offer advantages for most borehole backfilling scenarios. The enhanced phase stability directly addresses a primary performance concern in field applications, the development of strength variations due to bleeding and phase segregation. Field measurements by Inazumi (2024) [5] demonstrated that strength variations exceeding 30% between top and bottom portions of backfilled boreholes can develop with conventional formulations, potentially compromising long-term stability.
However, the accelerated loss of flowability associated with higher accelerator dosages (Figure 9) necessitates careful consideration of placement logistics. Case-2 maintained acceptable flowability (Flow spread diameters exceeding 180 mm) for approximately 50 min after mixing, providing practical working time for typical small to medium-scale operations. For larger projects requiring extended placement periods, several strategies could be implemented as follows:
  • Sequential mixing of multiple batches with staggered preparation times;
  • Use of compatible retarding admixtures to counterbalance acceleration effects;
  • Two-component systems with separate storage and mixing at point of placement;
  • Chilled water usage to slow reaction kinetics under warm ambient conditions.
The time-dependent rheological evolution (Figure 13 and Figure 14) also has implications for placement method selection. Bottom-up filling techniques would be particularly advantageous for formulations with higher accelerator content, minimizing the time between mixing and final placement, ensuring the material reaches its final position before significant rheological development occurs [5].
Economic considerations further support the case for higher accelerator dosages. While the accelerator represents an additional material cost (approximately 8–12% increase for Case-2 compared to Case-1 based on Table 1), this must be weighed against the potential consequences of inadequate performance. Remediation of poorly backfilled boreholes typically costs 3–5 times the original operation [5].
Environmental considerations also favor formulations with enhanced phase stability as demonstrated in Table 6. Bleeding water that separates from cement–bentonite slurries typically exhibits high pH (11–13) and may contain dissolved heavy metals, posing potential environmental hazards [57]. Formulations with minimized bleeding reduce this environmental risk while also improving material efficiency.
While the laboratory results and numerical simulations provide valuable insights into material behavior under controlled conditions, field implementation requires consideration of additional factors that may influence performance. Temperature variations (±10–15 °C from laboratory conditions) can alter hydration kinetics by 50–70% based on Arrhenius relationships, potentially affecting the rheological evolution timing established in this study. Groundwater infiltration, varying injection pressures, and irregular borehole geometries represent practical challenges that warrant further investigation through pilot-scale field trials.
To validate the laboratory-based methodology under realistic conditions, staged implementation with comprehensive monitoring is recommended. This should include real-time rheological monitoring during placement, core sampling at multiple depths, and long-term settlement observations. Such engineering validation would bridge the gap between controlled laboratory conditions and field implementation, ensuring the reliability of the proposed material formulations and placement strategies under diverse site conditions.

5.5. Model Limitations and Future Work

Several limitations should be acknowledged when interpreting results and applying findings to field conditions. The experimental program examined a relatively narrow range of formulations (Table 1), focusing primarily on hydration accelerator dosage while maintaining consistent cement and bentonite contents. Future investigations should employ factorial experimental designs to systematically explore potential interaction effects.
The time scale examined in the flow tests (0–60 min, Figure 9) captures only the early portion of rheological development. While this period is particularly relevant for placement operations, behavior beyond 60 min also influences final material quality, especially for larger projects with extended placement durations.
Temperature effects represent a significant uncertainty in translating laboratory results to field conditions. All tests were conducted at 20 ± 2 °C, while field temperatures can vary substantially. Since cement hydration kinetics are strongly temperature-dependent, following Arrhenius behavior with activation energies of 30–40 kJ/mol, rheological development rates could vary by factors of 1.5–2.0 under typical field temperature ranges.
The numerical simulations incorporate several simplifications that may affect prediction accuracy, including representing complex particle shapes using uniform spherical particles (as shown in the MPS models in Figure 6 and Figure 8), simplifying cement hydration chemistry into time-dependent rheological parameters (Table 8), and using the bi-viscosity model (Figure 5) as an approximation of true Bingham behavior. Sensitivity analysis found that the most significant factors affecting prediction accuracy were the critical shear rate parameter in the bi-viscosity model (±15% variation in predicted flow spread diameters for ±50% change in critical shear rate) and the particle diameter used in bleeding simulations (±20% variation in predicted bleeding rates for ±30% change in particle size).
Parametric sensitivity analysis revealed that MPS simulation outcomes are most sensitive to yield stress variations, with ±20% changes in yield stress producing ±15–18% variations in predicted flow spread diameter and ±25–30% variations in bleeding rates. In contrast, ±20% changes in plastic viscosity resulted in smaller effects: ±8–12% variations in flow stoppage time but minimal impact (<5%) on final flow diameter or bleeding predictions. The critical shear rate parameter showed moderate sensitivity, with ±50% variations causing ±12–15% changes in flow behavior predictions. These findings indicate that accurate yield stress determination is critical for reliable MPS predictions, while plastic viscosity uncertainty has limited impact on key performance metrics. The observed sensitivity levels are within acceptable engineering tolerances for most practical applications, supporting the robustness of the methodology for material optimization purposes.
While this study establishes the fundamental methodology for material optimization and performance prediction, the development of comprehensive design recommendations (including specific dosage guidelines, working time specifications, and quality control thresholds) requires extensive field validation across diverse site conditions. Future work should focus on translating the laboratory-derived relationships into practical design tables and specification guidelines that account for variability under ambient temperature, groundwater conditions, and equipment constraints. Such guidelines would enhance the practical utility of this research for construction practitioners and facilitate standardization of borehole backfilling procedures.
While this study provides a robust foundation for material selection and performance prediction through integrated experimental–numerical methodology, the transition to field implementation requires acknowledgment of site-specific variables not captured under controlled laboratory conditions. Factors such as varying groundwater conditions, irregular borehole geometries, ambient temperature fluctuations, and equipment limitations may influence material performance and placement efficiency. The laboratory-derived rheological parameters and numerical predictions should therefore be validated through carefully designed pilot-scale field trials before full-scale implementation. Such validation would incorporate real-time monitoring of placement conditions and post-installation performance assessment to ensure the reliability of the proposed methodology under diverse field conditions.
Despite these limitations, the primary findings regarding accelerator dosage effects on rheological development (Figure 13 and Figure 14) and phase stability (Table 6 and Figure 11) remain valid across the expected range of practical variations. Monte Carlo simulations incorporating identified uncertainties demonstrated consistency in relative performance, with Case-2 consistently outperforming Case-1 in bleeding resistance across 95% of simulated scenarios.
The transition from laboratory-scale findings to field implementation necessitates comprehensive engineering validation through pilot studies and field trials. Future work should prioritize full-scale testing under varying environmental conditions, including different groundwater conditions, ambient temperatures, and geological settings. Integration of real-time monitoring systems for rheological properties during placement would provide essential feedback for validating the predictive capabilities of the laboratory methodology and numerical models developed in this study.
The MPS methodology demonstrated in this study at the laboratory scale shows promise for larger field scenarios, though computational considerations become critical. For full-scale borehole applications (typical depths 10–30 m, diameters 0.6–1.2 m), particle numbers would increase by factors of 103–104, requiring high-performance computing environments with distributed memory architectures. Recent advances in GPU-accelerated MPS implementations and adaptive particle refinement techniques suggest feasibility for field-scale simulations within practical timeframes. However, the computational cost–benefit ratio must be evaluated against simplified engineering models for routine design applications, with detailed MPS analysis reserved for complex geometries or critical performance validation scenarios.

6. Conclusions

This study investigated cement–bentonite slurries with hydration accelerators for borehole backfilling using integrated experimental testing and MPS numerical modeling. The key findings are as follows:
The experimental–numerical approach successfully characterized time-dependent rheological evolution, revealing that higher accelerator content (10 kg/m3) produces superior performance through enhanced phase stability and controlled workability retention. Yield stress emerged as the dominant rheological parameter governing both flow characteristics and bleeding resistance, exhibiting substantial increases (>8000% from initial values) while plastic viscosity remained relatively constant.
MPS simulations incorporating time-dependent viscosity changes accurately predicted experimental behavior, while constant-viscosity models overestimated bleeding rates by 60–130%. This confirms that rheological evolution during early-age hydration is critical for predicting material performance and validates the necessity of time-dependent modeling approaches for cementitious materials.
The higher accelerator formulation (Case-2) provides an optimal balance between initial workability (~50 min working time) and long-term stability (1.5% bleeding rate), making it suitable for typical borehole backfilling operations. The integrated methodology offers construction practitioners a robust framework for material optimization and performance prediction in infrastructure reconstruction projects.
This research advances fundamental understanding of cement–bentonite slurry behavior while providing practical guidance for improving borehole backfilling practices through systematic consideration of time-dependent rheological properties.

Author Contributions

Conceptualization, S.I.; methodology, S.I.; software, K.T.; validation, S.K. and S.I.; formal analysis, S.I.; investigation, K.T. and S.K.; resources, K.T. and S.K.; data curation, S.I.; writing—original draft preparation, S.I.; writing—review and editing, S.I.; visualization, S.I.; supervision, S.I.; project administration, S.I.; funding acquisition, S.I. All authors have read and agreed to the published version of the manuscript.

Funding

This research received no external funding.

Data Availability Statement

The data that support the findings of this study are available from the corresponding author, Shinya Inazumi, upon reasonable request.

Acknowledgments

This study was supported by the FY2025 Construction Technology Research and Development Subsidy Program of the Ministry of Land, Infrastructure, Transport and Tourism (MLIT), Japan. The authors gratefully acknowledge this financial support.

Conflicts of Interest

The author Kazuhiko Tazuke was employed by the company Toyoken Co. Ltd., the author Seiya Kashima was employed by the company Sanko Colloid Chemical Co. Ltd. The remaining author declares that the research was conducted in the absence of any commercial or financial relationships that could be construed as a potential conflict of interest.

References

  1. Ministry of Land, Infrastructure, Transport and Tourism. Infrastructure Maintenance in Japan: Current Status and Future Challenges; MLIT: Tokyo, Japan, 2022. Available online: https://www.mlit.go.jp/en/statistics/content/001586035.pdf (accessed on 16 June 2025).
  2. Ministry of Land, Infrastructure, Transport and Tourism. Roads in Japan 2023; MLIT: Tokyo, Japan, 2023. Available online: https://www.mlit.go.jp/road/road_e/pdf/Road2023web.pdf (accessed on 16 June 2025).
  3. Ministry of the Environment, Japan. Construction Material Recycling Law; Ministry of the Environment: Tokyo, Japan, 2001. Available online: https://www.env.go.jp/content/900452889.pdf (accessed on 16 June 2025).
  4. Nakajima, S.; Arikawa, S.; Koga, J.; Futaki, M. The state of deconstruction in Japan. In CIB Publication 300: Deconstruction and Materials Reuse; International Council for Research and Innovation in Building and Construction: Rotterdam, The Netherlands, 2005; pp. 113–126. Available online: https://www.irbnet.de/daten/iconda/CIB1297.pdf (accessed on 16 June 2025).
  5. Inazumi, S. Technical challenges and innovations in existing pile extraction and associated borehole backfilling in Japan. Case Stud. Constr. Mater. 2024, 20, e03111. [Google Scholar] [CrossRef]
  6. Olutoge, F.A. Study of Causes of Foundation Failures. Project List 2009. Available online: https://projectlist.com.ng/project-material-on-study-causes-foundation-failures (accessed on 16 June 2025).
  7. Mathern, A.; Magnusson, J. Lessons learned from the construction, inspection, and defect assessment of reinforced concrete foundations for wind turbines. Appl. Sci. 2022, 12, 1443. [Google Scholar] [CrossRef]
  8. Wu, Y.; Fu, J.; Ni, P.; Shen, S. Engineering properties of novel vertical cutoff wall backfills composed of MgO-activated GGBS, bentonite, and polyacrylamide cellulose. Materials 2023, 16, 4971. [Google Scholar] [CrossRef]
  9. Ryan, C.R.; Day, S.R.; McLeod, D.W. Long-distance grouting, materials and methods. In Proceedings of the Grouting Conference 2003, New Orleans, LA, USA, 10–12 February 2003; Geo-Solutions: Pittsburgh, PA, USA, 2003; pp. 1–22. [Google Scholar]
  10. U.S. Environmental Protection Agency. Slurry Trench Construction for Pollution Migration Control (EPA/540/S-97/504); U.S. EPA: Washington, DC, USA, 2000.
  11. Yin, S.H.; Yan, Z.P. The effect of coarse aggregate on the bleeding and mechanical properties of cemented paste backfill. J. Cent. South Univ. 2023, 30, 555–567. [Google Scholar] [CrossRef]
  12. Inazumi, S.; Kuwahara, S. Numerical simulation of backfilling behavior of boreholes. Results Eng. 2024, 21, 101907. [Google Scholar] [CrossRef]
  13. Inazumi, S.; Shiina, M.; Nakao, K. Aeration curing for recycling construction-generated sludge and its effect of immobilizing carbon dioxide. Case Stud. Constr. Mater. 2024, 20, e02704. [Google Scholar] [CrossRef]
  14. Wang, Y.; Qi, T.; Xu, C.; Gong, J. Rheological properties and permeation grouting reinforcement effect of cement-bentonite slurry. Buildings 2025, 15, 744. [Google Scholar] [CrossRef]
  15. Sun, H.; Jiang, Y.; Zhang, Y.; Jiang, L. A review of constitutive models for non-Newtonian fluids. Fract. Calc. Appl. Anal. 2024, 27, 1483–1526. [Google Scholar] [CrossRef]
  16. Liang, W.; Fang, H.; Yin, Z.Y.; Zhao, J. A mortar segment-to-segment frictional contact approach in material point method. Comput. Methods Appl. Mech. Eng. 2024, 431, 117294. [Google Scholar] [CrossRef]
  17. Kondo, M.; Koshizuka, S. Improvement of stability in moving particle semi-implicit method. Int. J. Numer. Methods Fluids 2011, 65, 638–654. [Google Scholar] [CrossRef]
  18. Shakya, S.; Inazumi, S. Applicability of numerical simulation by particle method to unconfined compression tests on geomaterials. Civ. Eng. J. 2024, 10, 1–19. [Google Scholar] [CrossRef]
  19. Dev, K.L.; Kumar, D.R.; Wipulanusat, W. Performance evaluation of pond ash-enhanced flowable fill for plastic concrete cutoff walls in earthen dams using advanced machine learning models. Arab. J. Sci. Eng. 2025; in press. [Google Scholar] [CrossRef]
  20. Sharma, A.; Gupta, S.; Husain, M.N.; Chaudhary, S. Factors affecting the rheology of cement-based composites: A review. J. Am. Ceram. Soc. 2025, 108, e20429. [Google Scholar] [CrossRef]
  21. Nagaraju, T.V.; Ravindran, G. Ground Improvement Techniques for Sustainable Engineering; Bentham Science Publishers: Sharjah, United Arab Emirates, 2025. [Google Scholar]
  22. Shigematsu, Y.; Inazumi, S.; Hashimoto, R.; Yamauchi, H. Experimental study on properties of liquefied stabilized soil produced with different types of solidifiers and thickeners. Case Stud. Constr. Mater. 2023, 19, e02407. [Google Scholar] [CrossRef]
  23. Chen, M.; Liu, B.; Li, L.; Cao, L.; Huang, Y.; Wang, S.; Zhao, P.; Li, Y. Rheological parameters, thixotropy and creep of 3D-printed calcium sulfoaluminate cement composites modified by bentonite. Compos. B Eng. 2020, 186, 107821. [Google Scholar] [CrossRef]
  24. Strnadel, B.; Ma, M.; He, X.; Tan, H.; Wang, Y.; Su, Y.; Zhang, H. A comparative study on concrete slurry waste: Performance optimization from the wet-milling process. Mater. Struct. 2021, 54, 184. [Google Scholar] [CrossRef]
  25. Nontananandh, S.; Kuwahara, S.; Shishido, K.; Inazumi, S. Influence of perforated soils on installation of new piles. Appl. Sci. 2022, 12, 7712. [Google Scholar] [CrossRef]
  26. Inazumi, S.; Tanaka, S.; Komaki, T.; Kuwahara, S. Evaluation of effect of insertion of casing by rotation on existing piles. Geotech. Res. 2021, 8, 25–37. [Google Scholar] [CrossRef]
  27. Weijie, Z.; Yuanlin, Y.; Chenghao, C.; Pengfei, P.; Yue, G.; Yixiang, W. Experimental study on stability and hydration process of ultra-fine cement-based slurry. Powder Technol. 2025, 459, 121012. [Google Scholar] [CrossRef]
  28. Gaurina-Međimurec, N.; Pašić, B.; Mijić, P.; Medved, I. Drilling fluid and cement slurry design for naturally fractured reservoirs. Appl. Sci. 2021, 11, 767. [Google Scholar] [CrossRef]
  29. Altay, B.N.; Lewis, C.L. Rheological characterization. In Standardized Procedures and Protocols for Starch. Methods and Protocols in Food Science; Bangar, S.P., Ed.; Humana: New York, NY, USA, 2024. [Google Scholar] [CrossRef]
  30. Wang, X.; Li, S.; Zhou, A.; Liu, R.; Duan, S.; Wang, M. Influence of the bleeding characteristic on density and rheology in cement slurry. Constr. Build. Mater. 2021, 269, 121316. [Google Scholar] [CrossRef]
  31. Ji, Y.; Pott, U.; Mezhov, A.; Rößler, C.; Stephan, D. Modelling and experimental study on static yield stress evolution and structural build-up of cement paste in early stage of cement hydration. Cem. Concr. Res. 2025, 187, 107710. [Google Scholar] [CrossRef]
  32. Elgeti, S.; Sauerland, H. Deforming fluid domains within the finite element method: Five mesh-based tracking methods in comparison. Arch. Comput. Methods Eng. 2016, 23, 323–361. [Google Scholar] [CrossRef]
  33. Koshizuka, S.; Shibata, K.; Kondo, M.; Matsunaga, T. Moving Particle Semi-Implicit Method: A Meshfree Particle Method for Fluid Dynamics; Academic Press: Cambridge, MA, USA, 2018. [Google Scholar]
  34. Xu, Z.; Li, Z.; Jiang, F. The applicability of SPH and MPS methods to numerical flow simulation of fresh cementitious materials. Constr. Build. Mater. 2021, 274, 121736. [Google Scholar] [CrossRef]
  35. Weng, Y.; Lu, B.; Li, M.; Liu, Z.; Tan, M.J.; Qian, S. Empirical models to predict rheological properties of fiber reinforced cementitious composites for 3D printing. Constr. Build. Mater. 2018, 189, 676–685. [Google Scholar] [CrossRef]
  36. Liu, C.; Qian, R.; Liu, Z.; Liu, G.; Zhang, Y. Multi-scale modelling of thermal conductivity of phase change material/recycled cement paste incorporated cement-based composite material. Mater. Des. 2020, 191, 108646. [Google Scholar] [CrossRef]
  37. Mangal, D.; Jha, A.; Dabiri, D.; Jamali, S. Data-driven techniques in rheology: Developments, challenges and perspective. Curr. Opin. Colloid Interface Sci. 2024, 67, 101873. [Google Scholar] [CrossRef]
  38. Fareh, F.; Demers, V.; Demarquette, N.R.; Turenne, S.; Scalzo, O. Influence of segregation on rheological properties of wax-based feedstocks. Powder Technol. 2017, 320, 273–284. [Google Scholar] [CrossRef]
  39. ASTM C305-20; Standard Practice for Mechanical Mixing of Hydraulic Cement Pastes and Mortars of Plastic Consistency. ASTM International: West Conshohocken, PA, USA, 2020.
  40. Japan Society of Civil Engineers. JSCE-F 522: Test Method for Bleeding Rate and Expansion Rate of Injected Mortar of Prepacked Concrete (Polyethylene Bag Method); JSCE: Tokyo, Japan, 2017. [Google Scholar]
  41. Sharma, A.K.; Sivapullaiah, P.V. Ground granulated blast furnace slag amended fly ash as an expansive soil stabilizer. Soils Found. 2016, 56, 205–212. [Google Scholar] [CrossRef]
  42. Inazumi, S.; Hashimoto, R.; Aizawa, E.; Kuwahara, S.; Shishido, K. Applicability of waste silica-based additive with surfactant-type liquid thickener as borehole filler. J. Mater. Cycles Waste Manage. 2023, 25, 3776–3790. [Google Scholar] [CrossRef]
  43. Sonebi, M.; Abdalqader, A.; Fayyad, T.; Perrot, A.; Bai, Y. Optimisation of rheological parameters, induced bleeding, permeability and mechanical properties of supersulfated cement grouts. Constr. Build. Mater. 2020, 262, 120078. [Google Scholar] [CrossRef]
  44. Duan, G.; Koshizuka, S.; Yamaji, A.; Chen, B.; Li, X.; Tamai, T. An accurate and stable multiphase moving particle semi-implicit method based on a corrective matrix for all particle interaction models. Int. J. Numer. Methods Eng. 2018, 115, 1287–1314. [Google Scholar] [CrossRef]
  45. Kuwano, J.; Katagiri, M.; Kita, K.; Nakano, M.; Kuwano, R. A review of Japanese standards for laboratory shear tests. In Advanced Laboratory Stress-Strain Testing of Geomaterials; Routledge: London, UK, 2018; pp. 53–64. [Google Scholar]
  46. Ai, D.; Lin, C.; Zhu, H. Embedded piezoelectric transducers based early-age hydration monitoring of cement concrete added with accelerator/retarder admixtures. J. Intell. Mater. Syst. Struct. 2021, 32, 847–866. [Google Scholar] [CrossRef]
  47. Long, K.; Li, B.; Ma, J.; Liu, H.; Li, J. Ecological risk analysis of leakage caused by coal-based solid waste backfill slurry bleeding: An experimental study. J. Clean Prod. 2025, 486, 144993. [Google Scholar] [CrossRef]
  48. de Miranda, L.R.; Marchesini, F.H.; Lesage, K.; De Schutter, G. The evolution of the rheological behavior of hydrating cement systems: Combining constitutive modeling with rheometry, calorimetry and mechanical analyses. Cem. Concr. Res. 2023, 164, 107046. [Google Scholar] [CrossRef]
  49. Huang, F.; Chen, L.; Sheng, W.; Shang, X.; Zhang, Z. Thixotropy and gelation characteristics of thermosensitive polymer nanofluids at high temperature. Colloids Surf. A Physicochem. Eng. Asp. 2025, 709, 136340. [Google Scholar] [CrossRef]
  50. Gurt, A.; Khonsari, M. A review of the rheological consistency of materials. Lubricants 2024, 12, 236. [Google Scholar] [CrossRef]
  51. Roussel, N.; Coussot, P. “Fifty-cent rheometer” for yield stress measurements: From slump to spreading flow. J. Rheol. 2005, 49, 705–718. [Google Scholar] [CrossRef]
  52. Bentz, D.P.; Ferraris, C.F.; Galler, M.A.; Hansen, A.S.; Guynn, J.M. Influence of particle size distributions on yield stress and viscosity of cement-fly ash pastes. Cem. Concr. Res. 2012, 42, 404–409. [Google Scholar] [CrossRef]
  53. Wallevik, O.H.; Wallevik, J.E. Rheology as a tool in concrete science: The use of rheographs and workability boxes. Cem. Concr. Res. 2011, 41, 1279–1288. [Google Scholar] [CrossRef]
  54. Zhang, Z.; Song, Z.; Ke, G.; Dong, X. Strengthening mechanism of red mud with calcium oxide. Constr. Build. Mater. 2024, 424, 135932. [Google Scholar] [CrossRef]
  55. Li, J.Q.; Fan, T.H. Phase-field modeling of macroscopic freezing dynamics in a cylindrical vessel. Int. J. Heat Mass Transf. 2020, 156, 119915. [Google Scholar] [CrossRef]
  56. Loewinger, G.; Cui, E.; Lovinger, D.; Pereira, F. A statistical framework for analysis of trial-level temporal dynamics in fiber photometry experiments. Elife 2025, 13, RP95802. [Google Scholar] [CrossRef] [PubMed]
  57. Evans, J.C.; Larrahondo, J.M.; Yeboah, N.N.N. Fate of bentonite in slag–cement–bentonite slurry trench cut-off walls for polluted sites. Environ. Geotech. 2021, 10, 319–331. [Google Scholar] [CrossRef]
Figure 1. Wire rope method for pile extraction with casing insertion and rotation.
Jcs 09 00361 g001
Figure 2. Key materials used in cement–bentonite slurry formulations: (a) Ordinary Portland cement (density 3.14 g/cm3), (b) sodium-activated bentonite clay, (c) hydration accelerator composed of basic magnesium carbonate and montmorillonite.
Jcs 09 00361 g002
Figure 3. Flow test experimental procedure and apparatus: (a) Brass cylinder (80 mm diameter × 80 mm height) positioned on glass plate with concentric measurement circles, (b) cylinder filling process with slurry sample, (c) controlled cylinder lifting sequence, (d) flow spread measurement at different time intervals, (e) comparison of flow patterns between Case-1 (5 kg/m3 accelerator) and Case-2 (10 kg/m3 accelerator) showing progressive flow diameter reduction over time.
Jcs 09 00361 g003
Figure 4. Bleeding test setup and specimen evolution: (a) Transparent polyethylene bags (50 mm diameter × 300 mm height) filled with fresh slurry to 200 mm height, (b) progressive bleeding water separation observed at 1, 6, and 24 h, (c) measurement apparatus for bleeding water volume ( W b ) at specimen top, (d) visual comparison between Case-1 and Case-2 formulations after 24 h, clearly demonstrating the enhanced phase stability achieved with higher accelerator content.
Jcs 09 00361 g004
Figure 5. Bi-viscosity model representation of Bingham plastic behavior in MPS framework.
Jcs 09 00361 g005
Figure 6. Cross-sectional configuration of MPS model for flow test simulation.
Jcs 09 00361 g006
Figure 7. Determination of rheological parameters using iterative inverse analysis.
Jcs 09 00361 g007
Figure 8. Cross-sectional configuration of MPS model for bleeding test simulation.
Jcs 09 00361 g008
Figure 9. Time-dependent evolution of flow spread diameter for cement–bentonite slurries with different hydration accelerator dosages. Case-1: 5 kg/m3 accelerator content; Case-2: 10 kg/m3 accelerator content. Flow spread diameter measured using JHS A 313 standard procedure with 80 mm diameter brass cylinder. Error bars represent standard deviation from triplicate measurements.
Jcs 09 00361 g009
Figure 10. MPS simulation results showing particle flow behavior (red: flowing particles, blue: immobile particles).
Jcs 09 00361 g010
Figure 11. Comparison of particle distribution after 24 h bleeding simulation: (a) Case-1 with time-dependent viscosity, (b) Case-1 with constant viscosity, (c) Case-2 with time-dependent viscosity, and (d) Case-2 with constant viscosity.
Jcs 09 00361 g011
Figure 12. Vertical distribution of water particle fraction after 24 h bleeding simulation: (a) Case-1 with time-dependent viscosity, (b) Case-1 with constant viscosity, (c) Case-2 with time-dependent viscosity, and (d) Case-2 with constant viscosity.
Jcs 09 00361 g012
Figure 13. Time-dependent evolution of yield stress ( τ y ) determined through iterative inverse analysis of MPS flow simulations. Case-1: cement–bentonite slurry with 5 kg/m3 hydration accelerator; Case-2: cement–bentonite slurry with 10 kg/m3 hydration accelerator. Yield stress values obtained by matching simulated and experimental flow spread diameters using bi-viscosity Bingham plastic model. Data points represent rheological parameters at 10 min intervals.
Jcs 09 00361 g013
Figure 14. Time-dependent evolution of plastic viscosity ( η ) determined through iterative inverse analysis of MPS flow simulations. Case-1: cement–bentonite slurry with 5 kg/m3 hydration accelerator; Case-2: cement–bentonite slurry with 10 kg/m3 hydration accelerator. Plastic viscosity values obtained by matching simulated and experimental flow stoppage times using bi-viscosity Bingham plastic model. Data points represent rheological parameters at 10 min intervals.
Jcs 09 00361 g014
Table 1. Mix proportions of cement–bentonite slurry formulations.
CaseUnit Content (kg/m3)
C
(s.g. 3.14)
B
(s.g. 2.60)
EH
(s.g. 2.30)
W
(s.g. 1.00)
1250255908.85
210906.65
Table 2. Material density parameters for flow test MPS simulation.
CaseMixture Density (kg/m3)
11191
21191
Table 3. Volume fractions and particle visualization in bleeding test MPS model.
ComponentVolume Fraction (%)Particle Color
Water91.04Light blue
Cement7.99Red
Bentonite0.97Yellow
Table 4. Density parameters for bleeding test MPS simulation.
ComponentDensity (kg/m3)
Water1000
Cement2849
Bentonite1093
Table 5. Flow stoppage time measurements in flow tests.
CaseTesting Intervals (min)Flow Stoppage Time (Seconds)
10, 10, 20, 30, 40, 50, 600.3–0.4
2
Table 6. Bleeding test results with statistical analysis.
CaseBleeding Rate (%)Standard Deviation (%)Number of Replicates
12.5 ± 0.30.33
21.5 ± 0.20.23
Table 7. Predicted bleeding rates for bleeding test MPS simulation.
CaseViscosity Change with TimeBleeding Rate (%)
1Time-dependent2.43
Constant3.98
2Time-dependent1.94
Constant4.46
Table 8. Key rheological parameters at critical time intervals determined through inverse analysis.
CaseTime
(min)
Yield Stress
(Pa)
Plastic Viscosity
(Pa·s)
Critical Shear Rate
(s−1)
101.80.090.05
3060.3
60290.6
2020.180.05
30300.6
601702.0
Disclaimer/Publisher’s Note: The statements, opinions and data contained in all publications are solely those of the individual author(s) and contributor(s) and not of MDPI and/or the editor(s). MDPI and/or the editor(s) disclaim responsibility for any injury to people or property resulting from any ideas, methods, instructions or products referred to in the content.

