Article

Fiber Orientation Effects in CFRP Milling: Multiscale Characterization of Cutting Dynamics, Surface Integrity, and Damage Mechanisms

1
Faculty of Mechanical Engineering, Qilu University of Technology (Shandong Academy of Sciences), Jinan 250353, China
2
Key Laboratory of Equipments Manufacturing and Intelligent Measurement and Control, China National Light Industry, Qilu University of Technology (Shandong Academy of Sciences), Jinan 250353, China
*
Author to whom correspondence should be addressed.
J. Compos. Sci. 2025, 9(7), 342; https://doi.org/10.3390/jcs9070342
Submission received: 6 June 2025 / Revised: 26 June 2025 / Accepted: 30 June 2025 / Published: 2 July 2025

Abstract

During the machining of unidirectional carbon fiber-reinforced polymers (UD-CFRPs), their anisotropic characteristics and the complex cutting conditions often lead to defects such as delamination, burrs, and surface/subsurface damage. This study systematically investigates the effects of different fiber orientation angles (0°, 45°, 90°, and 135°) on cutting force, chip formation, stress distribution, and damage characteristics using a coupled macro–micro finite element model. The model successfully captures key microscopic failure mechanisms, such as fiber breakage, resin cracking, and fiber–matrix interface debonding, by integrating the anisotropic mechanical properties and heterogeneous microstructure of UD-CFRPs, thereby more realistically replicating the actual machining process. The cutting speed is kept constant at 480 mm/s. Experimental validation using T700S/J-133 laminates (with a 70% fiber volume fraction) shows that, on a macro scale, the cutting force varies non-monotonically with the fiber orientation angle, following the order of 0° < 45° < 135° < 90°. The experimental values are 24.8 N/mm < 35.8 N/mm < 36.4 N/mm < 44.1 N/mm, and the simulation values are 22.9 N/mm < 33.2 N/mm < 32.7 N/mm < 42.6 N/mm. The maximum values occur at 90° (44.1 N/mm, 42.6 N/mm), while the minimum values occur at 0° (24.8 N/mm, 22.9 N/mm). The chip morphology significantly changes with fiber orientation: 0° produces strip-shaped chips, 45° forms block-shaped chips, 90° results in particle-shaped chips, and 135° produces fragmented chips. On a micro scale, the microscopic morphology of the chips and the surface damage characteristics also exhibit gradient variations consistent with the experimental results. The developed model demonstrates high accuracy in predicting damage mechanisms and material removal behavior, providing a theoretical basis for optimizing CFRP machining parameters.

1. Introduction

Carbon fiber reinforced polymer (CFRP) exhibits superior mechanical properties, including excellent strength-to-weight ratio, high elastic modulus, and corrosion resistance [1,2,3]. Compared to traditional metallic materials, CFRP composites are increasingly applied in fields such as aerospace engineering, automotive industry, and defense technology. Although CFRP components can be molded through primary manufacturing processes, secondary operations are often required to achieve dimensional precision and interface compatibility for component assembly and structural integration. Among these, milling operations are particularly important in the production of CFRP components to meet stringent dimensional tolerances and achieve excellent edge integrity. Unlike drilling processes, milling removes material through the lateral motion of the tool [4]. The inherent anisotropy and heterogeneous microstructure of CFRP composites make the milling process prone to typical defects, including interlaminar delamination [5] and burrs caused by fiber protrusion [6]. Therefore, systematically studying the material removal kinematics in composite machining and deeply understanding the initiation mechanisms of defects is crucial for advancing surface integrity in CFRP manufacturing.
A critical factor influencing the machinability of CFRP is the fiber orientation angle (FOA), which significantly affects mechanical response, cutting forces, surface roughness, and chip formation [7,8,9]. Numerous studies have demonstrated that FOA alters cutting energy and dominant failure modes [10,11]. For instance, He et al. [12] proposed a milling model that improved the accuracy of cutting force predictions, while Geier et al. [13] and He et al. [14] reported that cutting forces generally increase with FOA due to changes in the tool-fiber interaction geometry.
The failure mechanisms in CFRP machining—including fiber fracture, matrix cracking, and fiber–matrix debonding—are closely linked to FOA [15,16]. Milling experiments conducted at 0°, 45°, 90°, and 135° FOA reveal distinct stress distributions and fracture patterns [17,18]. Detailed surface morphology studies further confirm the correlation between fiber orientation and surface roughness [19,20,21]. Chip formation also exhibits FOA-dependent characteristics: at 0° and 45°, chips primarily form via fiber bending, whereas at 90° and 135°, they are dominated by extrusion-induced fractures [22]. Ge et al. [23,24] extended this observation in drilling studies, demonstrating that fiber orientation fundamentally alters material removal paths and fracture surfaces.
From a modeling perspective, Cepero-Mejías and Wang [25,26,27] employed macroscale finite element models to simulate machining-induced damage and analyze FOA effects. However, these models often fail to address interfacial damage or phase-specific failure modes. To overcome this, several micromechanical modeling approaches have been proposed. For example, microscale simulations reveal resin cracking and interfacial debonding under different fiber cutting angles [28]. Thermomechanically coupled micro-cutting models enable precise characterization of 3D damage evolution [29]. Energy-based progressive damage models, incorporating Hashin and maximum stress criteria, have also improved the accuracy of cutting force and near-surface damage predictions [30,31].
Although previous studies have explored the effects of fiber orientation angle on cutting forces and damage evolution during CFRP milling, most investigations have focused on a single scale—either macroscopic or microscopic—making it difficult to comprehensively reveal the multiscale damage mechanisms. Macroscopic models struggle to capture microscopic debonding behaviors at the fiber–matrix interface, while microscopic models often overlook the evolution trends of macroscopic cutting forces and surface morphology. Moreover, existing research provides limited quantitative correlation between fiber orientation, chip morphology, and subsurface damage depth, which constrains the optimization of machining parameters.
Therefore, this study develops a coupled macro–microscopic finite element model combined with systematic experiments to simultaneously predict cutting force evolution, chip formation, and microscopic damage behavior. By observing surface and chip morphologies, the research achieves a quantitative and mechanistic understanding of fiber orientation-dependent damage behaviors, providing a theoretical basis for optimizing CFRP milling processes.

2. Macroscopic Theoretical Model

This study assumes that CFRP composites are orthotropic homogeneous materials with no independent fiber, matrix, or interface phases. When the load exceeds the material’s intrinsic strength limit, the material will experience damage, reducing stiffness. The stress–strain relationship [32] is as shown in Equation (1):
σ = C : ε M
where σ is stress, εM is mechanical strain, and C is the stiffness matrix. When the composite material satisfies the damage initiation criteria, the symmetric damage stiffness matrix can be represented as follows:
C d = 1 / Δ d f E 11 ( 1 d m ν 23 ν 32 ) d f d m E 11 ( ν 21 + ν 23 ν 31 ) d f E 11 ( ν 31 + d m ν 21 ν 32 ) d m E 22 ( 1 d f ν 13 ν 31 ) d m E 22 ( ν 32 + d f ν 12 ν 31 ) E 33 ( 1 d f d m ν 12 ν 21 ) Δ d f d m S 12 Δ d f d m S 23 Δ d f d m S 13
Cd is the symmetric stiffness matrix after damage. The 1/Δ is a factor used for normalizing the stiffness matrix in the damage model, ensuring the numerical stability during the damage evolution process. Vij (ij = 1,2,3) and Sij (ij = 1,2,3) represent Poisson’s ratio and shear strength, respectively. df/dm is the damage variable for the fiber and matrix, calculated as follows:
d f = ( 1 d f t ) ( 1 d f c ) d m = ( 1 S m t d m t ) ( 1 S m c d m c ) Δ = 1 d f d m ν 12 ν 21 d m ν 23 ν 32 d f ν 13 ν 31 2 d f d m ν 21 ν 32 ν 13
In the equation, dI represents the damage variable, and the subscripts ft, fc, mt, and mc denote the damage under fiber tension, fiber compression, matrix tension, and matrix compression, respectively. Smt and Smc are the introduction coefficients controlling the shear stiffness loss caused by matrix tension and compression failure, with values of 0.9 and 0.5 for Smt and Smc, respectively [33].

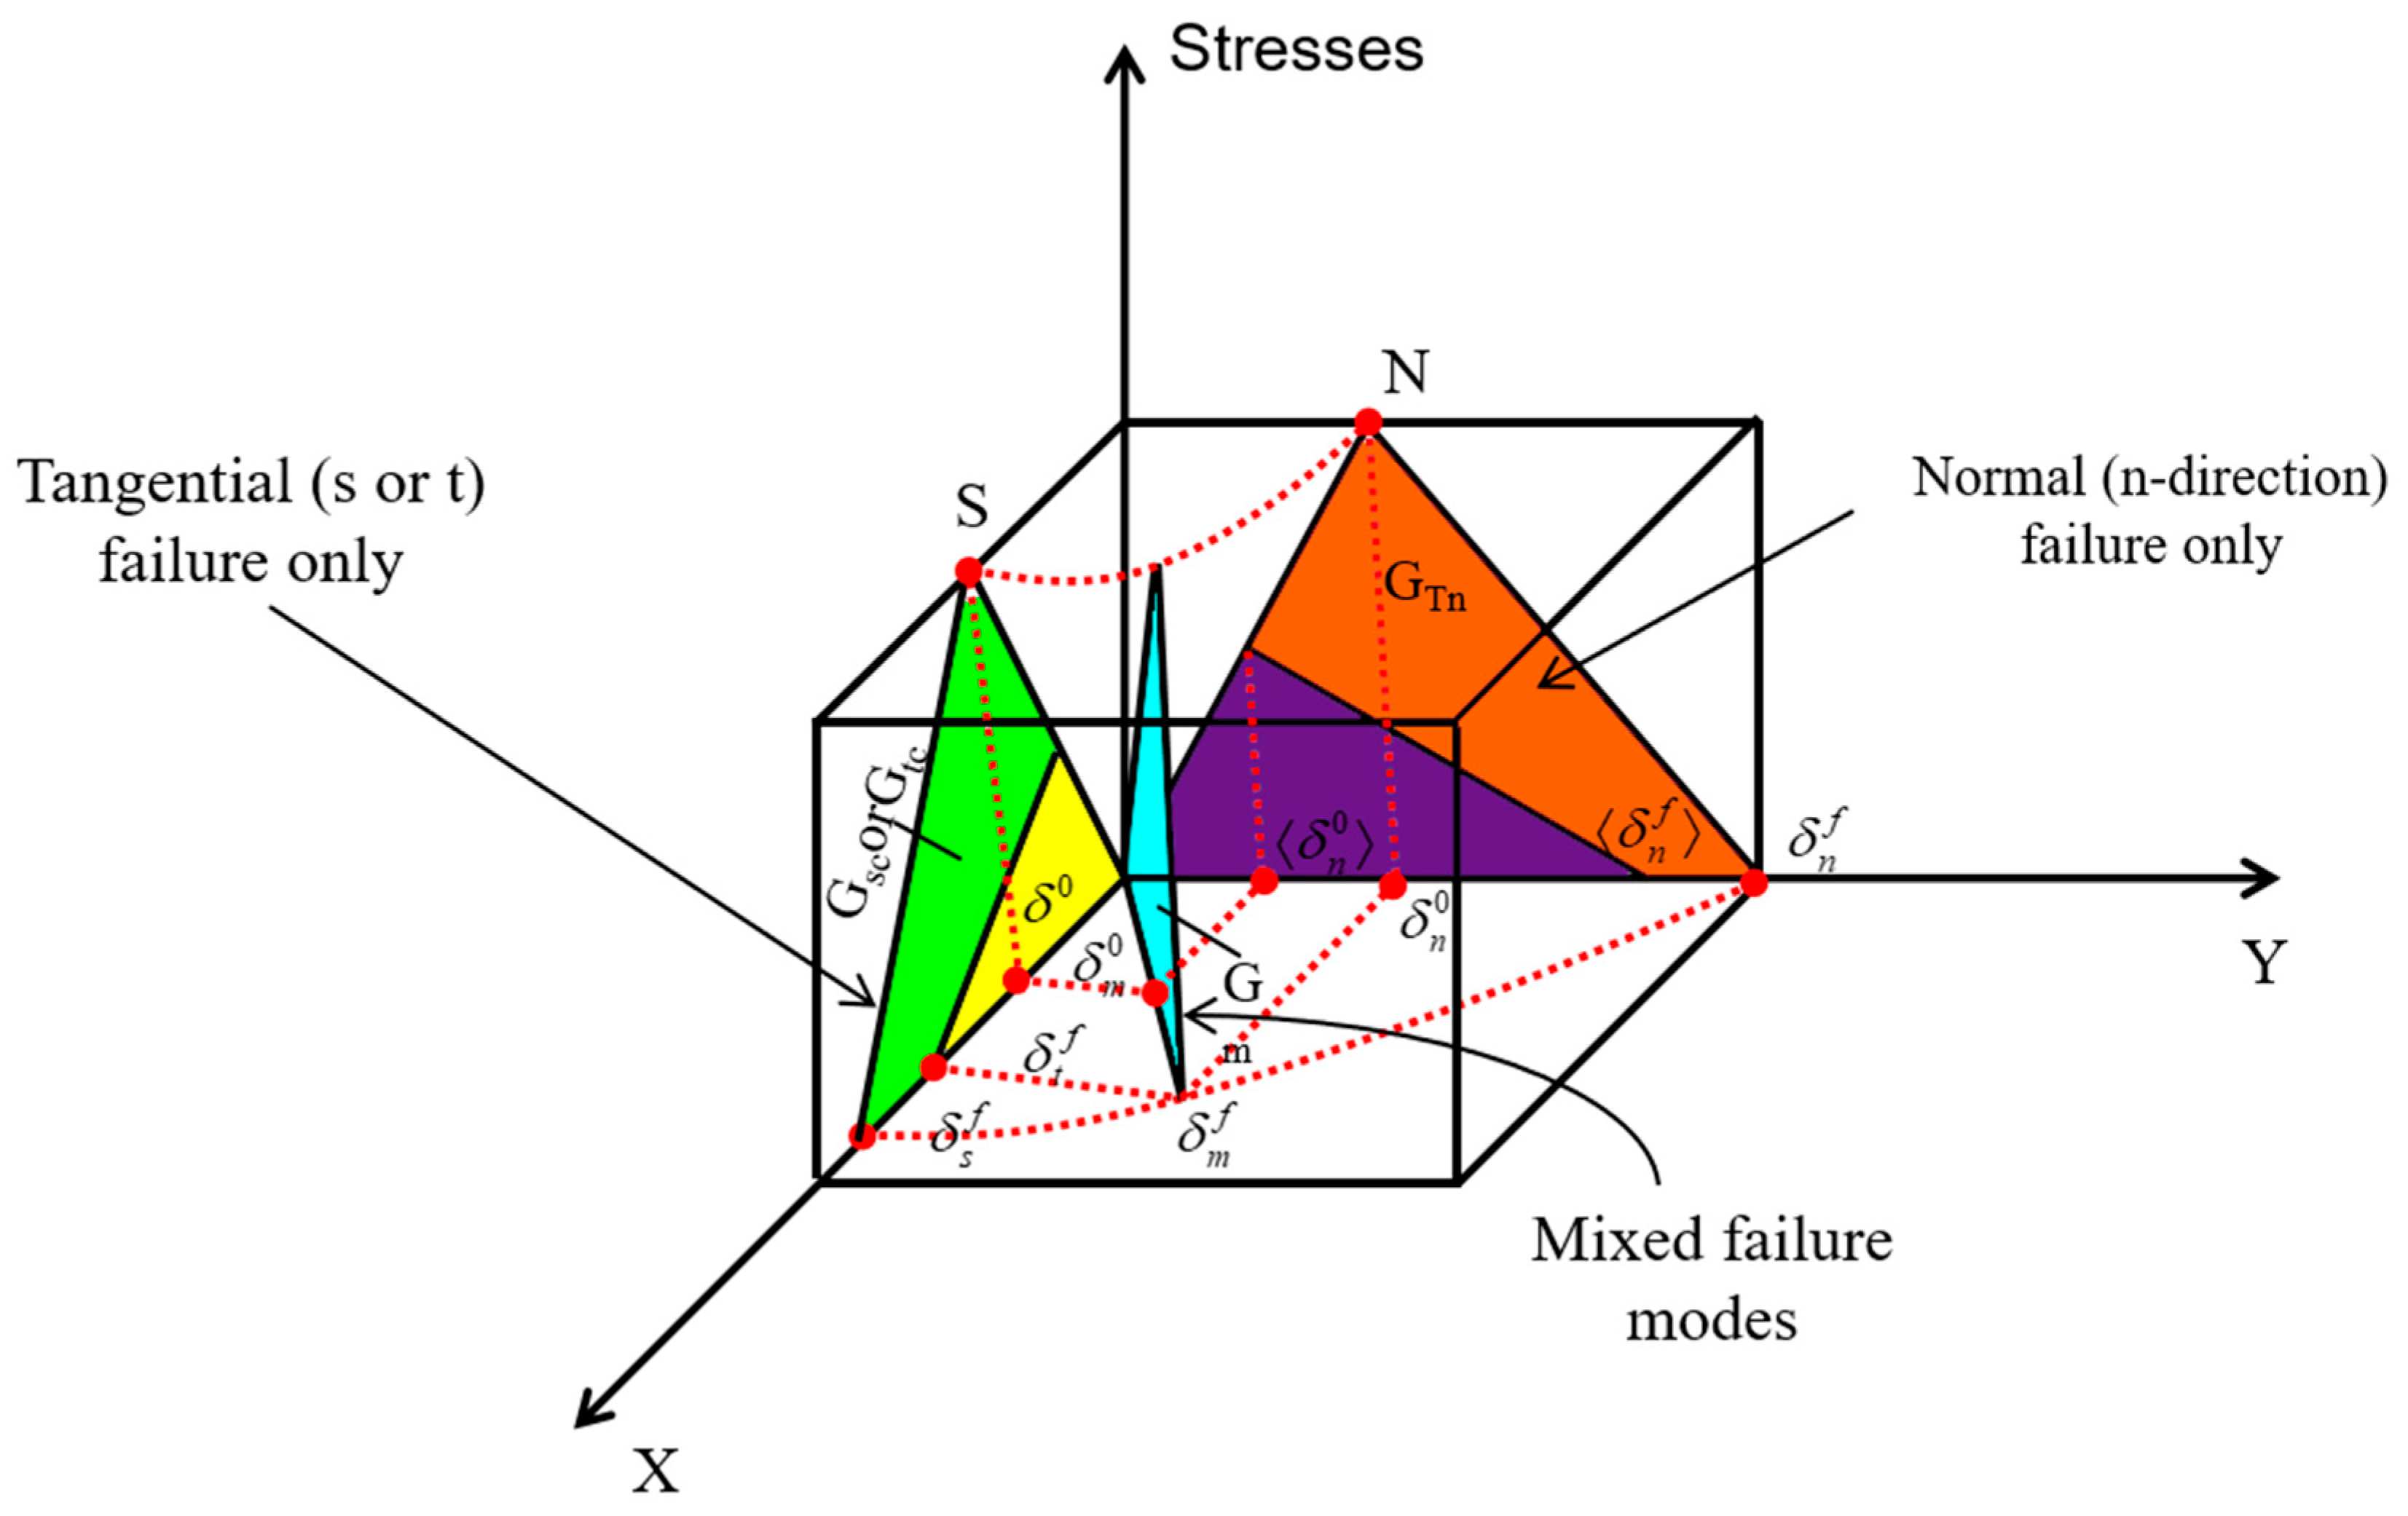
2.1. Damage Initiation Criteria and Evolution Laws

2.1.1. Damage Failure Criterion

The damage failure criterion for the macro milling process of composite materials is the 3D Hashin failure criterion [34], consisting of four modes: fiber tension, fiber compression, matrix tension, and matrix compression. The four failure modes are expressed as follows:
Fiber tension (ε11 ≥ 0)
F f t = ( ε 11 ε / ε f t ε , 0 ) 2 1 , ε f t ε , 0 = X T / E 11
Fiber compression (ε11 < 0)
F f t = ( ε 11 ε / ε f t ε , 0 ) 2 1 , ε f t ε , 0 = X T / E 11
Matrix tension (ε22 + ε33 ≥ 0)
F m t = ( ε 22 ε / ε m t ε , 0 ) 2 1 , ε m t ε , 0 = Y T / E 22
Matrix compression (ε22 + ε33 < 0)
F m c = [ ( E 22 ε 22 + E 33 ε 33 ) / 2 S 12 ] 2 + ( ε 22 + ε 33 ) / ε m c ε .0 [ ( E 22 ε m c ε , 0 / 2 S 12 ) 2 1 ] + ( G 23 / S 23 ) 2 { ε 23 2 [ ( E 22 E 23 ) / G 23 ] ε 22 ε 33 } + [ ( G 12 ε 12 ) / S 12 ] 2 + [ ( G 13 ε 13 ) / S 13 ] 2 1 , ε m ε , 0 = Y c / E 22
In the equation, ε i j ε and Eii (i,j = 1,2,3) represents the elastic strain tensor and Young’s modulus, respectively. ε f t ε , 0 , ε f c ε , 0 , ε m t ε , 0 and ε m c ε , 0 represent the initial failure elastic strains for the respective failure modes. XT and XC represent the tensile and compressive strengths in the fiber direction, respectively. YT and YC represent the transverse tensile and compressive strengths, respectively. G12, G13, and G23 are the shear moduli. S12, S13, and S23 are the shear strengths.

2.1.2. Damage Evolution Model

According to the damage initiation criterion, damage occurs once the damage index reaches or exceeds 1. This study uses a progressive damage model based on the fracture energy of composite materials [33,35] to describe the decline in mechanical properties after damage occurs. The evolution process is as follows:
d i = ε i e , f / ε i e , f ε i e , 0 ( 1 ε i e , 0 / ε i e ) d i ( 0 , 1 ) , i = f t , f c , m t , m c
In the equation, ε i e ( i = f t , f c , m t , m c ) is the elastic strain in the corresponding direction. ε i e , 0 is the initial failure elastic strain for different failure modes. ε i e , f i = f t , f c , m t , m c is the final failure elastic strain when the corresponding damage variable reaches 1. The corresponding expression is as follows:
ε f t e , f = 2 G f t / X T l ε f c e , f = 2 G f c / X C l ε m t e , f = 2 G m t / Y T l ε m c e , f = 2 G m c / Y C l
In the equation, G i ( i = ft , fc , mt , mc ) is the fracture energy for the corresponding failure mode [33]. l is the element’s characteristic length, calculated as the cube root of the corresponding element volume.
L = ( L i n i t i a l ) 3 / l z
Linitial denotes the initial characteristic length of the element. lz denotes the thickness of elements in the predefined local coordinate system.

2.1.3. Macroscopic Finite Element Model

The ABAQUS software (2023) was employed to develop the macroscopic finite element (FE) model. As shown in Figure 1, the cutting simulation model of CFRP adopts a four-layer stacked structure of unidirectional carbon fiber reinforced polymer (T700S/J-133). The fiber volume fraction is 70%, consistent with the experimental specimens. Given that machining-induced stress accounts for over 90% of the total stress, residual stress caused by curing shrinkage is not explicitly modeled. Instead, the material’s inherent anisotropy is incorporated via directional material properties, as listed in Table 1.
The dimensions of the workpiece are 2 mm in length, 1 mm in height, and 0.75 mm in width, representing a section of the actual experimental specimen (50 mm × 50 mm × 3 mm) and focusing on a refined cutting region of 0.75 mm × 0.75 mm × 2 mm to balance computational cost and accuracy. The workpiece is discretized using 8-node linear hexahedral elements with reduced integration and enhanced hourglass control (C3D8R) to minimize numerical artifacts. The mesh size in the cutting zone is refined to 0.01 mm, while a coarser mesh of 0.1 mm is applied in other regions.
For the milling case with a 90° fiber orientation, three mesh configurations were evaluated. A global approximate size of 0.1 mm was defined, with local seeding applied to generate mesh sizes of approximately 0.05 mm, 0.02 mm, and 0.01 mm in the refined zone. Based on the extracted peak cutting forces, a mesh size of 0.05 mm yielded a peak force of 41.8 N/mm; 0.02 mm yielded 39.8 N/mm; and 0.01 mm yielded 42.6 N/mm. The results indicate that the deviation of the peak cutting force for the finest mesh (0.01 mm) from the experimental peak force (44.1 N/mm) is less than 5%, thus the 0.01 mm mesh was selected to achieve optimal accuracy-efficiency trade-off.
The Hashin 3D failure criterion was employed for element deletion (Equations (4)–(7)), with damage initiation triggered based on the elastic strain thresholds (see Table 1), and damage evolution governed by an energy-based progressive degradation law (Equations (8)–(10)). Delamination between CFRP plies is initiated when the normal or shear traction at the cohesive interface exceeds the interfacial strength limit.
The cutting tool is modeled as a rigid body, with thermal conduction and tool wear effects during machining neglected. The tool geometry is defined by a rake angle of 20°, a clearance angle of 10°, and a cutting edge radius of 0.002 mm. The material properties of the workpiece and the geometric parameters of the tool are summarized in Table 1 and Table 2, respectively. To replicate the clamping condition of the laminate, two types of boundary constraints are applied: lateral constraints on the horizontal sides and full fixation at the bottom surface of the laminate.
In the present model, all degrees of freedom at the bottom and both ends of the workpiece are fully constrained (UX = UY = UZ = URX = URY = URZ = 0), ensuring consistency between the applied boundary conditions and the experimental setup. The cutting tool moves along the x-direction at a speed of 480 mm/s. Parametric studies were conducted on the cutting processes of unidirectional CFRP with four typical fiber orientations: 0°, 45°, 90°, and 135°. The interaction between the cutting tool and the workpiece is modeled using the Coulomb friction law. To improve simulation accuracy, orientation-dependent friction coefficients were applied, with values of 0.3 [36], 0.6, 0.8, and 0.6 [37] corresponding to fiber orientations of 0°, 45°, 90°, and 135°, respectively. Additionally, in this model, the CFRP laminate is treated as a homogenized orthotropic material, and the fiber–matrix interface is assumed to be perfect. While these simplifications significantly reduce computational complexity, they may mask local effects such as stress concentrations around individual fibers and variations in interface adhesion due to manufacturing heterogeneities. As a result, the model may underestimate the initiation of interfacial debonding and matrix yielding under high local stresses. In future work, we will adopt more detailed ply-level modeling, which will help improve the accuracy of the model.
Table 1. Material properties of carbon fiber/epoxy unidirectional laminates [38,39].
Densityρ = 1600 kg/m3
Young’s modulusE11 = 130 Gpa E22 = E33 = 7.7 Gpa
G12 = G13 = 4.8 Gpa G23 = 3.8 GPa
Composite lamina
properties
Poisson’s ratioν12 = ν13 = 0.33 ν23 = 0.35
StrengthXT = 2080 MPa XC = 1250 MPa
YT = 60 MPa YC = 140 MPa
ZT = ZC = 290 Mpa
S12 = S13 = S23 = 110 MPa
Fracture energyG1tc = 133 N∕mm G1cc = 40 N∕mm
G2tc = 0.6 N∕mm G2cc = 2.1 N∕mm
Table 2. Tool geometric parameters and processing conditions.
ParametersValue
Density3.5 × 10−9 (ton/mm3)
Young’s modulus960 GPa
Poisson’s ratio0.2
Rake angle (α)25°
Relief angle (β)10°
Tool edge radius0.2 µm
Depth of cut0.1 mm
Cutting speed480 mm/s
Spindle speed2000 rpm
Feed per tooth0.04 mm/tooth

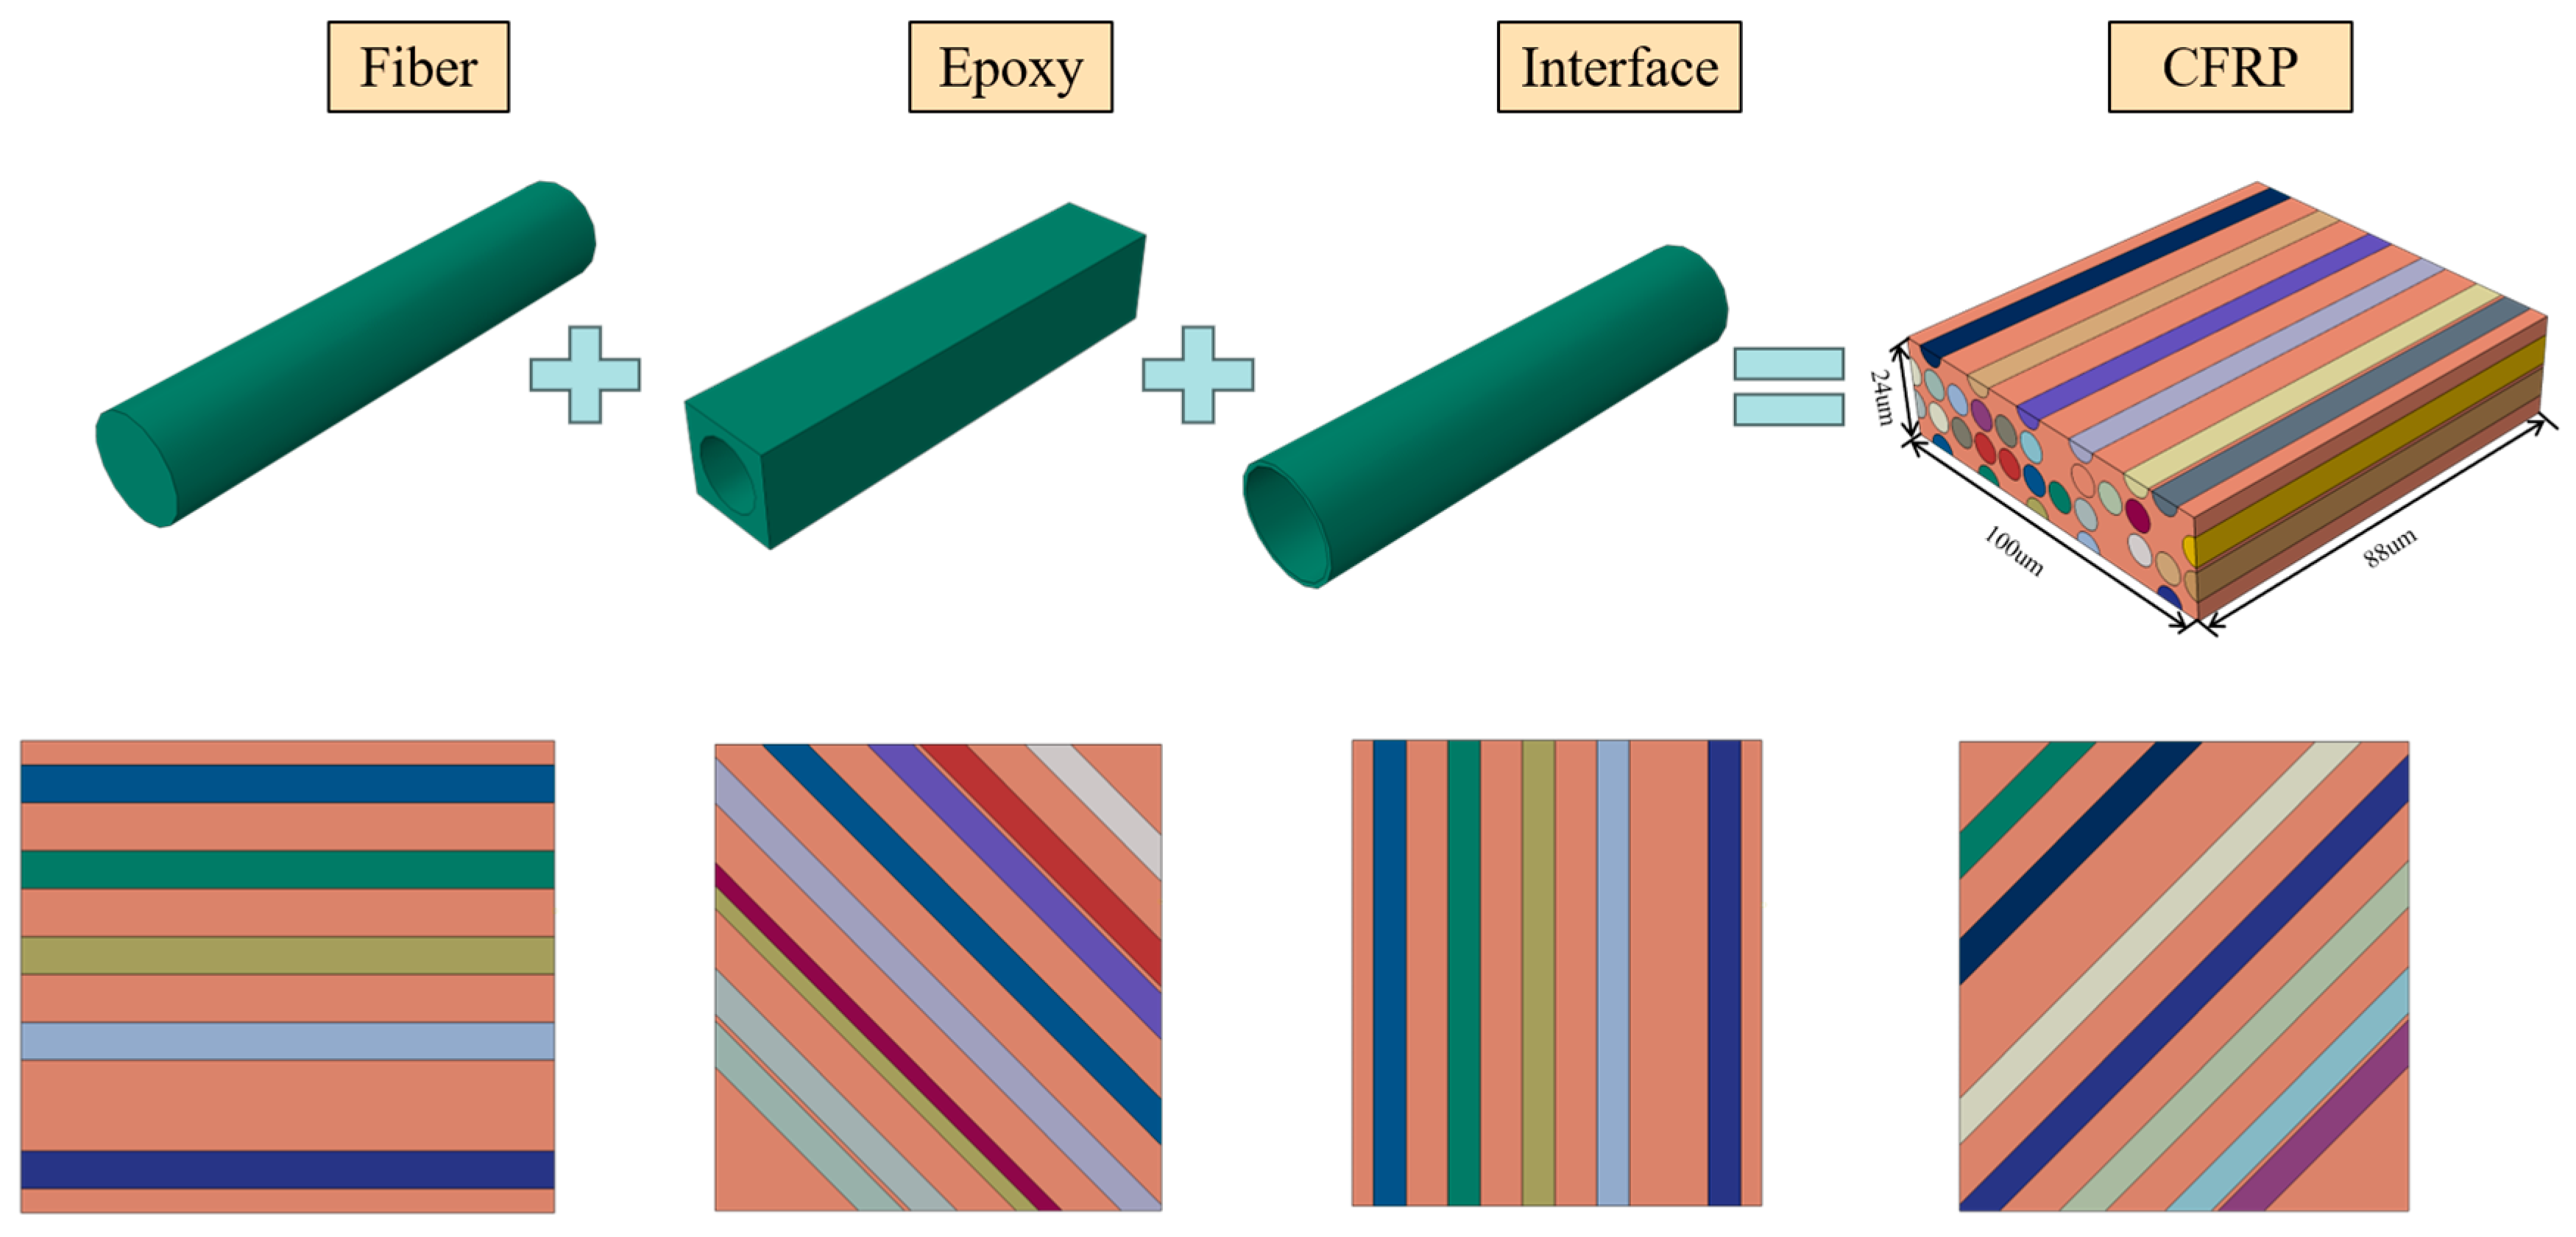
2.2. Microscopic Theoretical Model

2.2.1. Fiber and Matrix Failure Criteria

The fiber is an orthotropic elastic material [28] and is considered a brittle material. Under external loading, the fiber stiffness rapidly decays, resulting in brittle fracture. Therefore, the effect of fiber stiffness degradation is neglected, and its constitutive relation is expressed as follows:
σ t = E t ε t
In the equation, σt, εt, and Et represent the fiber stress, strain, and elastic modulus, respectively.
The brittle failure behavior of the fiber under external loading is assessed using the maximum principal stress failure criterion. This means that when the maximum principal stress applied to the fiber under external loading reaches the fiber’s tensile or compressive strength limit, the failure factor Δf = 1. The brittle fracture occurs, leading to failure, as shown in the following equation:
Δ f = max ( x , y , z ) = σ j / i t ( σ j > 0 ) σ j / i c ( σ j < 0 )
where x, y, and z correspond to the principal directions of the fiber material, and j takes the values corresponding to the X direction along the fiber axis and the Y (Z) direction perpendicular to the fiber axis. σj represents the stress in different directions, Xt/Yt is the fiber’s tensile strength, and Xc/Yc is the fiber’s compressive strength. Since the fiber is orthotropic, the failure strength thresholds in the Z and Y directions are equal.
The resin matrix is defined as an isotropic elastoplastic material using the shear failure criterion [40]. The shear failure criterion assumes that the equivalent plastic strain at the onset of damage is a function of the shear stress ratio and strain rate.
ε ¯ s p l ( θ s ε ¯ p l )
where θ s = ( q + k s p ) / τ max is the shear stress ratio, τ max is the maximum shear force, and Ks is the material parameter. q represents the Mises stress, and p represents the compressive stress. ε ¯ s p l represents the equivalent plastic strain. ε ¯ p l represents the equivalent plastic strain rate.
q = 3 / 2 ( s i j s i   j ) = 1 / 2 [ ( σ 11 σ 22 ) + ( σ 22 σ 33 ) + ( σ 33 σ 11 ) + 6 σ 12 2 + 6 σ 23 2 + 6 σ 31 2 ]
ε ¯ s p l = 0 t ε ¯ p l d t
In the equation, Sij represents the deviatoric stress tensor, and σij represents the Cauchy stress tensor.
When Equation (16) is satisfied, the element is deleted due to failure. Where ωs is the state variable which increases with monotonic plastic deformation.
ω s = ( d ε ¯ p l ) / ε ¯ s p l ( θ s , ε ¯ p l ) = 1

2.2.2. Zero-Thickness Cohesive Element Failure Model

The interface phase is applied to the transition zone connecting the fiber and resin matrix, which is critical in stimulating the induced damage in the interface region. Cohesive elements are commonly used to simulate mechanical behaviors such as interphase debonding and failure.
This study uses the bilinear traction-separation law [41], with the failure modes shown in Figure 2.
It is constitutive equation is expressed as follows:
σ n σ s σ t = K n n 0 0 0 K s s 0 0 0 K t t ε n ε s ε t
where n denotes the expected direction, s and t represent shear directions. σi represents the stress in each direction, εi is the strain in each direction, and Kii is the elastic modulus in each direction (i = n, s, t). Under external loading, stresses in cohesive elements progressively increase. When stress components in the three directions satisfy the quadratic nominal stress criterion in Equation (18), interfacial debonding and failure damage occur between fiber and matrix.
t n / t n f 2 + t s / t s f 2 + t t / t t f 2 = 1
where tn, ts, and tt represent the instantaneous components of normal stress and the two shear forces at the interface, t n f represents the interface tensile strength, t s f and t t f represents the shear strength. When interfacial damage initiates, an energy-based damage evolution criterion is adopted, with the power-law criterion serving as the ultimate failure criterion as shown in Equation (19):
G n / G n C β + G s / G s C β + G t / G t C β = 1
where Gn, Gs, and Gt represent the fracture energies in the normal direction and the two shear directions, G n C , G s C , G t C represent the fracture energies in the normal and two shear directions, β is the mixed-mode fracture correction factor, which is taken as 1.6 [42] as a constant. When the condition of Equation (19) is satisfied, the cohesive element is considered to fail. The interface material parameters are shown in Table 3.

2.2.3. Microscopic Finite Element Model

As shown in Figure 3, the fiber, epoxy resin matrix, and interface are modeled in this study for the microscopic CFRP cutting finite element model. The material model has the total dimensions of 100 μm length, 24 μm width, 88 μm height. The fiber diameter is 7 μm, with a total fiber volume fraction of approximately 70%. The cutting depth is 30 μm, and a global mesh size of 0.8 μm is adopted. In the micro-model, the resin is defined as isotropic elastic–plastic material, and fibers as a transversely isotropic brittle material, with the tool directly contacting a single fiber. Fiber surfaces are assumed to be defect-free to accurately characterize fiber deformation and failure under cutting loads. Both fiber and matrix meshes use swept meshing with C3D8R elements and hourglass control to prevent hourglassing. Zero-thickness cohesive elements (COH3D8) were used to model interphases. Similarly to the macroscopic model, the cutting tool is treated as a rigid body in the microscale model, with its displacement controlled by a reference point (RP). The cutting speeds are consistent with the experimental settings. The material parameters used in the microscale model are listed in Table 4.

3. Experimental Setup

To ensure the predictive accuracy of the finite element model, validation through comparison with experimental results is essential, enabling the extension of the numerical model to studies involving various machining parameters and composite structures. The CFRP laminates used in the experiment were supplied by Wuxi Jiabo Composite Materials Co., Ltd., located in Jiangsu, China and the material properties of T700s/J-133 are listed in Table 5. Unidirectional specimens with four typical fiber orientations (0°, 45°, 90°, 135°) were prepared via waterjet cutting, with dimensions of 50 × 50 × 3 mm and an approximate fiber volume fraction of 70%. Milling was performed using a four-flute AlCrN-coated carbide end mill with a diameter of 6 mm. The experimental setup is illustrated in Figure 4.
Milling experiments were conducted on a DNM415 CNC machining center, with the spindle rotating clockwise at 2000 rpm and a constant feed rate of 480 mm/s along the x-axis. The radial depth of cut was 0.1 mm, and the axial thickness of the CFRP laminate was 3 mm. Each experiment was repeated three times, and the average values were reported. During machining, the CFRP workpieces were mounted on a dynamometer using custom fixtures, and the dynamometer was secured to the machine table via a mounting base. The tool had a rake angle of 25° and a relief angle of 10°. Cutting forces (Fx, Fy, Fz) were measured using a three-component piezoelectric dynamometer (Kistler 9129AA) connected to a charge amplifier (Kistler 5080A). Real-time force data were acquired using the Kistler Dynoware software (version 3.6.2, Kistler Instrumente AG, Winterthur, Switzerland) at a sampling frequency of 10 kHz. Post-machining surface morphology was examined using a JEOL JSM-7610F Plus scanning electron microscope (SEM), and a comparative analysis was conducted under the four fiber orientation conditions. Surface roughness measurements were conducted using a laser confocal microscope (OLS4100), with a maximum scanning area of 0.64 × 0.64 mm. Two representative measurement regions were selected on the surface of each specimen, and the arithmetic mean of the measured values was reported as the surface roughness of the sample. The final results (peak cutting forces, chip morphology analysis, surface damage characterization) were all compared with the model to verify the reliability of the model.

4. Results and Discussion

4.1. Experimental Data and Statistical Analysis

4.1.1. Cutting Force Statistics

To ensure the reliability of the data, each milling experiment was repeated three times (n = 3) under identical conditions, including a cutting speed of 480 mm/s, a cutting depth of 0.1 mm, and fiber orientation angles of 0°, 45°, 90°, and 135°. Statistical analysis was carried out using analysis of variance (ANOVA), with a significance level set at α = 0.05. The cutting force in the Fy direction was excluded from further analysis due to its minimal variation and lack of significant differences throughout the machining process. As presented in Table 6 and Table 7, the standard deviations across groups were relatively low (ranging from 0.49 to 1.49), indicating good experimental repeatability. Fiber orientation had a highly significant effect on the cutting force (F(3,8) = 227.2, p < 0.0001, η2 = 0.98), with the 90° orientation exhibiting a significantly higher cutting force (44.1 ± 1.49 N/mm) compared to the other groups.

4.1.2. Assessment of Workpiece Integrity
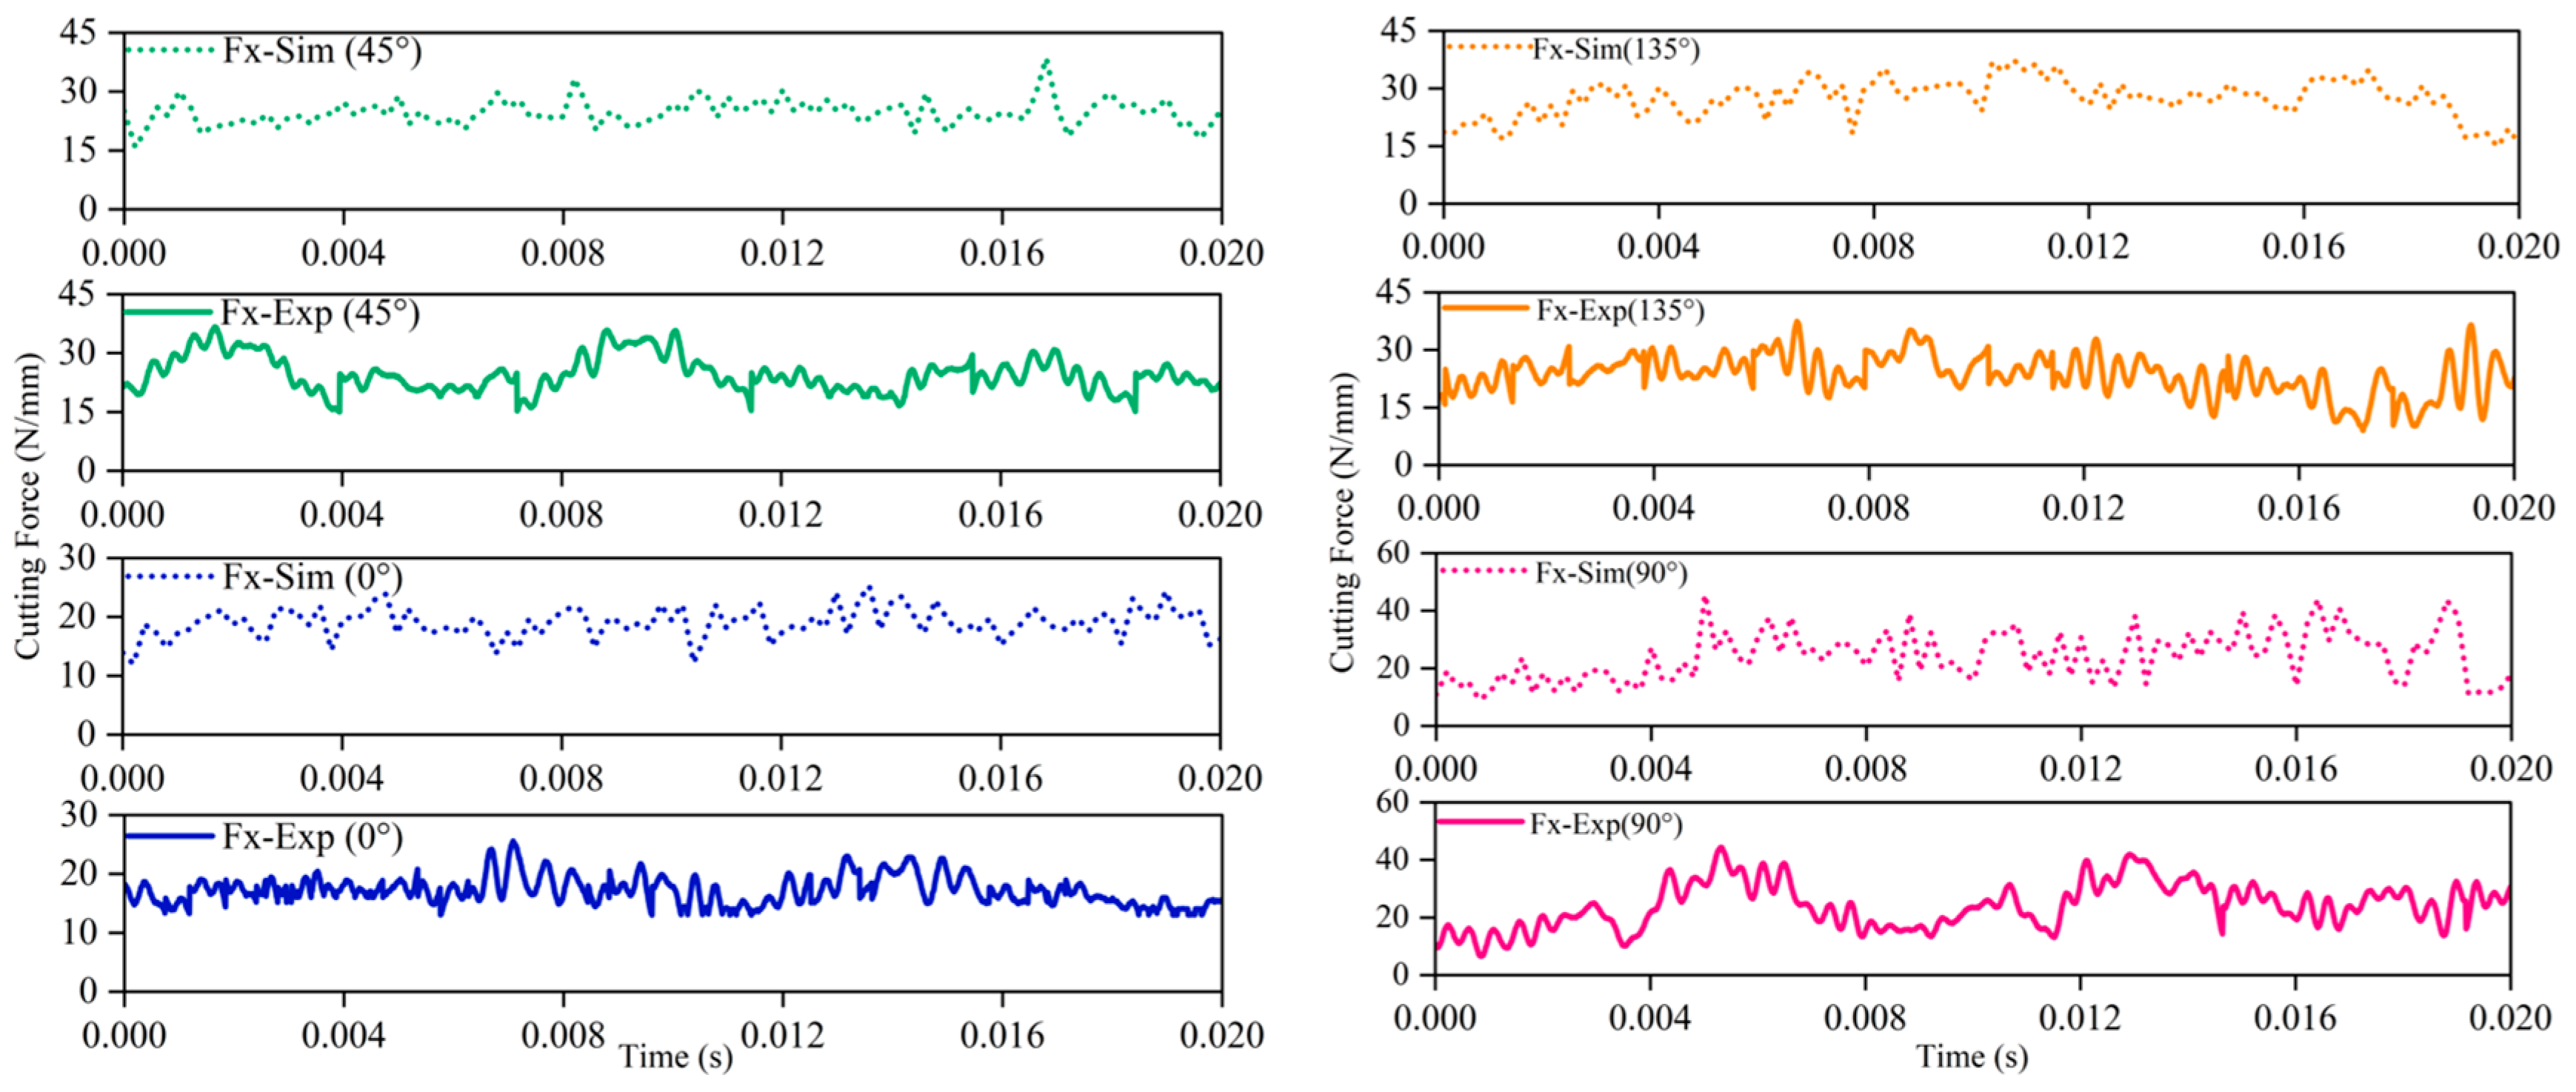
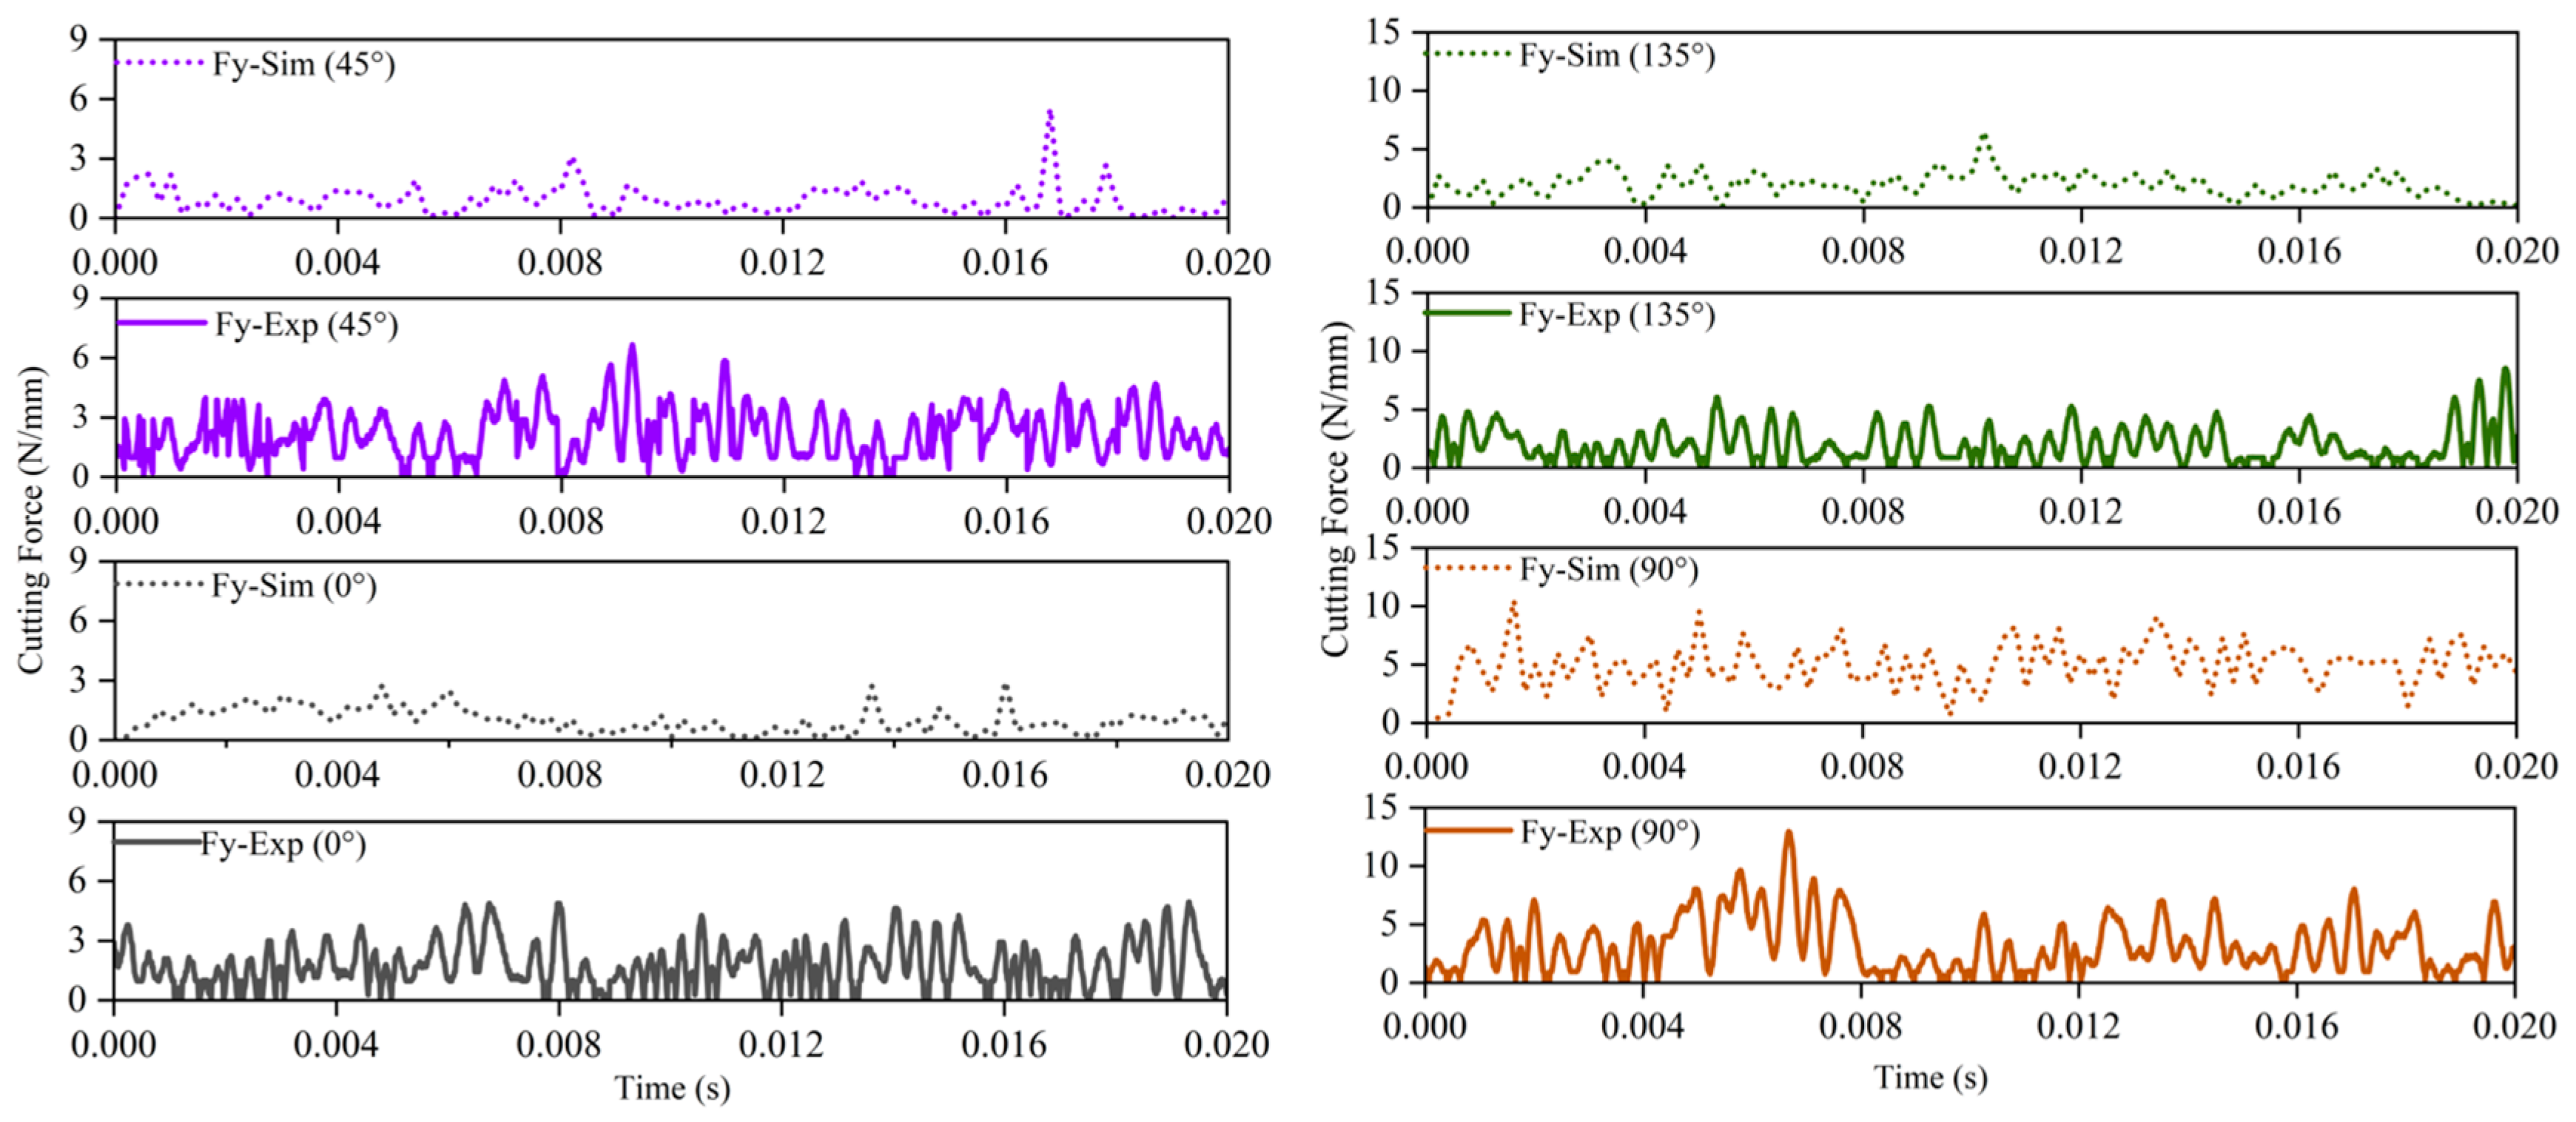
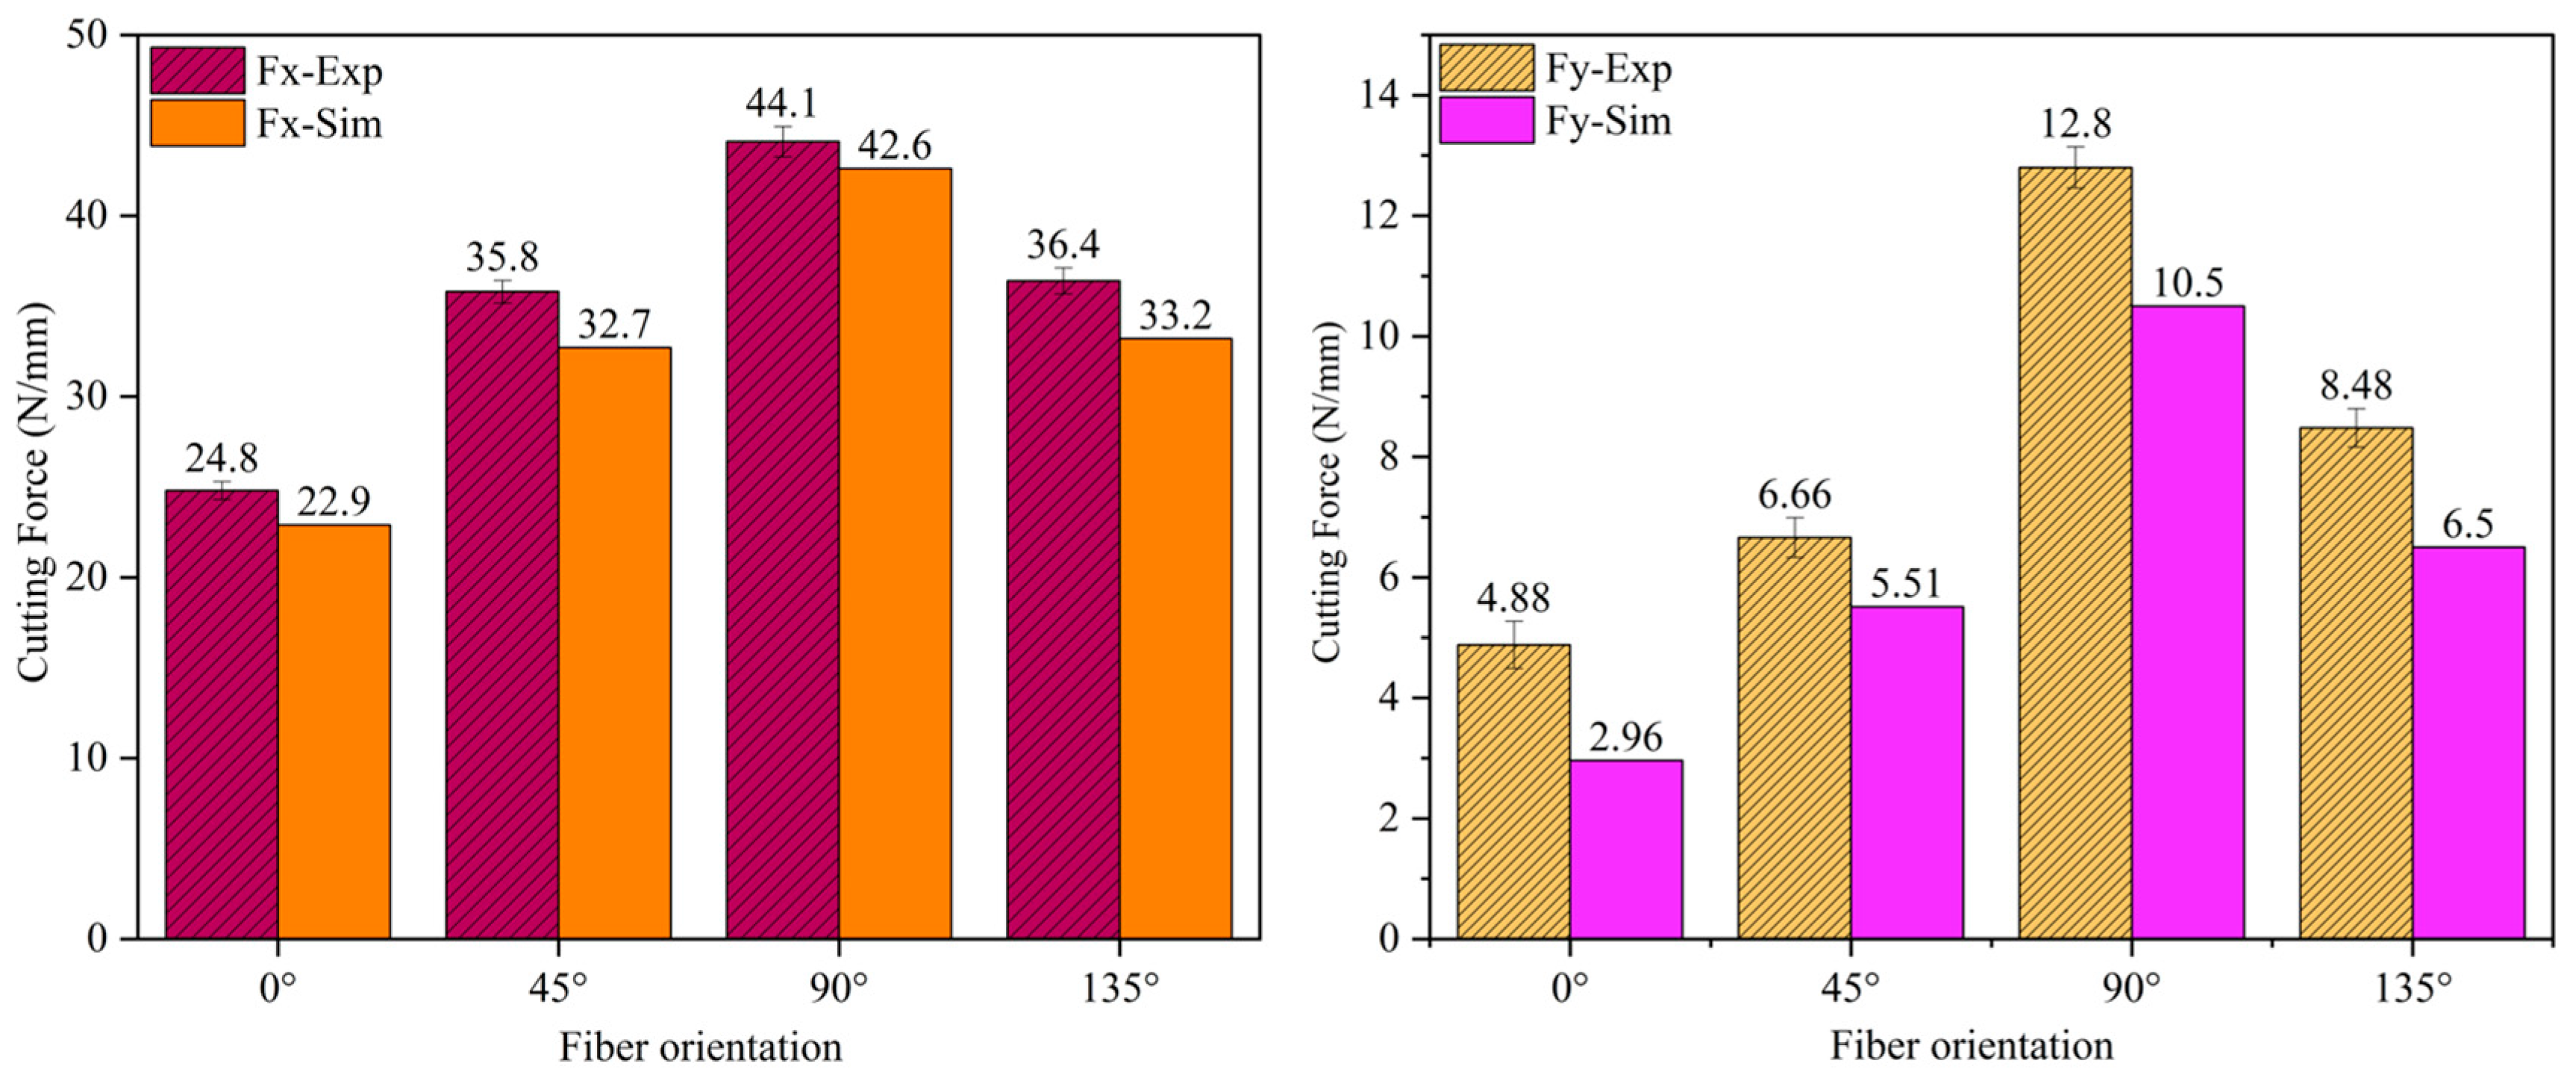
Surface integrity was evaluated based on surface roughness (Ra) measurements. To ensure the reliability of the experimental results, each test under different fiber orientation conditions (0°, 45°, 90°, and 135°) was repeated three times. Surface roughness was measured using a laser confocal microscope (JEOL JSM-7610F Plus) in both transverse and longitudinal directions for each specimen, and the results were reported as mean values.
As shown in Figure 5, Ra was significantly affected by fiber orientation. The highest roughness values were observed at a fiber orientation angle of 135°, indicating the most severe surface damage. In the transverse direction, Ra followed the following order: 135° > 90° > 45° > 0°, with values of 3.568 µm, 2.19 µm, 1.755 µm, and 1.23 µm, respectively. In the longitudinal direction, the same trend was observed: 135° > 90° > 45° > 0°, with corresponding values of 3.716 µm, 2.274 µm, 1.832 µm, and 1.154 µm.
A comparison between transverse and longitudinal Ra values revealed that the largest deviation occurred at 0° orientation (6.59%), while the deviations at other angles were all below 5%. These deviations fall within acceptable engineering limits, indicating good surface integrity of the machined workpieces.

4.2. Cutting Forces

Figure 6, Figure 7 and Figure 8 analyzes the cutting forces obtained through simulation and experimentation at the macroscopic scale during the milling process of CFRPs with different fiber orientations. Due to computational efficiency, the geometry of CFRPs in the finite element model differs from that in the experiment, so the cutting forces cannot be directly compared. In this study, the cutting forces are normalized to per unit width and thickness. Figure 6 presents a comparison of the simulated and experimental cutting forces in the Fx direction for different fiber orientations. The results show that the cutting force in the Fx direction exhibits both periodic and non-periodic fluctuations over time. At 0°, the simulated cutting force fluctuates in a relatively regular manner, while the experimental data shows more frequent and larger fluctuations, reflecting the sudden brittle fractures of fibers under shear stress, which cause complex dynamic changes in the cutting force over time. At 45°, both simulated and experimental cutting forces exhibit fluctuations, with the experimental values being generally higher. Significant fluctuations occur in the time range of 0.004 to 0.016 s, reflecting the dynamic interaction of forces during the cutting process at this angle. At 90°, the simulated cutting force is relatively stable, while the experimental cutting force shows large fluctuations and peaks in the time ranges of 0.008 to 0.012 s and 0.016 to 0.020 s. This indicates that, as the processing time progresses, fractured material debris accumulates at the tool tip, causing oscillations in the cutting force and poor processing stability. At 135°, the simulated cutting force shows fluctuations but remains relatively stable, while the experimental cutting force fluctuates frequently, primarily due to fiber bending failure, which generates force impacts on the tool and creates high-frequency oscillations.
Figure 7 presents a comparison of the simulated and experimental cutting forces in the Fy direction under different fiber orientations. Over the machining period of 0 to 0.020 s, the Fy direction cutting forces for different cutting angles (0°, 45°, 90°, 135°) fluctuate continuously over time, reflecting the sustained dynamic interaction between the tool and workpiece. However, the values of the Fy direction cutting forces are generally smaller, and their impact on the core dynamic characteristics of the machining process is negligible. Therefore, an analysis of these Fy cutting force fluctuations over time is not conducted.
Figure 8 compares the simulated and experimental peak cutting forces (Fx direction) under different fiber orientations. The results show that the maximum deviation occurs at a 135° fiber orientation, with a discrepancy of 8.79% (simulated: 33.2 N/mm, experimental: 36.4 N/mm), while the minimum error is observed at a 90° fiber orientation, with a deviation of 3.4% (simulated: 42.6 N/mm, experimental: 44.1 N/mm), indicating high predictive accuracy of the model for the principal cutting forces. The cutting force exhibits a characteristic trend, initially increasing and then decreasing with an increasing fiber orientation angle [44], following the order: 0° < 45° < 135° < 90°, with corresponding experimental values of 24.8 N/mm < 35.8 N/mm < 36.4 N/mm < 44.1 N/mm, and simulated values of 22.9 N/mm < 33.2 N/mm < 32.7 N/mm < 42.6 N/mm. This behavior originates from distinct material removal mechanisms: at 0°, the cutting force is parallel to the fiber direction, leading to interfacial debonding as the dominant failure mode, with minimal cutting forces due to the matrix’s significantly lower strength compared to the fibers. At 45°, shear-induced fracture predominates, with the cutting force acting at an acute angle to the fibers, requiring overcoming the fiber shear strength. At 90°, perpendicular orientation necessitates overcoming both interfacial debonding and fiber bending fracture strength, resulting in the maximum cutting force [8]. At 135°, the obtuse angle leads to fiber bending fracture as the primary removal mechanism, producing cutting forces between those at 45° and 90°. Additionally, it is important to note that the simulated results are generally lower than the experimental results. This discrepancy arises because, in the simulation, once a unit reaches its failure strength, it is automatically deleted and no longer subjected to any force from any direction.

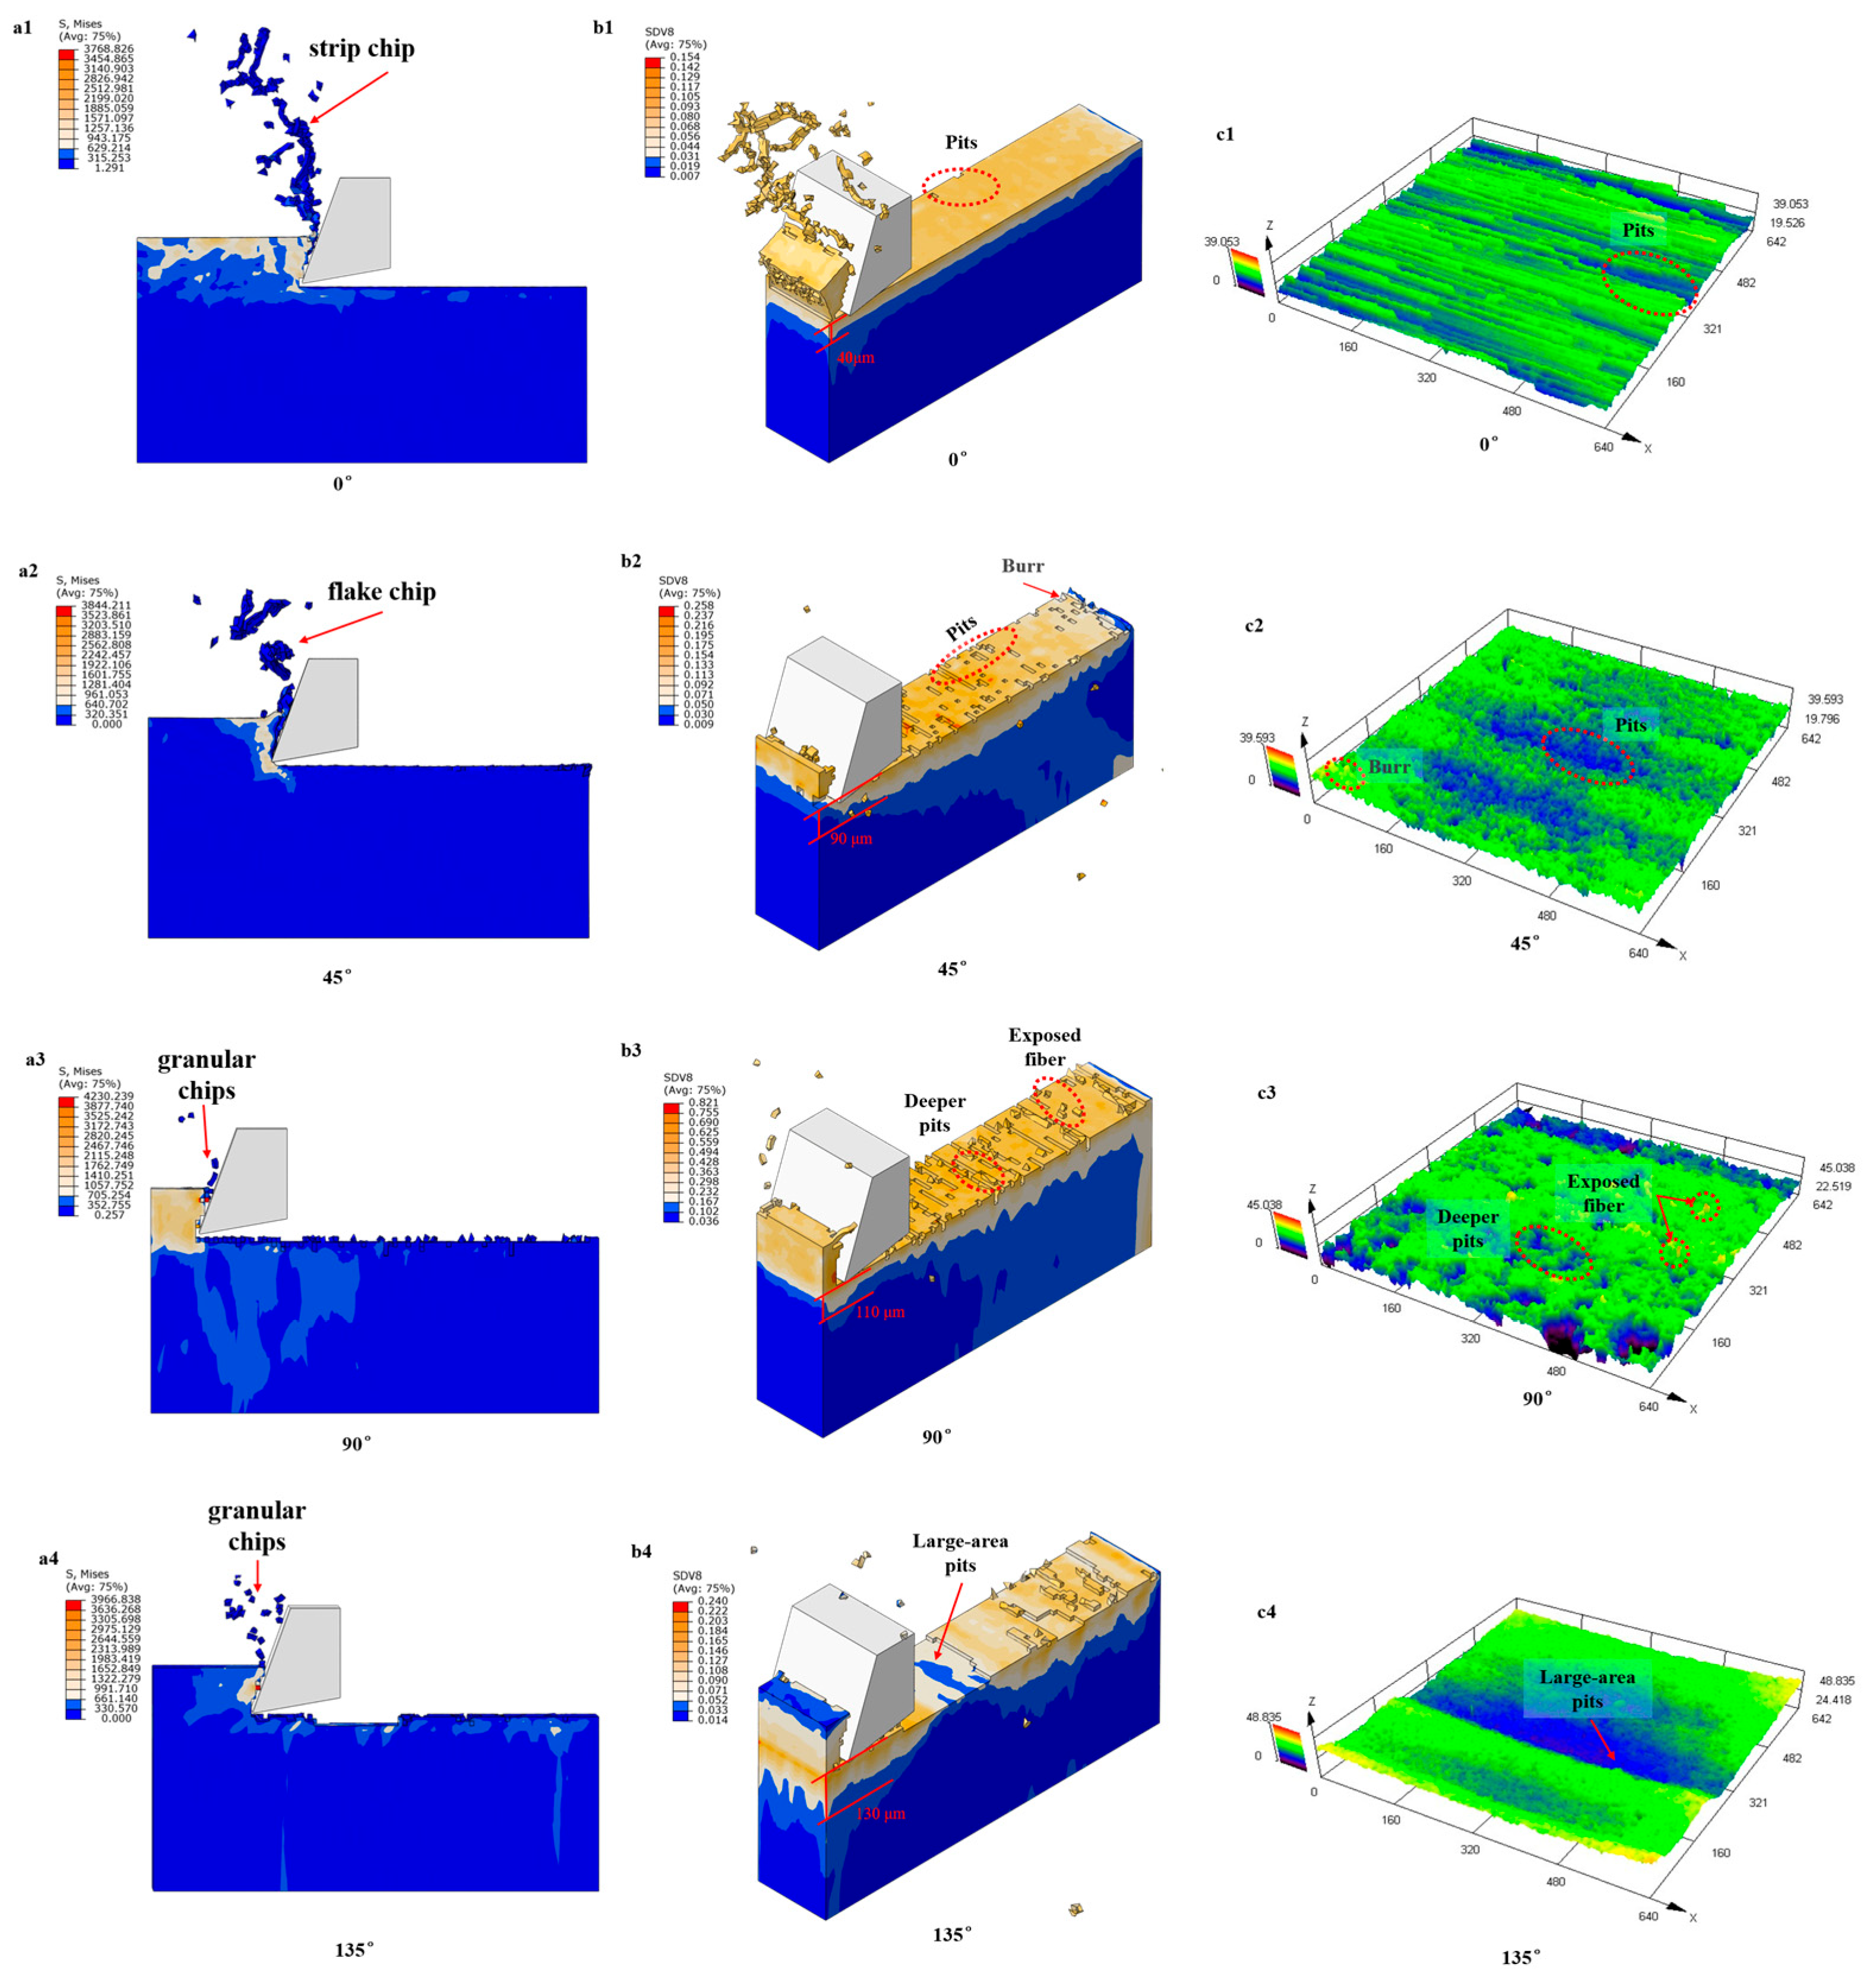
4.3. Macroscopic Chip Formation Process and Macroscopic Surface Morphology of CFRP

Figure 9 compares the simulated and experimental results of chip morphology and surface damage under four typical fiber orientations.
At 0° orientation, the cutting direction aligns parallel to the fiber axis, inducing plastic deformation and fiber bending, which results in long, continuous chips (Figure 9(a1)). The machined surface appears relatively smooth, exhibiting only slight columnar pits (Figure 9(c1)). Subsurface damage remains shallow (≈40 μm) (Figure 9(b1)), with stress concentration predominantly along the fiber direction.
At 45° orientation, the tool compresses the fibers at a 45° angle, producing blocky chips (Figure 9(a2)). Due to fiber fracture, surface damage becomes more severe. The interaction between brittle fibers and ductile resin leads to pit formation and subsurface damage extending to approximately 90 μm (Figure 9(b2,c2)).
At 90° orientation, the fibers are perpendicular to the cutting path, causing shear-dominated failure and the formation of granular chips (Figure 9(a3)). The surface exhibits significant damage, including numerous burrs and pull-out holes, with subsurface cracks propagating to around 110 μm (Figure 9(b3,c3)).
At 135° orientation, the fibers oppose the tool direction, resulting in pronounced bending fractures, irregular chip morphology, and extensive surface pitting. Subsurface cracks reach their maximum depth (≈130 μm), which agrees well with the simulation results (Figure 9(a4,c4)).

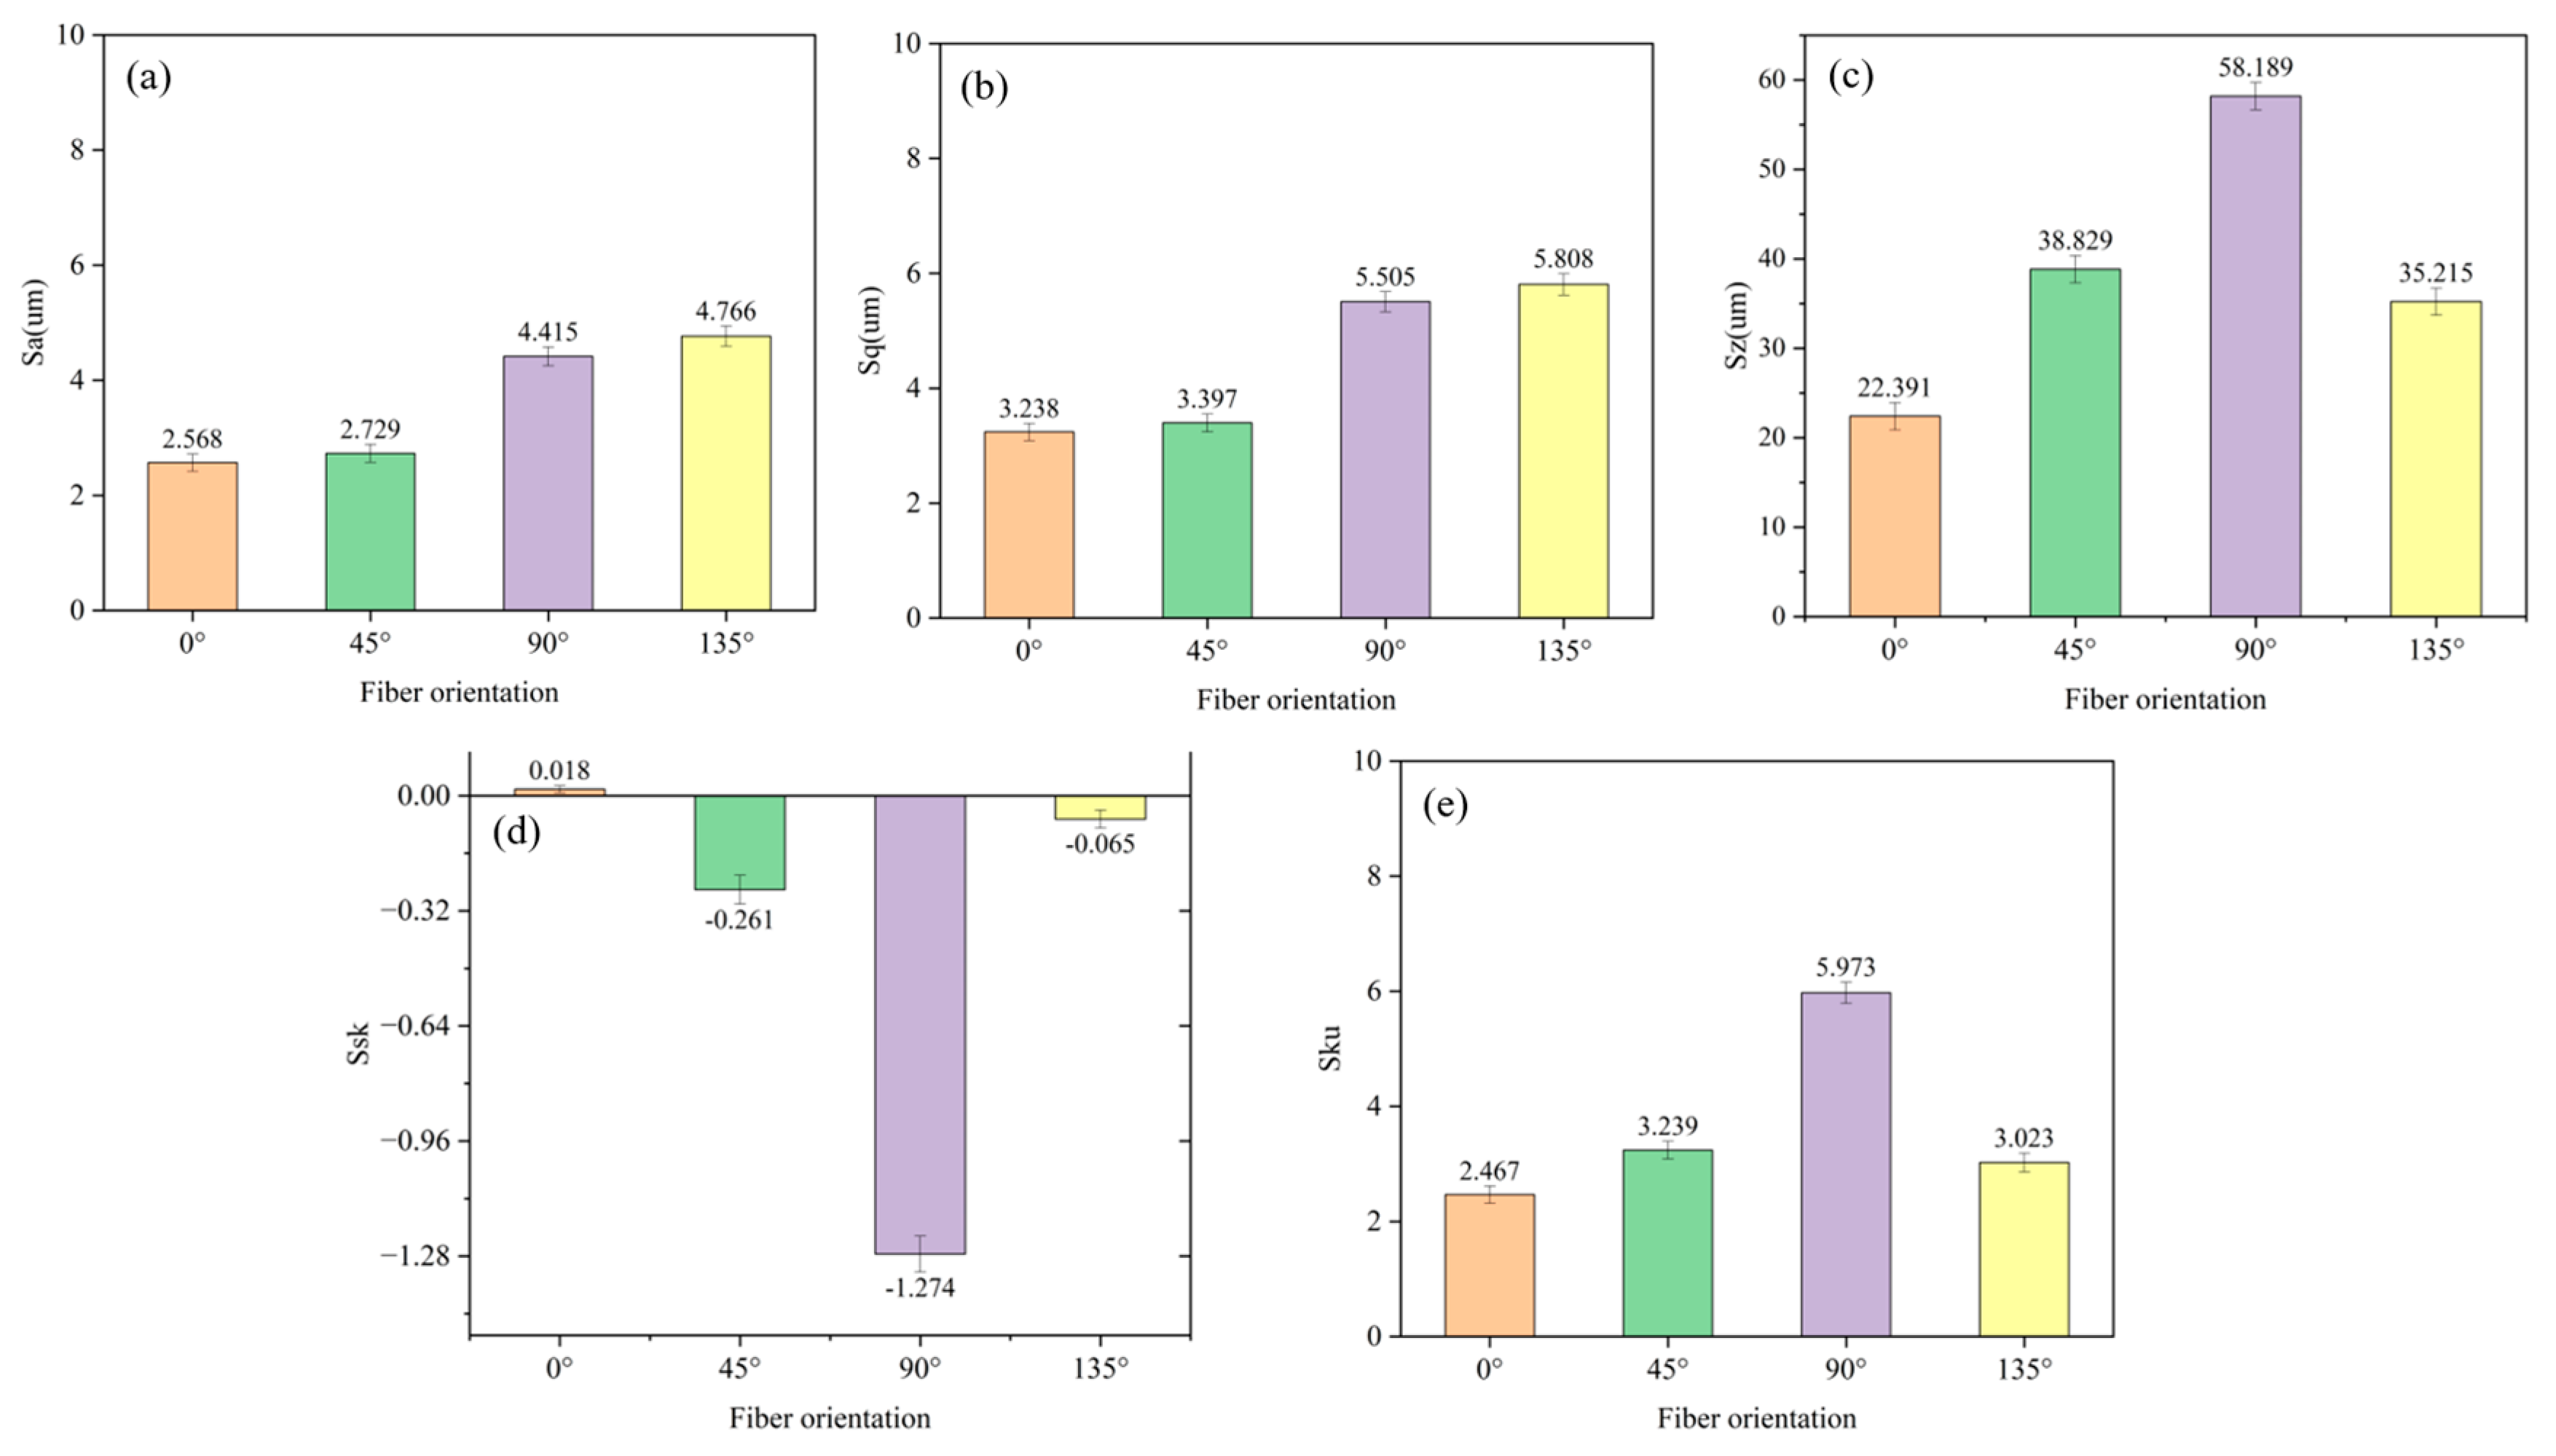
4.4. Analysis of Three-Dimensional Roughness Parameters of CFRP Machined Surfaces

A comprehensive multi-parameter characterization system was implemented to evaluate the 3D surface topography, incorporating five key roughness parameters: Sa (arithmetic mean height), representing the average deviation from the reference plane; Sq (root mean square height), which is more sensitive to extreme values; Sz (ten-point height), calculated from the average difference between five highest peaks and five lowest valleys to minimize outlier effects; Ssk (skewness), quantifying height distribution symmetry (Ssk > 0 indicates predominant peaks while Ssk < 0 reflects valley dominance); and Sku (kurtosis), describing height distribution steepness (baseline 3 for normal distribution, >3 for sharp peaks, and <3 for flattened distributions).
As shown in Figure 10a, the maximum Sa value (4.766 µm) occurred at 135° fiber orientation, being 1.8 times higher than the minimum value (2.568 µm) at 0° orientation, demonstrating significant fiber orientation effects on surface roughness. Figure 10b reveals that Sq exhibited strong positive correlation with Sa across all orientations, consistently showing 10–15% higher values while maintaining identical trends, with maximum roughness at 135° attributed to abundant dimples [20].
Contrastingly, Sz displayed distinct behavior (Figure 10c), peaking at 90° but reaching minimum at 135°. This divergence occurs because Sz focuses on peak-to-valley distance, whereas Sa/Sq characterize overall undulations. The 90° orientation generated greater extreme height differences but fewer micro-fluctuations, while 135° produced more microscopic variations with reduced peak-valley gaps [28].
Surface asymmetry analysis (Figure 10d) showed positive skewness (Ssk > 0) only at 0°, indicating balanced topography, while negative values at other orientations (minimum Ssk = −1.274 at 90°) confirmed valley-dominated surfaces with maximum porosity. Kurtosis results (Figure 10e) revealed flattened distributions (Sku < 3) at 0° versus leptokurtic surfaces [45] (Sku > 3) at other orientations, ordered as 90°(5.973) > 45°(3.239) > 135°(3.023) > 0°(2.476). The 90° orientation’s exceptionally sharp peaks originated from fiber fracture-induced irregularities, whereas 135° approached Gaussian distribution (Sku ≈ 3) [19] due to randomly distributed fracture pits.

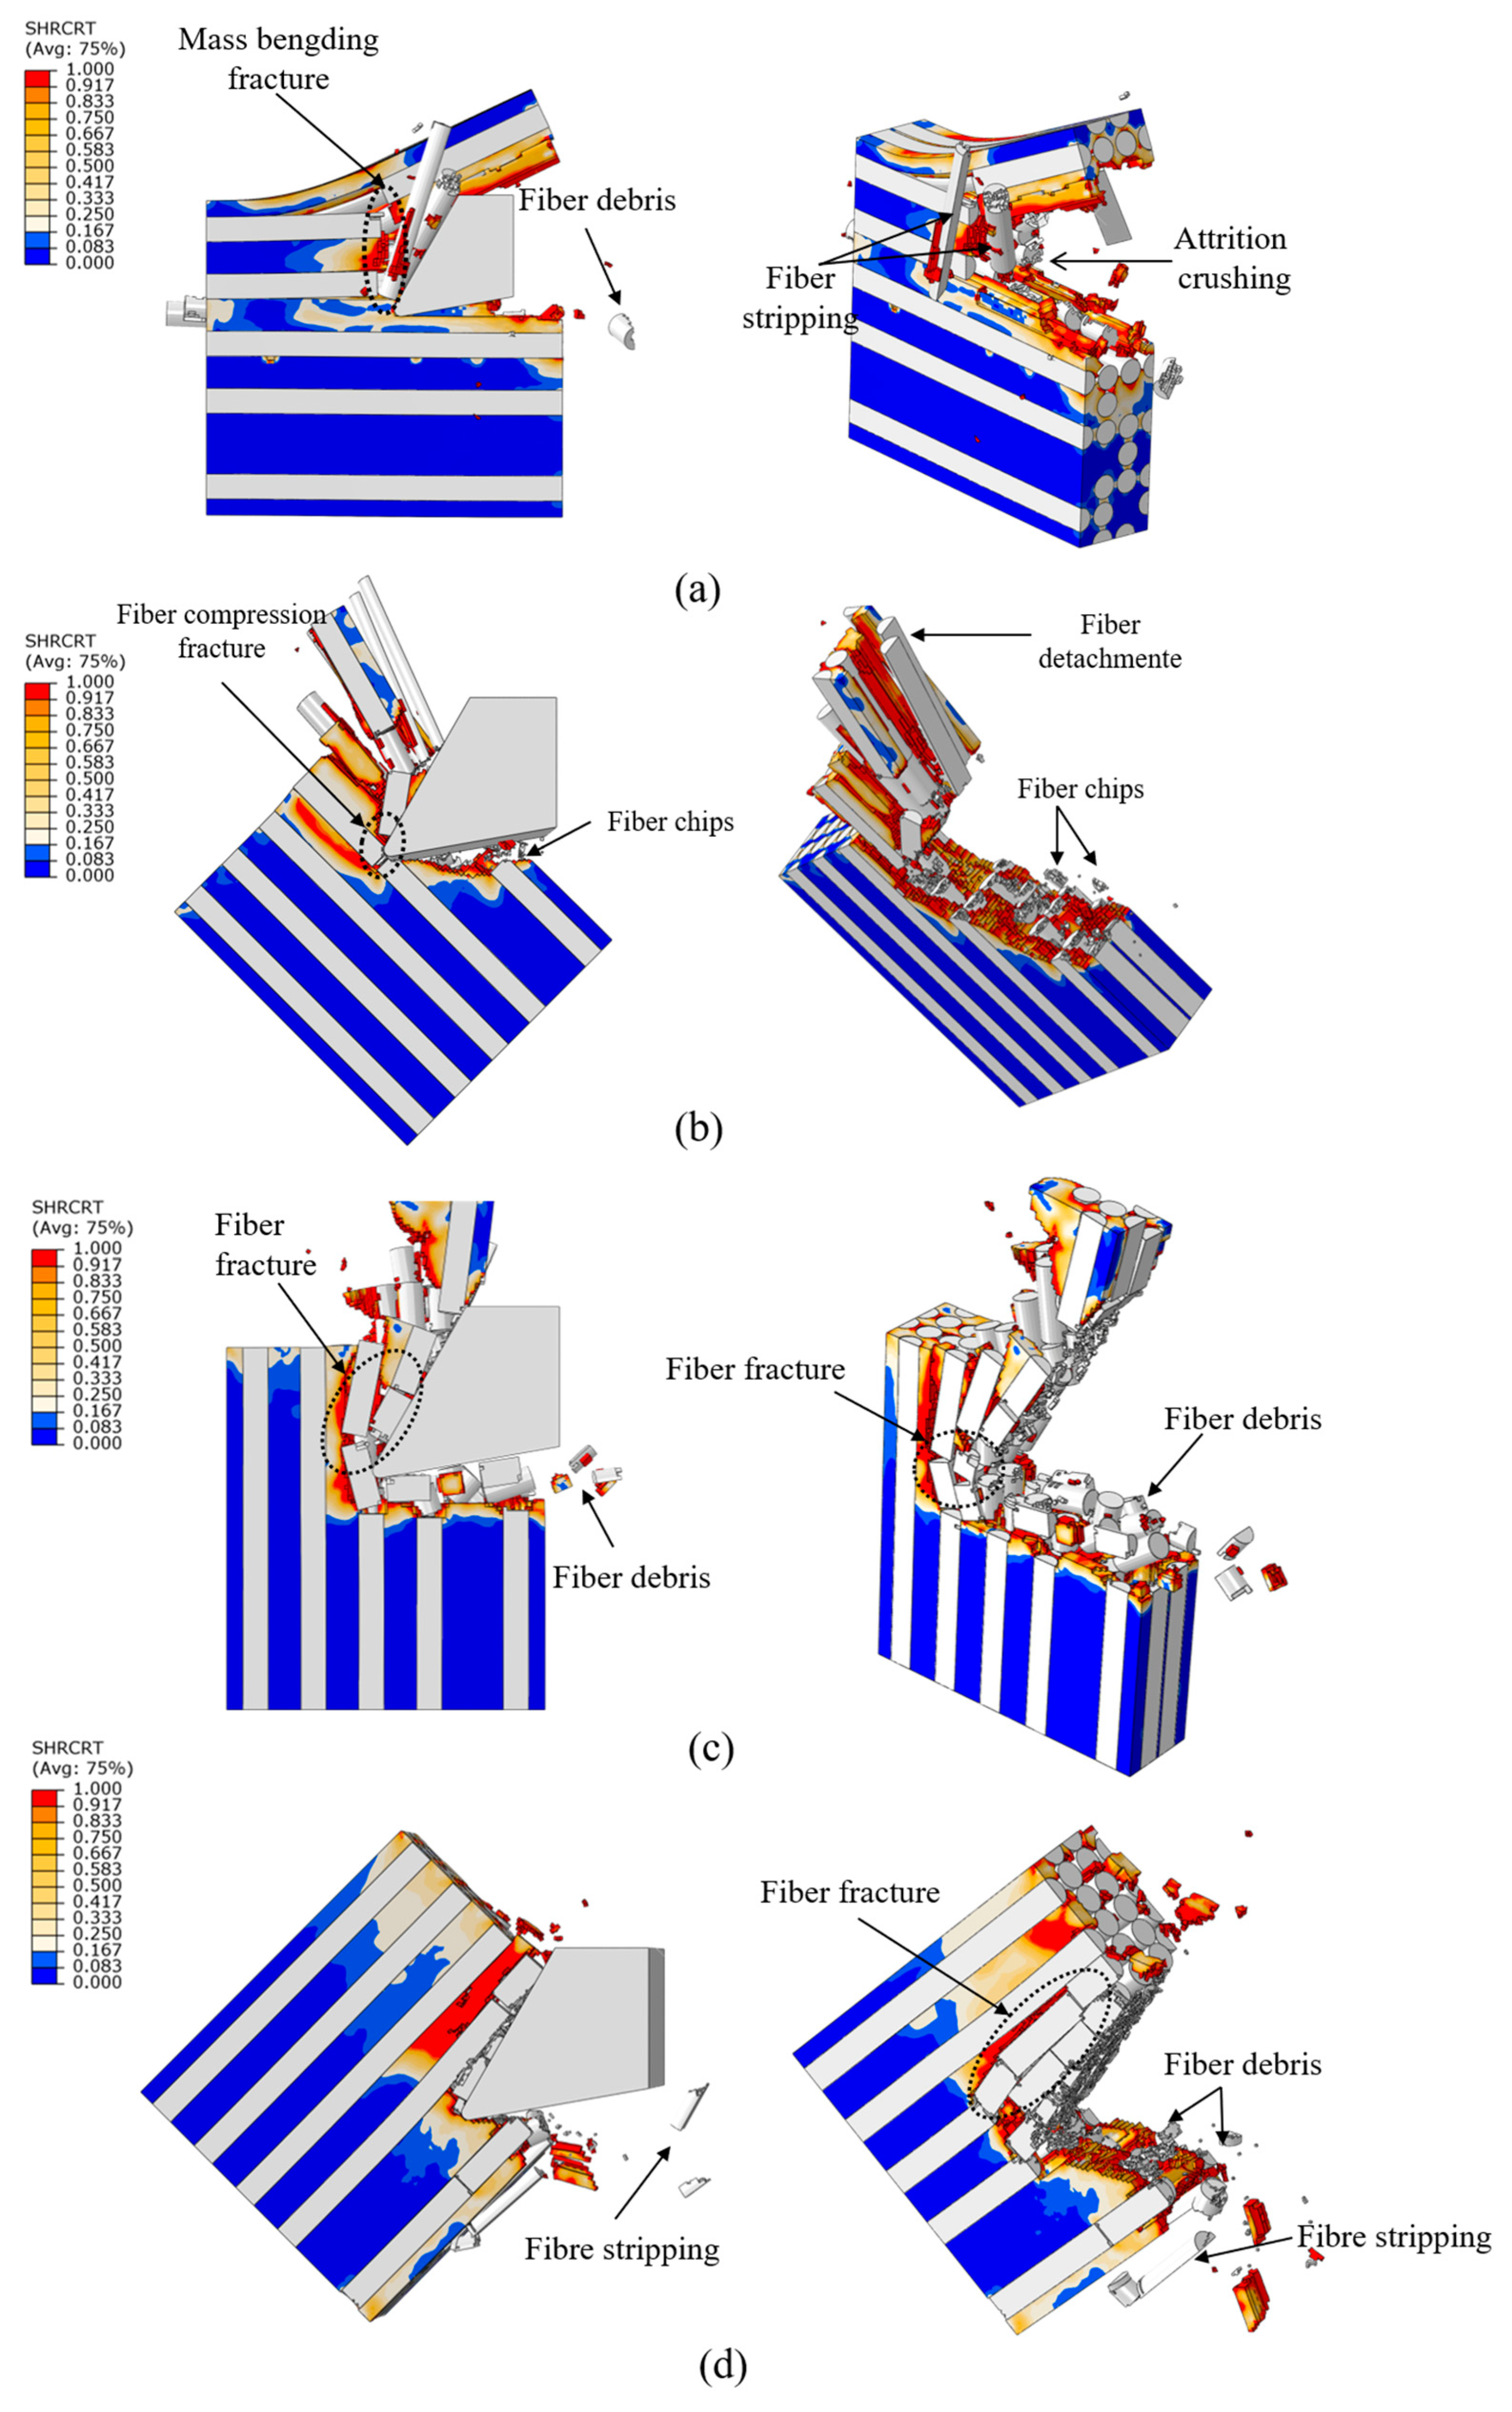
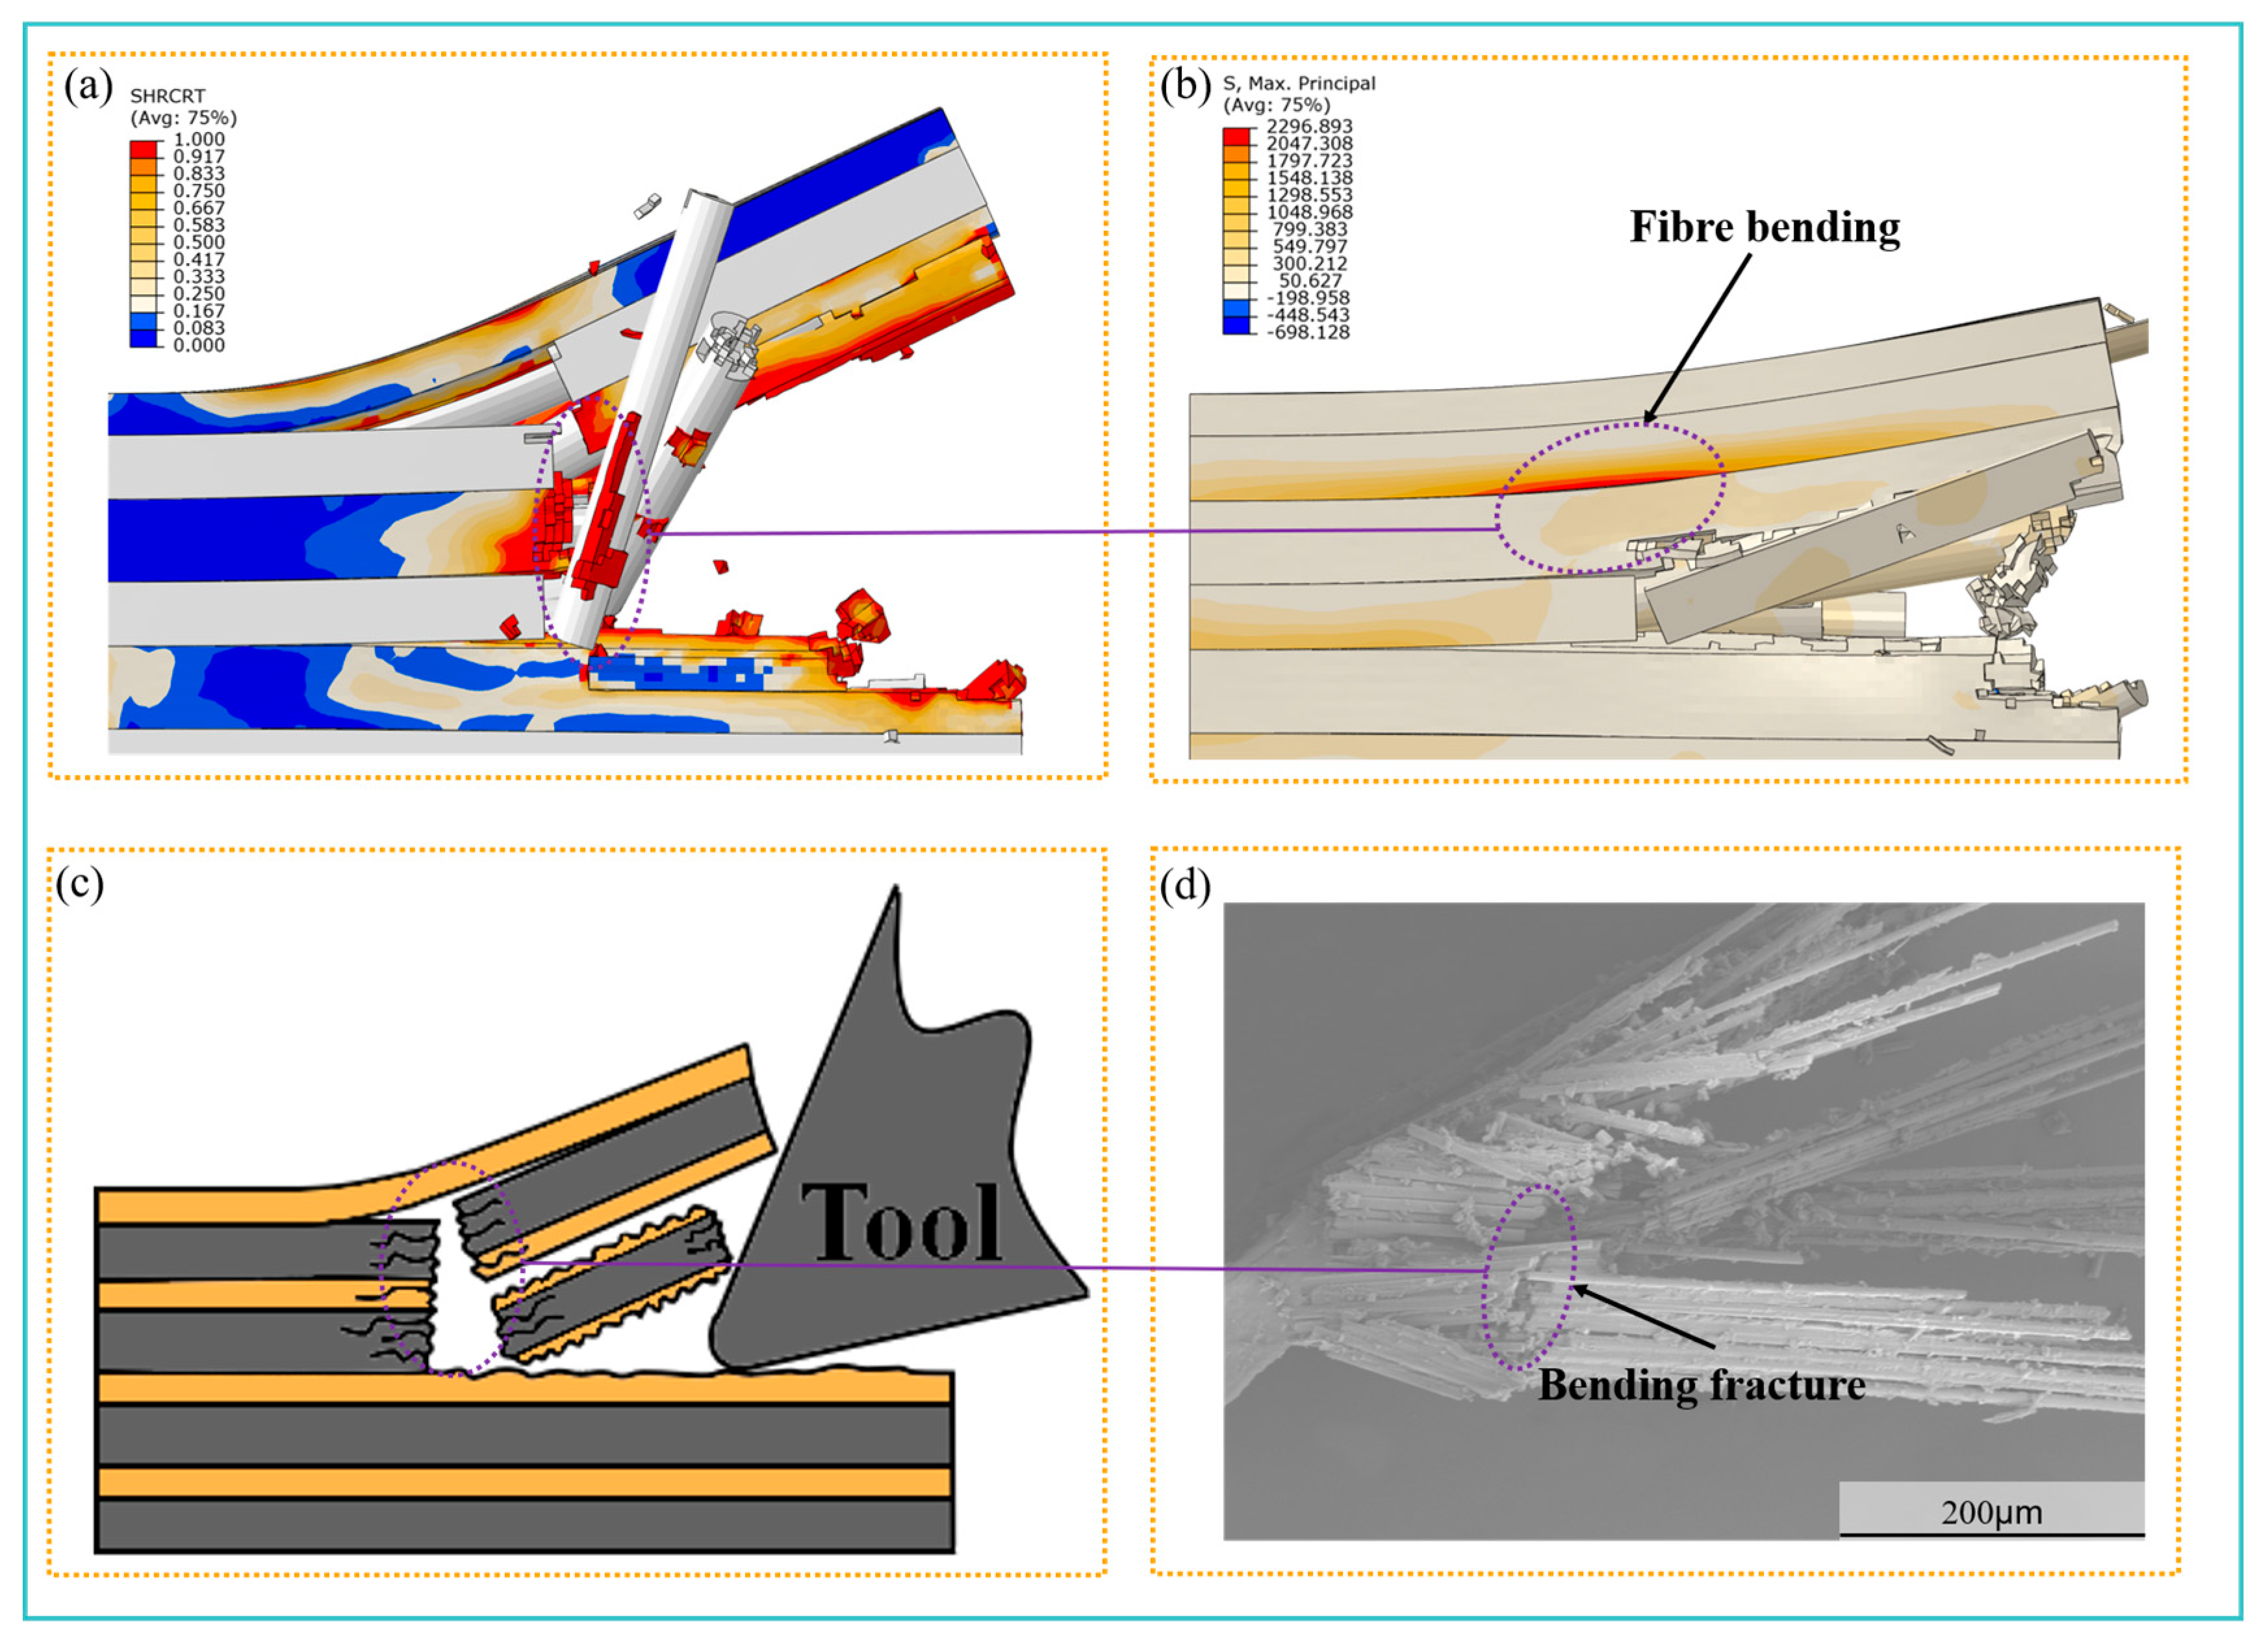
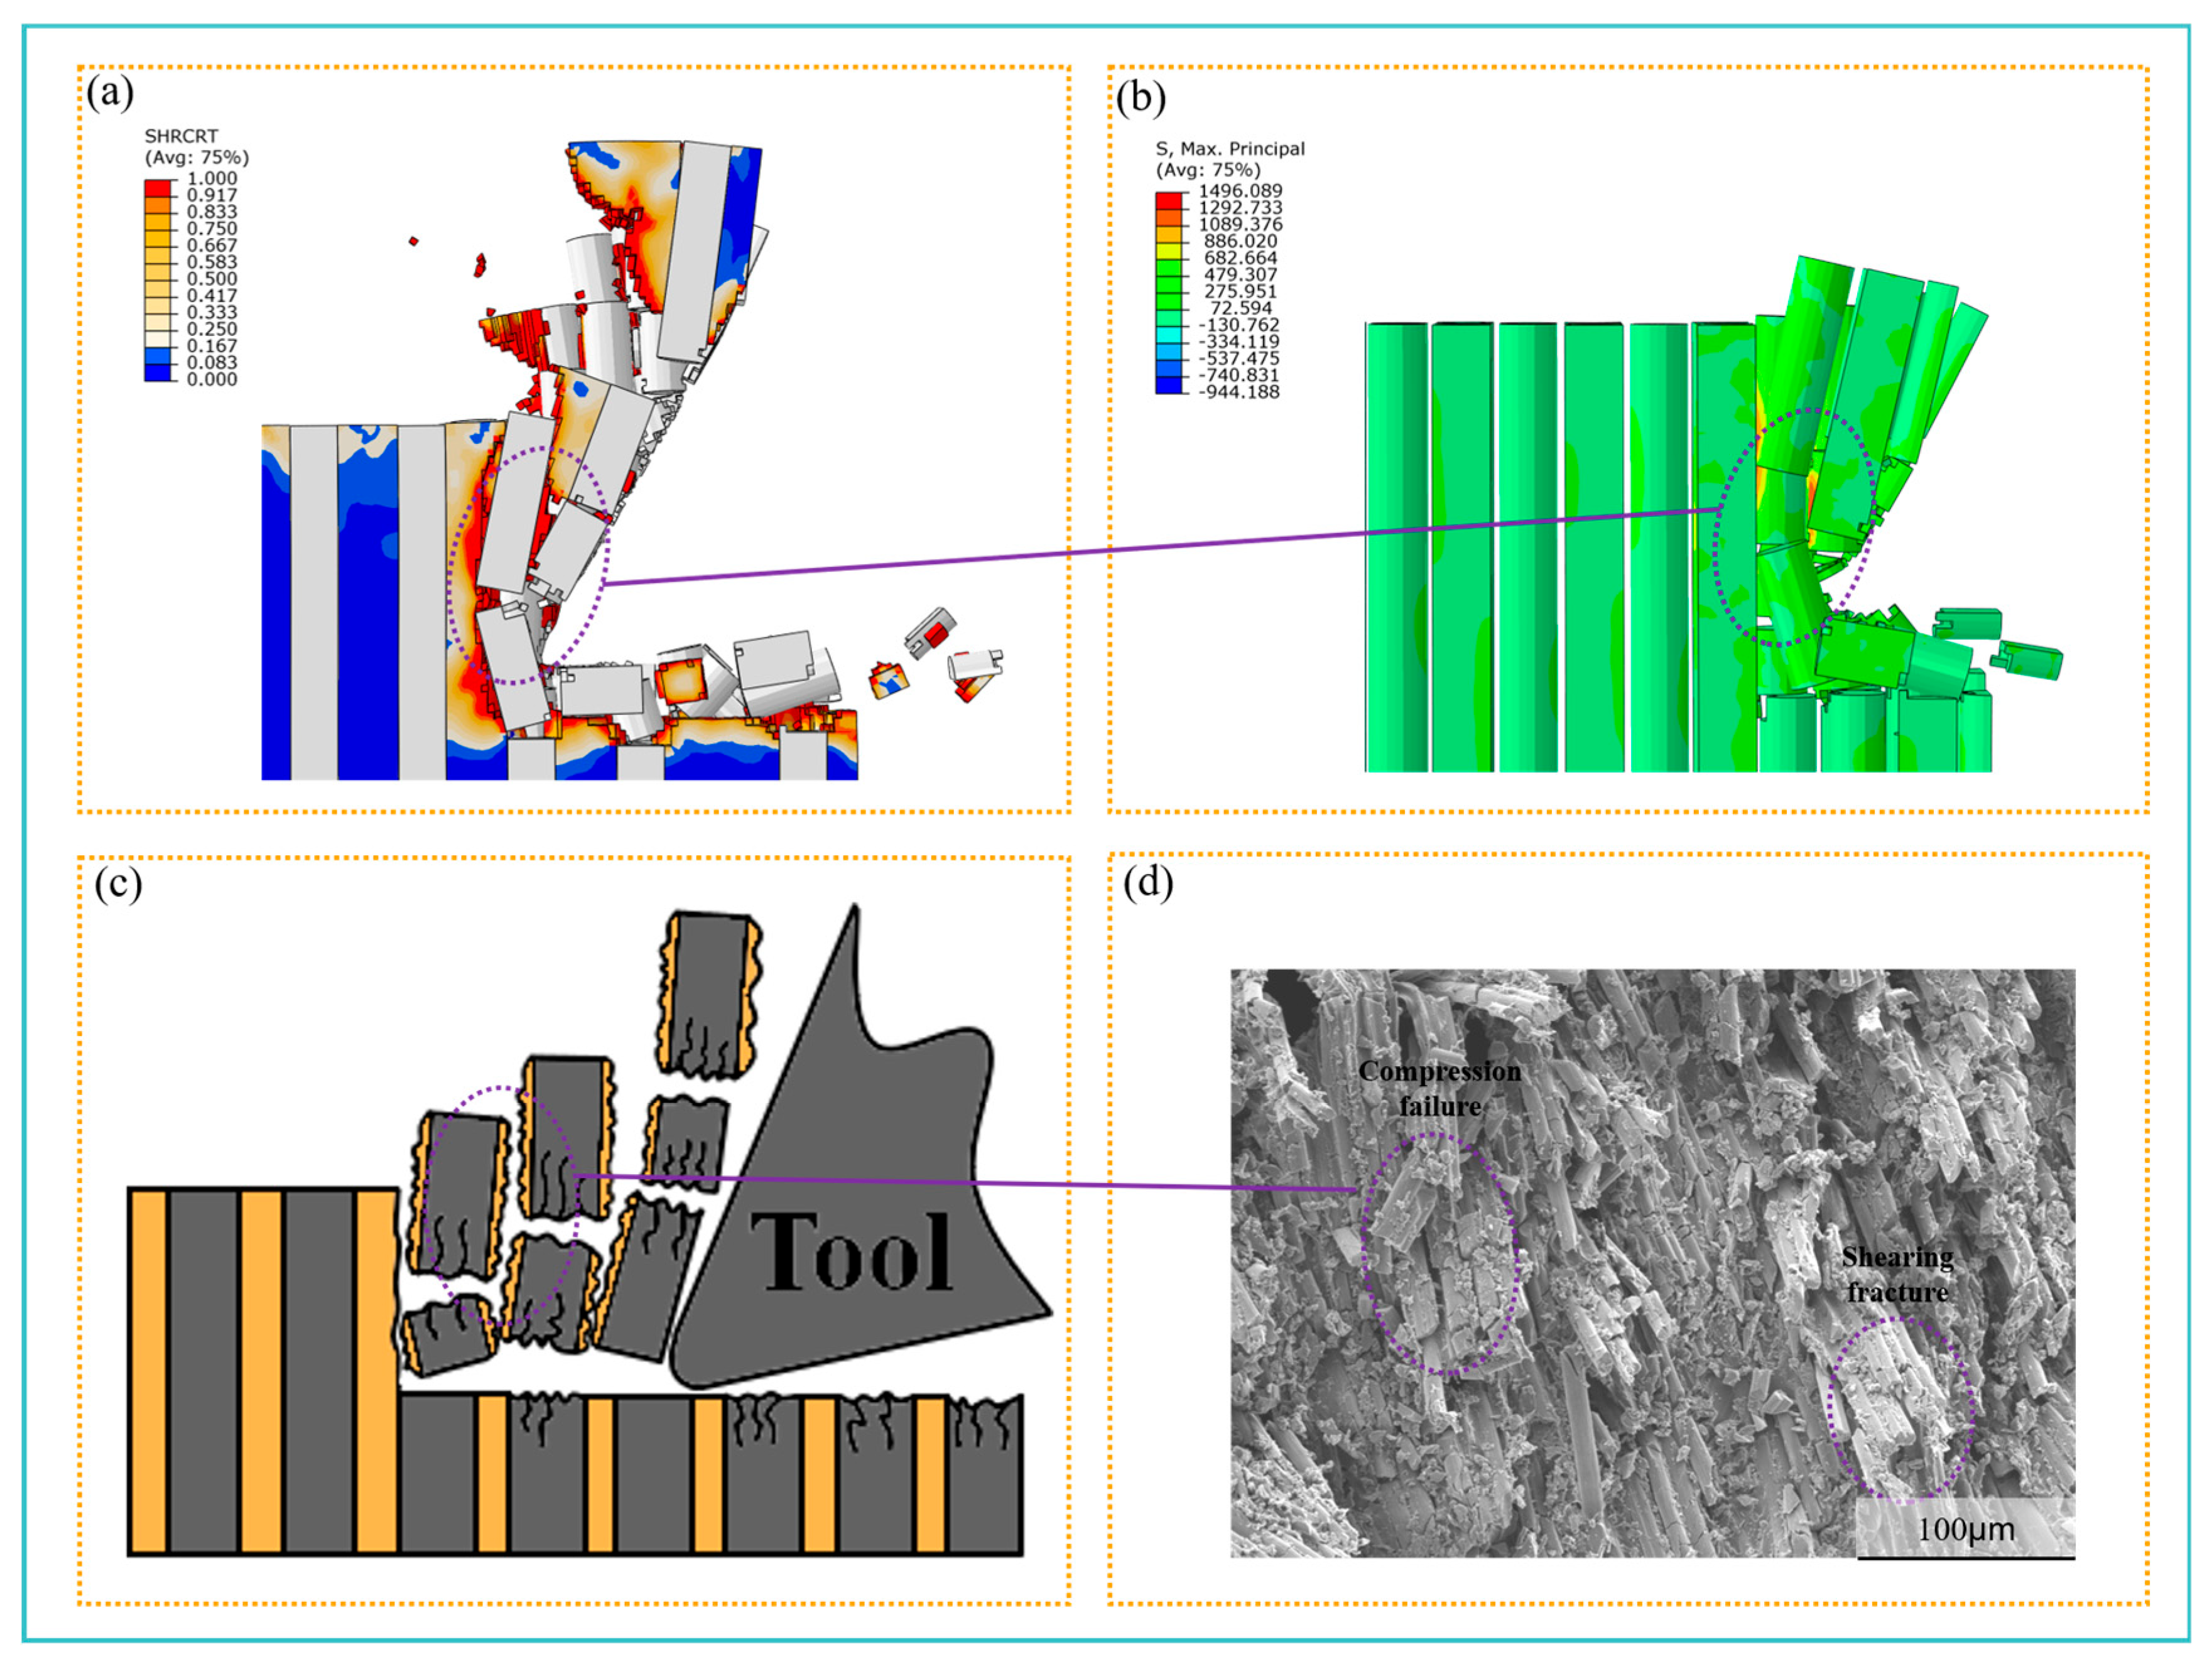
4.5. Microscopic Failure Behavior of CFRP

Figure 11 compares the simulated fracture behaviors during micro-cutting for four fiber orientations (a–d) and elucidates the dominant mechanisms governing each case.
In the 0° orientation (Figure 11a), cutting along the fiber direction primarily induces compressive fracture on the rake face, followed by fiber peeling due to bending as the tool advances, while only limited resin microcracks and fine debris form under flank face compression. This mechanism dominates because fibers aligned with the tool path readily undergo buckling under axial tool pressure.
The 45° orientation (Figure 11b) exhibits simultaneous transverse compression and axial tensile stresses in inclined fibers, leading to coupled bending–compressive failure accompanied by extensive matrix cracking that promotes fiber pull-out and larger debris formation. Here, the mixed-mode loading at 45° maximizes shear–tensile interactions, creating this composite fracture pattern.
For 90° fibers (Figure 11c), direct compressive crushing occurs perpendicular to the tool, generating fan-shaped matrix microcracks, granular chips, and surface pull-out voids, with peak shear stress making compression-shear failure predominant.
The 135° orientation (Figure 11d) demonstrates severe crushing on both tool faces due to counter-movement between fibers and the tool, inducing secondary bending fractures in adjacent fibers that produce highly fragmented debris and deep surface pits. This reverse orientation amplifies bending stress and fiber interactions, yielding the most severe fracture mode.
These findings are consistent with the previous literature [29,31], confirming that as fiber orientation changes from 0° to 135°, the stress equilibrium among axial compression, bending, and shear modifies the dominant failure mechanisms. The 0° orientation tends to induce compressive buckling, 45° leads to mixed-mode fracture, 90° orientation maximizes shear-dominated fragmentation, while the 135° orientation intensifies synergistic bending–crushing destruction.

4.6. Microscopic Morphology of Chips and Its Material Removal Mechanism

As shown in Figure 12, the material removal mechanism and chip formation at 0° fiber orientation primarily involve debonding at the fiber–matrix interface and vertical fiber fracture. The chips are formed through interface debonding and vertical fiber fracture, resulting in long, strip-like debris. Axial stress is distributed along the fiber length, making the fibers more prone to buckling rather than shear fracture, which is consistent with the suggestion of Li et al. [46] that “chips are primarily formed through shear action along the fiber direction at the matrix-interface.” Due to the low fracture strain of epoxy resin (1.5–8.0%) [23], the integrity of the chips is poor, containing numerous microcracks. Correspondingly, scanning electron microscope (SEM) images clearly show the micron-scale matrix fragments and fiber-end fracture morphology (Figure 12d), where the distribution of microcracks is highly consistent with the simulated crack propagation path. This observation confirms the accuracy of the model in predicting interface shear strength and fiber fracture modes.
As shown in Figure 13, the material removal mechanism and chip formation at 45° fiber orientation primarily involve bond failure at the fiber–matrix interface and the extrusion of fiber bundles along the fiber–matrix interface. The oblique cutting induces a mixed-mode failure—transverse compression and axial tension [47]—resulting in ordered block-like chips. The fibers support each other along the interface, reducing the generation of microcracks. Experimental SEM images (Figure 13d) show blocky chips with a more orderly fiber arrangement and smooth fracture surfaces. These observations are highly consistent with the simulated stress concentration zones and the mechanical mechanism of fiber bundles supporting each other, confirming the correspondence between the microstructural morphology in the experimental and simulation results.
As shown in Figure 14, the material removal mechanism and chip formation at 90° fiber orientation primarily involve brittle fracture caused by shear stress from the cutting edge and extrusion fracture due to compressive stress on the uncut fibers. Brittle shear fracture occurs when the fibers are perpendicular to the tool, generating particulate chips along with numerous pull-out holes. The matrix undergoes microcrack amplification under the effects of compressive and shear forces. Experimental SEM images (Figure 14d) reveal smooth fracture surfaces caused by fiber fracture due to shear, as well as microcracks resulting from extrusion fracture, all of which are in good agreement with the simulation results.
As shown in Figure 15, at a 135° fiber orientation, the material removal mechanism and chip formation primarily involve fiber bending fracture and extrusion fracture between adjacent fibers. Reverse cutting leads to severe crushing and bending fracture, resulting in highly fragmented chips. Tool compression and fiber interactions are intensified, leading to the poorest chip integrity. The reverse loading causes bending stress on the fiber’s outer surface to exceed the tensile strength, while the inner surface undergoes compression, forming a typical “bending-extrusion” failure mode, which aligns with the “bending-fracture” mechanism proposed by Zhang et al. [48]. For the 135° orientation, both the simulation (Figure 15a) and experimental (Figure 15d) results demonstrate the interaction of fiber bending–extrusion fracture, showing the worst chip integrity. The consistent fracture modes and fragment distribution patterns observed in both the simulation and experimental results further validate the model’s capability to capture the chip formation mechanism.

4.7. Mechanism and Validation of Surface Damage Formation for Different Fiber Orientations

When the fiber orientation angle is 0°, the surface damage and micro-morphology are shown in Figure 16(b1). The blade cuts along the axial direction of the fibers. The fibers undergo brittle fracture and interfacial debonding due to compression from the cutting edge and the flank face, forming columnar pits. The resin, due to its lower strength, cracks along the fiber direction, and the debris accumulates on the surface of the pits. The experimental SEM images (Figure 16(b1)) clearly show that the distribution of columnar pits and cracks matches well with the simulation predictions, confirming the model’s accurate representation of surface damage morphology under axial loading conditions.
When the fiber orientation angle is 45°, the surface damage and micro-morphology are shown in Figure 16(b2). The fibers fracture under the action of shear stress, resulting in neat fracture surfaces and the formation of groove-shaped pits. The flank face compression causes secondary fracture of the fibers, and residual resin particles are intercepted by the fracture surfaces. Additionally, the fibers exhibit good fracture elongation, and some fibers undergo secondary fracture under the compression of the flank face, leading to the generation of cracks beneath the fiber subsurface. Figure 16(b2) reveals clean fiber fracture surfaces with minor groove-shaped pits, where surface cracks generated by partial fiber bending fractures show excellent agreement with simulation results.
When the fiber orientation angle is 90°, the surface damage and micro-morphology are shown in Figure 16(b3). Due to their low shear strength, the fibers are cut radially, resulting in smooth fracture surfaces. The difference in fracture toughness causes the fibers to be pulled out, forming deep pits with clearly visible residual holes. In Figure 16(b3), holes generated by the fiber pullout after bending fracture can be observed, along with fibers that are pressed onto the machined surface by the rear cutting edge after fracture, as well as resin that is crushed and remains on the machined surface.
When the fiber orientation angle is 135°, the surface damage and micro-morphology are shown in Figure 16(b4). The compression from the rake face induces bending fracture of the fibers, resulting in irregular fracture surfaces and cracks propagating along the fiber axis, which form continuous pits. The fractured resin is smeared between the fiber fracture surfaces, leading to the poorest surface quality. In the experimental figure (Figure 16(b4)), large pits on the processed surface, fibers remaining on the surface after fracture, and fibers exposed after the matrix damage can be clearly observed. This further proves the versatility of the model under complex orientation conditions.
Through the comparison of simulations and experiments, we found that the damage mechanism at 0° is primarily dominated by axial brittle fracture, leaving columnar pits on the machined surface. At 45°, shear fracture occurs, forming groove-like pits on the surface. At 90°, the damage mechanism involves axial tensile and transverse shear fracture, resulting in deep holes on the surface. At 135°, bending fracture is the main mechanism, and due to fiber splitting and resin smearing, the surface roughness is the highest, with continuous fragmented pits formed on the surface.

5. Conclusions

In this study, a combined approach using macro- and micro-scale finite element models along with experimental validation was employed to conduct an in-depth analysis of cutting force evolution, surface damage characteristics, chip formation, and microscale material failure behavior. The material removal mechanisms and surface damage formation during CFRP milling were systematically investigated. The key findings are summarized as follows:
  • The macroscopic model proposed in this study demonstrates good predictability for cutting force, which can guide practical machining and production. The model explains that the cutting force exhibits a non-monotonic trend, following the order 0° < 45° < 135° < 90°. The maximum value is reached at 90° (experimental value: 44.1 N/mm, simulated value: 42.6 N/mm), while the minimum value occurs at 0° (experimental value: 24.8 N/mm, simulated value: 22.9 N/mm), with deviations from experimental values not exceeding 9%.
  • The microscopic model helps other researchers better and more easily understand the process. This model accurately predicts the chip and surface damage modes for each fiber orientation. At 0°, axial brittle fracture occurs with minimal surface damage, resulting in a smooth surface, and columnar pits are formed through resin extrusion and localized fiber bending fracture. At 45°, a mixed shear-tensile mode occurs, leading to surface quality degradation and the appearance of groove-like pits, primarily due to fiber–matrix interface delamination and increased resin plastic deformation. At 90°, shear-dominated pull-out generates an irregular surface, accompanied by granular debris and microcracks. At 135°, compression-bending results in highly fragmented granular chips, and the machined surface exhibits continuous large-area pits, showing the poorest quality.
  • The model assumes an ideal fiber–matrix interface, a rigid tool, and neglects thermal effects, which may influence predictions under high-speed conditions. Future research will incorporate thermo-mechanical coupling, tool wear, and random fiber distribution to enhance the realism of the model.

Author Contributions

Conceptualization, Q.A. and J.Z.; methodology, M.Y.; software, C.Z.; validation, H.C.; formal analysis, Z.C.; investigation, Z.C.; resources, J.Z.; data curation, G.L.; writing—original draft preparation, Q.A.; writing—review and editing, J.Z.; visualization, C.X.; supervision, G.X.; project administration, J.Z.; funding acquisition, C.X. All authors have read and agreed to the published version of the manuscript.

Funding

This work is supported by the Major Innovation Project of Qilu University of Technology (Shandong Academy of Sciences) (Grant No. 2024ZDZX04), the National Natural Science Foundation of China (Grant Nos. 51905286, 52075276), the School Integration Development Strategy Engineering Project of Jinan City (Grant No. JNSX2023041), and the Shandong Undergraduate Teaching Reform Research Project (Grant No. ZZ2024169).

Data Availability Statement

Data will be made available on request.

Conflicts of Interest

The authors declare no conflict of interest.

References

  1. Song, Y.; Cao, H.; Zheng, W.; Qu, D.; Liu, L.; Yan, C. Cutting force modeling of machining carbon fiber reinforced polymer (CFRP) composites: A review. Compos. Struct. 2022, 299, 116096. [Google Scholar] [CrossRef]
  2. Xu, J.; Yin, Y.; Paulo Davim, J.; Li, L.; Ji, M.; Geier, N.; Chen, M. A critical review addressing drilling-induced damage of CFRP composites. Compos. Struct. 2022, 294, 115594. [Google Scholar] [CrossRef]
  3. Ge, J.; Catalanotti, G.; Falzon, B.G.; Higgins, C.; McClory, C.; Thiebot, J.-A.; Zhang, L.; He, M.; Jin, Y.; Sun, D. Process characteristics, damage mechanisms and challenges in machining of fibre reinforced thermoplastic polymer (FRTP) composites: A review. Compos. Part B Eng. 2024, 273, 111247. [Google Scholar] [CrossRef]
  4. Duboust, N.; Pinna, C.; Ghadbeigi, H.; Collis, A.; Ayvar-Soberanis, S.; Kerrigan, K.; Scaife, R. FE modelling of CFRP machining- prediction of the effects of cutting edge rounding. Procedia CIRP 2019, 82, 59–64. [Google Scholar] [CrossRef]
  5. Qin, X.; Bao, Z.; Wu, W.; Li, H.; Li, S.; Zhao, Q. Surface quality evaluation for CFRP milling and its impact on the mechanical properties. Int. J. Adv. Manuf. Technol. 2022, 122, 1083–1097. [Google Scholar] [CrossRef]
  6. Poór, D.I.; Geier, N.; Pereszlai, C.; Xu, J. A critical review of the drilling of CFRP composites: Burr formation, characterisation and challenges. Compos. Part B Eng. 2021, 223, 109155. [Google Scholar] [CrossRef]
  7. Wang, C.; Liu, G.; An, Q.; Chen, M. Occurrence and formation mechanism of surface cavity defects during orthogonal milling of CFRP laminates. Compos. Part B Eng. 2017, 109, 10–22. [Google Scholar] [CrossRef]
  8. Liu, C.; Ren, J.; Shi, K.; Zhang, Y. Investigation of fracture mechanism evolution model for UD-CFRP and MD-CFRP during the milling process. Compos. Struct. 2023, 306, 116585. [Google Scholar] [CrossRef]
  9. Ge, J.; Tan, W.; Ahmad, S.; Falzon, B.G.; Catalanotti, G.; Higgins, C.; Jin, Y.; Sun, D. Temperature-dependent cutting physics in orthogonal cutting of carbon fibre reinforced thermoplastic (CFRTP) composite. Compos. Part A Appl. Sci. Manuf. 2024, 176, 107820. [Google Scholar] [CrossRef]
  10. An, Q.; Ming, W.; Cai, X.; Chen, M. Study on the cutting mechanics characteristics of high-strength UD-CFRP laminates based on orthogonal cutting method. Compos. Struct. 2015, 131, 374–383. [Google Scholar] [CrossRef]
  11. Sorrentino, L.; Turchetta, S. Cutting Forces in Milling of Carbon Fibre Reinforced Plastics. Int. J. Manuf. Eng. 2014, 2014, 439634. [Google Scholar] [CrossRef]
  12. He, Y.; Sheikh-Ahmad, J.; Zhu, S.; Zhao, C. Cutting force analysis considering edge effects in the milling of carbon fiber reinforced polymer composite. J. Mater. Process. Technol. 2020, 279, 116541. [Google Scholar] [CrossRef]
  13. Geier, N. Influence of fibre orientation on cutting force in up and down milling of UD-CFRP composites. Int. J. Adv. Manuf. Technol. 2020, 111, 881–893. [Google Scholar] [CrossRef]
  14. He, Y.; Qing, H.; Zhang, S.; Wang, D.; Zhu, S. The cutting force and defect analysis in milling of. carbon fiber-reinforced polymer (CFRP) composite. Int. J. Adv. Manuf. Technol. 2017, 93, 1829–1842. [Google Scholar] [CrossRef]
  15. Böhland, F.; Hilligardt, A.; Schulze, V. Analysis of subsurface damage during milling of CFRP due to spatial fibre cutting angle, tool geometry and cutting parameters. Compos. Part B Eng. 2024, 281, 111533. [Google Scholar] [CrossRef]
  16. Chen, Y.; Guo, X.; Zhang, K.; Guo, D.; Zhou, C.; Gai, L. Study on the surface quality of CFRP machined by micro-textured milling tools. J. Manuf. Process. 2019, 37, 114–123. [Google Scholar] [CrossRef]
  17. Wang, C.; Wen, L.; Ming, W.; An, Q.; Chen, M. Experimental study on effects of fiber cutting angle in milling of high-strength unidirectional carbon fiber–reinforced polymer laminates. Proc. Inst. Mech. Eng. Part B J. Eng. Manuf. 2017, 232, 1813–1824. [Google Scholar] [CrossRef]
  18. Li, C.; Liu, N.; Chen, L.; Chen, W.; Liu, Y.; Zhang, M. Analysis of the effects of different milling strategies on helical milling of unidirectional CFRP under minimum quantity lubrication. J. Manuf. Process. 2024, 132, 27–37. [Google Scholar] [CrossRef]
  19. Cai, C.; Dang, J.; An, Q.; Ming, W.; Chen, M. Surface morphology characterization of unidirectional carbon fibre reinforced plastic machined by peripheral milling. Chin. J. Aeronaut. 2022, 35, 361–375. [Google Scholar] [CrossRef]
  20. Wu, W.; Li, S.; Qin, X.; Fu, G.; Bao, Z.; Li, H.; Zhao, Q. Tool wear influence on surface roughness, burrs and cracks in milling unidirectional carbon fiber reinforced plastics (UD-CFRP). J. Mater. Res. Technol. 2024, 30, 3052–3065. [Google Scholar] [CrossRef]
  21. Zhang, L.; Zhang, X. Effect of cooling and lubrication conditions on the variable angle milling of unidirectional CFRP with PCD tools. J. Mater. Process. Technol. 2023, 319, 118073. [Google Scholar] [CrossRef]
  22. Xu, W.; Zhang, L.; Wu, Y. Effect of tool vibration on chip formation and cutting forces in the machining of fiber-reinforced polymer composites. Mach. Sci. Technol. 2016, 20, 312–329. [Google Scholar] [CrossRef]
  23. Ge, J.; Luo, M.; Zhang, D.; Catalanotti, G.; Falzon, B.G.; McClelland, J.; Higgins, C.; Jin, Y.; Sun, D. Temperature field evolution and thermal-mechanical interaction induced damage in drilling of thermoplastic CF/PEKK-A comparative study with thermoset CF/epoxy. J. Manuf. Process. 2023, 88, 167–183. [Google Scholar] [CrossRef]
  24. Ge, J.; Catalanotti, G.; Falzon, B.G.; McClelland, J.; Higgins, C.; Jin, Y.; Sun, D. Towards understanding the hole making performance and chip formation mechanism of thermoplastic carbon fibre/polyetherketoneketone composite. Compos. Part B Eng. 2022, 234, 109752. [Google Scholar] [CrossRef]
  25. Cepero-Mejías, F.; Phadnis, V.A.; Kerrigan, K.; Curiel-Sosa, J.L. A finite element assessment of chip formation mechanisms in the machining of CFRP laminates with different fibre orientations. Compos. Struct. 2021, 268, 113966. [Google Scholar] [CrossRef]
  26. Cepero-Mejías, F.; Curiel-Sosa, J.L.; Zhang, C.; Phadnis, V.A. Effect of cutter geometry on machining induced damage in orthogonal cutting of UD polymer composites: FE study. Compos. Struct. 2019, 214, 439–450. [Google Scholar] [CrossRef]
  27. Wang, X.; Wang, F.; Jin, X.; Fu, R.; Shi, Y. Numerical prediction of the chip formation and damage response in CFRP cutting with a novel strain rate based material model. Compos. Struct. 2022, 294, 115746. [Google Scholar] [CrossRef]
  28. Chen, R.; Li, S.; Li, P.; Li, X.; Qiu, X.; Ko, T.J.; Jiang, Y. Effect of fiber orientation angles on the material removal behavior of CFRP during cutting process by multi-scale characterization. Int. J. Adv. Manuf. Technol. 2020, 106, 5017–5031. [Google Scholar] [CrossRef]
  29. Cheng, H.; Gao, J.; Kafka, O.L.; Zhang, K.; Luo, B.; Liu, W.K. A micro-scale cutting model for UD CFRP composites with thermo-mechanical coupling. Compos. Sci. Technol. 2017, 153, 18–31. [Google Scholar] [CrossRef]
  30. He, Y.; Li, L.; Wan, M.; Xue, H. Three-dimensional finite element simulations of milling carbon/epoxy composites. Compos. Struct. 2022, 282, 115037. [Google Scholar] [CrossRef]
  31. Yan, X.; Reiner, J.; Bacca, M.; Altintas, Y.; Vaziri, R. A study of energy dissipating mechanisms in orthogonal cutting of UD-CFRP composites. Compos. Struct. 2019, 220, 460–472. [Google Scholar] [CrossRef]
  32. Huang, L.; Tao, Y.; Sun, J.; Zhang, D.; Zhao, J. Assessment of numerical modeling approaches for thin composite laminates under low-velocity impact. Thin-Walled Struct. 2023, 191, 111053. [Google Scholar] [CrossRef]
  33. Liu, Y.; Pan, Z.; Li, Q.; Qi, Z.; Chen, W.; Liu, P. Comparative analysis of dynamic progressive failure of CFRPs using the scale-span and macroscopic modeling method in drilling. Eng. Fract. Mech. 2022, 268, 108434. [Google Scholar] [CrossRef]
  34. Liu, P.F.; Liao, B.B.; Jia, L.Y.; Peng, X.Q. Finite element analysis of dynamic progressive failure of carbon fiber composite laminates under low velocity impact. Compos. Struct. 2016, 149, 408–422. [Google Scholar] [CrossRef]
  35. Zhang, L.; Wang, G.; Xu, X.; Xuan, S.; Fan, X.; Kan, Y.; Yao, X. Thermal–mechanical coupling numerical simulation and low damage analysis for drilling composite. Compos. Struct. 2023, 324, 117542. [Google Scholar] [CrossRef]
  36. Klinkova, O.; Rech, J.; Drapier, S.; Bergheau, J.-M. Characterization of friction properties at the workmaterial/cutting tool interface during the machining of randomly structured carbon fibers reinforced polymer with carbide tools under dry conditions. Tribol. Int. 2011, 44, 2050–2058. [Google Scholar] [CrossRef]
  37. Calzada, K.A.; Kapoor, S.G.; DeVor, R.E.; Samuel, J.; Srivastava, A.K. Modeling and interpretation of fiber orientation-based failure mechanisms in machining of carbon fiber-reinforced polymer composites. J. Manuf. Process. 2012, 14, 141–149. [Google Scholar] [CrossRef]
  38. Hongkarnjanakul, N.; Bouvet, C.; Rivallant, S. Validation of low velocity impact modelling on different stacking sequences of CFRP laminates and influence of fibre failure. Compos. Struct. 2013, 106, 549–559. [Google Scholar] [CrossRef]
  39. Tan, W.; Falzon, B.G.; Chiu, L.N.S.; Price, M. Predicting low velocity impact damage and Compression-After-Impact (CAI) behaviour of composite laminates. Compos. Part A Appl. Sci. Manuf. 2015, 71, 212–226. [Google Scholar] [CrossRef]
  40. Li, C.; Zhao, Y.; Qiu, X.; Li, S.; Niu, Q.; Li, P.; Ko, T.J. Interface mechanical damage mechanism in machining carbon fiber-reinforced plastic/Ti stacks based on a three-dimensional microscopic oblique cutting model. Compos. Struct. 2022, 279, 114737. [Google Scholar] [CrossRef]
  41. Isbilir, O.; Ghassemieh, E. Finite Element Analysis of Drilling of Carbon Fibre Reinforced Composites. Appl. Compos. Mater. 2011, 19, 637–656. [Google Scholar] [CrossRef]
  42. Jia, Z.-y.; Chen, C.; Wang, F.-j.; Ma, J.-w.; Yang, F. Three-dimensional oblique cutting model for sub-surface damage analysis in CFRP/Ti stack composite machining. Int. J. Adv. Manuf. Technol. 2018, 96, 643–655. [Google Scholar] [CrossRef]
  43. Han, L.; Zhang, J.; Liu, Y.; Sun, T. Effect of fiber orientation on depth sensing intra-laminar failure of unidirectional CFRP under nano-scratching. Compos. Part B Eng. 2021, 224, 109211. [Google Scholar] [CrossRef]
  44. Liu, C.; Ren, J.; Zhang, Y.; Shi, K. A cutting force prediction model for UD-CFRP and MD-CFRP milling based on fracture mechanisms and mechanical properties. Compos. Part A Appl. Sci. Manuf. 2025, 194, 108892. [Google Scholar] [CrossRef]
  45. Świrad, S.; Wydrzynski, D.; Nieslony, P.; Krolczyk, G.M. Influence of hydrostatic burnishing strategy on the surface topography of martensitic steel. Measurement 2019, 138, 590–601. [Google Scholar] [CrossRef]
  46. Li, H.; Qin, X.; He, G.; Jin, Y.; Sun, D.; Price, M. Investigation of chip formation and fracture toughness in orthogonal cutting of UD-CFRP. Int. J. Adv. Manuf. Technol. 2015, 82, 1079–1088. [Google Scholar] [CrossRef]
  47. Qin, X.; Wu, X.; Li, H.; Li, S.; Zhang, S.; Jin, Y. Numerical and experimental investigation of orthogonal cutting of carbon fiber-reinforced polyetheretherketone (CF/PEEK). Int. J. Adv. Manuf. Technol. 2021, 119, 1003–1017. [Google Scholar] [CrossRef]
  48. Zhang, S.; Hu, J.; Xuan, S.; Yu, J.; Kang, R.; Tian, W. Investigation on cutting mechanism and micro-damage evolution in orthogonal cutting of T300/USN20000-7901 unidirectional laminates. Int. J. Adv. Manuf. Technol. 2023, 126, 4475–4494. [Google Scholar] [CrossRef]
Figure 1. Diagram of the FEM macroscopic model and applied boundary conditions.
Jcs 09 00342 g001
Figure 2. Cohesive failure modes.
Jcs 09 00342 g002
Figure 3. Schematic diagram of the microscopic scale model with different fiber orientations.
Jcs 09 00342 g003
Figure 4. Experimental setup.
Jcs 09 00342 g004
Figure 5. Surface Ra parameter analysis of milled CFRPs under different fiber orientations.
Jcs 09 00342 g005
Figure 6. Comparison of simulated and experimental average Fx-direction cutting forces under different fiber orientations.
Jcs 09 00342 g006
Figure 7. Comparison of simulated and experimental Fy-direction cutting forces under different fiber orientations.
Jcs 09 00342 g007
Figure 8. Comparison of simulated and experimental peak cutting forces in Fx and Fy directions under different fiber orientations.
Jcs 09 00342 g008
Figure 9. Macroscopic chip morphology and surface morphology under different fiber orientations. (a1a4): Macroscopic chip morphology at 0–135° fiber orientations. (b1b4): Macroscopic surface morphology at 0–135° fiber orientations. (c1c4): 3D morphology at 0–135° fiber orientations.
Jcs 09 00342 g009
Figure 10. (ae) The influence of fiber orientation on three-dimensional surface roughness parameters.
Jcs 09 00342 g010
Figure 11. Microscale failure behavior of CFRP under different fiber orientations. (a) 0°, (b) 45°, (c) 90°, (d) 135°.
Jcs 09 00342 g011
Figure 12. Microstructure analysis and material removal finite element modeling under 0° fiber orientation (a) FEM simulation of chip microstructure (b) Fiber stress state during cutting process (c) Schematic diagram of chip formation (d) SEM image showing the microstructure of the chips.
Jcs 09 00342 g012
Figure 13. Microstructure analysis and material removal finite element modeling under 45° fiber orientation. (a) FEM simulation of chip microstructure. (b) Fiber stress state during cutting process (c) Schematic diagram of chip formation. (d) SEM image showing the microstructure of the chips.
Jcs 09 00342 g013
Figure 14. Microstructure analysis and material removal finite element modeling under 90° fiber orientation. (a) FEM simulation of chip microstructure. (b) Fiber stress state during cutting process. (c) Schematic diagram of chip formation. (d) SEM image showing the microstructure of the chips.
Jcs 09 00342 g014
Figure 15. Microstructure analysis and material removal finite element modeling under 135° fiber orientation. (a) FEM simulation of chip microstructure. (b) Fiber stress state during cutting process. (c) Schematic diagram of chip formation. (d) SEM image showing the microstructure of the chips.
Jcs 09 00342 g015
Figure 16. Processed surface damage morphology at the microscopic scale for four typical fiber orientation angles of CFRP. (a1a4) Simulation results of processed surface micro-damage. (b1b4) SEM images of the processed surface morphology.
Jcs 09 00342 g016
Table 3. Cohesive material parameters [43].
Normal strengthtn = 50 Mpa
InterfaceShear strengthts = 75 Mpa
Elastic stiffnessK = 100,000 N/mm3
Fracture energyG = 0.002 N/mm3
Table 4. Material properties of microscopic model [43].
MaterialPropertyValues
Carbon fiberElastic constantsE1 = 231 GPa, E2 = E3 = 15 GPa
Poisson’s ratioV12 = V13 = 0.2, V23 = 0.25
Shear modulusG12 = G13 = 15 GPa, G23 = 7 GPa
Tensile strengthXt = 4.62 GPa, Yt = 1.5 GPa
Compressive strengthXc = 3.96 GPa, Yc = 3.34 GPa
MatrixPoisson’s ratioV = 0.35
Young’s modulusE = 3.35 Gpa
Yield strengthσm = 120 MPa
Fracture energyGm = 0.1 N/mm
InterfaceNormal strengthtn = 50 MPa
Shear strengthts = 75 MPa
Elastic stiffnessK = 100,000 N/mm3
Fracture energyGI = 0.002 N/mm, GII = GIII = 0.006 N/mm
Table 5. Material performance parameters of carbon fiber T700S.
MaterialsT700s
Density1.8 g/cm3
Young Modulus230 GPa
Strength4900 Mpa
Poisson’s ratio0.2
Elongation ratio2.1%
Table 6. Summary of ANOVA for peak cutting force in the Fx direction of CFRP plates.
Fiber Orientation (°)Cutting Force Measurements (N/mm)MeanStandard Deviation (SD)SumNumber of Observations
25.5,24.1,23.924.80.4974.53
45°36.7,35.2,34.935.80.63107.43
90°43.9,43.1,45.544.11.49132.53
135°37.4,35.8,36.836.40.72109.33
Table 7. Results of Analysis of Variance (ANOVA).
Source of VariationSSdfMSFp-Value
Between Groups569.13189.7227.2<0.0001
Within Groups6.6880.83
Total575.811
Disclaimer/Publisher’s Note: The statements, opinions and data contained in all publications are solely those of the individual author(s) and contributor(s) and not of MDPI and/or the editor(s). MDPI and/or the editor(s) disclaim responsibility for any injury to people or property resulting from any ideas, methods, instructions or products referred to in the content.

