Article

Multi-Scale Experimental Investigation of UHPC Rheology: From Cement Paste to Fiber-Reinforced Mortar Scale

by
Alfred Addai-Nimoh
,
Jingjie Wei
and
Kamal H. Khayat
*
Department of Civil, Architectural and Environmental Engineering, Missouri University of Science and Technology, 500 W 16th Street, Rolla, MO 65409, USA
*
Author to whom correspondence should be addressed.
J. Compos. Sci. 2025, 9(11), 638; https://doi.org/10.3390/jcs9110638
Submission received: 12 October 2025 / Revised: 10 November 2025 / Accepted: 11 November 2025 / Published: 18 November 2025
(This article belongs to the Special Issue Sustainable Cementitious Composites)

Abstract

Numerous studies have been published on various rheological aspects of conventional and high-performance concrete, some of which encompass multi-scale investigations. However, there is no published article that studies the rheology of ultra-high-performance concrete (UHPC) with a multi-scale approach. In this paper, a comprehensive investigation into the rheological properties of UHPC at three cementitious material scales was undertaken: the paste scale, the high-strength mortar scale, and the fiber-reinforced composite scale. The effect of cement type, supplementary cementitious materials (SCMs), and the water-to-binder ratio (w/b) on the rheology of UHPC at various material scales was evaluated using the appropriate rheometric apparatus. The results indicated that all of the UHPC mixtures in this study exhibited shear thickening behavior, and the degree of shear thickening increased as the w/b decreased. This phenomenon was systematically quantified at the paste, high-strength mortar, and fiber-reinforced composite scales, enabling direct comparison across material levels. Notably, the incorporation of silica fume suppressed the shear thickening behavior, as evidenced by the disappearance of the second-order term in the modified Bingham model, whereas slag had no such effect. The 28-day compressive strength of the investigated UHPC mixtures ranged between 100 and 150 MPa, and the mixture prepared with a combination of cement and silica fume (90C10SF) exhibited 35% higher compressive strength compared to the mixture prepared with cement and slag (90C10SL). Additionally, the UHPC mixture prepared with 90C10SF binder combination showed a 20% higher load-carrying capacity compared to the UHPC mixture made with 90C10SL and 80C10SL10SF binder combination.

1. Introduction

Ultra-high-performance concrete (UHPC) is designed on the principle of maximizing the packing density of the solid skeleton to achieve a compact and dense hydrated cement paste microstructure. This dense microstructure can be achieved using fine particles with a well-graded particle size distribution and employing low water-to-binder ratios (w/b), resulting in enhanced mechanical and durability UHPC properties [1]. In general, the rheological behavior of UHPC is influenced by its mixture design, including the binder composition, particle characteristics (e.g., morphology, particle-size distribution, and surface area), and chemical admixtures [2,3]. Within the binder composition, supplementary cementitious materials (SCMs) play a key role in impacting the rheological behavior of UHPC. In particular, silica fume (SF) is extensively used in UHPC preparation due to its high surface area and pozzolanic activity, which contributes to microstructure refinement and rheological control [4]. However, in terms of rheology of UHPC, the effect of SF depends on the content of SF incorporated. For example, Wu et al. [1] showed that the incorporation of 10%–15% SF by cementitious mass resulted in a decrease in the viscosity in UHPC, whereas further increasing the SF content from 15%–25% resulted in an increase in the plastic viscosity.
Slag (SL) is a byproduct of steel manufacturing and, through a series of processing, can be converted into an SCM for use in concrete. The use of SL can increase the plastic viscosity of concrete [5]. For instance, Khayat et al. [6] reported that the substitution of cement by SL increased the plastic viscosity in cement grout. However, the SL in ternary blends with SF can enhance particle packing and improve the rheological behavior. For example, Medhipour et al. [7] indicated that the ternary mixtures consisting of cement, SL, and SF exhibited enhanced packing density, which is reflected in their improved dynamic yield stress and plastic viscosity.
Superplasticizers (SPs), particularly polycarboxylate-based SP types, are essential for achieving workable UHPC [2,8,9]. While SPs play the role of increasing the flowability of concrete, they have also shown to contribute to increasing the intensity shear thickening phenomena in cementitious mixtures as a result of steric hindrance and the interweaving of the polymer chains in the pore fluid [5]. This phenomenon is generally undesirable as it may damage mixing or pumping equipment [5,10]. Furthermore, optimal plastic viscosity ranges of 30–60 Pa·s has been reported as suitable for enhanced fiber distribution, and thus further increase in viscosity beyond this threshold can reduce fiber dispersion in concrete [11].
The rheological properties of cementitious materials are scale dependent [12]. Rheology at the paste level influences the rheological behavior observed at the mortar level and the fiber-reinforced composite scale, and this relationship has served as the basis for the design of concrete mixture to meet specific rheological requirements [13]. Mortar can be considered as a suspension of sand in a paste medium and, as such, the rheology of mortar tends to be more complex compared to paste due to the wide range of particles involved [14]. Fiber characteristics significantly influence rheological behavior at the UHPC scale. Increasing the fiber volume fraction generally raises the yield stress and plastic viscosity due to intensified fiber–matrix interactions and restricted particle movement [2]. In addition, fiber orientation relative to the flow direction alters flow resistance—fibers aligned with the flow facilitate easier deformation, while randomly oriented or cross-flow fibers form entangled networks that increase the apparent viscosity [15].
Hence, multi-scale research in concrete rheology has practical applications, including the optimization of fresh properties to meet functional requirements, the supporting of advanced modeling, the simulation of concrete behavior, and the enhancement of mechanical and durability performance [16,17]. Despite the known scale-dependent rheological behavior of UHPC, the complex interactions across different scales in UHPC remain poorly understood and, to date, no published article has systematically studied the rheology of UHPC using a multi-scale framework. Establishing predictive relationships across scales could significantly improve mixture design and processing efficiency in UHPC applications [18]. Unlike prior studies by Wu et al. (who clarified how SF content alters the rheology within UHPC [1]), as well as Feys et al., 2009 [10] (who provided the mechanistic explanation for shear thickening, but did not evaluate the SCM effects (SF vs. SL) or provide multi-scale rheology data), this study systematically bridges the rheology paste, mortar, and fiber-reinforced scales of UHPC, and it also investigates the effect of SF and SL on the rheology of UHPC across the paste, mortar, and fiber-reinforced composite scales.
This study aims to investigate the influence of the cementitious material type and w/b on the rheology, early-age hydration, and mechanical properties of UHPC at three scales: the paste, mortar, and fiber-reinforced composite scales. Relationships were established to predict UHPC rheological behavior and to quantify shear thickening and thixotropy in relation to SP dosage and w/b. This multiscale approach advances the current understanding of UHPC fresh-state behavior and offers practical guidance for optimizing UHPC formulations to meet functional and processing requirements in advanced structural applications.

2. Materials and Methods

2.1. Materials

To evaluate the effects of different cement types and SCMs on the performance of UHPC at three scales, Type 1L cement, Type III cement, SF, and SL were used as the cementitious materials in this study, the chemical compositions of which are shown in Table 1. Type 1L and Type III cements were procured from Buzzi Unicem (Missouri, MO, USA), SF from Elkem Microsilica 920 (St. Louis, MO, USA) in Missouri USA 920 and ground-granulated blast furnace slag from LafargeHolcim (St. Louis, MO, USA) in Missouri USA were also used. All materials met ASTM C150 and C989 requirements. The reason for selecting Type 1L was that it was a readily availability material, whereas the supply of Type III cement was gradually diminishing in the U.S. The Type 1L and Type III cements had Blaine fineness values of 1.45 and 625 m2/g, respectively. A polycarboxylate based SP was employed to secure a target slump flow of 150 to 200 mm for all UHPC mixtures evaluated across all scales. Masonry sand with a water absorption of 0.16% and a maximum aggregate size of 2 mm was used as the fine aggregate due to local availability and its cost effectiveness (as compared to quartz sand). The D50 and fineness modulus of the masonry sand were 500 mm and 2.1, respectively. Straight steel fibers measuring 13 mm in length and 0.2 mm in diameter were used in preparing the UHPC mixtures.

2.2. Mixture Proportion and Sample Preparation

In this study, 26 paste mixtures, 9 mortar mixtures, and 3 UHPC mixtures were considered. In the first test series, only the effect of the cement type and w/b on the rheological behavior of the cement paste mixtures was investigated. A total of 10 cement paste mixtures were prepared at a w/b of 0.16, 0.18, 0.20, 0.22, and 0.24, with a target compressive strength of 120 MPa at 28 days [19]. The rheological properties, hydration characteristics, and compressive strength development of the cement paste mixtures were evaluated.
The second phase of the investigation involved the evaluation of the effect of SL and SF on the rheological properties of UHPC at the paste level, which is referred to as binder paste in this paper. SL and SF were incorporated at 10% and 20% mass replacements, respectively, because this content of SF and SL has been shown to enhance particle packing [20,21]. The binder paste mixtures were prepared with a w/b ranging from 0.16 to 0.24.
The third phase of this study involved investigating the rheological properties of mortar mixture prepared with binder combinations from the binder paste level. A sand-to-binder ratio (s/b) of 1.2 by mass, which is typical for UHPC, was selected for the mortar mixtures [22]. The masonry sand was dried in the oven prior to being used and, therefore, was considered dry and not to have contributed to the water content of the mixture.
The final phase of this study involved investigating the rheology of the selected UHPC mixtures prepared with a 2% fiber volume. The mixture proportions of the investigated paste, mortar, and UHPC mixtures are shown in Table 2.
The paste, mortar, and UHPC mixtures were prepared using a Hobart mixer. The dry materials were homogenized for 2 min at 139 rev/min. Then, approximately 90% of water and SP was added, and the resulting mixture was mixed for 1 min. The remaining water and SP were added, and the resulting mixture was mixed for 2 min at 285 rev/min. Finally, the mixing bowl was scraped, and mixture was mixed for 1 min to ensure a uniform mixture. For the UHPC mixtures, the fibers were gradually added to a mortar mixture till a homogenous mixture was obtained. Figure 1 illustrates the progressive material composition from cement paste to mortar and fiber-reinforced mortar, showing the inclusion of the sand particles and fibers that enhanced the structural integrity and mechanical performance of the matrix. The cement paste primarily consisted of dispersed cement particles, the mortar included additional fine aggregate (sand) particles within the paste matrix, and the fiber-reinforced mortar incorporated short fibers that enhanced the strength and crack resistance.

2.3. Test Methods

2.3.1. Slump Flow of UHPC at Three Scales

The slump flow test was performed using a cone with an upper diameter of 70 mm, a base diameter of 100 mm, and a height of 60 mm, in accordance with ASTM C1437. The mixtures were poured directly into the slump cone, the cone was lifted in one single vertical movement, and the mixture was left to flow freely. Once the flow ceased, the mean spread was determined, and for each mixture at the paste, mortar, and UHPC level, the slump flow before jolting and after 25 jolting cycles was recorded.

2.3.2. Rheological Properties of the Cement Paste

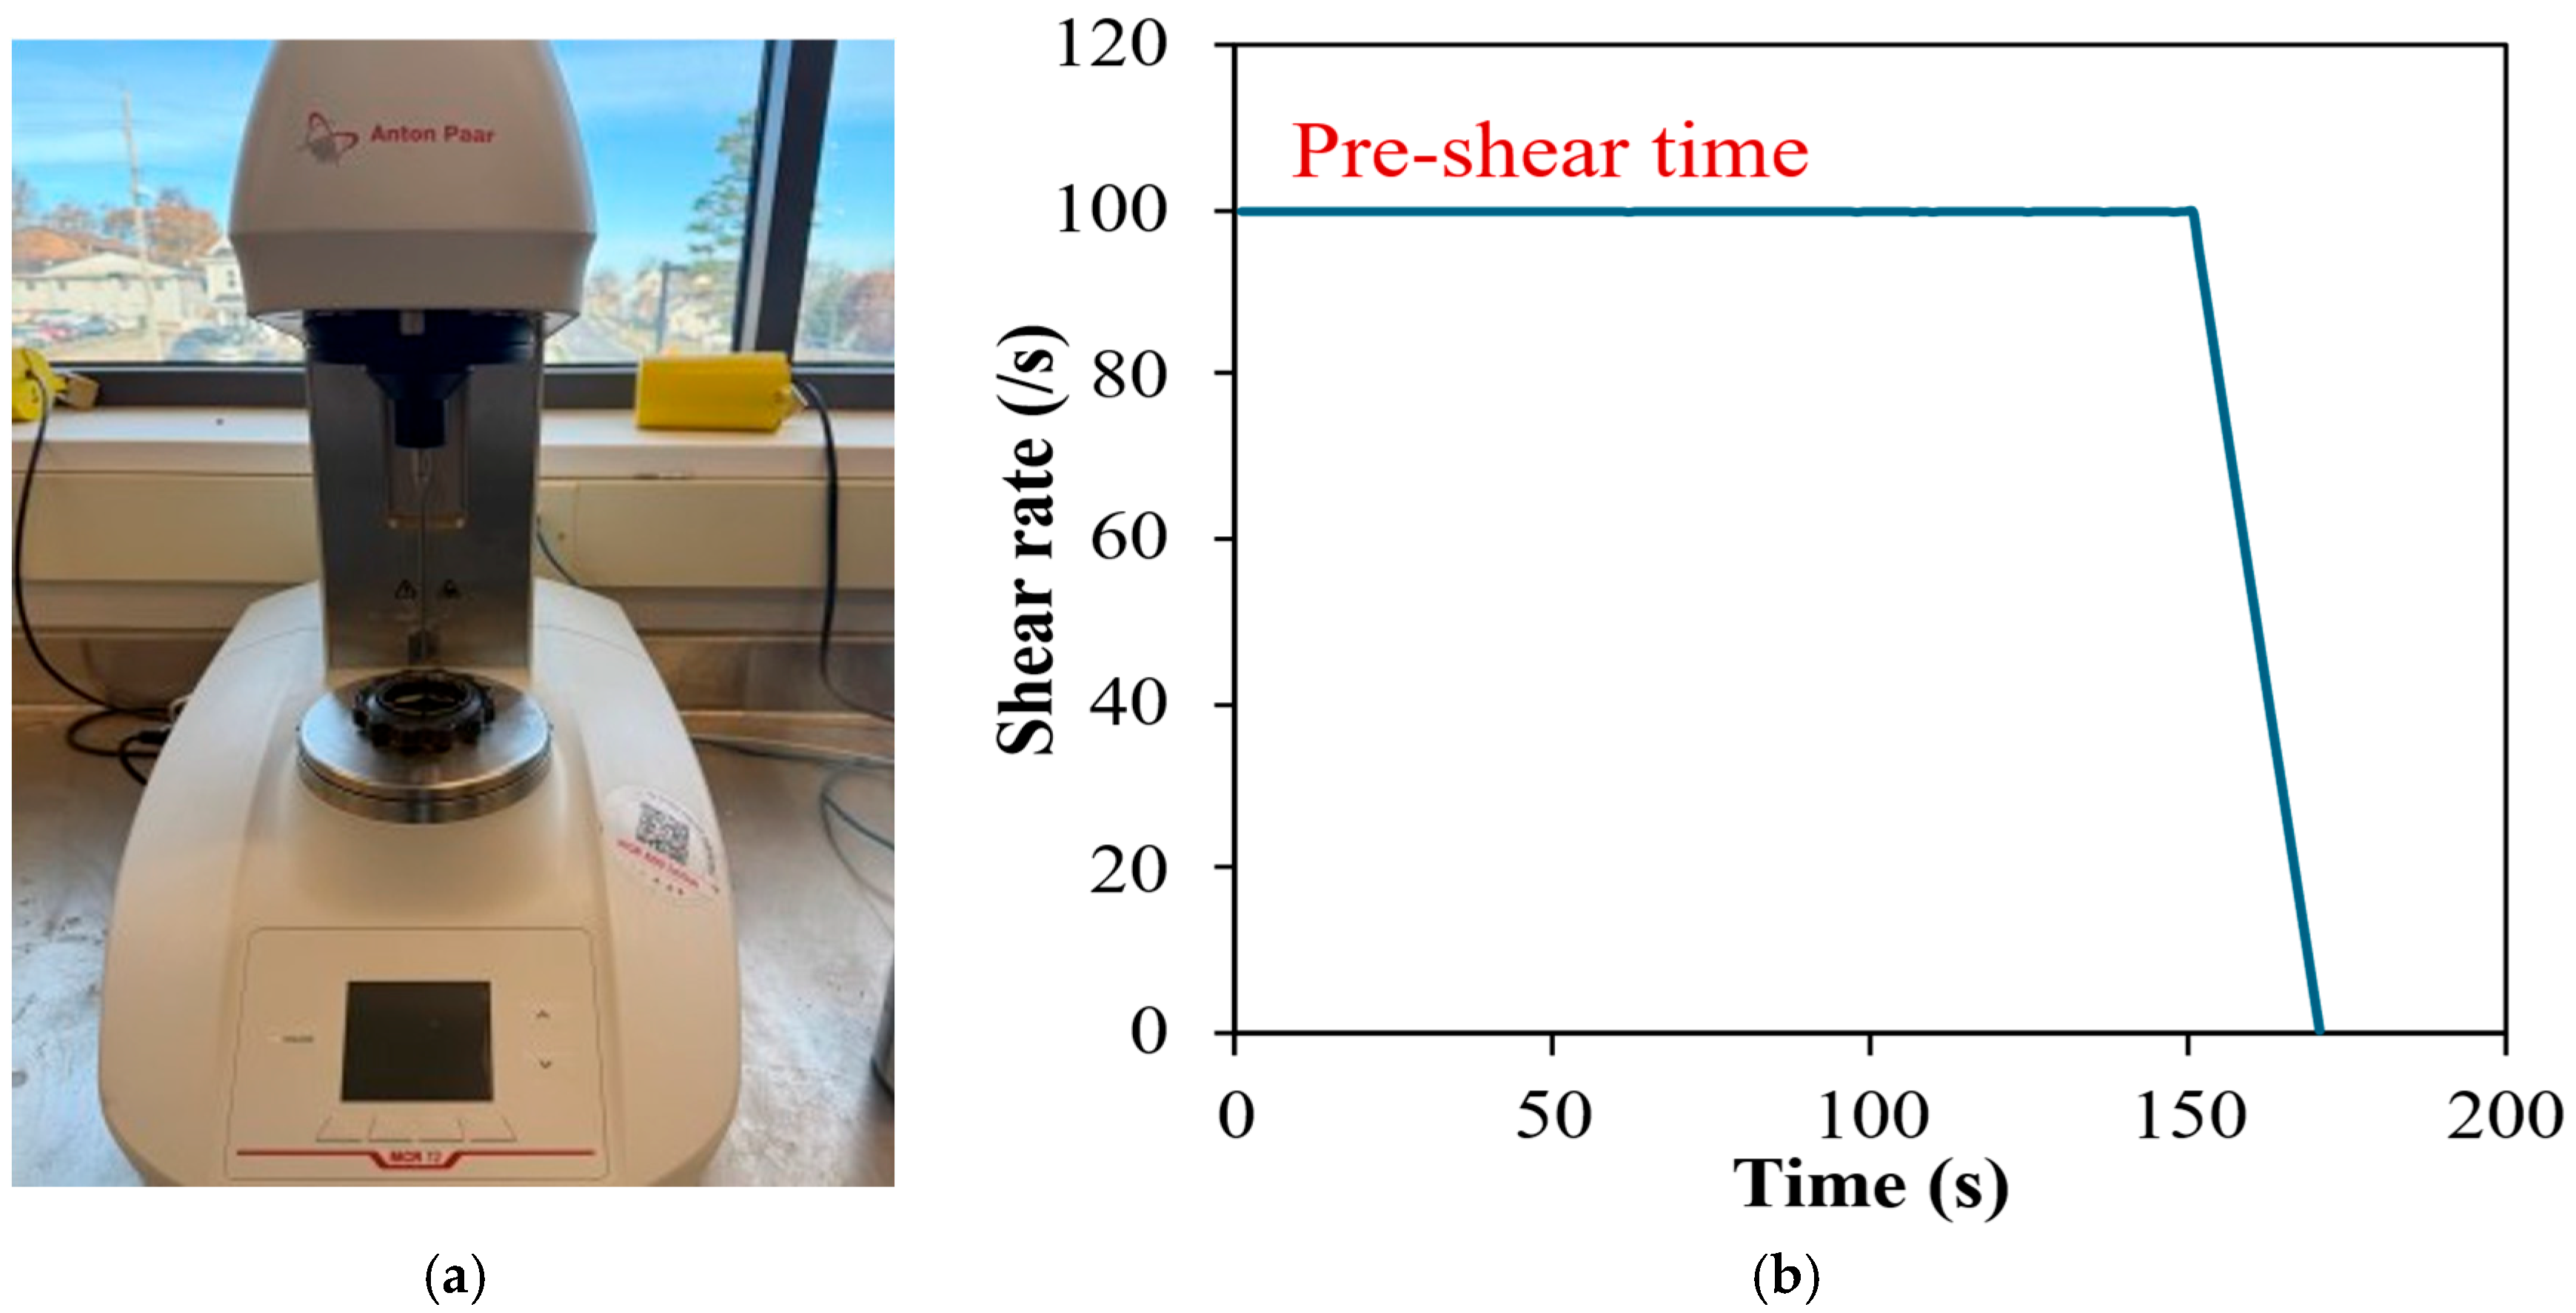
All rheological tests were performed at 23 ± 1 °C to minimize temperature-induced viscosity variation. Rheology testing was performed using an Anton Paar rheometer (Anton Paar Instruments, Houston, TX, USA) with a four bladed vane geometry that had a radius of 13.33 mm and an outer cylinder radius of 14.44 mm, as shown in Figure 2a. The outer cylinder was serrated to prevent slippage [23]. The cement paste mixtures were pre-sheared at a high shear rate of 100/s for 150 s to reduce the effect of the structural build-up at rest during the rheological measurements. The rheological measurements were conducted at a descending shear rate regime of 100/s to 0.1/s in 21 steps, with each step taking 1 s to measure, as illustrated in Figure 2b. This testing protocol was selected to minimize errors, such as plug flow [24]. After equilibrium was achieved during pre-shearing, a short descending shear rate was employed to reduce the segregation that can occur from prolonged rheology testing, which can lead to errors in measurement [24].
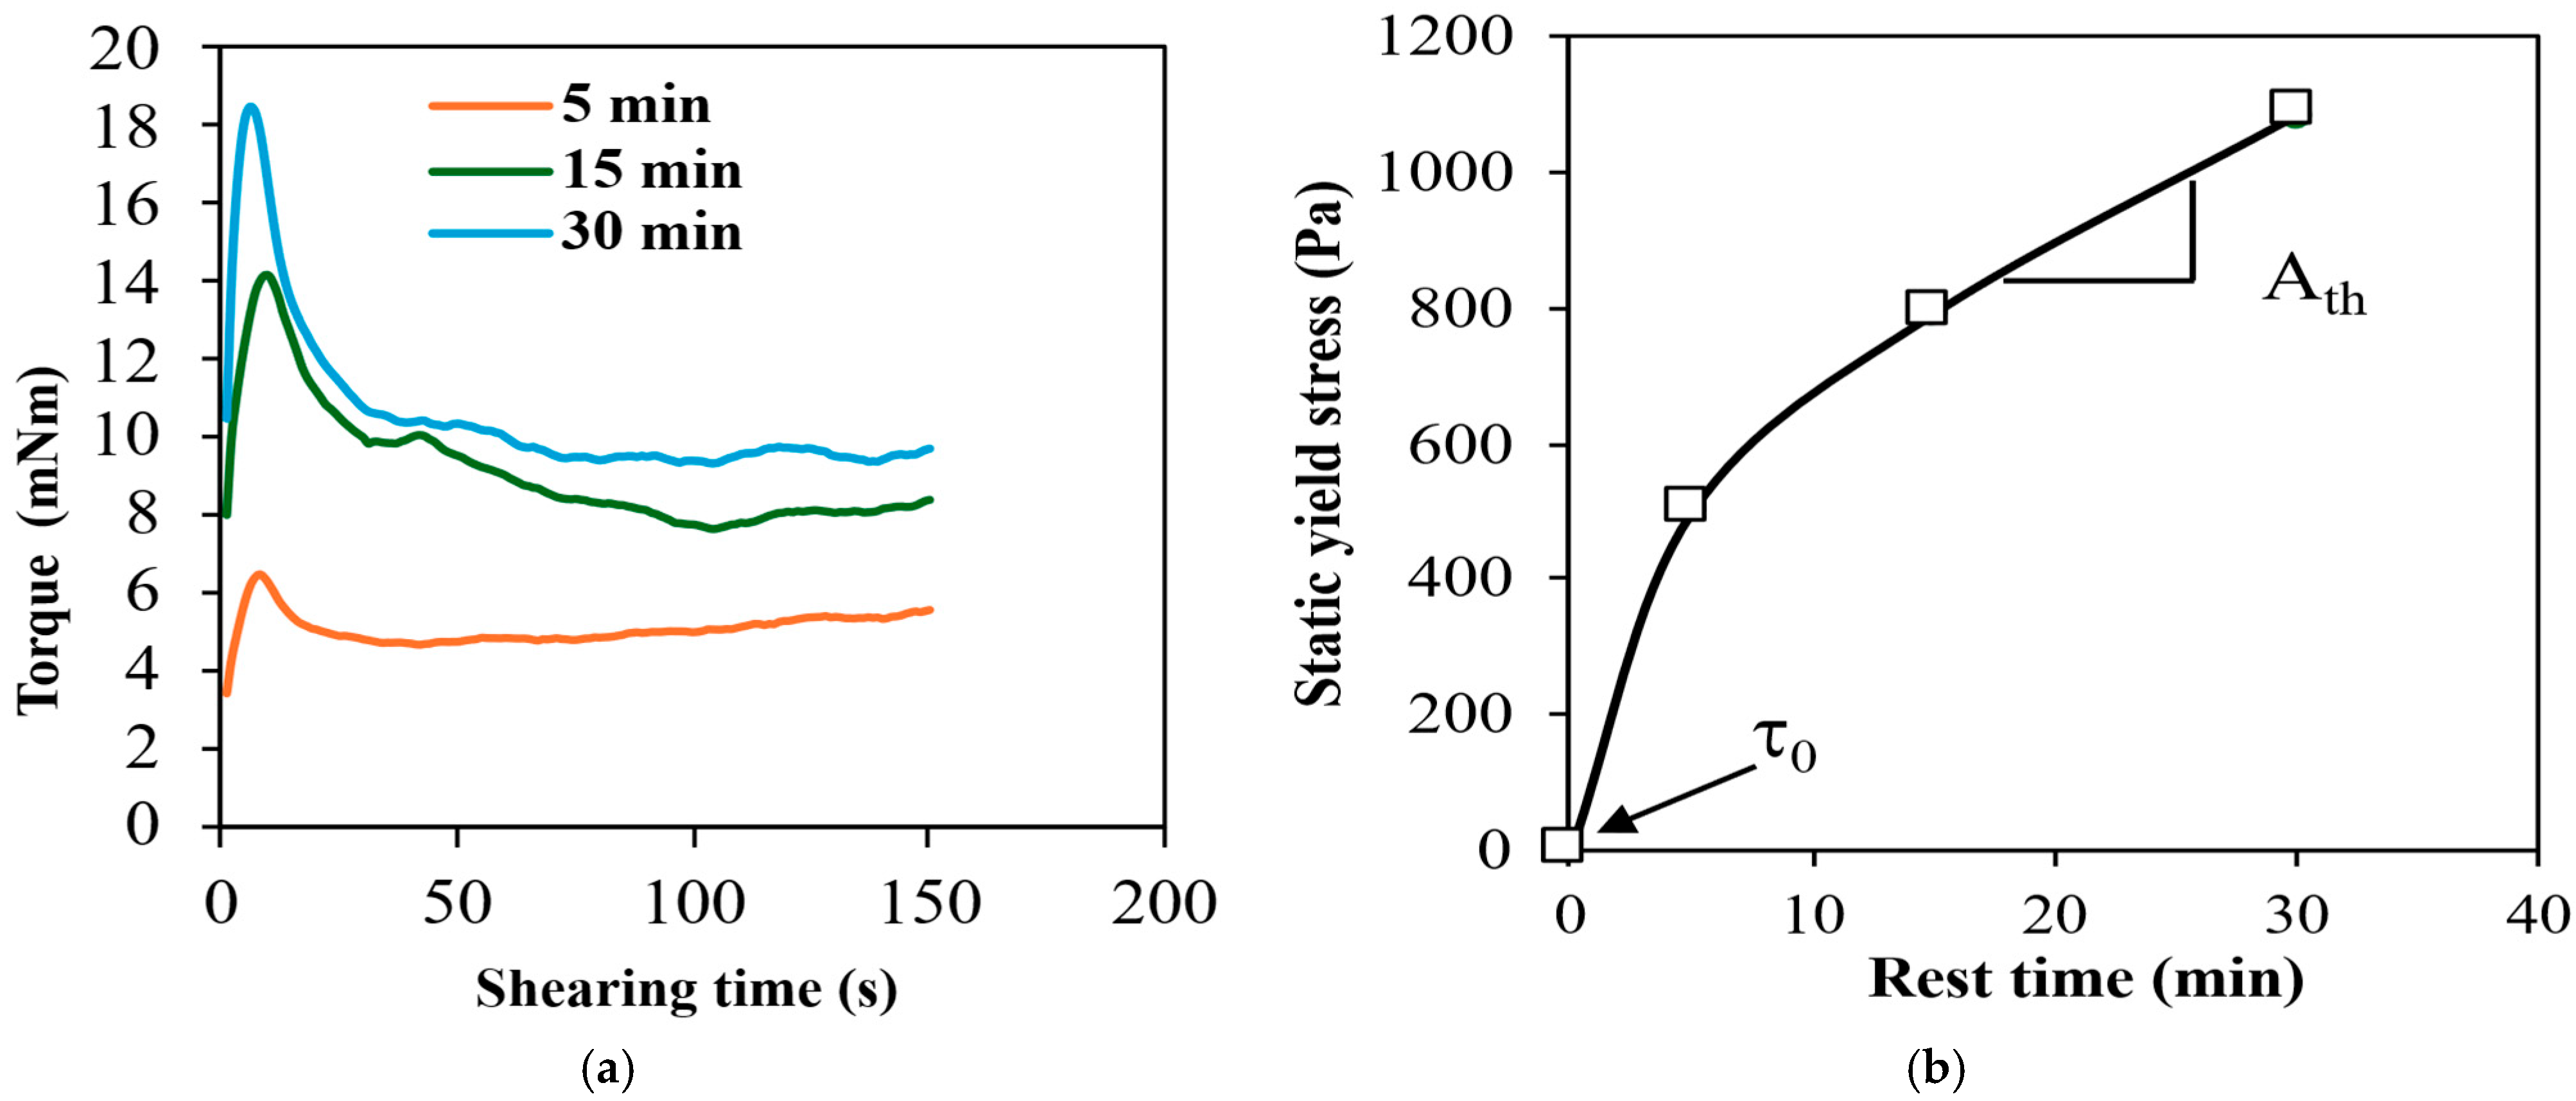
After the dynamic rheology testing, the stress growth protocol was employed to characterize the structural build-up of the cement paste after rest times of 5, 15, and 30 min. A low constant shear rate of 0.05/s was applied to the sample for shear growth testing. A typical measurement of the static yield stress at different rest times is shown in Figure 3a. The measured torque gradually developed to a maximum value and then decayed to an equilibrium value. The peak torque was taken to calculate the static yield stress ( τ s ) [20,25], as shown in Equation (1).
τ s   = T m a x 2 π h R i 2   ,
where Tmax is the peak torque measured, h is the height of the vane, and Ri is the inner radius.
A typical plot of the evolution of τ s   with time for the mixtures investigated is shown in Figure 3b. The τ s   evolved more rapidly in the first 5 min and then increased linearly with rest time. As a result, the nonlinear thixotropic model shown in Equation (2) was employed to characterize the structural build-up in the cement paste. Two thixotropic indices were used to describe the evolution of the static yield stress, where τfloc (Pa) refers to the initial increase in the yield stress due to the particle flocculation in a short time after shearing, and Athix (Pa/min) refers to the slope of linear evolution of static yield stress [21]:
τ s   =   τ 0   +   τ floc   +   A thix t

2.3.3. Rheological Properties of the Binder Paste

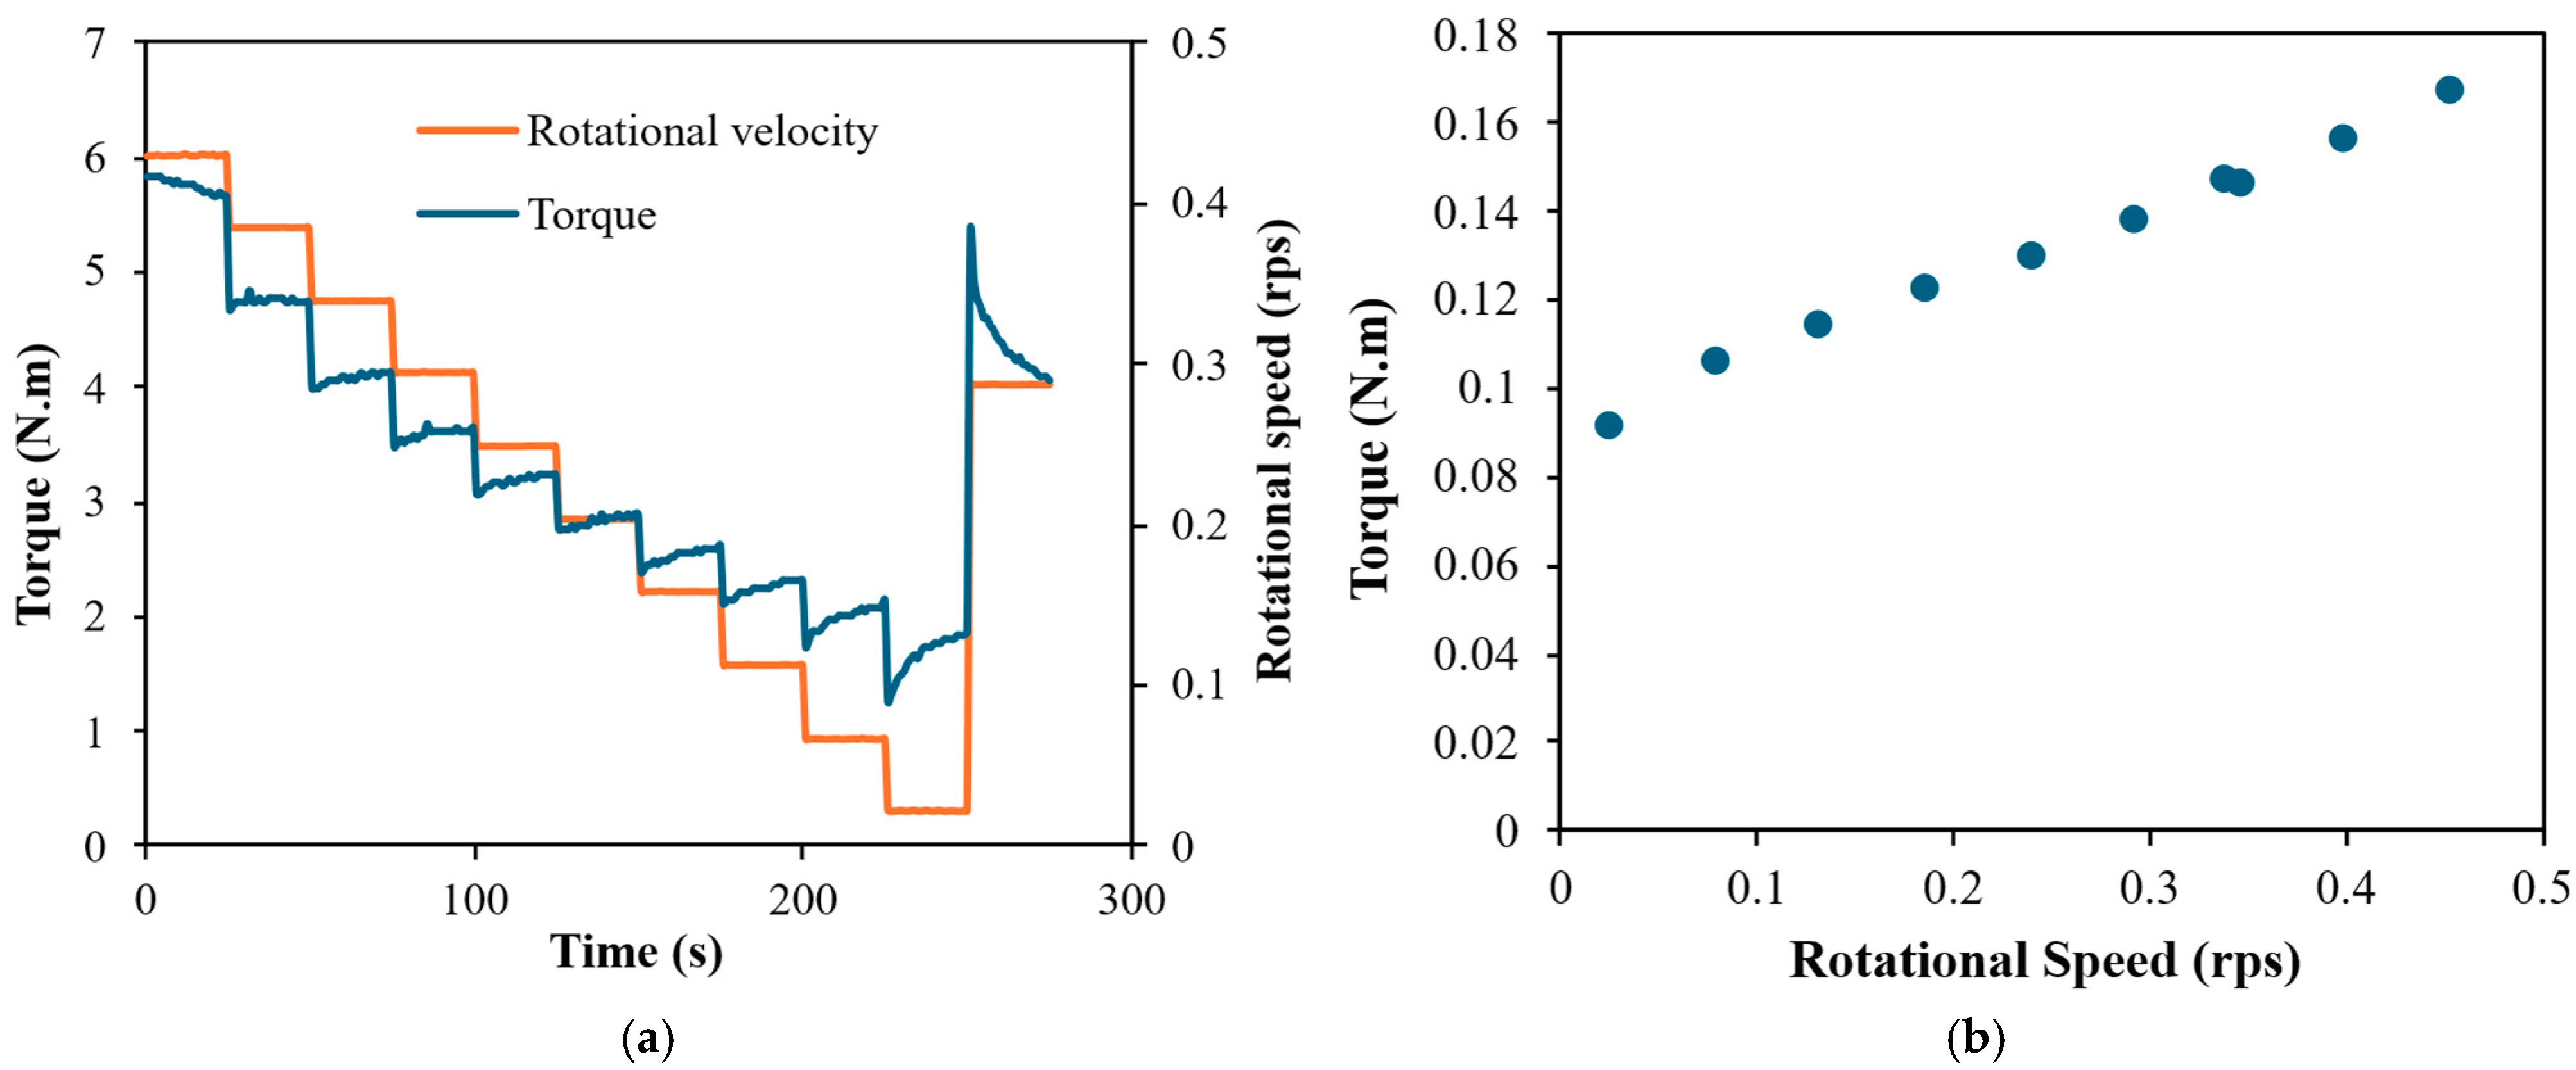
The CONTEC 6 coaxial cylinder rheometer (IBRI Rheocenter, Reykjavik, Iceland) was employed to determine the rheological properties of the investigated binder paste mixtures. The rheometer had an inner and outer radii of 0.05 and 0.06 m, respectively. The paste mixtures were pre-sheared at the maximum rotational velocity of 0.5 rps for 25 s, and this was followed by a reduction in the rotational velocity from 0.5 to 0.025 rps in 10 steps. A typical plot of the registered torque and against the time for the investigated binder paste mixtures is illustrated in Figure 4a. Since the pre-shear was not recorded, the torque against the time relationship was observed and the points that did not achieve equilibrium were eliminated from the analysis [26]. As the rotational speed decreased, shear induced structural build-up was observed. As shown in Figure 4b, no visible phase separation or particle settlement occurred during the rheological measurements. This observation indicates that segregation did not influence the measured flow parameters for the investigated mixtures, which is consistent with previous findings that UHPC systems with optimized particle packing exhibit negligible segregation under shear [27].
The τ s   of the binder paste was evaluated after rest periods of 5, 15, and 30 min, as was performed for the cement paste mixtures. The binder paste mixtures were subjected to a very low rotational velocity of 0.05 rps for 120 s without any pre-shear and the corresponding static yield stress for each rest time. This test procedure has been used previously to evaluate the thixotropy of UHPC [21], and it was thus selected for this study.

2.3.4. Rheological Properties of the Mortar Scale and Fiber-Reinforced Scale (UHPC)

A CONTEC 5 coaxial cylinder rheometer (IBRI Rheocenter, Reykjavik, Iceland), with an inner radius of 0.06 m and an outer radius of 0.08 m, was employed to determine the rheological properties of the mortar mixtures. The CONTEC 5 rheometer was also employed for the UHPC in the same manner, except the inner and outer coaxial cylinder radii were changed to 0.1 and 0.15 m, respectively. This geometry change was necessary to accommodate the incorporation of fibers. The testing procedure that was used with the CONTEC 6 viscometer was also applied for the mortar and UHPC mixtures but using the CONTEC 5 viscometer instead. Each rheological measurement was repeated three times, and the reported values represent the mean, with coefficients of variation below 5%.

2.3.5. Compressive, Flexural, and Tensile Strengths and the Heat of Hydration

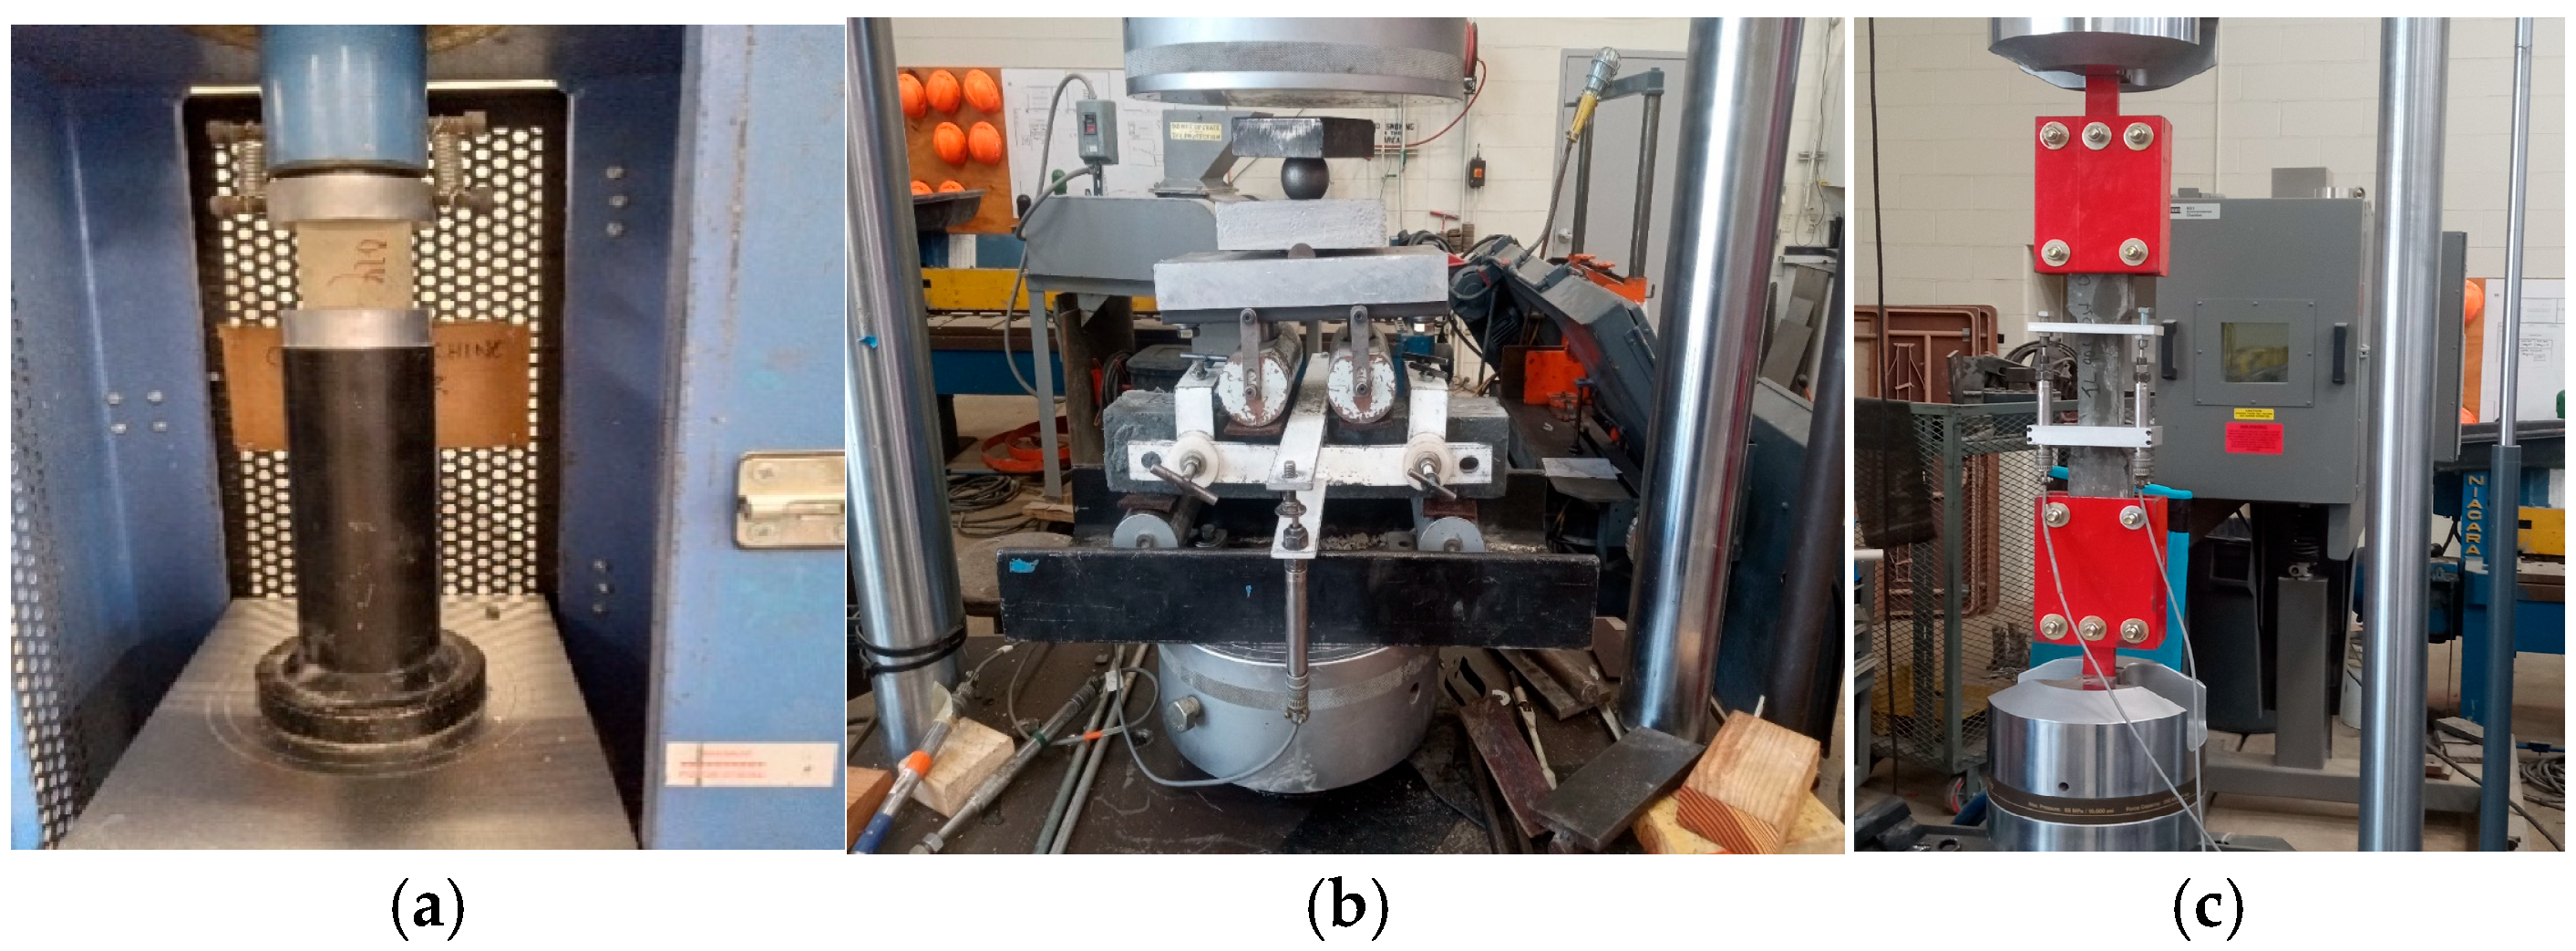
As shown in Figure 5a, compressive strength testing was determined at 3, 7, 28, and 56 days on 50 mm cubic specimens, in accordance with ASTM C109 [28]. The specimens were air cured before testing to assess the UHPC performance in dry environments for field applications, such as 3D concrete printing. The loading rate ranged between 0.35 to 0.70 MPa/s, in accordance with ASTM C109.
As shown in Figure 5b, the flexural properties of the UHPC were evaluated using a four-point bending test, as per ASTM C1609. The test was conducted on beam specimens measuring 76 × 76 × 419 mm at a span of 305 mm. An MTS load frame was used to apply loads at a controlled displacement rate of 1 mm/min. The deflections of the beam specimens were measured by two LVDTs placed on both sides of the specimen. The applied load and mid-span deflection were recorded, and the average values obtained from two specimens are reported.
As shown in Figure 5c, direct tensile testing was conducted using dog bone specimens measuring 25 mm in thickness and 526 mm in length with a narrow neck width and length of 50 and 175 mm, respectively. A Landmark 370 load frame (MTS, MN, USA) with a load capacity of 250 kN was used to carry out the tensile test at a displacement rate of 0.5 mm/min. Each end of the specimen was held by a fixture gripped on the load frame using a ball hinge connection. Extension of the specimen was obtained from two LVDTs attached to the frame over a gage length of 160 mm.
The rate of cement hydration was measured using the I-Cal 8000 isothermal calorimeter (Calmetrix, MA, USA). Paste-scale samples of UHPC were prepared immediately after mixing, and the testing duration was set to 48 h at a temperature of 23 °C.
SEM/EDX analyses were not conducted due to instrumentation constraints; however, prior studies (e.g., Wu et al., 2019 [1]) provide similar microstructural insights that support the interpretations found in this study.
Mechanical and hydration tests were conducted on a selected subset of mixtures to validate the rheology-based observations while minimizing material consumption, as the UHPC and fiber-reinforced UHPC required large batch sizes for specimen preparation.

3. Results and Discussion

3.1. Fresh Properties

The results of the slump flow before and after jolting and the temperature of the cement paste samples after mixing are reported in Table 3. The slump flow before jolting ranged between 150 mm and 200 mm, and the slump flow after jolting ranged between 210 mm and 260 mm. The mixtures made with Type III cement showed a high temperature after mixing compared to the mixtures made with Type 1L cement.
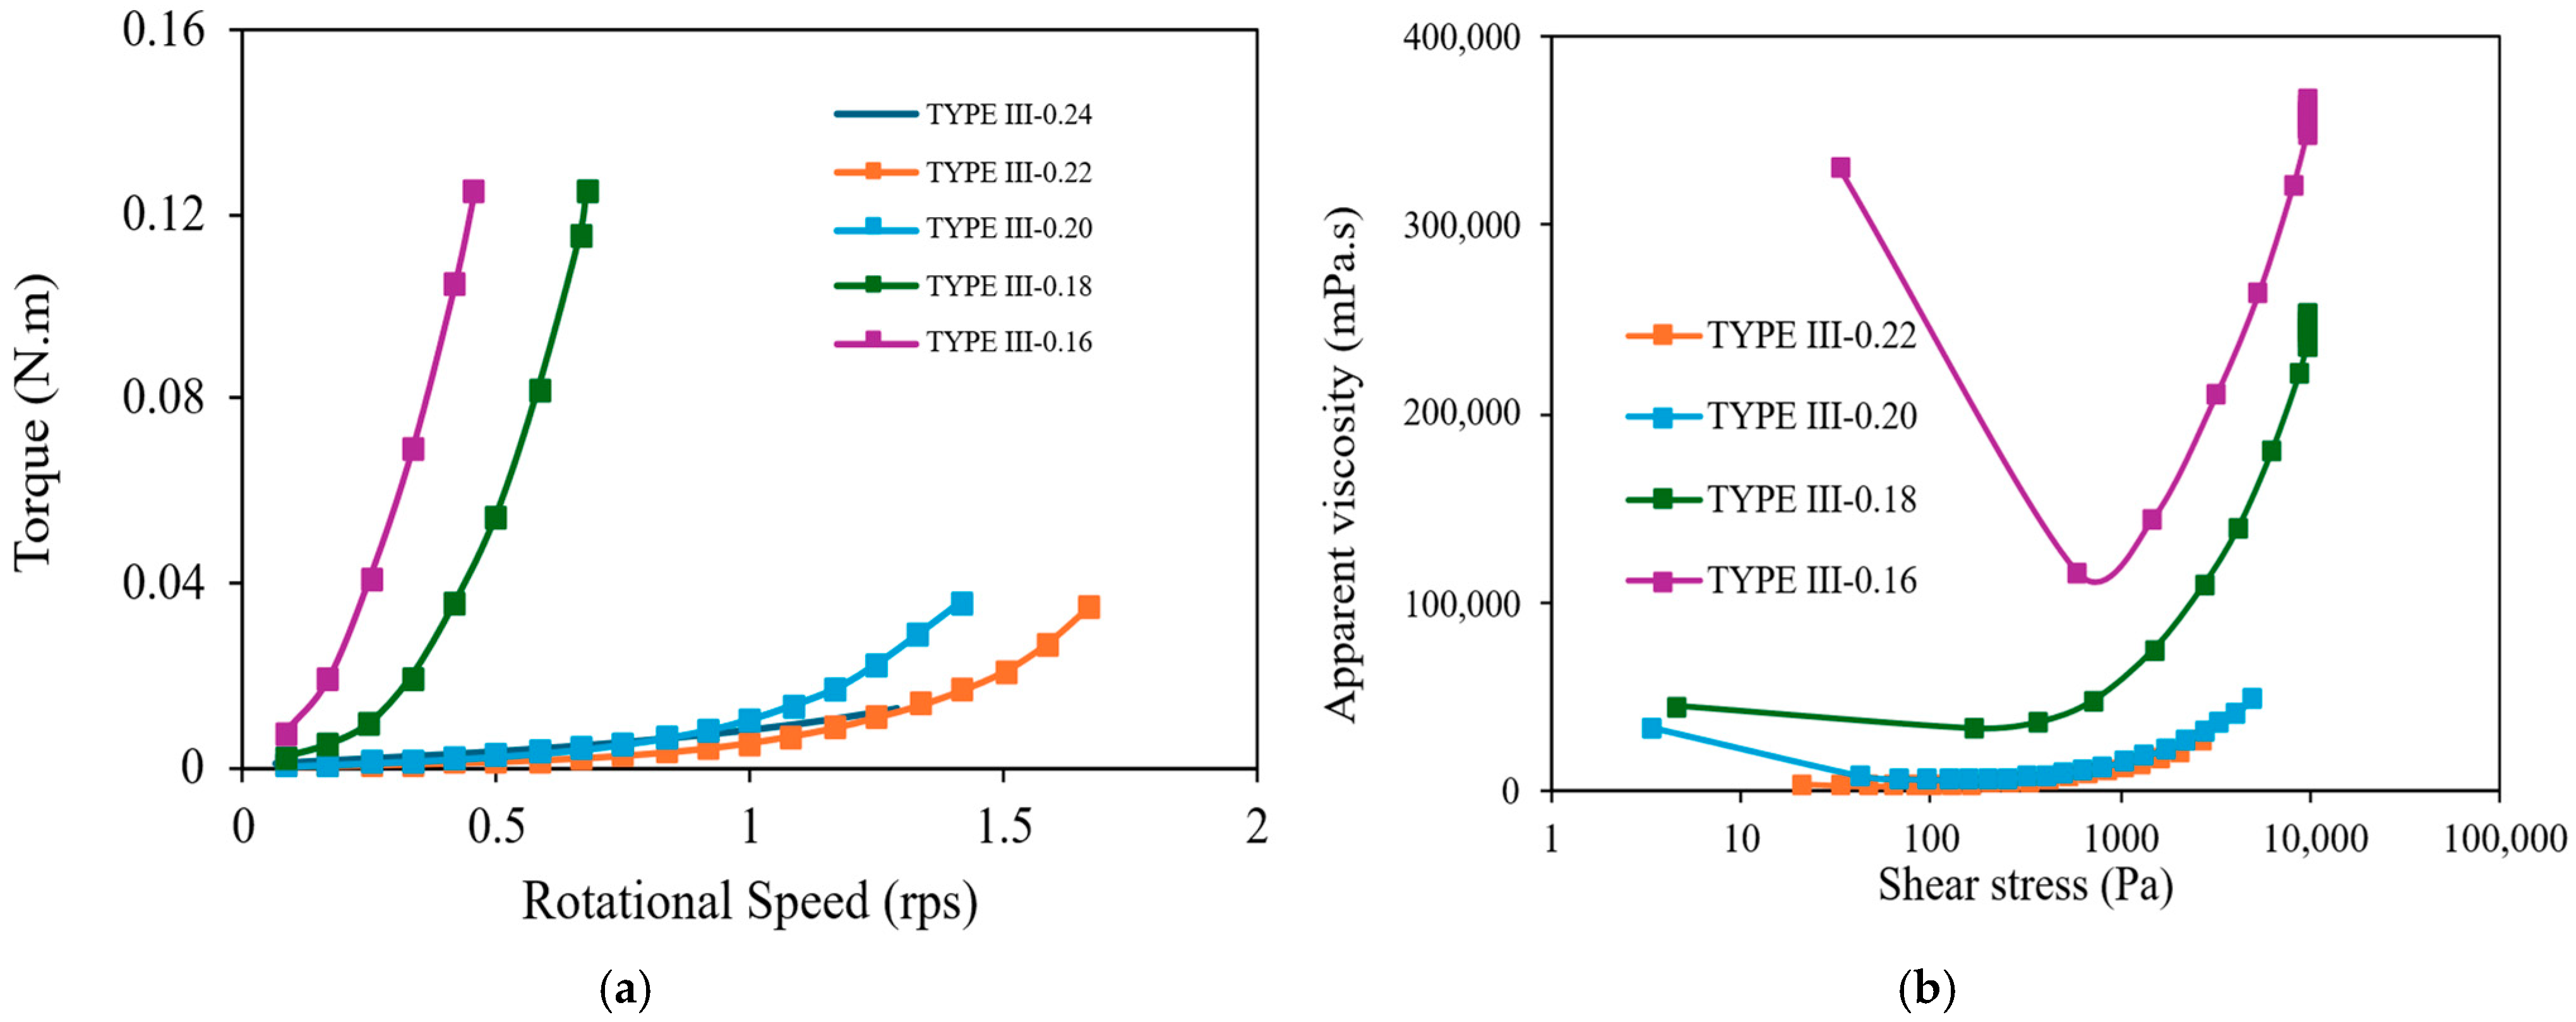
The effect of the w/b on the rheological properties of Type III cement paste are depicted and all the mixtures exhibited shear thickening behavior, as shown in Figure 6. A decrease in the apparent viscosity at low shear stress was followed by an increase in the apparent viscosity at high shear stress, where the onset of shear thickening occurred at a critical shear stress [10]. Above the critical shear stress, hydrodynamic forces overcome the repulsive force, resulting in the formation of clusters that restrict the flow and cause an increase in viscosity [10,29]. The modified Bingham model shown in Equation (3) was selected to describe the rheological behavior due to the non-linearity observed from the results of the measurement [10,27]. Furthermore, compared to the Herschel–Bulkley model, the modified Bingham model can be related to the physical properties of yield stress and viscosity [30]. In the modified Bingham model, T denotes the torque (N m); N denotes the rotational velocity (rps); G and H are the intercept and tangential slope, respectively; and c denotes the second-order term.
T = G + HN + CN2.
The fundamental rheology properties of yield stress, viscosity coefficient, and second-order term (coefficient ‘c’) were estimated using the modified Reiner–Riwlin equations, as shown in Equations (4)–(6) below.
τ o = ( 1 R i 2 1 R 0 2 ) 4 π h l n ( R o R i ) G ,
µ = ( 1 R i 2 1 R 0 2 ) 8 π 2 h H ,
C = ( 1 R i 2 1 R o 2 ) ( R o R i ) 8 π 3 h ( R o + R i ) C ,
where τ0 denotes the yield stress, µ denotes the viscosity coefficient, and c denotes the second-order term. The results of the dynamic rheology are summarized in Table 4. The low yield stress values can be explained by the presence of the SP [31]. The quantity c/µ reflects the degree of shear thickening. Generally, as the w/b decreased, the degree of shear thickening increased. The cluster formation theory is one of the accepted theories that best explains the shear thickening behavior observed in the low w/b paste mixtures, and the increase in degree of shear thickening with the decrease in w/b is consistent with this theory. It was also observed that mixtures prepared with Type III cement experienced a higher degree of shear thickening compared to the mixtures prepared with Type 1L cement, as illustrated in Figure 7a. This was reflected in the average increase of 500% in the second-order term of mixtures prepared with Type III cement compared to the mixtures prepared with Type 1L cement. Relationships were established between the w/b, SP dosage, and degree of shear thickening to elucidate the influence of these mixture parameters on the shear thickening behavior. It was observed that the intensity of shear thickening increased with a decrease in the w/c, as shown in Figure 7b and reported in [10]. This can be attributed to the increase in solid volume fraction that occurs due to the reduction in water content, relative to the maximum volume in the cement paste, which is consistent with the cluster formation theory.
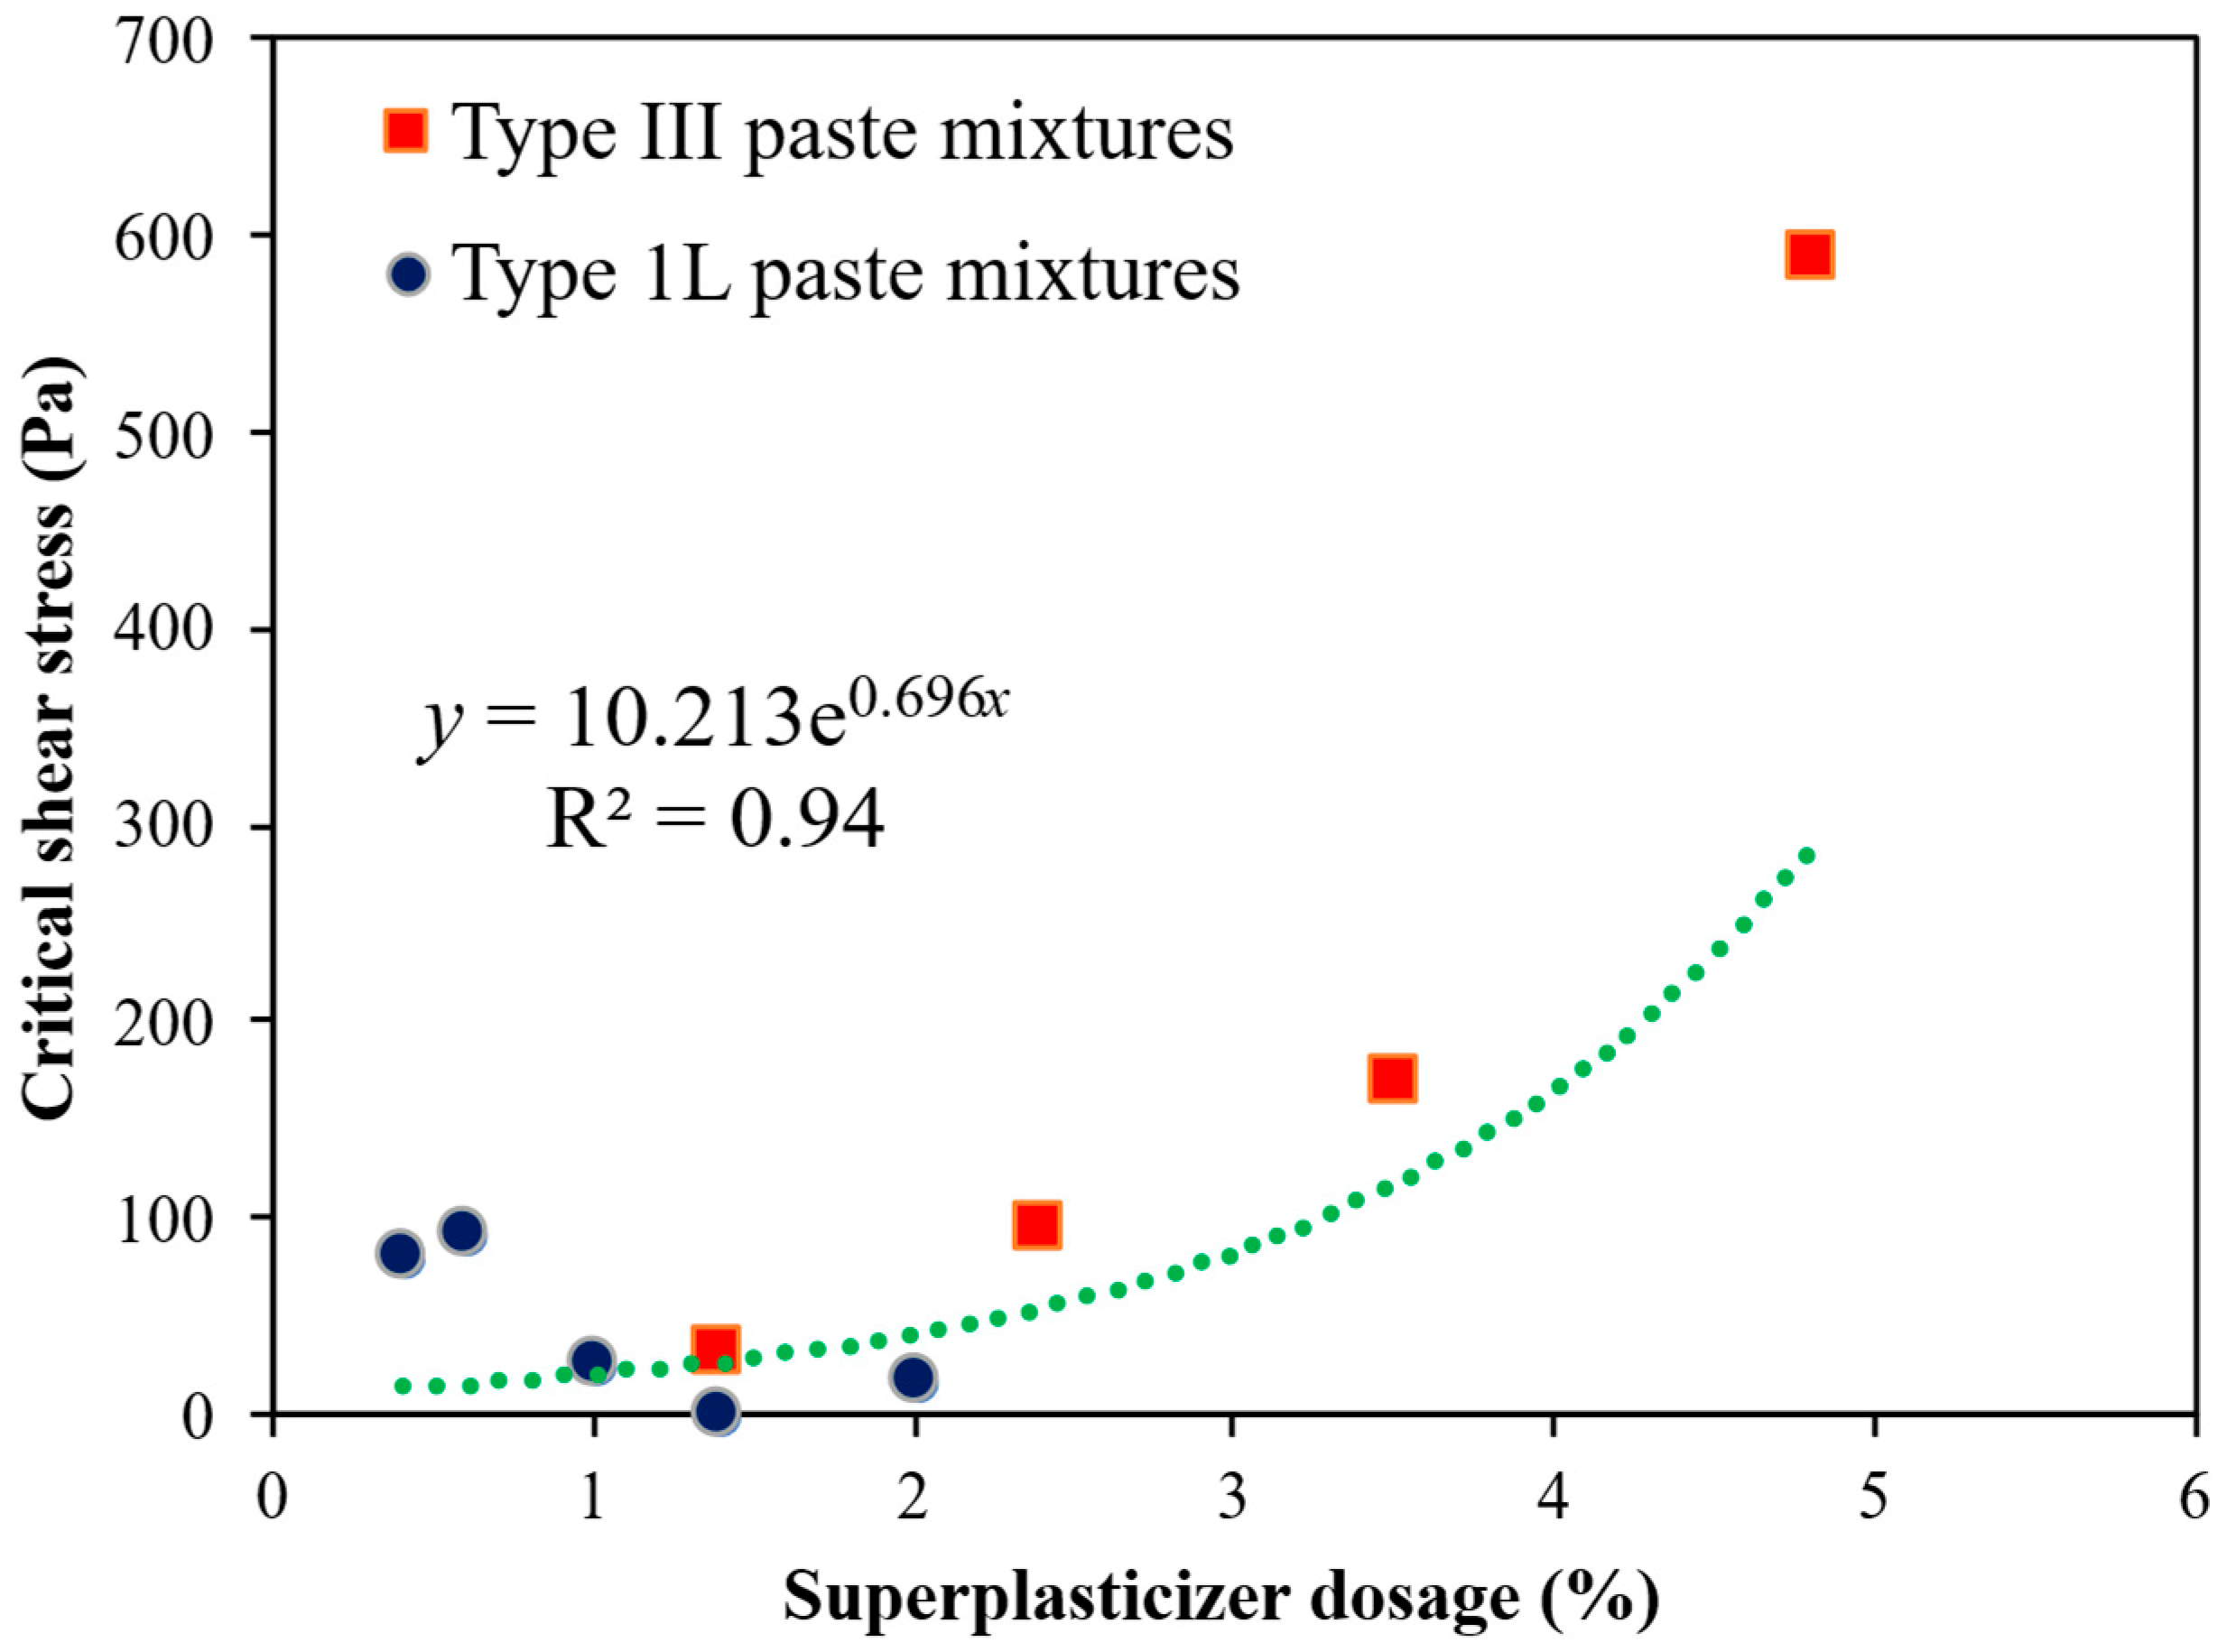
As shown in Figure 8, an increase in SP dosage led to an exponential increase in the critical shear stress of the mixtures. Similar findings have been reported in previous studies [10,32], where this behavior has been attributed to the increased dispersion of solid particles at higher SP dosages. Improved dispersion reduces inter-particle friction and contributes to high critical shear stress.

3.2. Limitation of the Modified Bingham Model

As illustrated in Figure 9, it was observed that, with an increasing degree of shear thickening, the deviation between the modified Bingham model (represented by the dashed lines) and the experimental flow curves (represented by the points) became more pronounced. The degree of deviation between the modified Bingham model predictions and the experimental results was quantified using the sum of error squared (R2), as summarized in Table 5. A consistent trend was observed—R2 increased as the extent of shear thickening increased, reflecting a progressively poorer model fit. This suggests that the modified Bingham model becomes increasingly inaccurate for systems where particle–particle hydrodynamic interactions dominate under high shear. While the modified Bingham model was used for consistency (τ0, μ) across the paste, mortar, and UHPC, it was noted that viscoplastic models—particularly the Herschel–Bulkley (HB, τ = τ 0 + k   γ ˙ n ) model—can better represent the observed curvature at higher shear (with n > 1   indicating shear thickening).

3.3. Effect of Cement Type and w/b on the Thixotropy of the Cement Paste

The effect of cement type and w/b on the thixotropy of paste are presented in Table 6. A decrease in the w/b led to lower thixotropy, which can be attributed to the increased SP dosage required to maintain the target slump flow of 150 to 200 mm. Furthermore, using Type 1L cement resulted in a lower thixotropy than that for Type III because of accelerated hydration of the later cement, which was illustrated later in the isothermal calorimetry test.

3.4. Effect of SL and SF on the Rheology of the Binder Paste Mixtures

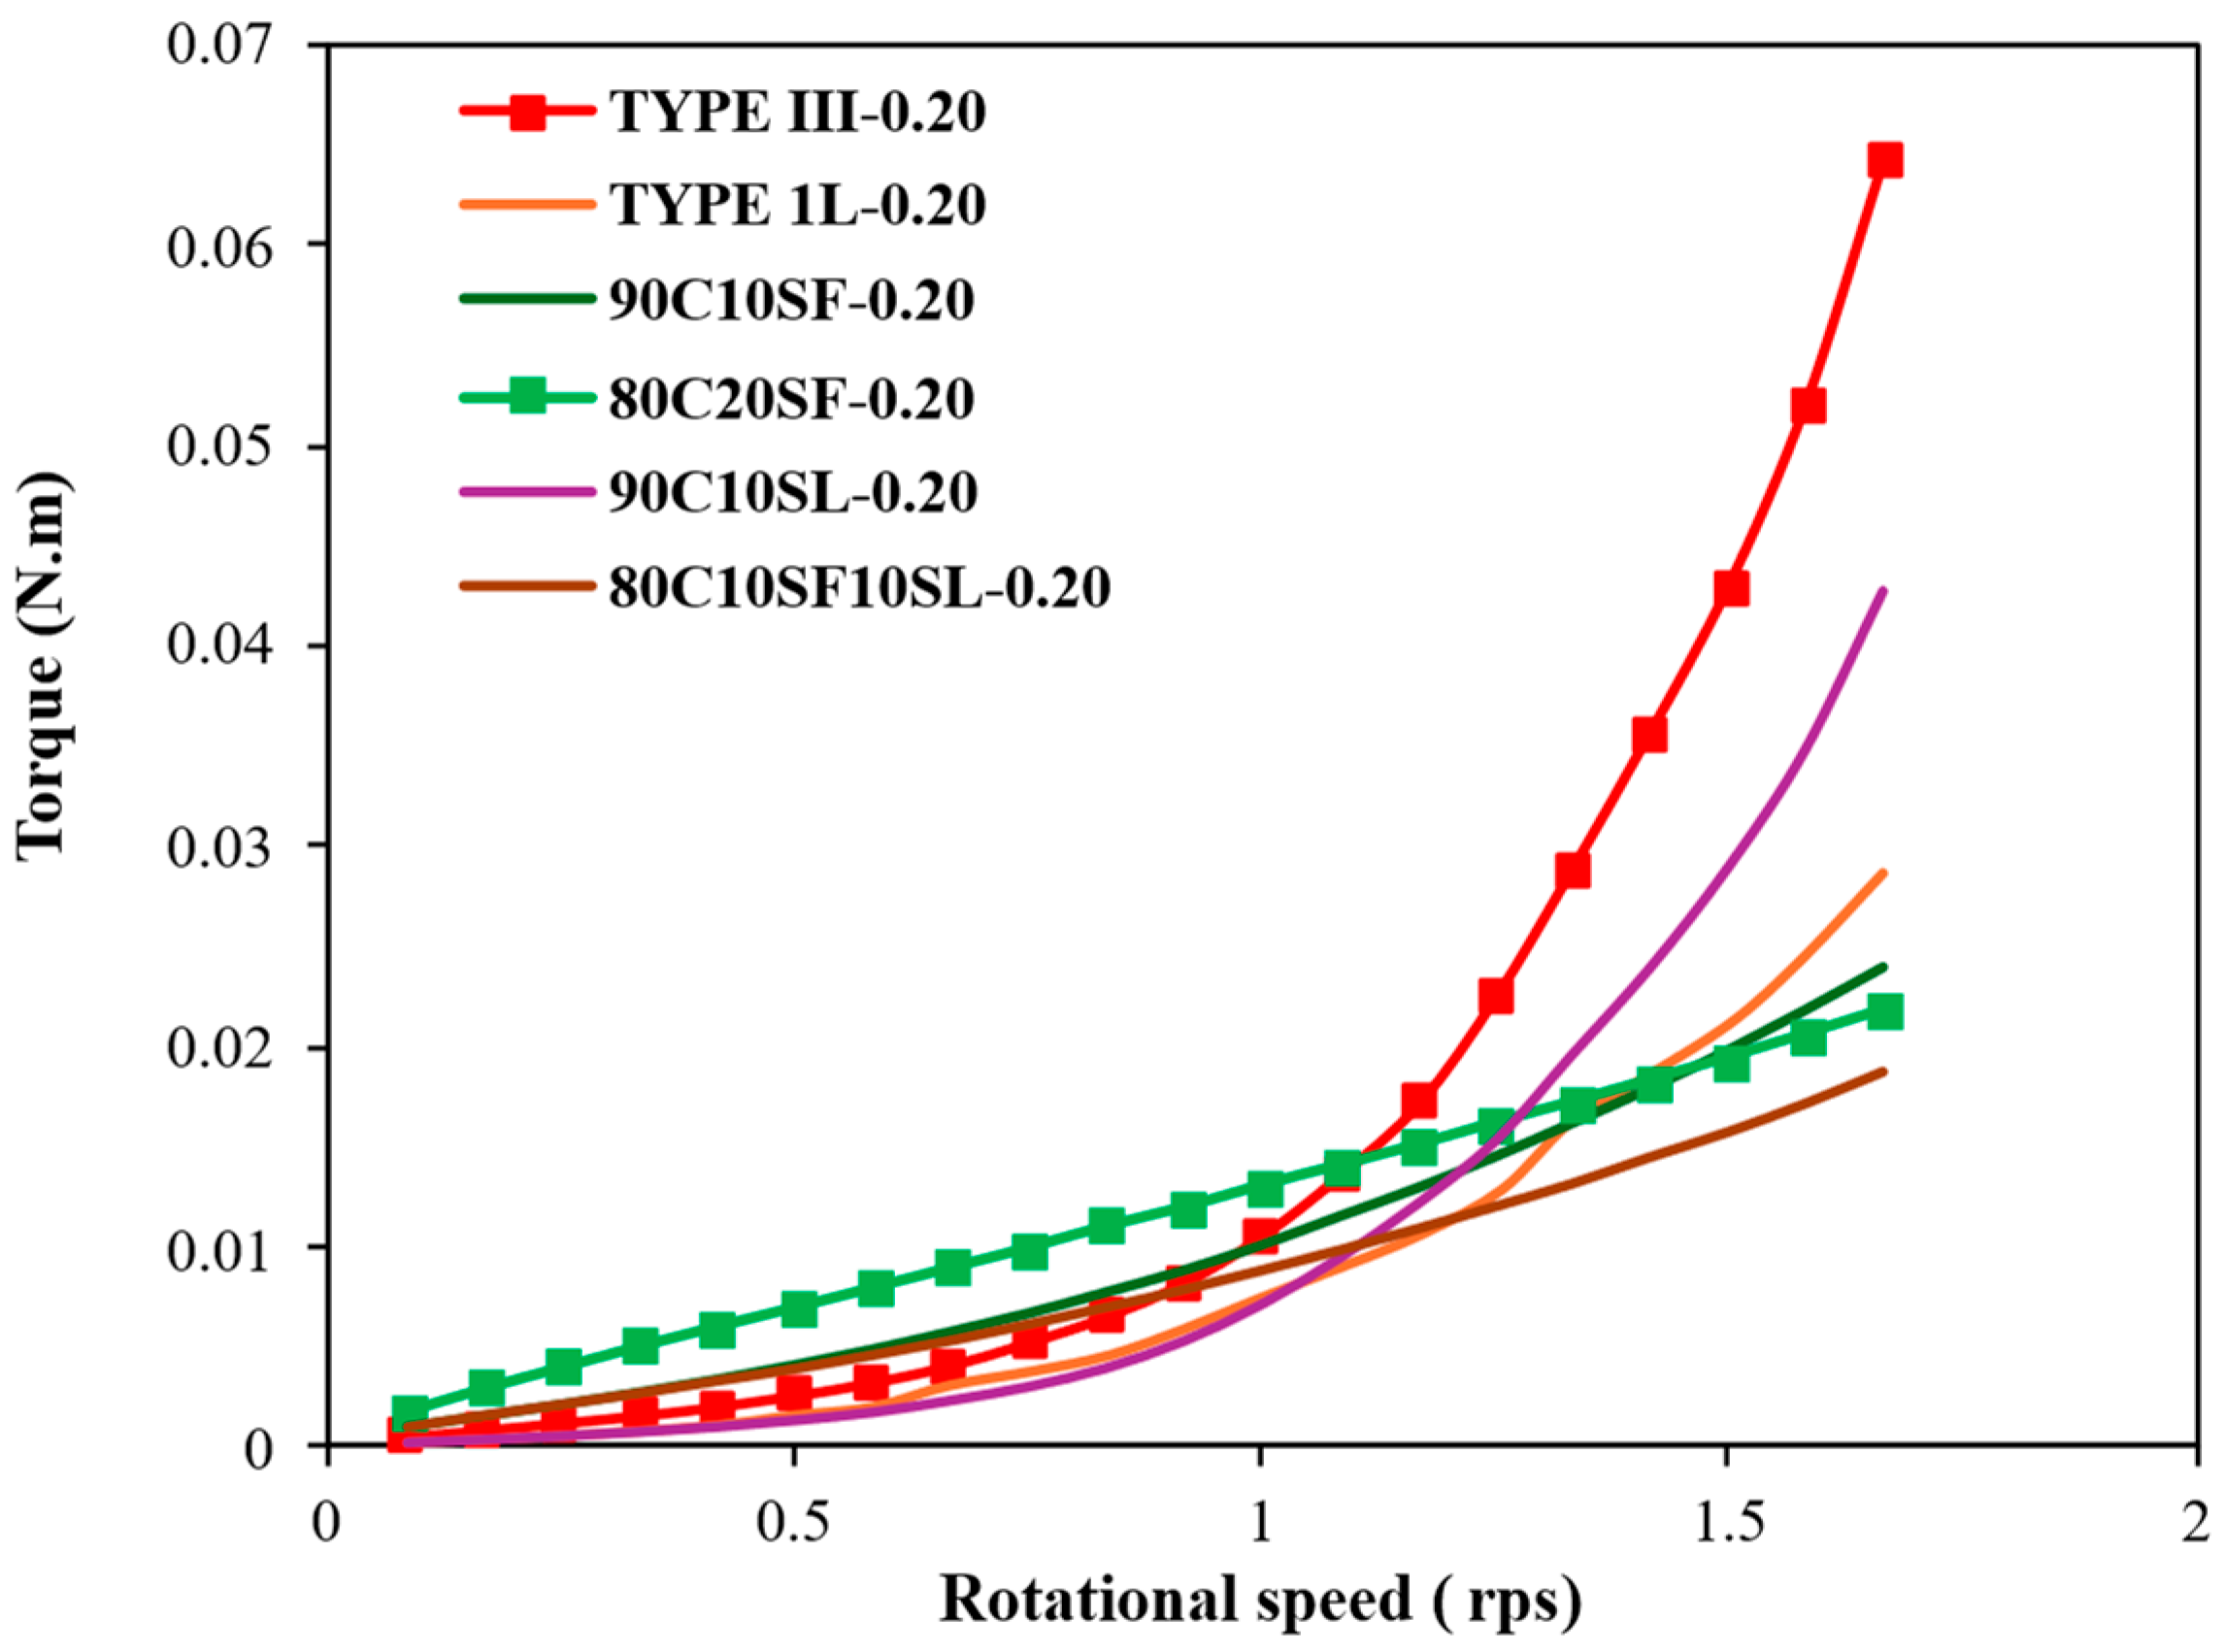
The flow curves of mixtures prepared with SL and SF at different substitution levels and those with only cement were compared, as shown in Figure 10. The partial substitution of cement with SF reduced the degree of shear thickening. This is attributed to the increase in maximum volume fraction through the introduction of particles of different sizes [10].
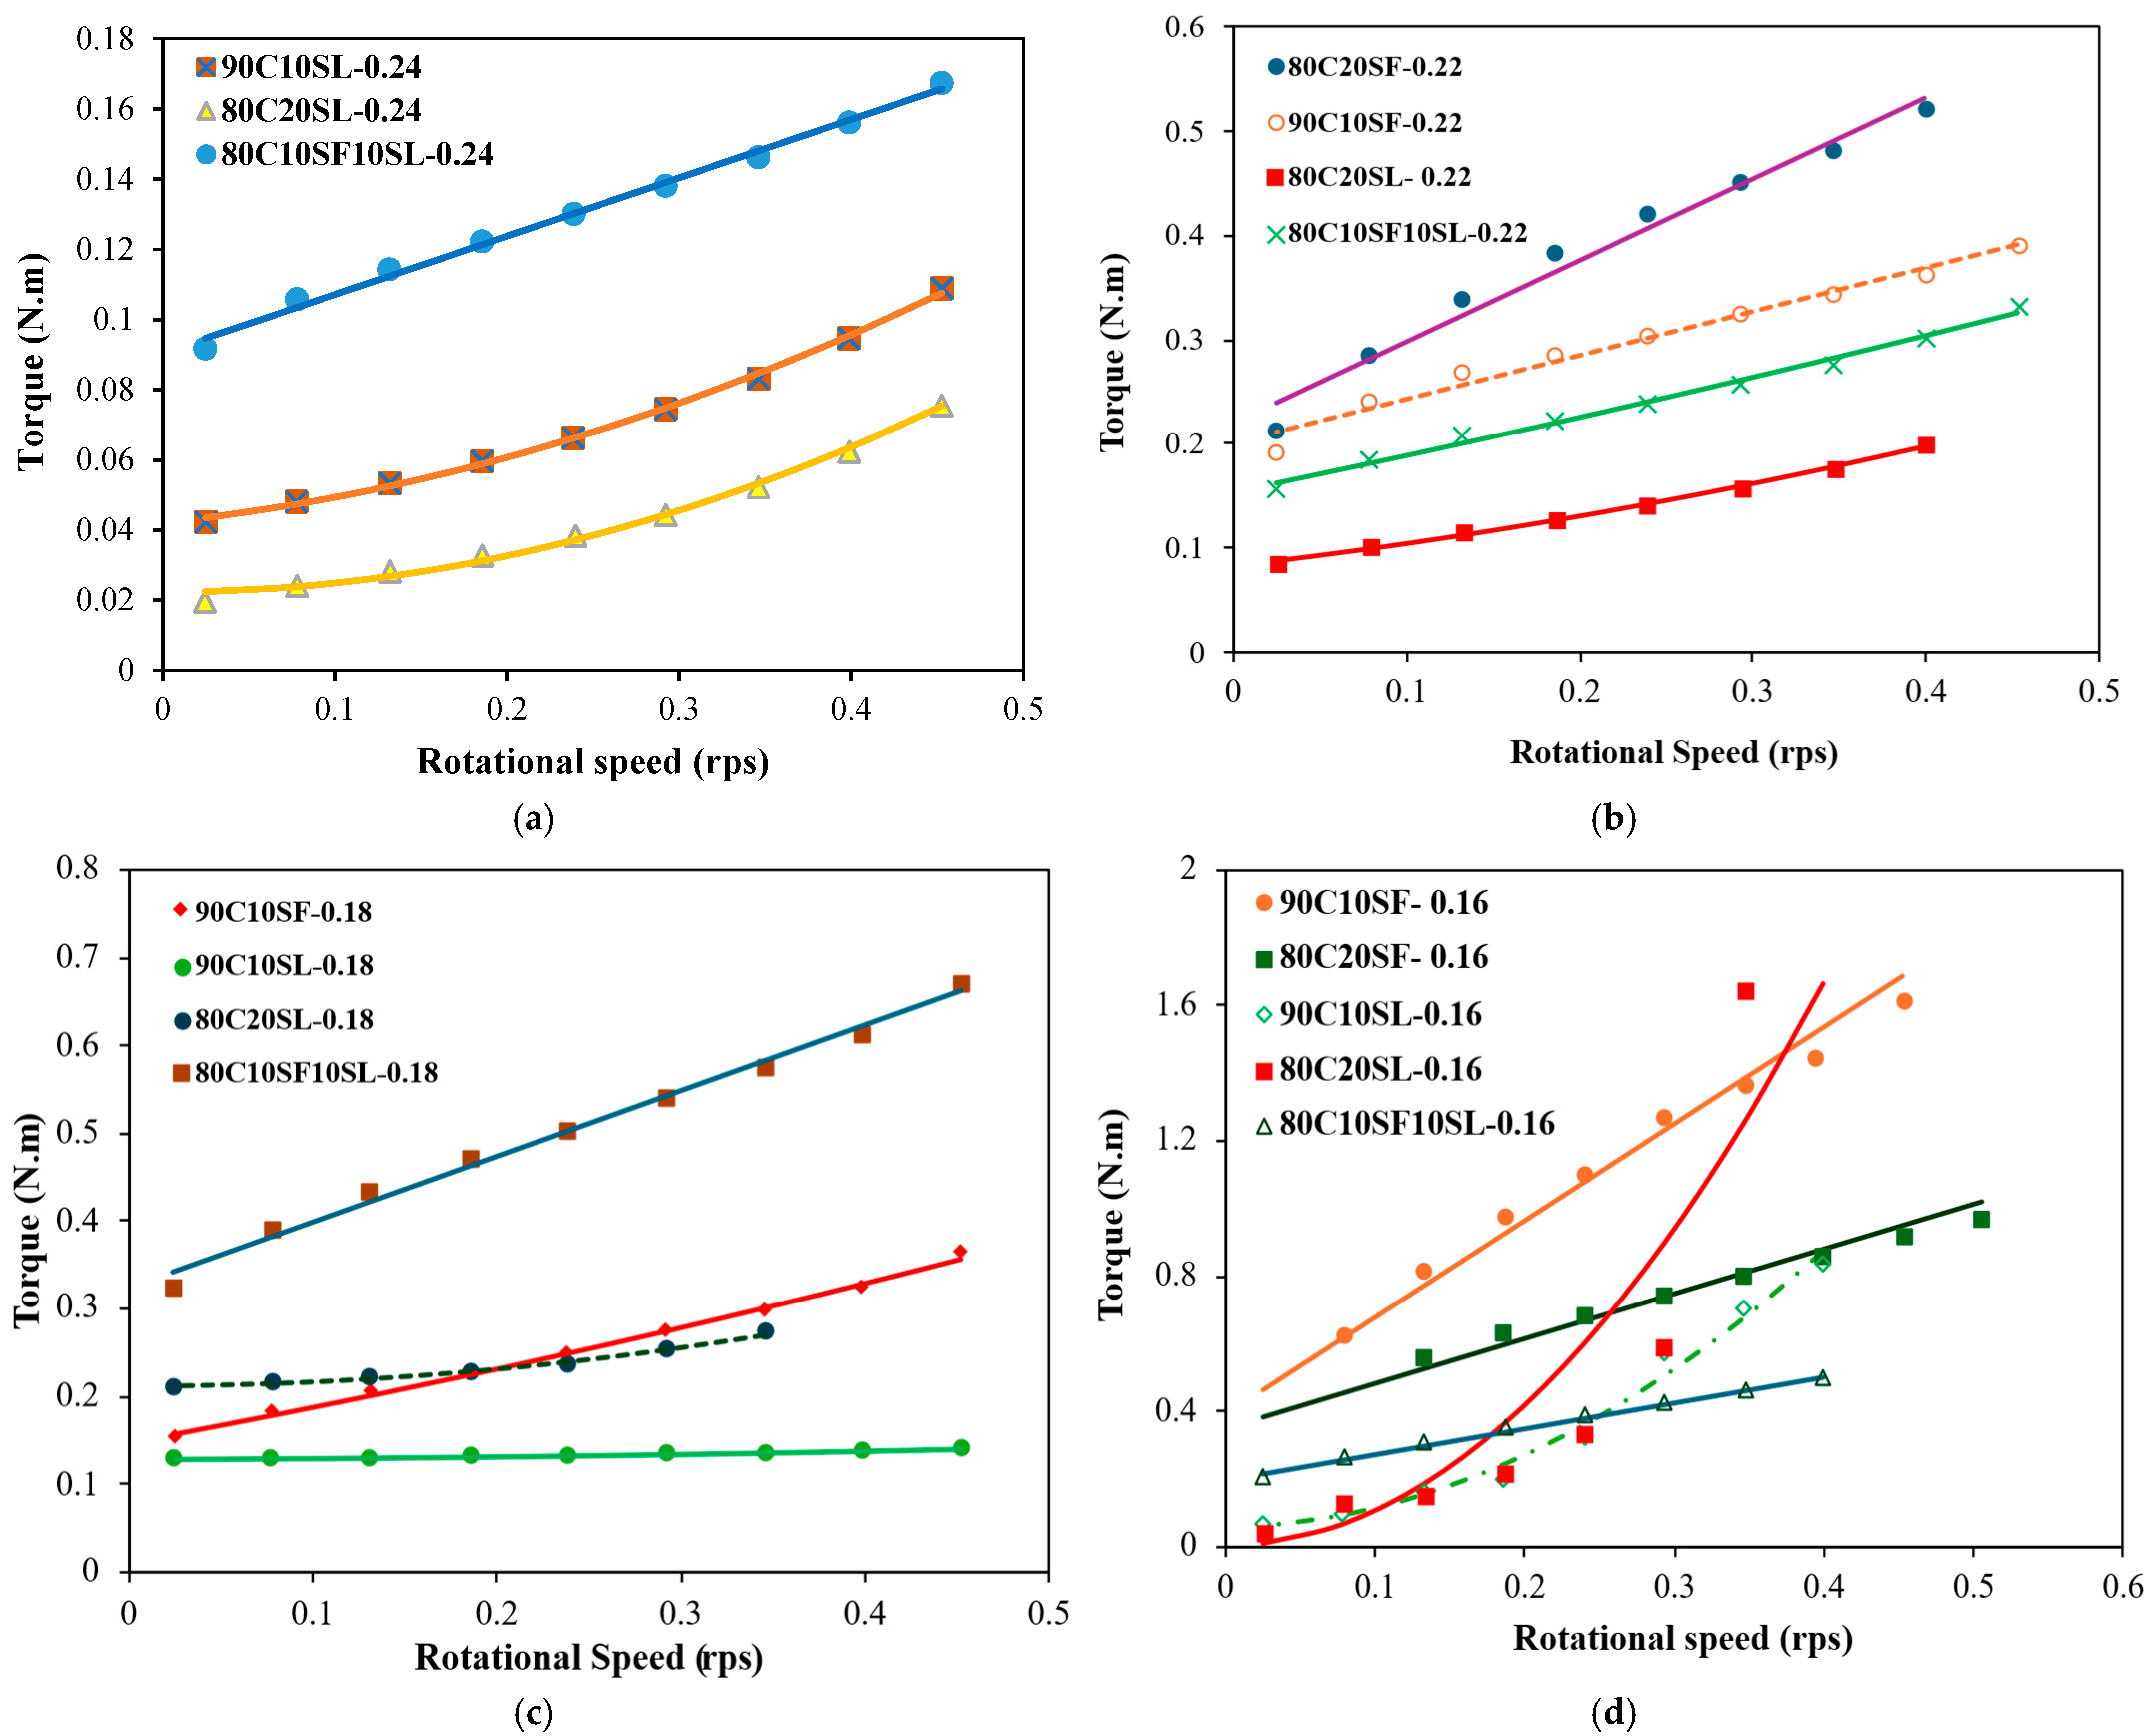
Additionally, the effect of the binder type on the dynamic rheological properties of binder pastes prepared with a w/b of 0.24, 0.22, 0.18 and 0.16 are shown in Figure 11. The flow curves were fitted using the modified Bingham model, and the values of the modified Bingham model parameters for the investigated binder paste mixtures are reported in Table 7. The results indicate that the mixtures prepared with SL exhibited shear thickening, whereas the incorporation of SF reduced the intensity of the shear thickening. For example, the 90C10SL and 80C20SL mixtures prepared with a w/b of 0.24 had second-order terms of 0.24 and 0.30, respectively. However, the inclusion of SF in the 80C10SF10SL mixture transformed the mixture to a Bingham fluid with a second-order parameter of 0. This trend was observed across the range of the investigated w/b and is in accordance with the results reported in the literature [5]. Furthermore, for the paste mixtures prepared with a w/b of 0.22, the increase in SF content from 10% to 20% resulted in an 80% increase in viscosity. On the other hand, for the paste mixtures prepared with a w/b of 0.16, the increase in SF content resulted in a decrease in viscosity from 79 to 34 Pa·s.

3.5. Rheological Properties of the High-Strength Mortar and UHPC Mixtures

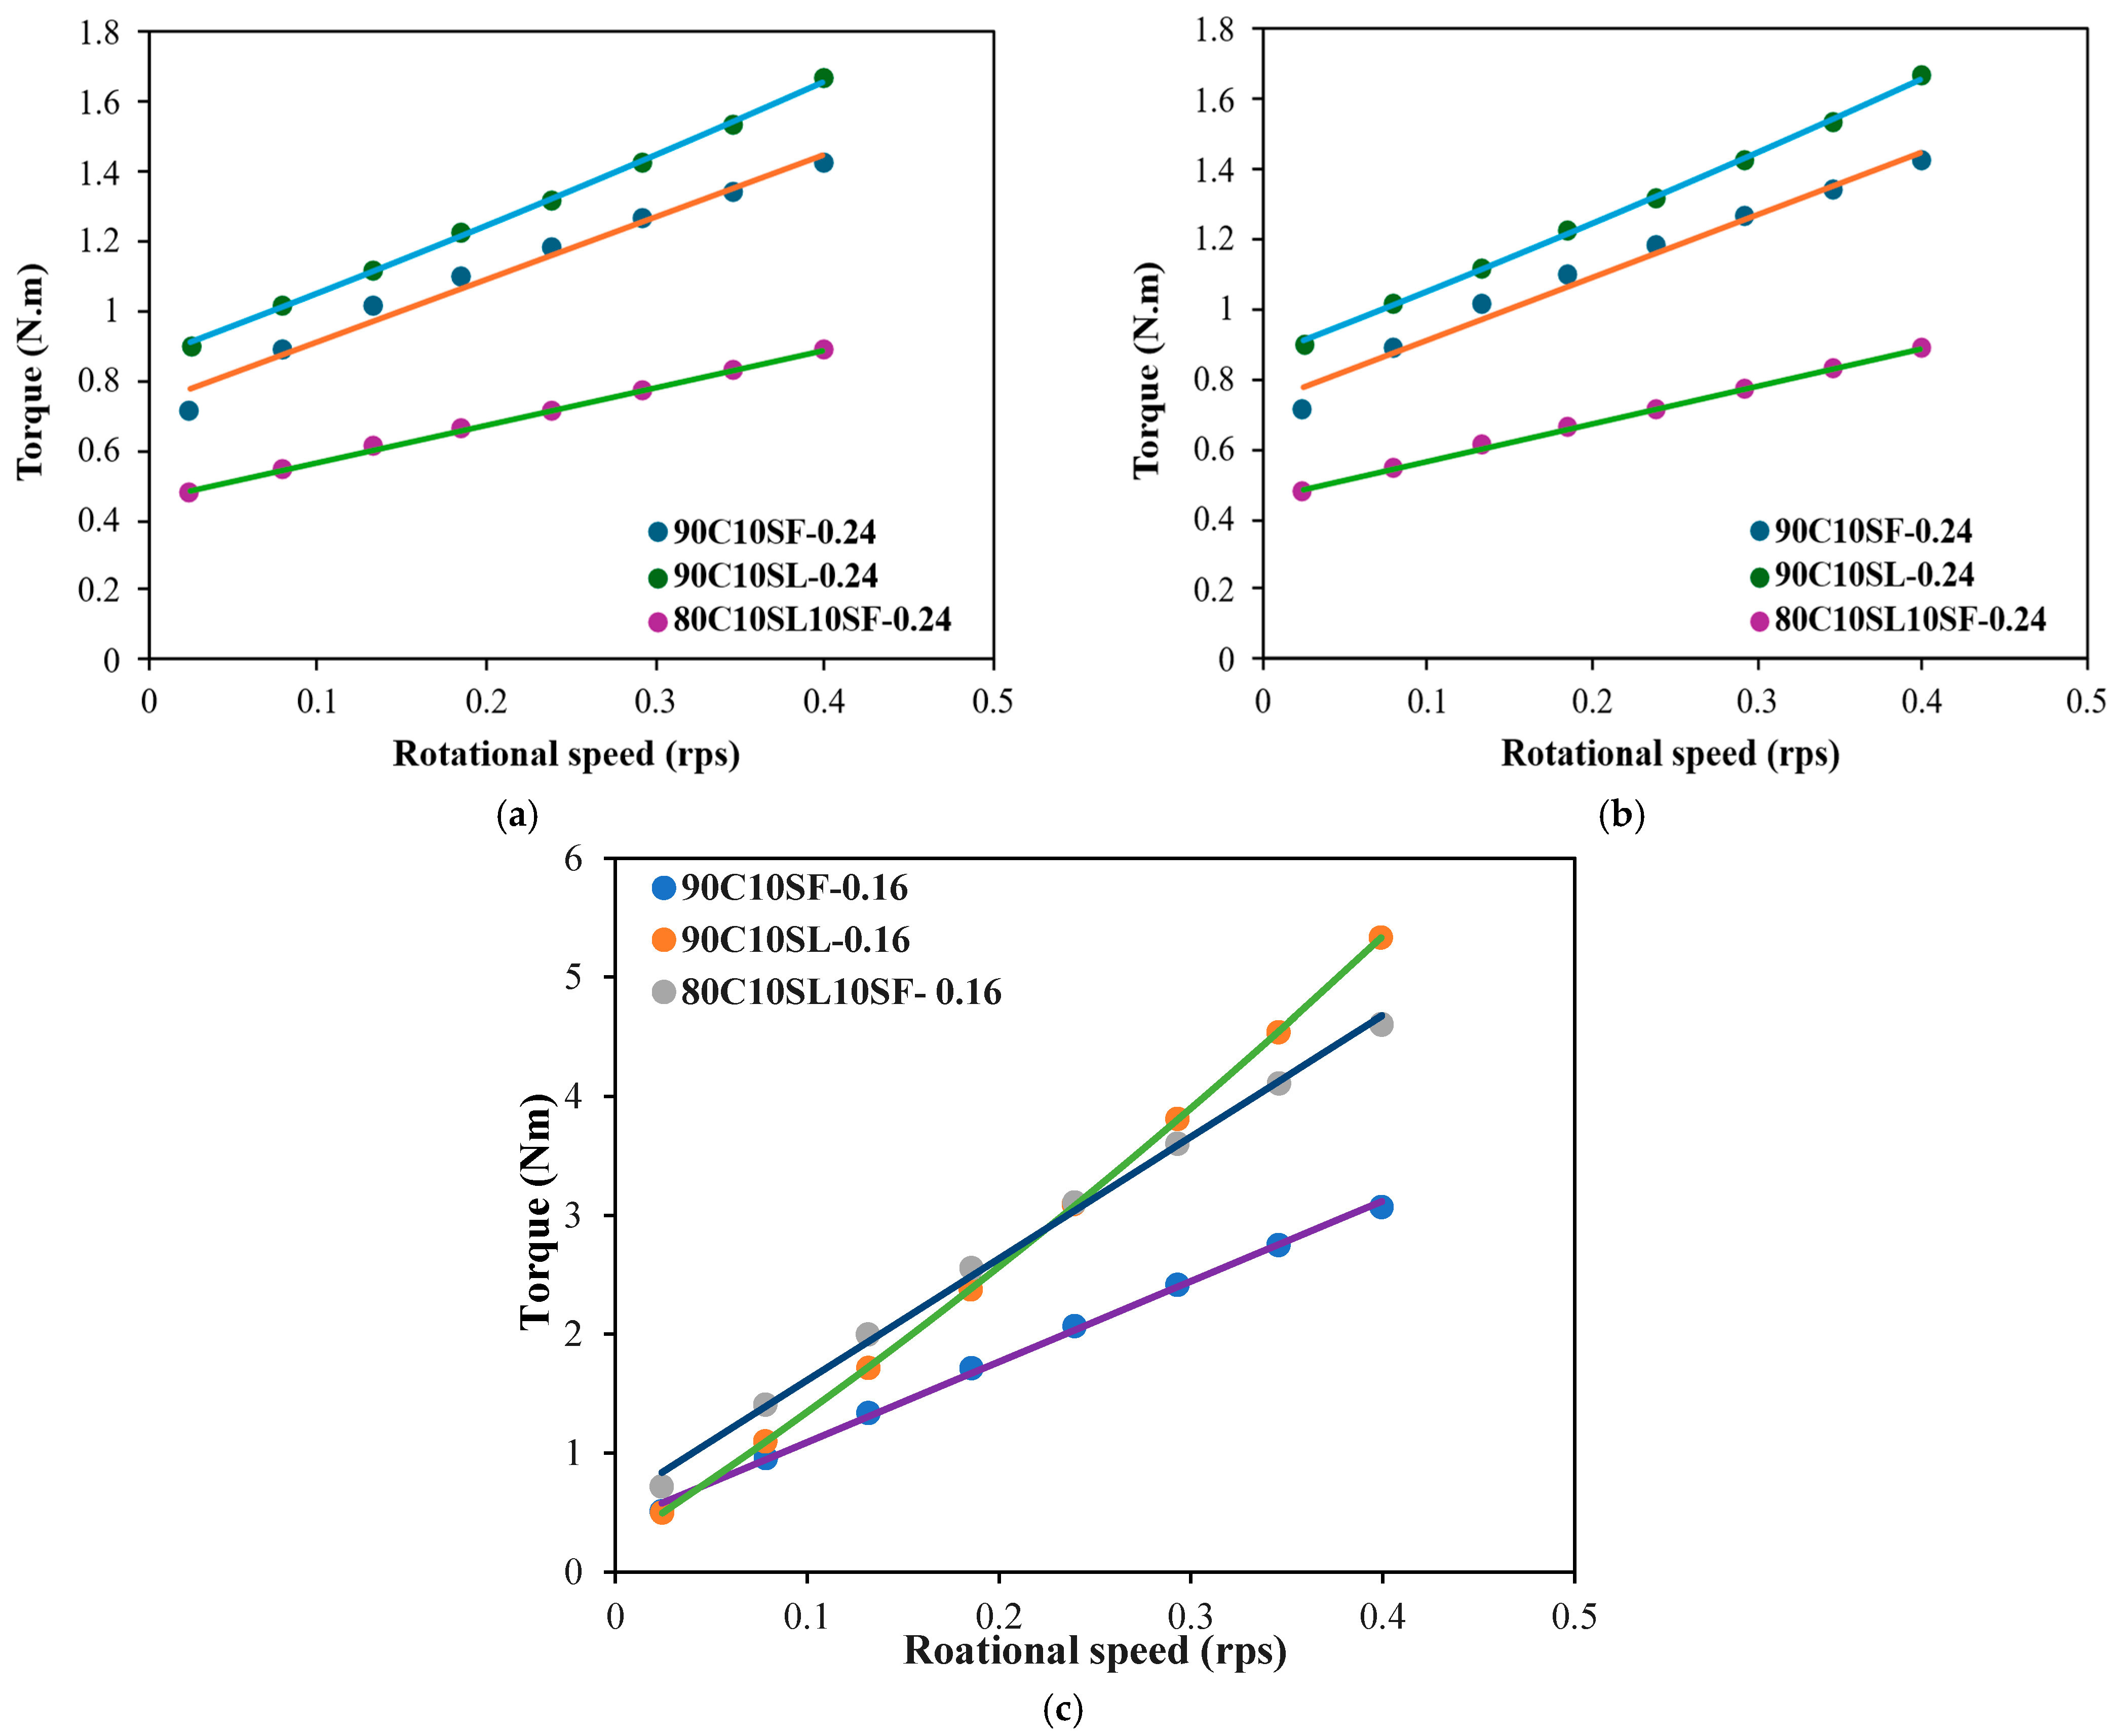
The flow curves of the investigated mortar mixtures prepared with a w/b of 0.24, 0.20, and 0.16 are shown in Figure 12. The modified Bingham model for the investigated mortar mixtures is also presented in Table 8. Similar to the observation made at the paste scale, the mixtures prepared with SF showed no shear thickening; however, the mortar mixtures prepared with SL showed slight shear thickening behavior.
The particle size distribution of the supplementary cementitious materials strongly influenced the transition from the shear thickening to Bingham-like behavior. The ultrafine silica fume (SF, ~0.1 µm) promoted dense packing and cohesive microstructure formation, which suppresses hydrodynamic clustering and reduces shear thickening. In contrast, the coarser slag (SL, D50 ≈ 10 µm) decreased the packing efficiency and increased the particle friction under shear, producing a stronger shear thickening response. Consequently, increasing the SF content shifted the rheological behavior toward a more stable, Bingham-like flow regime with reduced nonlinearity.
The thixotropic results of the investigated mortar mixtures are presented in Table 9. The results highlight how different combinations of cement, SF, and SL affected the static yield stress. For example, the 90C10SF mixture made with a w/b of 0.24 exhibited higher static yield stress compared to the 90C10SL mixture at the same w/b. SF particles are extremely fine (average ~0.1 µm) and have a much higher specific surface area than SL (which is ~10–100 times coarser). This high surface area promotes more water adsorption and interparticle attraction, resulting in stronger flocculation and faster gel structure formation, which enhances the structure build-up at rest [33,34].
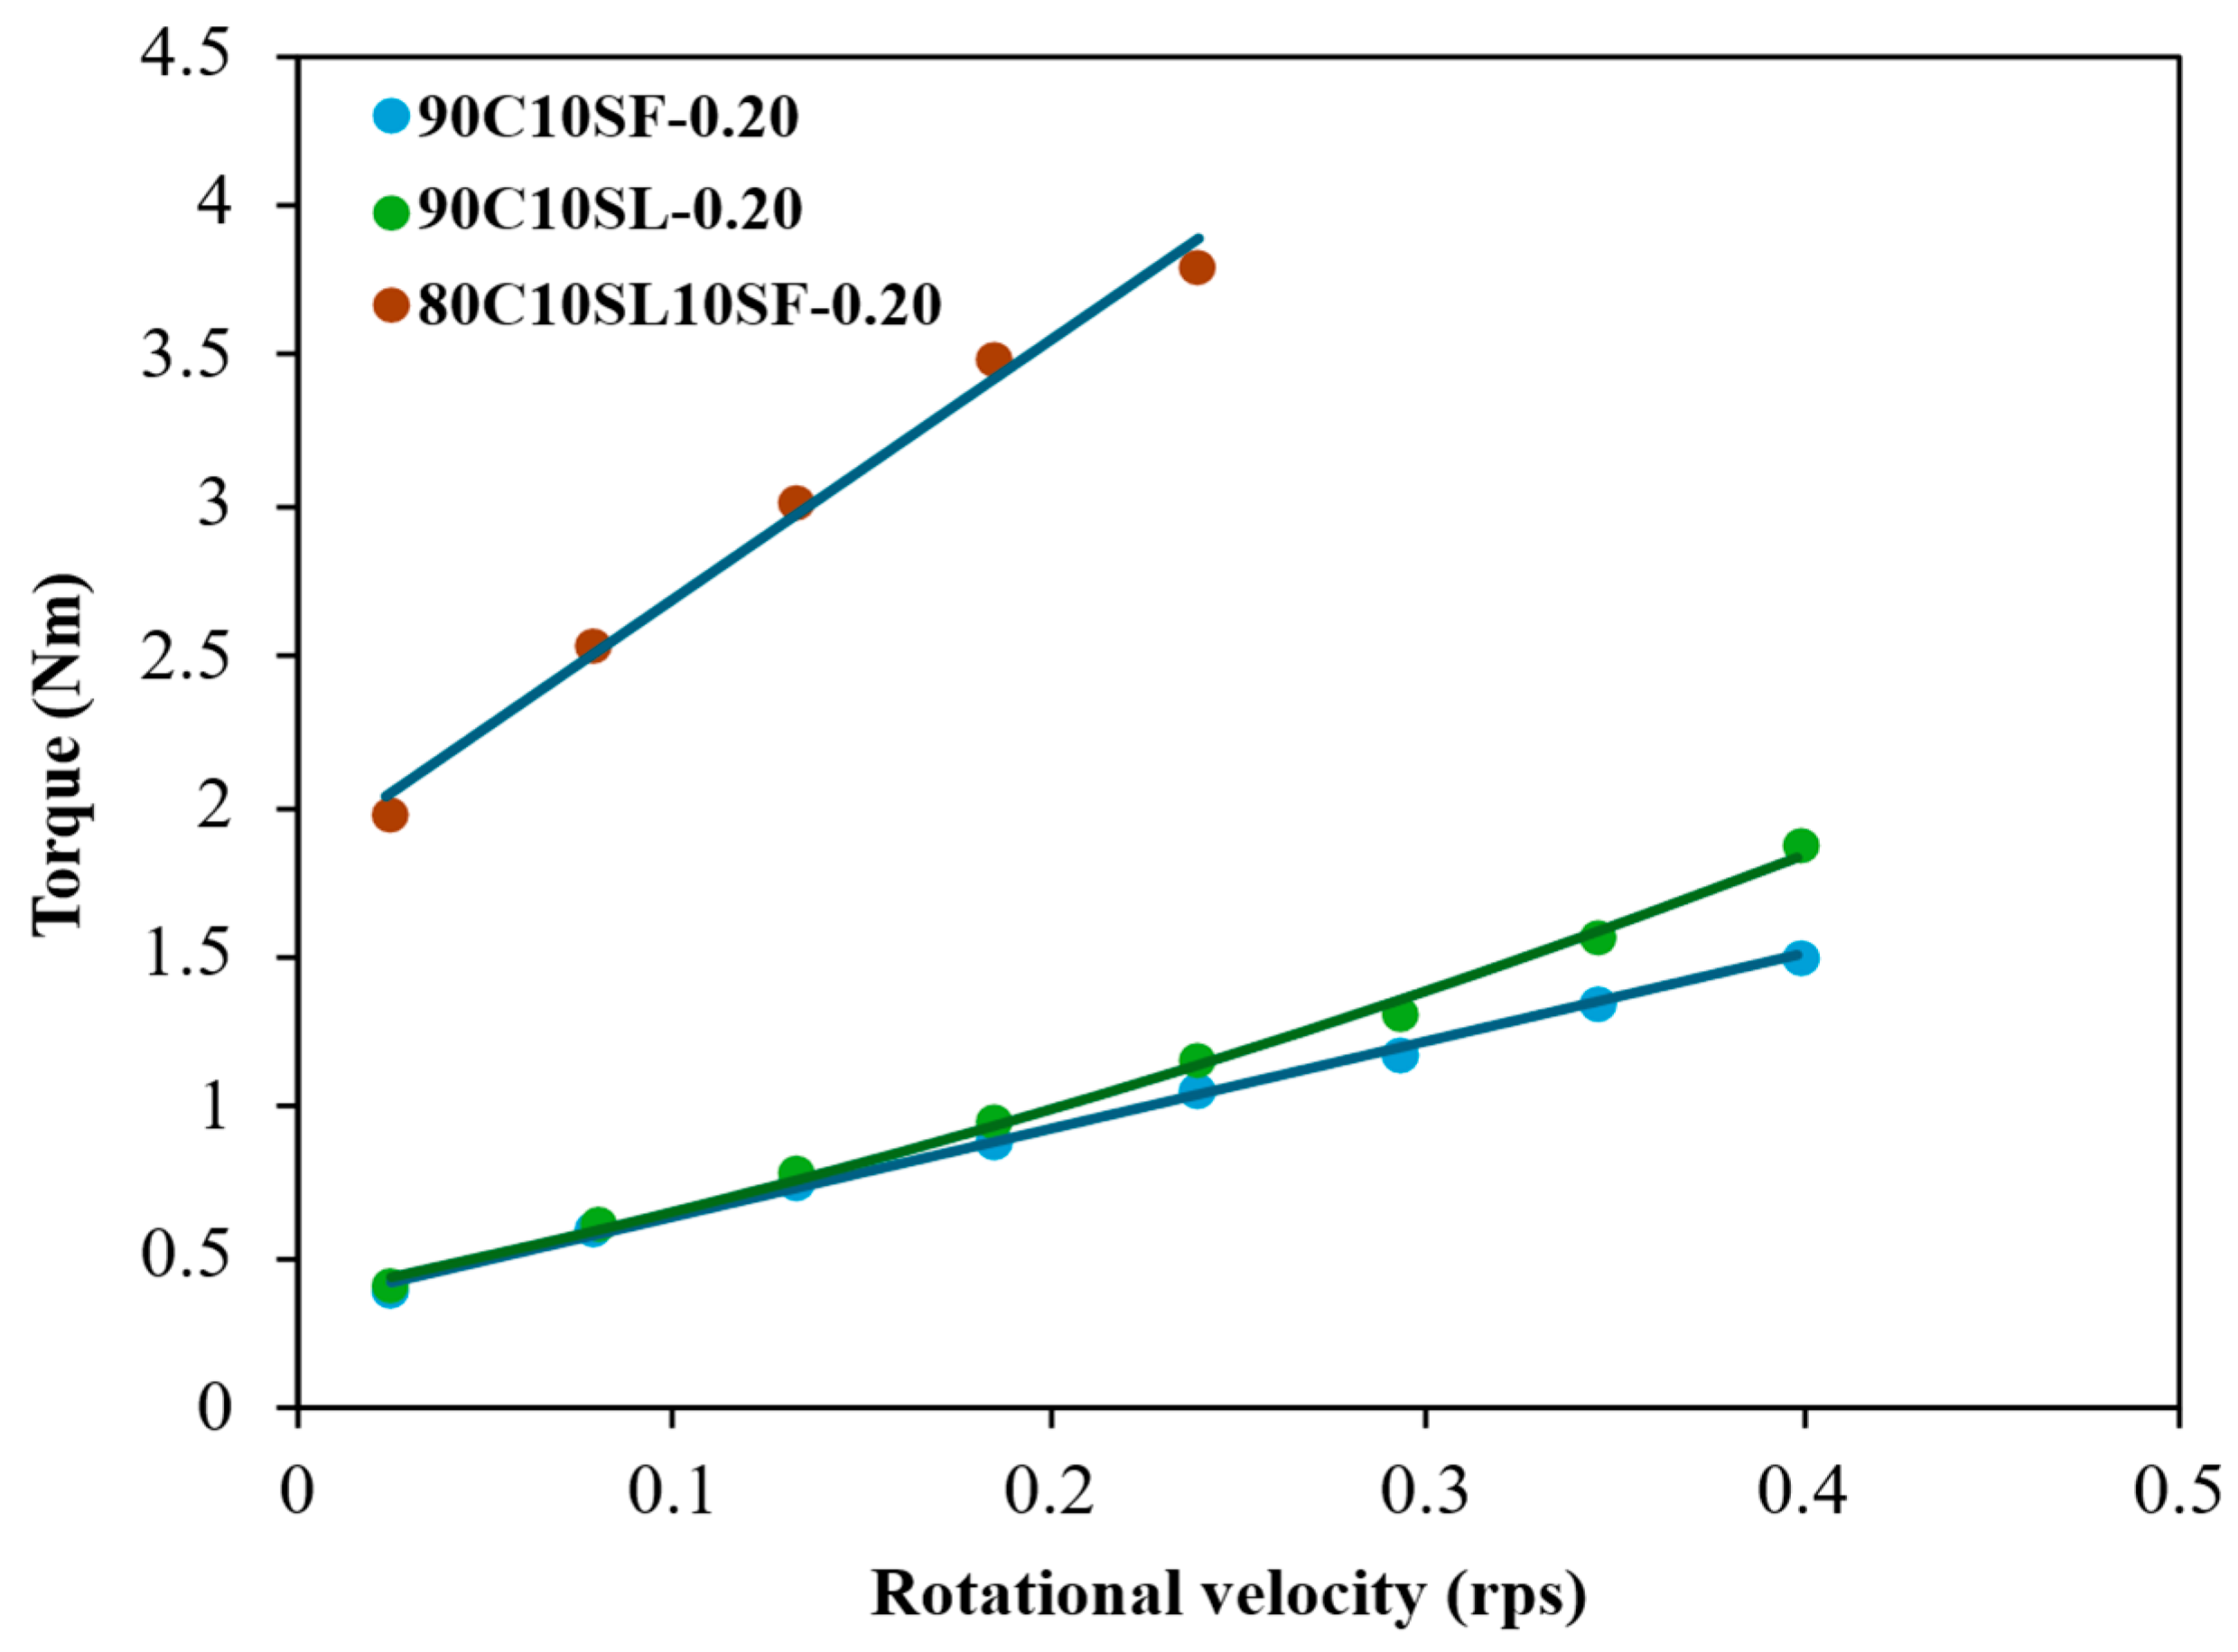
Figure 13 presents the flow curves of the investigated UHPC mixtures. Similar to the results at the mortar scale, the mixture prepared with SL showed shear thickening behavior, whereas the mixtures incorporating SF saw the shear thickening eliminated, the results of which are quantified in Table 10. Furthermore, the thixotropy results at the UHPC scale presented in Table 11 exhibited a similar trend to the results from the paste and mortar levels. This is because the flocculation and hydration of the cementitious component of UHPC is a major influencer of thixotropy [33]. Following the observation in the trends of rheology across the scales, the relationships between the paste, mortar, and UHPC rheologies were established and quantified.

3.6. Relationships Between the Rheologies of the Paste, Mortar, and UHPC Scales

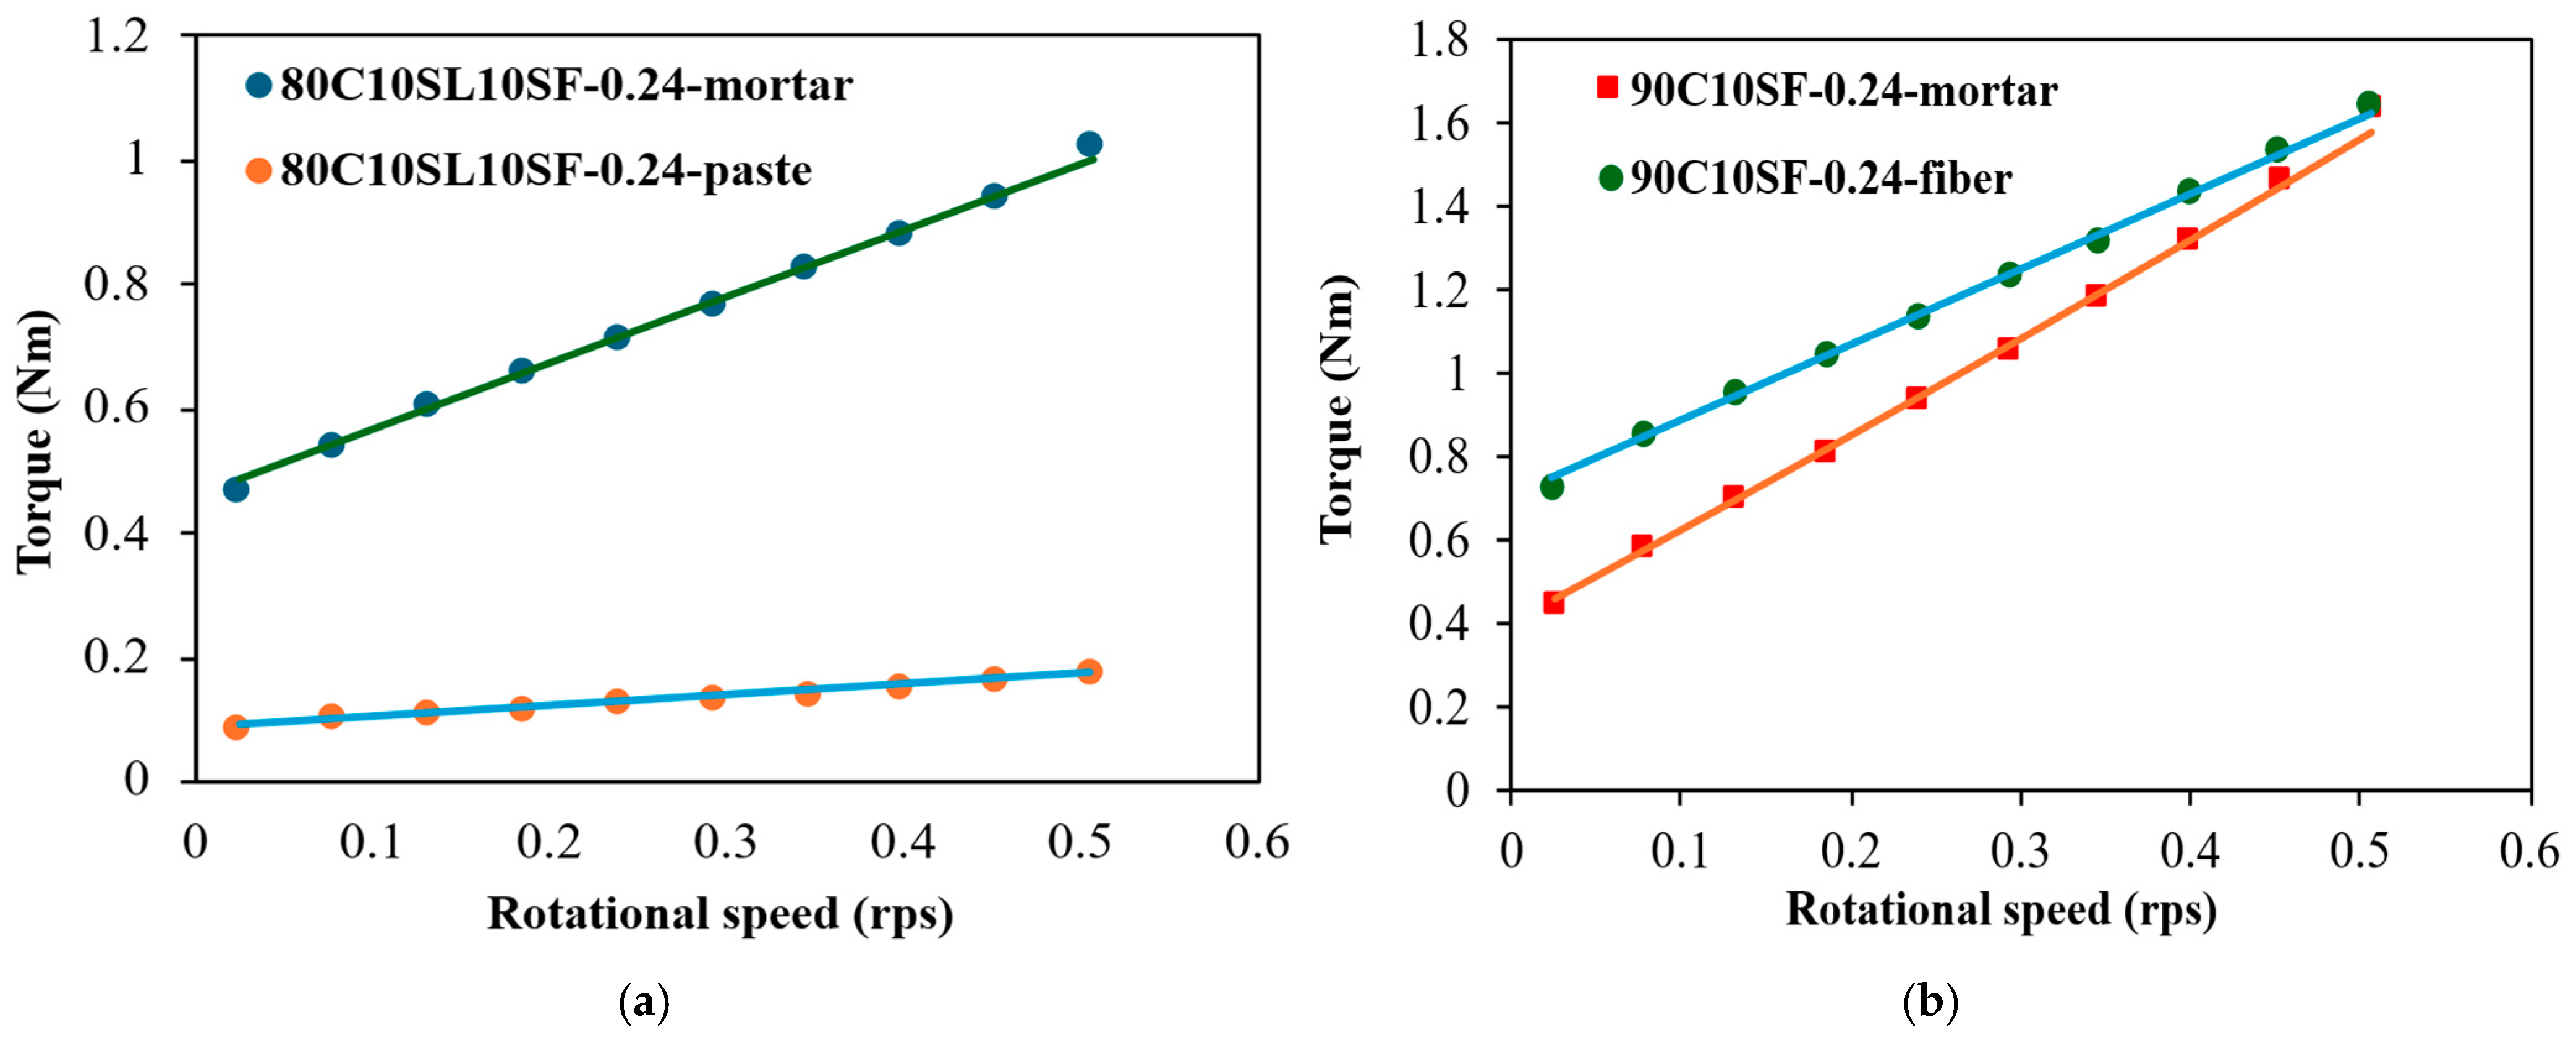
A comparison of the paste, mortar, and UHPC rheologies was undertaken to establish the relationships between the rheological properties across these scales. As shown in Figure 14a, a significant increase in the rheological properties was observed from the paste scale to the mortar scale for the mixture prepared with an 80C10SL10SF binder combination. Similarly, an increase in the rheological properties was observed in the transitioning from mortar scale to UHPC scale, as shown in Figure 14b. This increase in rheological properties was as a result of the presence of aggregates, which introduce friction and change the flow behavior of the paste in the case of mortar. In the case of the fiber-reinforced composite, the presence of fibers further increased the yield stress and plastic viscosity.

3.7. Isothermal Calorimetry

3.7.1. Effect of Cement Type and w/b on Heat of Hydration

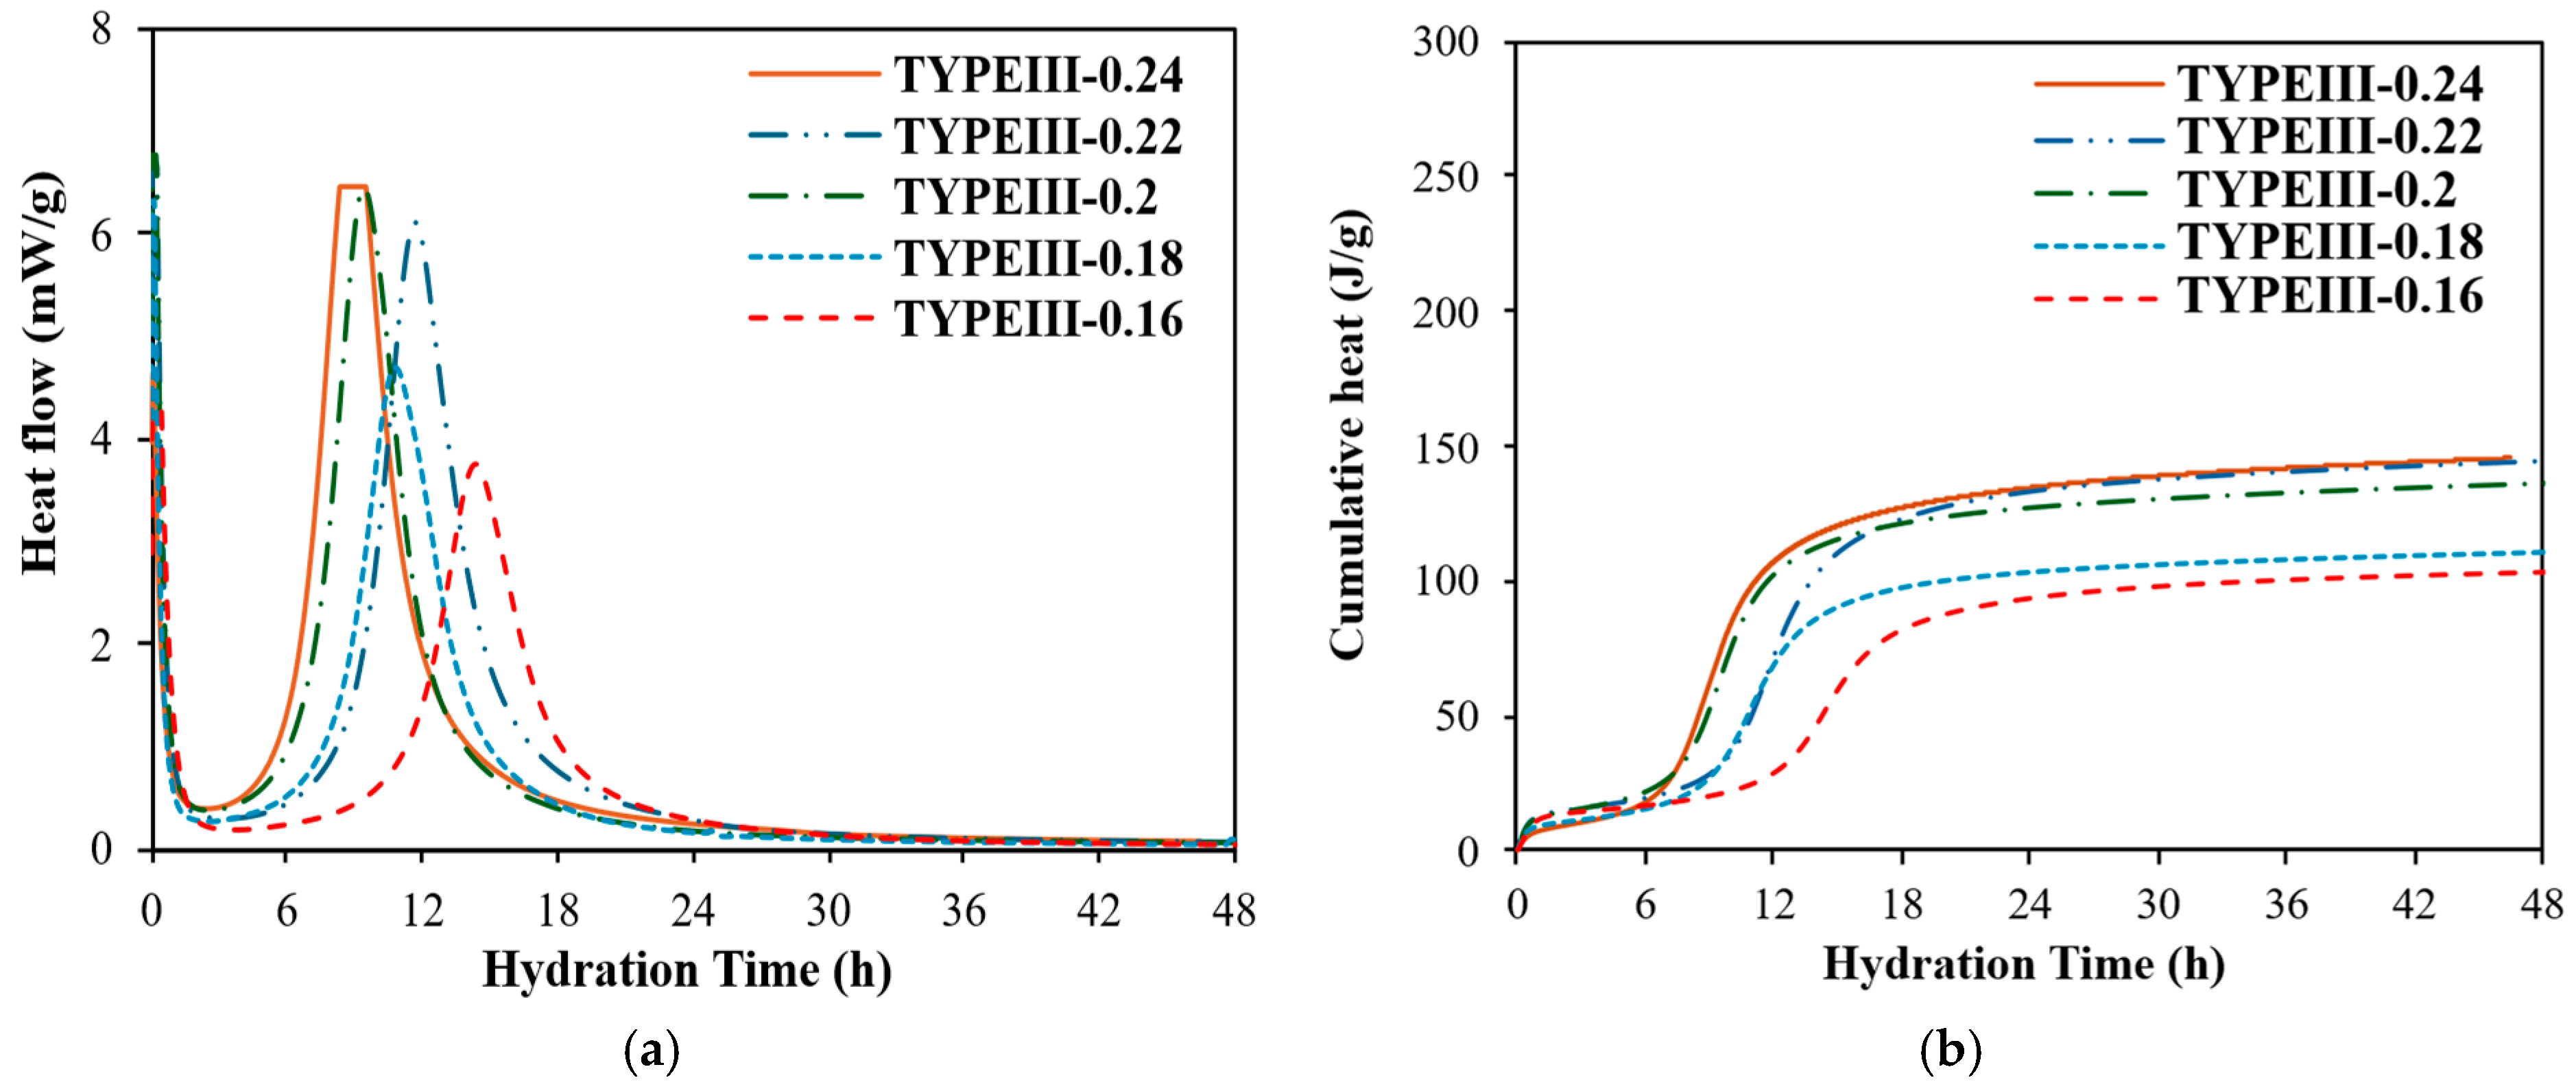
The isothermal calorimetry (heat flow) results for the mixture prepared with Type III cement at different w/b values are shown in Figure 15. Mixtures prepared with a w/b of 0.16 had a longer induction period compared to the other mixtures. A comparison of the heights of the main silicate hydration peaks indicated that, generally, the peak hydration rate decreased as the w/b decreased. The cumulative heat of hydration for the samples produced also showed a decrease, with a decreasing w/b at 48 h.
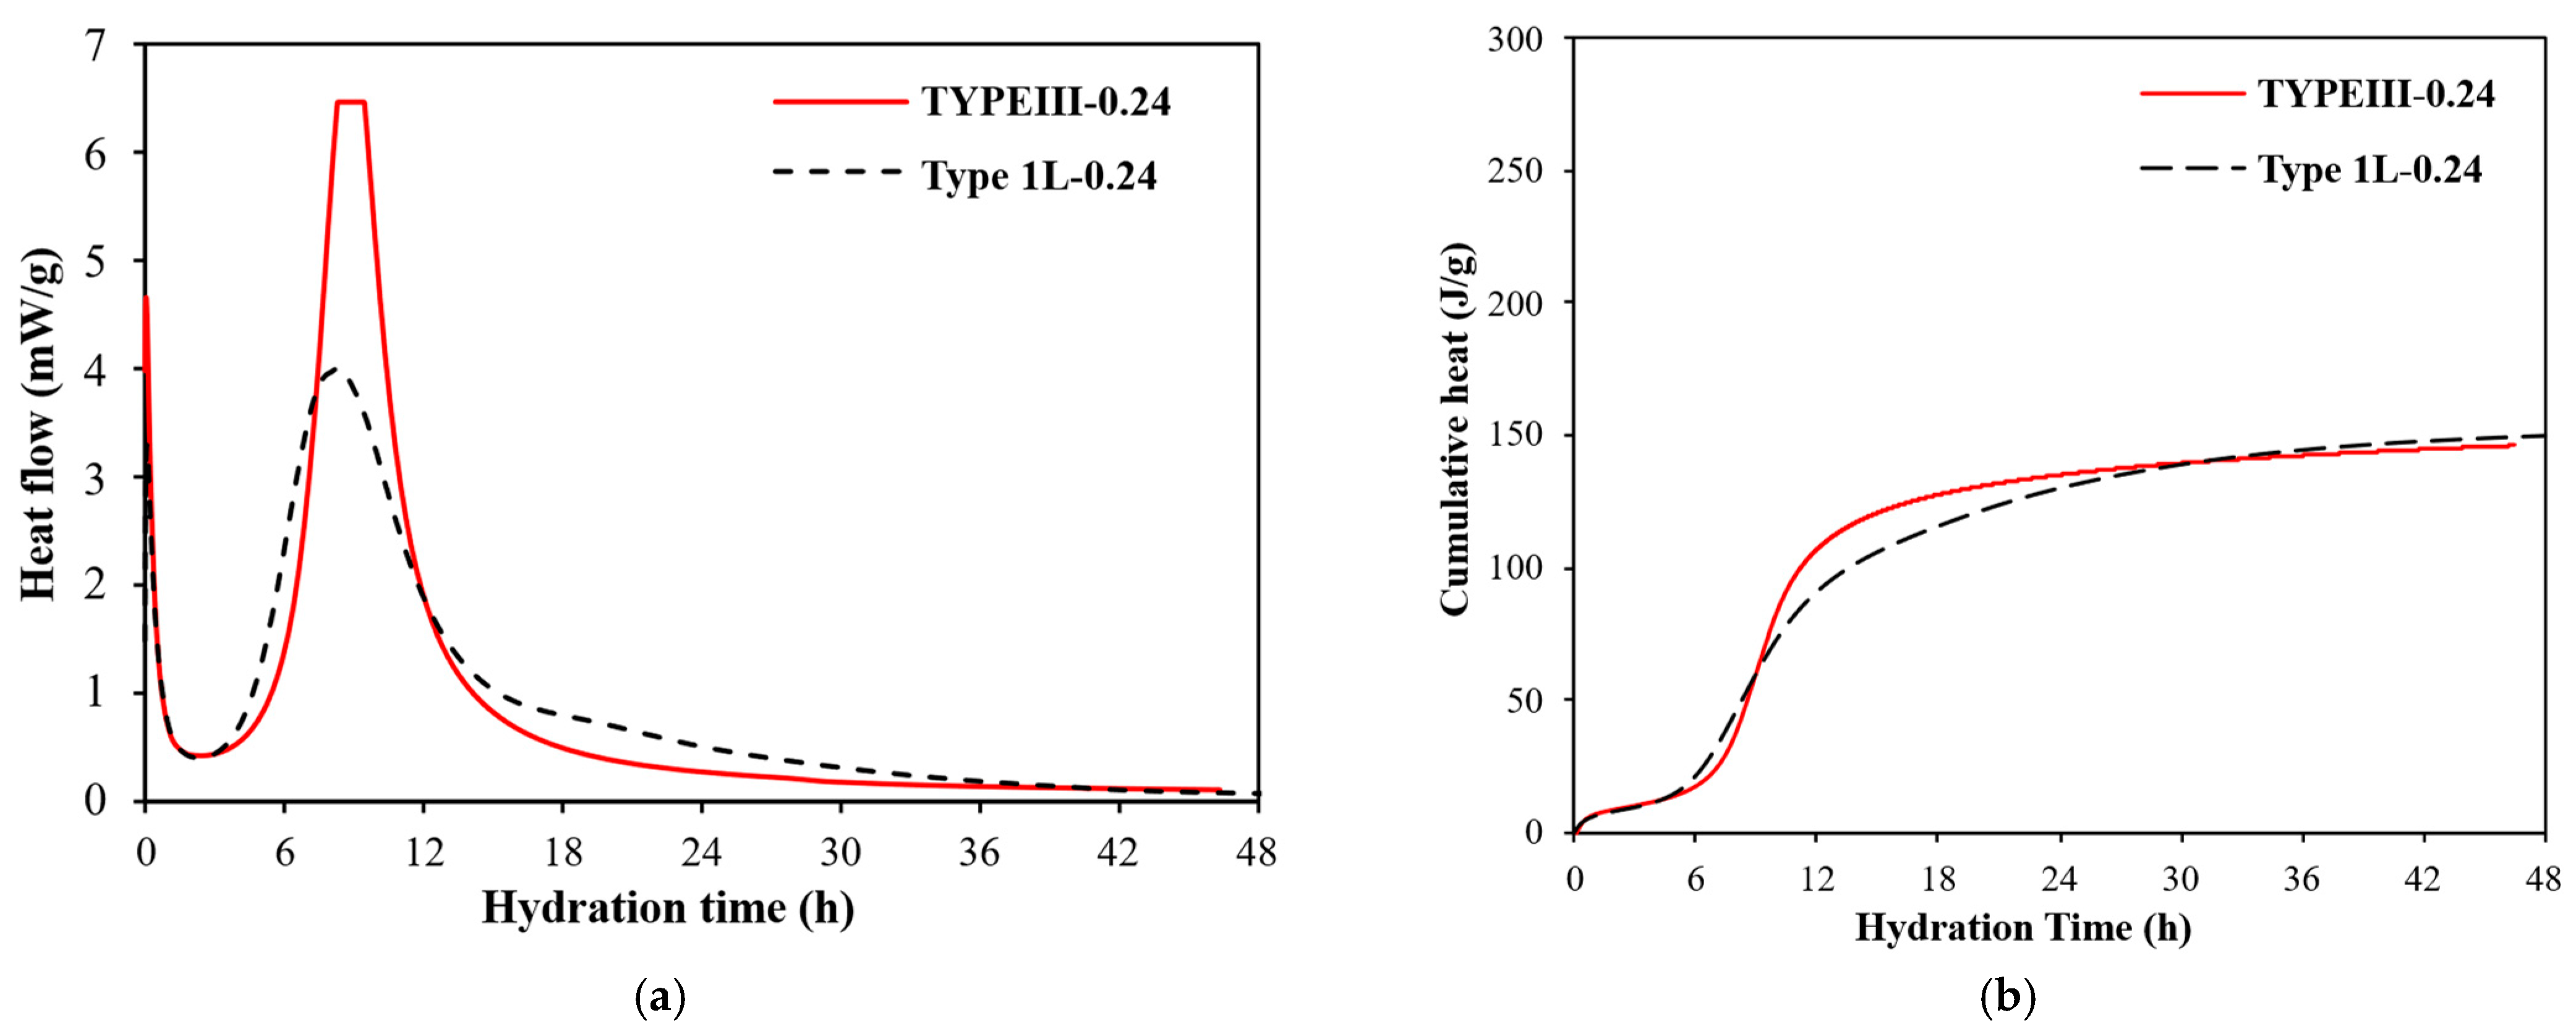
Figure 16 shows a comparison of the effect of the cement type on the heat of hydration. The results indicate that, generally, the mixtures prepared with Type III cement possessed a faster degree of hydration compared to the mixtures prepared with Type 1L cement. This observation was attributed to the increased SP dosage required for mixtures prepared with Type III mixtures compared with mixtures prepared with Type 1L cement, and it also corresponds with the data obtained from the thixotropy test, thus further showing the relationship between thixotropy and hydration (which is well documented in the literature [35]).

3.7.2. Effect of Slag and Silica Fume on Heat of Hydration

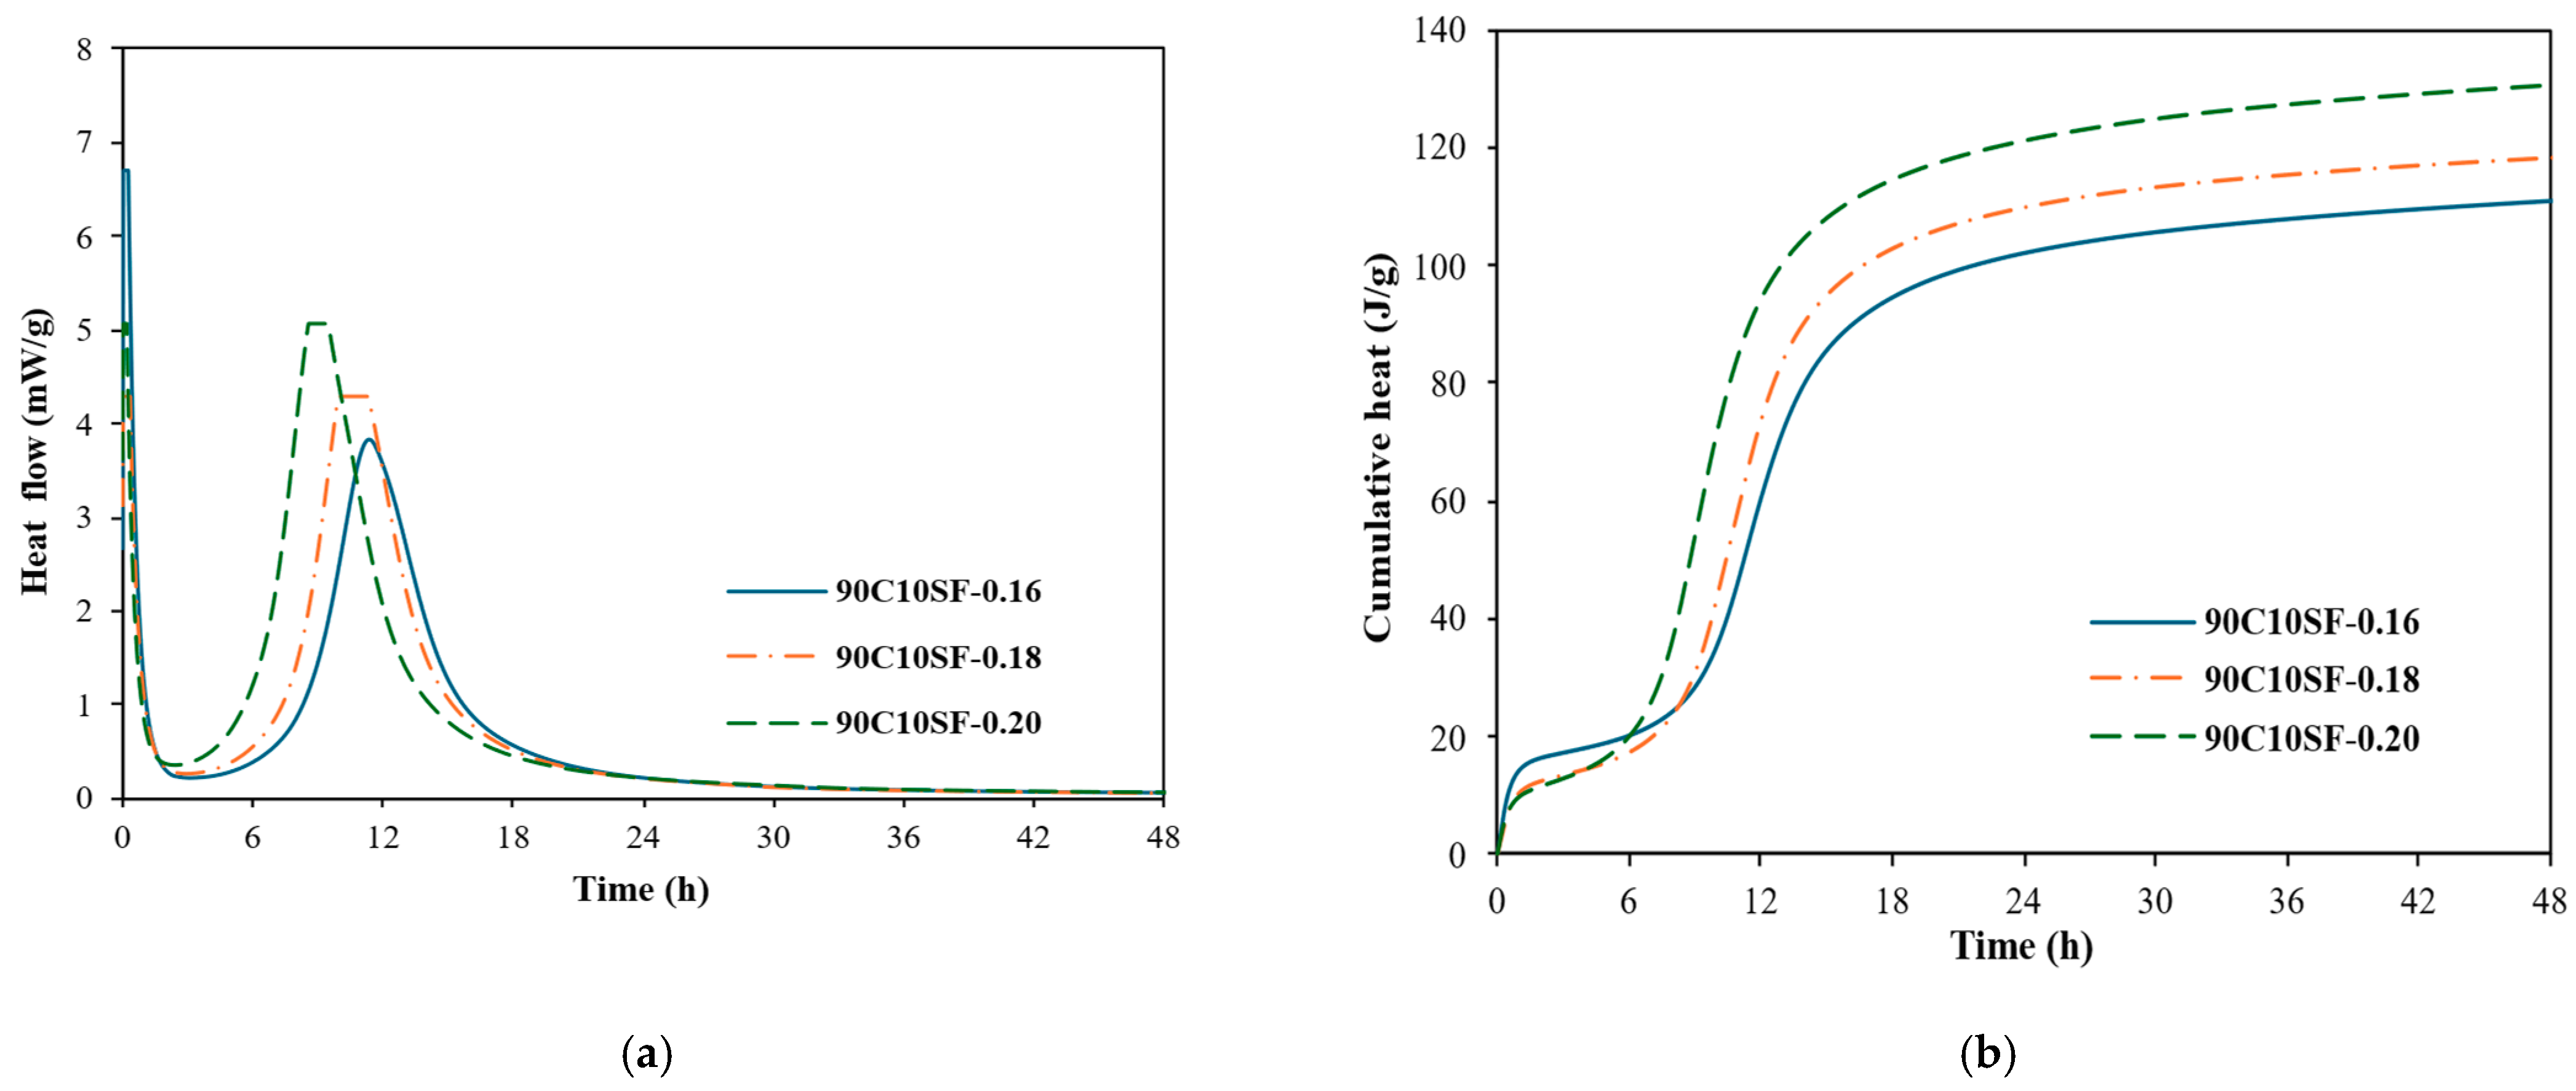
Figure 17 presents the effect of the w/b on the hydration of the 90C10SF mixture. The results indicate that mixtures prepared with a lower w/b had a longer induction period compared to those with a higher w/b. This means that the initial hydration reaction was slower in mixtures with less water. Additionally, the peak hydration rate, which is the highest rate of heat release during the hydration process, generally decreased as the w/b decreased. This observation is attributed to the increased SP demand as the w/b decreases, which delays the hydration process [36,37].
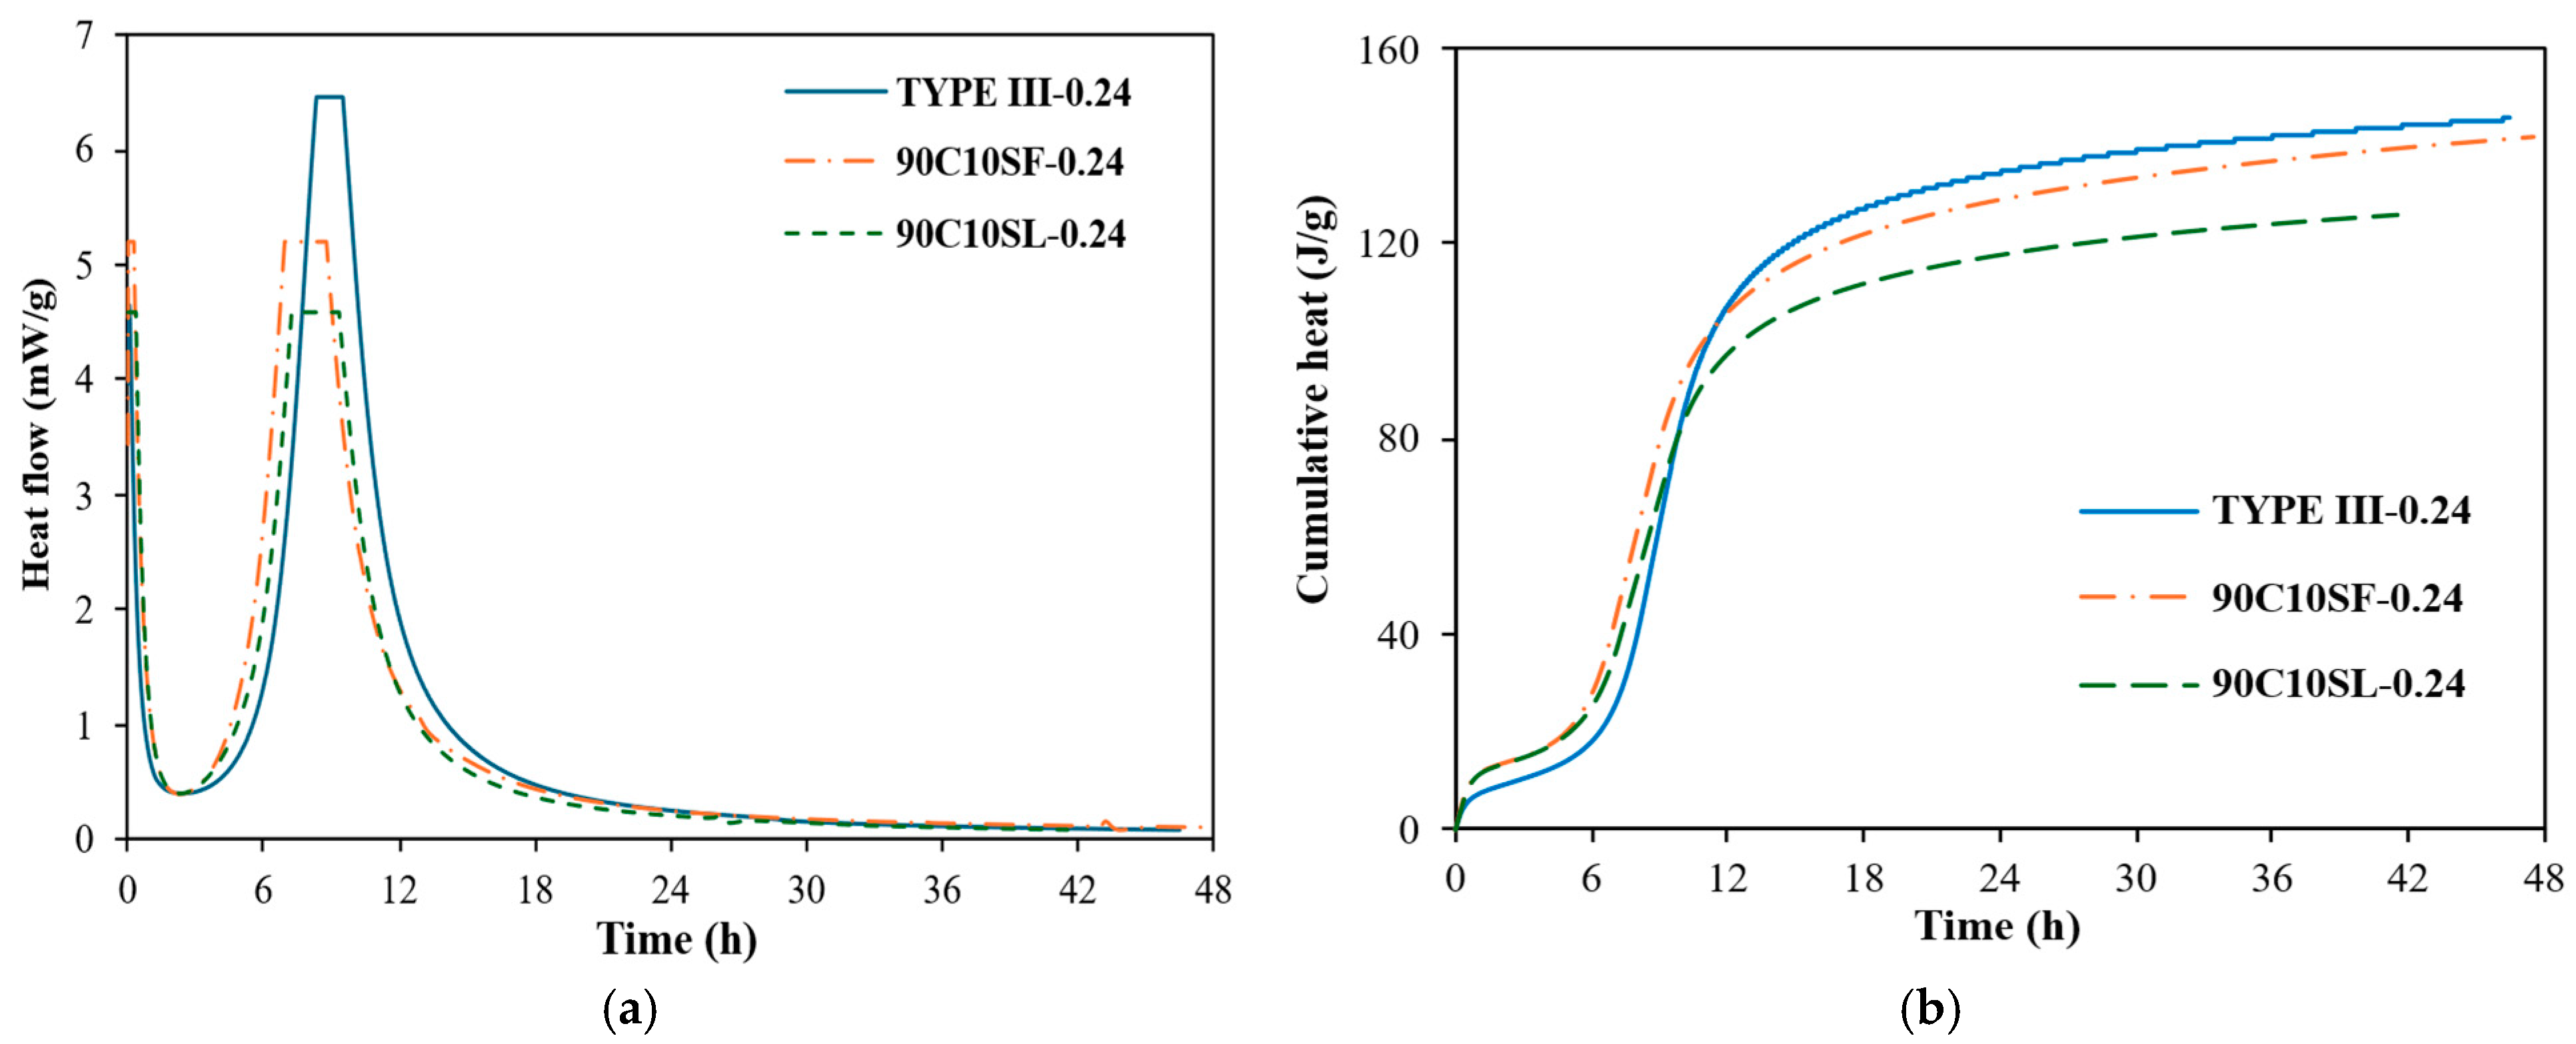
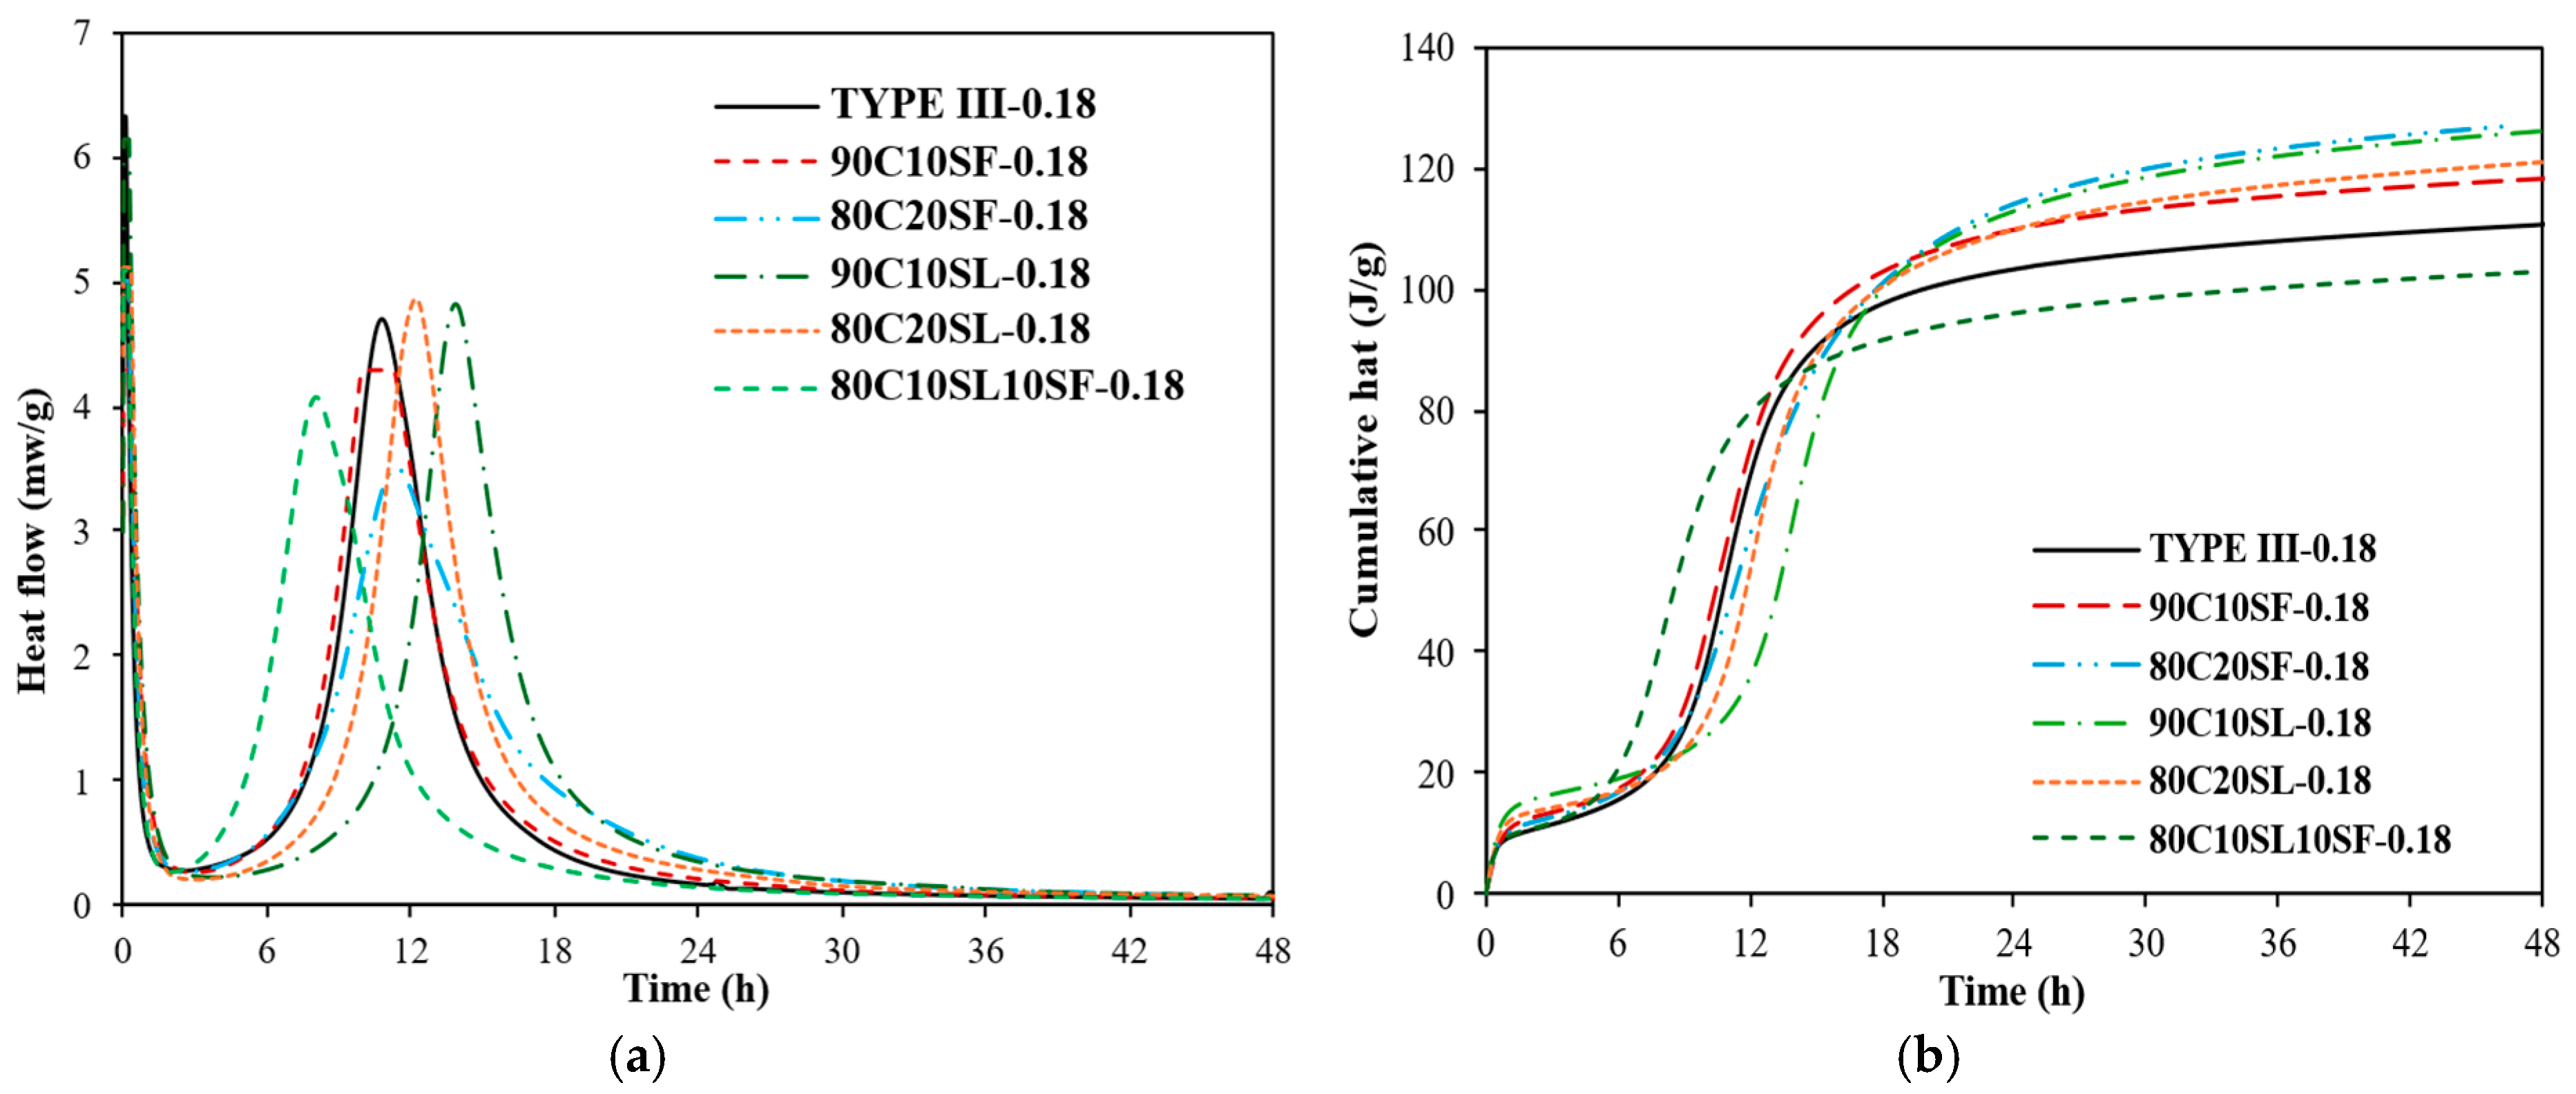
Figure 18 and Figure 19 depict the degree of hydration of paste over time for the various binder combinations made with a w/b of 0.24 and 0.18, respectively. The use of the two SCMs resulted in lower degrees of hydration compared to the mixture prepared with only cement. The 90C10SF mixture showed higher degree of hydration compared to the 90C10SL. The SF with a fine particle size and pozzolanic activity enhanced early reactions while also refining the microstructure compared to slag (which possessed latent hydraulic behavior).

3.8. Mechanical Performance

3.8.1. Effect of w/b and Cement Type on the Compressive Strength

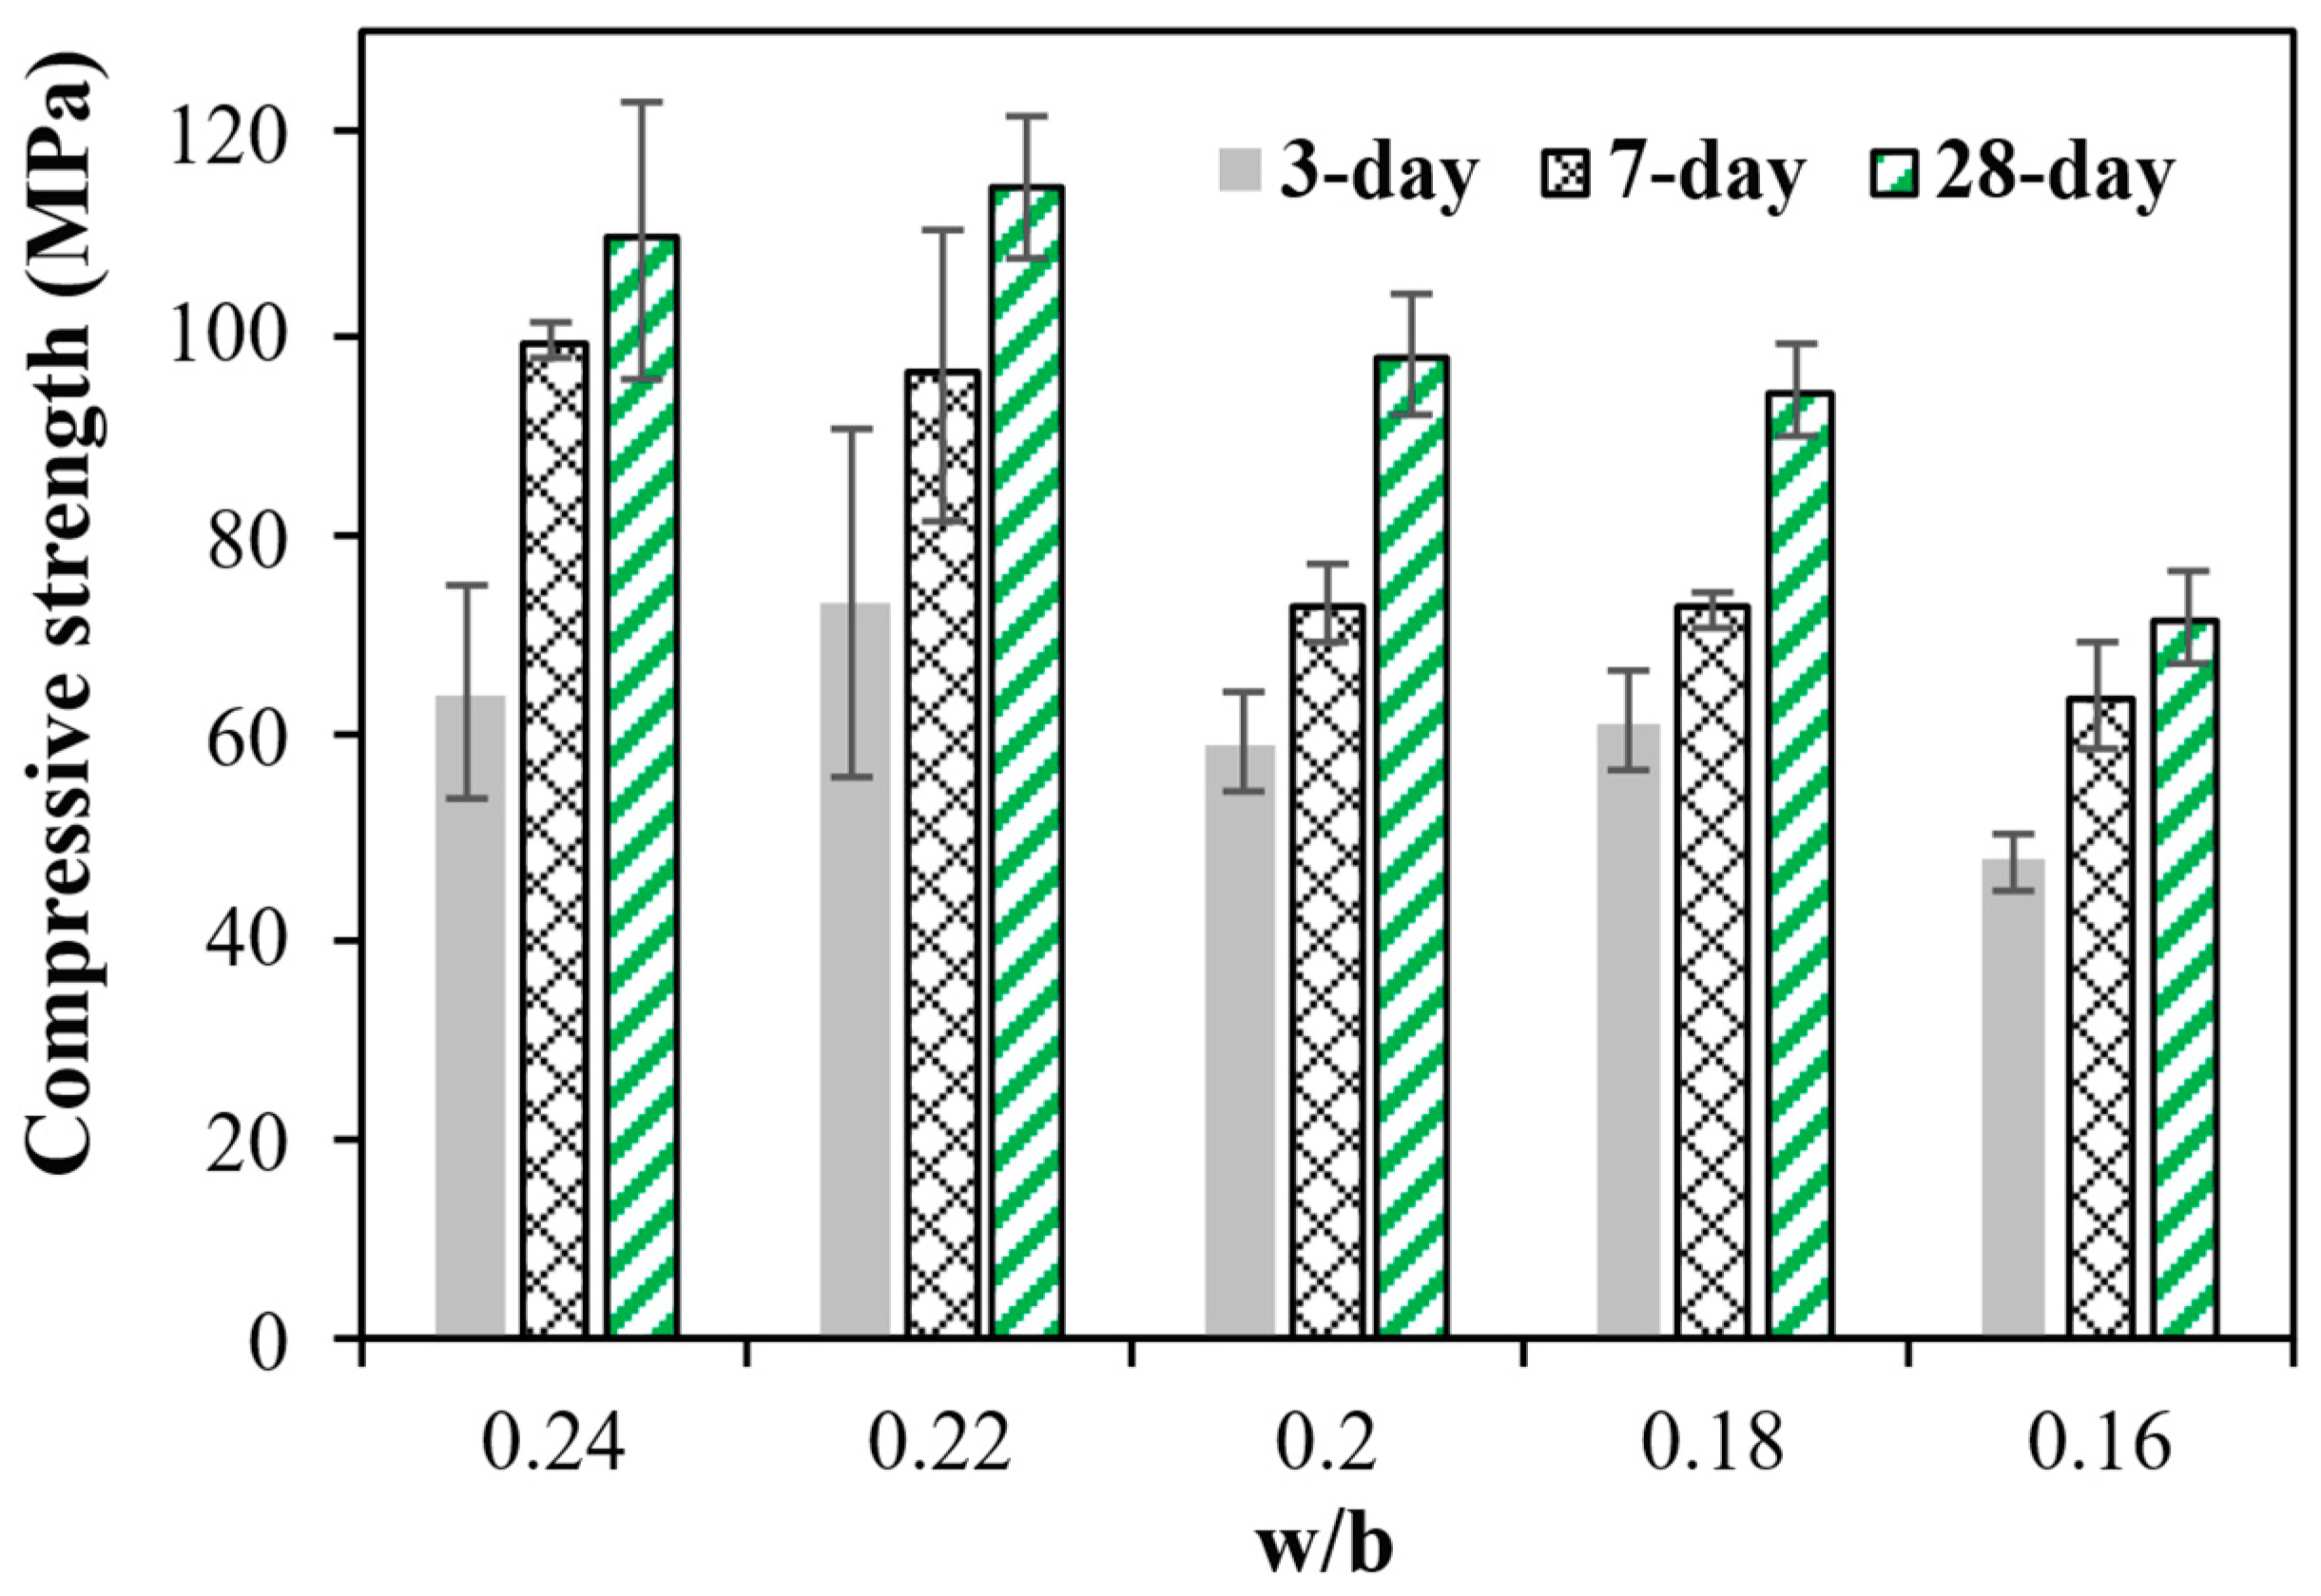
The 3-day, 7-day, and 28-day compressive strength of the investigated paste mixtures made with Type III cement is presented in Figure 20. From the results, generally, the decrease in w/b resulted in a reduction in the compressive strength as a result of the increased SP demand, which was also demonstrated in the heat of hydration results. For example, when the w/b was reduced from 0.24 to 0.16, the maximum 28-day compressive strength decreased by around 30%.
The compressive strength of the investigated UHPC mixtures is shown in Table 12. The compressive strength ranged between 100 and 150 MPa. The range of compressive strength of the UHPC mixtures was consistent with that reported for UHPC in [36]. The 90C10SF mixture showed a 35% and 15% higher compressive strength compared to the 90C10SL and 80C10SF10SL mixtures, respectively.

3.8.2. Effect of Binder Type on Tensile and Flexural Behavior of UHPC

The effect of SCMs on the tensile behavior of UHPC is presented in Figure 21a. The 90C10SF mixture exhibited a higher peak tensile stress, reaching approximately 12,000 N, compared to 90C10SL, which peaked around 10,000 N. However, the 90C10SF mixture showed fluctuations in stress after the peak, followed by a more pronounced decline in the tensile strength. This behavior suggests a higher initial strength but potentially less stability during tensile loading. In contrast, 90C10SL displays a smoother, more consistent load–displacement curve, indicating greater ductility and a more stable response under stress. Despite a slightly lower peak strength, 90C10SL demonstrated a gradual decline, which could indicate better performance in applications requiring prolonged tensile loading or resistance to cracking.
Figure 21b illustrates the effect of binder type on the flexural behavior of the UHPC mixtures. The UHPC mixture prepared with a 90C10SF binder combination showed higher load carrying capacity compared to the UHPC mixture made with a 90C10SL and 80C10SL10SF binder combination. The flexural test of the three UHPC mixtures highlighted three characteristic behaviors. A linear region where the load increases proportionally with the deflection was observed. This indicates the elastic behavior of the UHPC beam. As the load continued to increase, the plot reached a peak load point. This peak represents the maximum load the UHPC beam can withstand before experiencing significant deformation. After the peak load, the plot typically shows a descending branch, indicating the post-peak behavior of the UHPC beam. This region reflects the beam’s ability to sustain load even after the initial cracking [17]. The observed variation in post-peak slopes is primarily attributed to differences in the matrix brittleness and fiber–matrix interfacial bonding associated with the binder composition. Mixtures incorporating SF exhibited steeper post-peak declines due to the denser matrix microstructure and higher bond strength between the fibers and the cementitious matrix, which promotes a more brittle failure after peak load [37]. In contrast, the SL-containing mixtures displayed a more gradual post-peak softening, indicating a relatively ductile response resulting from reduced matrix stiffness and weaker fiber–matrix interfacial bonding.

4. Conclusions

This study presents a comprehensive multi-scale experimental investigation into the rheological and mechanical behavior of ultra-high-performance concrete (UHPC), spanning from the cement paste level to the fiber-reinforced composite scale. Key rheological phenomena, such as shear thickening and thixotropy, were systematically characterized and linked to mixture composition, binder type, water-to-binder ratio (w/b), and the presence of supplementary cementitious materials (SCMs).
The findings revealed that UHPC mixtures prepared with Type III cement exhibited more pronounced shear thickening, higher thixotropy, and accelerated hydration compared to those prepared with Type 1L cement. While the modified Bingham model was suitable for describing the flow behavior of UHPC, its predictive accuracy diminished with increasing shear thickening. The incorporation of SF significantly mitigated shear thickening due to improved particle packing and dispersion, while SL tended to enhance it.
A reduction in the w/b increased the intensity of shear thickening but reduced the thixotropy and degree hydration due to higher SP demand. The findings suggest that excessively low w/b (<0.20) may be detrimental to the early-age performance of UHPC.
Mechanically, the UHPC mixtures incorporating SF (e.g., 90C10SF) demonstrated superior compressive, flexural, and tensile strength compared to those incorporating SL. These results highlight the importance of material selection in achieving desired performance characteristics.
Overall, the study contributes valuable insights into the multi-scale rheology of UHPC, offering practical implications for mixture proportioning, modeling, and performance optimization in advanced construction applications.

Author Contributions

Conceptualization, A.A.-N.; formal analysis, A.A.-N. and J.W.; data curation, A.A.-N.; writing—original draft preparation, A.A.-N.; writing—review and editing, J.W. and K.H.K.; supervision, K.H.K.; Project administration, K.H.K.; Funding acquisition, K.H.K. All authors have read and agreed to the published version of the manuscript.

Funding

The authors acknowledge the financial support provided by Engineering Research and Development Center (ERDC) (Project Number: W9132T22C0018).

Data Availability Statement

The original contributions presented in this study are included in the article Further inquiries can be directed to the corresponding author.

Acknowledgments

This research was conducted at the Advanced Construction and Material Laboratory (ACML) of the Center for Infrastructure Engineering Studies (CIES) at Missouri S&T.

Conflicts of Interest

The authors declare no conflicts of interest.

Abbreviations

The following abbreviations are used in this manuscript:
SCMSupplementary cementitious material
SFSilica fume
SLSlag

References

  1. Wu, Z.; Khayat, K.H.; Shi, C. Changes in Rheology and Mechanical Properties of Ultra-High Performance Concrete with Silica Fume Content. Cem. Concr. Res. 2019, 123, 105786. [Google Scholar] [CrossRef]
  2. Khayat, K.H.; Meng, W.; Vallurupalli, K.; Teng, L. Rheological Properties of Ultra-High-Performance Concrete—An Overview. Cem. Concr. Res. 2019, 124, 105828. [Google Scholar] [CrossRef]
  3. Liu, J.; An, M.; Wang, Y.; Han, S.; Yu, Z. Research on the Relation between Slump Flow and Yield Stress of Ultra-High Performance Concrete Mixtures. Materials 2022, 15, 8104. [Google Scholar] [CrossRef] [PubMed]
  4. Xu, K.; Yang, J.; He, H.; Wei, J.; Zhu, Y. Influences of Additives on the Rheological Properties of Cement Composites: A Review of Material Impacts. Materials 2025, 18, 1753. [Google Scholar] [CrossRef] [PubMed]
  5. Shen, W.; Cui, H.; Jiao, D. Experimental Observations on Factors Influencing Shear-Thickening Characteristics of Cement-Based Materials. J. Build. Eng. 2024, 86, 108620. [Google Scholar] [CrossRef]
  6. Khayat, K.H.; Sayed, M.A. Effect of Supplementary Cementitious Materials on Rheological Properties, Bleeding, and Strength of Structural Grout. ACI Mater. J. 2008, 105, 585–593. [Google Scholar] [CrossRef]
  7. Mehdipour, I.; Khayat, K.H. Effect of Supplementary Cementitious Material Content and Binder Dispersion on Packing Density and Compressive Strength of Sustainable Cement Paste. ACI Mater. J. 2016, 113, 361–372. [Google Scholar] [CrossRef]
  8. Khayat, K.H.; Feys, D. Design, Production and Placement of Self-Consolidating Concrete. In Proceedings of the SCC2010, Montreal, QC, Canada, 26–29 September 2010; Springer Science & Business Media: Berlin/Heidelberg, Germany, 2010; Volume 1, ISBN 9789048196630. [Google Scholar]
  9. Qian, Y.; De Schutter, G. Enhancing Thixotropy of Fresh Cement Pastes with Nanoclay in Presence of Polycarboxylate Ether Superplasticizer (PCE). Cem. Concr. Res. 2018, 111, 15–22. [Google Scholar] [CrossRef]
  10. Feys, D.; Verhoeven, R.; De Schutter, G. Why Is Fresh Self-Compacting Concrete Shear Thickening? Cem. Concr. Res. 2009, 39, 510–523. [Google Scholar] [CrossRef]
  11. Keke, L.; Yong, L.; Liuliu, X.; Junjie, Z.; Kangning, L.; Dingqiang, F.; Rui, Y. Rheological Characteristics of Ultra-High Performance Concrete (UHPC) Incorporating Bentonite. Constr. Build. Mater. 2022, 349, 128793. [Google Scholar] [CrossRef]
  12. Mahaut, F.; Chateau, X.; Coussot, P.; Ovarlez, G. Yield Stress and Elastic Modulus of Suspensions of Noncolloidal Particles in Yield Stress Fluids. J. Rheol. 2008, 52, 287–313. [Google Scholar] [CrossRef]
  13. Zhang, C.; Hou, Z.; Chen, C.; Zhang, Y.; Mechtcherine, V.; Sun, Z. Design of 3D Printable Concrete Based on the Relationship between Flowability of Cement Paste and Optimum Aggregate Content. Cem. Concr. Compos. 2019, 104, 103406. [Google Scholar] [CrossRef]
  14. Toutou, Z.; Roussel, N. Multi Scale Experimental Study of Concrete Rheology: From Water Scale to Gravel Scale. Mater. Struct. 2006, 39, 189–199. [Google Scholar] [CrossRef]
  15. Tseng, H.C. A Constitutive Equation for Fiber Suspensions in Viscoelastic Media. Phys. Fluid. 2021, 33, 071702. [Google Scholar] [CrossRef]
  16. Morton, T. Multiscale Materials Modeling Workshop Summary Report; FHWA-HRT-13-072; Federal Highway Administration: Washington, DC, USA, 2013. [Google Scholar]
  17. Tang, J.; Gao, C.; Li, Y.; Xu, J.; Huang, J.; Xu, D.; Hu, Z.; Han, F.; Liu, J. A Review on Multi-Scale Toughening and Regulating Methods for Modern Concrete: From Toughening Theory to Practical Engineering Application. Research 2024, 7, 0518. [Google Scholar] [CrossRef] [PubMed]
  18. Fan, D.; Lu, J.X.; Liu, K.; Ban, J.; Yu, R.; Poon, C.S. Multi-Scale Design of Ultra-High Performance Concrete (UHPC) Composites with Centroplasm Theory. Compos. B Eng. 2024, 281, 111562. [Google Scholar] [CrossRef]
  19. Li, H.; Addai-Nimoh, A.; Kreiger, E.; Khayat, K.H. Methodology to Design Eco-Friendly Fiber-Reinforced Concrete for 3D Printing. Cem. Concr. Compos. 2024, 147, 105415. [Google Scholar] [CrossRef]
  20. Mahaut, F.; Mokéddem, S.; Chateau, X.; Roussel, N.; Ovarlez, G. Effect of Coarse Particle Volume Fraction on the Yield Stress and Thixotropy of Cementitious Materials. Cem. Concr. Res. 2008, 38, 1276–1285. [Google Scholar] [CrossRef]
  21. Teng, L.; Zhu, J.; Khayat, K.H.; Liu, J. Effect of Welan Gum and Nanoclay on Thixotropy of UHPC. Cem. Concr. Res. 2020, 138. [Google Scholar] [CrossRef]
  22. Meng, W.; Valipour, M.; Khayat, K.H. Optimization and Performance of Cost-Effective Ultra-High Performance Concrete. Mater. Struct. 2017, 50, 29. [Google Scholar] [CrossRef]
  23. Wallevik, O.H.; Feys, D.; Wallevik, J.E.; Khayat, K.H. Avoiding Inaccurate Interpretations of Rheological Measurements for Cement-Based Materials. Cem. Concr. Res. 2015, 78, 100–109. [Google Scholar] [CrossRef]
  24. Moreno, D.G. Minimizing the Negative Effect of Pumping on SCC Freeze-Thaw Durability; Missouri University of Science and Technology: Rolla, MO, USA, 2020. [Google Scholar]
  25. Ma, S.; Qian, Y.; Kawashima, S. Experimental and Modeling Study on the Non-Linear Structural Build-up of Fresh Cement Pastes Incorporating Viscosity Modifying Admixtures. Cem. Conc.r Res. 2018, 108, 1–9. [Google Scholar] [CrossRef]
  26. Feys, D.; Riding, K.; Moreno, D.G.; Salinas, A.; Wehar, A. Influence of Casting Conditions on Durability and Structural Performance of HPC-AR: Changes In Workability And Air-Void System Of Concrete Due To Pumping, United States; University Transportation Centers (UTC) Program: Rolla, MO, USA, 2020. [Google Scholar]
  27. Feys, D.; Verhoeven, R.; De Schutter, G. Fresh Self Compacting Concrete, a Shear Thickening Material. Cem. Concr. Res. 2008, 38, 920–929. [Google Scholar] [CrossRef]
  28. ASTM C109 Standard Test Method for Compressive Strength of Hydraulic Cement Mortars (Using 2-in. or Cube Specimens). Annu. Book ASTM Stand. 2016, 4, 1–10. [CrossRef]
  29. Maranzano, B.J.; Wagner, N.J. The Effects of Particle Size on Reversible Shear Thickening of Concentrated Colloidal Dispersions. J. Chem. Phys. 2001, 114, 10514. [Google Scholar] [CrossRef]
  30. Vandenberg, A.; Wille, K. Evaluation of Resonance Acoustic Mixing Technology Using Ultra High Performance Concrete. Constr. Build. Mater. 2018, 164, 716–730. [Google Scholar] [CrossRef]
  31. Flatt, R.J.; Martys, N.; Bergstrom, L. The Rheology of Cementitious Materials. MRS Bull. 2004, 29, 314–318. [Google Scholar] [CrossRef]
  32. Artelt, C.; Garcia, E. Impact of Superplasticizer Concentration and of Ultra-Fine Particles on the Rheological Behaviour of Dense Mortar Suspensions. Cem. Concr. Res. 2008, 38, 633–642. [Google Scholar] [CrossRef]
  33. Roussel, N. A Thixotropy Model for Fresh Fluid Concretes: Theory, Validation and Applications. Cem. Concr. Res. 2006, 36, 1797–1806. [Google Scholar] [CrossRef]
  34. Roussel, N. Rheological Requirements for Printable Concretes. Cem. Concr. Res. 2018, 112, 76–85. [Google Scholar] [CrossRef]
  35. Roussel, N.; Ovarlez, G.; Garrault, S.; Brumaud, C. The Origins of Thixotropy of Fresh Cement Pastes. Cem. Concr. Res. 2012, 42, 148–157. [Google Scholar] [CrossRef]
  36. Graybeal, B. Design and Construction of Field-Cast UHPC Connections; Federal Highway Administration: McLean, VA, USA, 2014; FHWA-HRT-14-084. [Google Scholar]
  37. Wu, J.D.; Guo, L.P.; Fei, X.P.; Lyu, B.C.; Chen, B. Synergistic Effects of Silica Fume and Slag on the Microstructure and Mechanical Behaviors of Ultra-High-Strength and High-Ductility Cementitious Composites. Constr. Build. Mater. 2023, 367, 130169. [Google Scholar] [CrossRef]
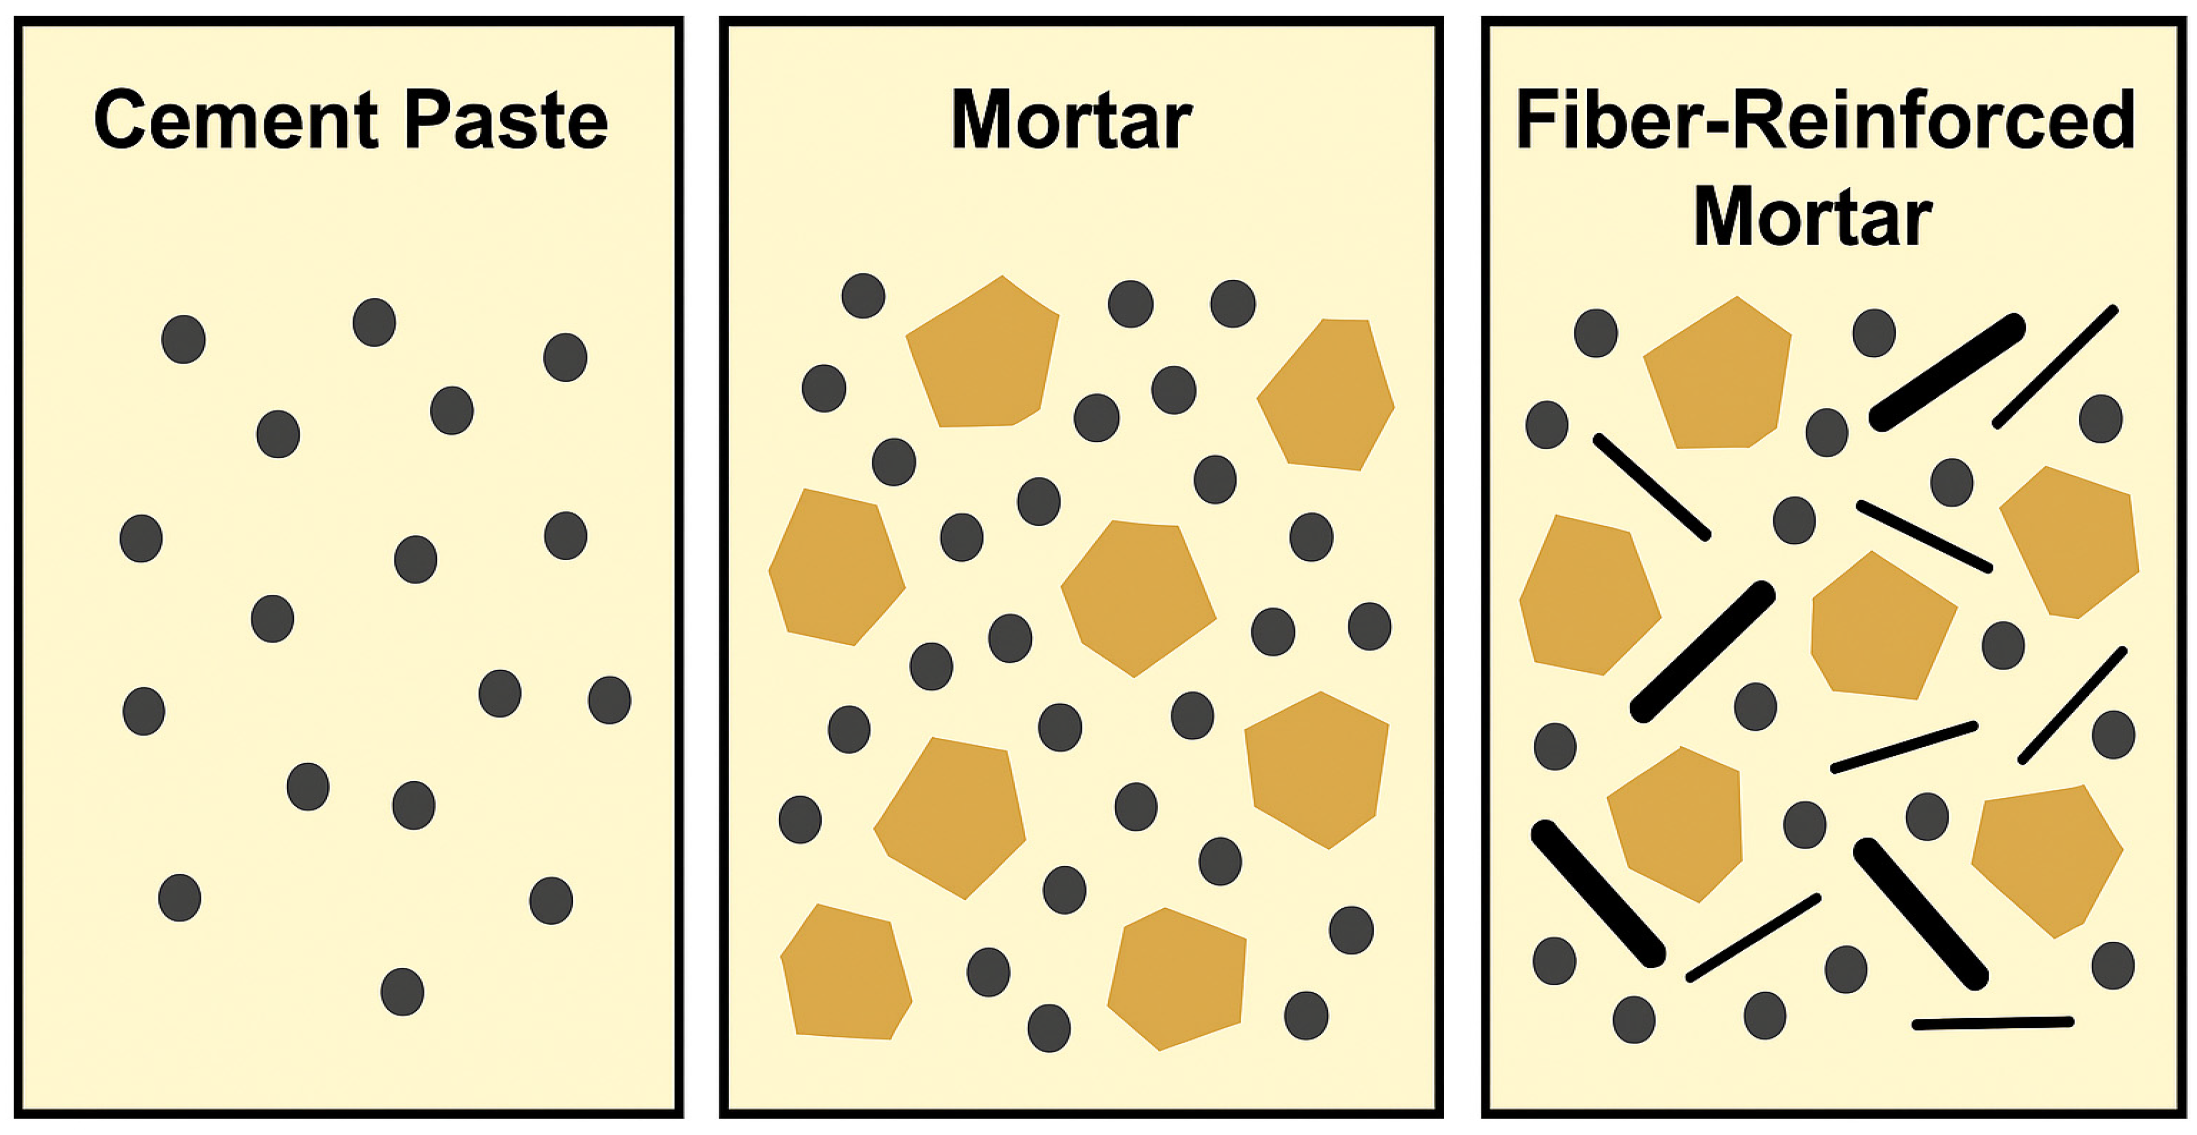
Figure 1. Diagrammatic illustration of the samples at the paste, mortar, and UHPC scales.
Jcs 09 00638 g001
Figure 2. (a) Anton Paar, and (b) Shear protocol.
Jcs 09 00638 g002
Figure 3. (a) Measurement of the static yield stress, and (b) modeling of the thixotropy.
Jcs 09 00638 g003
Figure 4. (a) Recorded torque and rotational velocity data Contec 6 rheometer; and (b) Torque rotational velocity relationship.
Jcs 09 00638 g004
Figure 5. Mechanical properties testing. (a) Compressive strength, (b) flexural strength, and (c) tensile strength.
Jcs 09 00638 g005
Figure 6. Effect of the w/b ratio on the (a) R-T curves, and (b) shear stress-apparent viscosity curves.
Jcs 09 00638 g006
Figure 7. (a) The effect of the cement type on flow curves, and (b) The degree of shear thickening against the w/b.
Jcs 09 00638 g007
Figure 8. Variations in the critical shear stress with SP dosage.
Jcs 09 00638 g008
Figure 9. Plot of the actual values against the predicted values obtained by the modified Bingham model.
Jcs 09 00638 g009
Figure 10. The flow curves of the cement and binder pastes made with a w/b of 0.20.
Jcs 09 00638 g010
Figure 11. The flow curves of the binder paste with a w/b of (a) 0.24, (b) 0.22, (c) 0.18, and (d) 0.16.
Jcs 09 00638 g011
Figure 12. The flow curves of the mortar mixtures prepared with a w/b of (a) 0.24, (b) 0.2, and (c) 0.16.
Jcs 09 00638 g012
Figure 13. The flow curves of the investigated UHPC mixtures.
Jcs 09 00638 g013
Figure 14. Comparison of the (a) paste mixture against the mortar mixture for the 80C10SL10SF-0.24 mixture and the (b) mortar mixture against UHPC90C10SF-0.24.
Jcs 09 00638 g014
Figure 15. The effects of the w/b on the (a) heat flow and the (b) cumulative heat of paste with Type III.
Jcs 09 00638 g015
Figure 16. The effects of the cement type on the (a) heat flow and the (b) cumulative heat.
Jcs 09 00638 g016
Figure 17. The effects of the w/b in 90C10SF on the (a) heat flow and the (b) cumulative heat.
Jcs 09 00638 g017
Figure 18. The effects of the SF and SL on the (a) heat flow of paste mixture and the (b) cumulative heat paste mixtures.
Jcs 09 00638 g018
Figure 19. The effects of the binder composition with a fixed w/b of 0.18 on the (a) heat flow and the (b) cumulative heat.
Jcs 09 00638 g019
Figure 20. The effects of the w/b on the compressive strength of the paste mixtures with Type III cement.
Jcs 09 00638 g020
Figure 21. The effects of the cement type on the (a) tensile behavior and the (b) flexural behavior.
Jcs 09 00638 g021
Table 1. The chemical properties of the cementitious materials (%).
%Type IIIType 1LSFSL
MgO2.152.410.59.5
Al2O34.623.770.79.2
SiO2 20.1218.0395.536.8
P2O50.060.08--
SO32.012.53--
Cl0.050.06--
K2O0.520.73--
CaO65.8068.33-37.1
TiO20.200.27--
Mn2O30.2690.087--
Fe2O33.903.590.30.76
MgO2.152.410.59.5
Table 2. The mixture proportions of the UHPC at the three scales.
LevelType IIIType 1LSFSLw/bs/bSteel
Fiber
No. of Mixtures
PasteType1L100--0.16; 0.18; 0.20; 0.22; 0.240026
Type III100--
90C10SF9010-
90C10SL90-10
80C20SF8020-
80C20SL80-20
80C10SF10SL801010
Mortar90C10SF9010-0.16; 0.20; 0.241.209
90C10SL90-10
80C10SF10SL801010
UHPC90C10SF9010-0.20; 1.22%3
90C10SL90-10
80C10SF10SL801010
Table 3. The slump flow and temperature after mixing.
LevelCement Typew/cSP Dosage
(% by Mass of Binder)
Slump Flow Before Jolting (mm)Slump Flow After Jolting (mm)Water Temperature
(°C)
Temperature After Mixing
(°C)
PasteType III0.241.0170210--
0.221.419225020.337.3
0.202.418023021.736.5
0.183.519624519.938.7
0.164.819025220.640.0
Type 1L0.240.417524020.227.3
0.220.61852202929.9
0.201.019024020.327.9
0.181.4194246-28.8
0.162.0195254-30.3
Table 4. The dynamic rheology results for the cement paste mixtures.
LevelCementw/cSP Dosage (% by Mass of Binder)τ0 (Pa)µ (Pa·s)c (Pa·s2)
PasteType III0.241.023.10.50.018
0.221.4000.064
0.22.4000.099
0.183.5001.730
0.164.852.02.01.970
Type 1L0.240.46.80.80.013
0.220.68.000.051
0.201.0000.064
0.181.4000.158
0.162.0000.140
Table 5. The R2 values obtained by the modified Bingham model.
Cementw/cR2 (×10−8)
Type III0.2445
0.2219,992
0.213,409
0.1837,328
0.16214
Type 1L0.246
0.22138
0.203866
0.1823,384
0.1610,000
Table 6. The thixotropy results of the cement paste.
Cementw/b5 min15 min30 mintfloc
(Pa)
Athix
(Pa/min)
tfloc × Athix
(Pa2/min)
Type III0.248781081128485513.511,553
0.2262121181624245
0.20500794108750019.69798
0.181332112891335.2692
0.162583554542056.51337
Type 1L0.2417437357016813.22217
0.22382721105937422.68446
0.2031762192531720.36432
0.1822641760722612.72873
0.16212325210.132.5
Table 7. The rheological parameters of the tested binder paste mixtures.
Mixturew/bSP Dosage (%)τ0 (Pa)µ (Pa·s)c (Pa·s2)
90C10SL0.241.342.71.80.24
80C20SL0.9220.00960.30
80C10SF10SL0.883.25.20
90C10SF0.221.3200.711.50
80C20SF1.7236200
80C20SL1.677.85.90.25
80C10SF10SL1.214210.60.089
90C10SF0.182.2150.813.30.20
90C10SL1.81310.220.051
80C20SL1.819500.52
80C10SF10SL2.231022.20
90C10SF0.162.6440790
80C20SF6.7390340
90C10SL3.1483.45.2
80C20SL4.20011
80C10SF10SL7.2185180
Table 8. The rheological parameters of the tested mortar mixtures.
Mixturew/bSP
Dosage (%)
τoµc
Type III cement
90C10SF0.242.5255210
90C10SL2.8259200.18
80C10SF10SL1.61288.80
90C10SF0.203.0161360
90C10SL3.8109670
80C10SF10SL2.1393340
Type 1L cement
90C10SF0.165.3140740
90C10SL6.7560.81052.05
80C10SF10SL5.751781010
Table 9. The thixotropy results of the mortar mixtures.
Mixturew/b5 min15 min30 minτfloc
(Pa)
Athix (Pa/min)τfloc × Athix (Pa2/min)
Type III
90C10SF0.245466938962919.82850
90C10SL3445337217012885
80C10SF10SL270421572142101429
90C10SF0.205088231138348217285
90C10SL681105114225722414,125
80C10SF10SL1290176619409502120,597
Type 1L
90C10SF0.163684765832287.21639
90C10SL3243994972595.781500
80C10SF10SL4445516572667.01889
Table 10. The dynamic rheology results of the UHPC mixtures.
Mixturew/cSP Dosage (%)τoµc
90C10SF0.201.539190
90C10SL1.252.723.41.62
80C10SL10SF1.2292.966.80
Table 11. The thixotropy results of the UHPC mixtures.
Mixturew/cτs at 5 minτs at 15 minτs at 30 minτfloc
(Pa)
Athix
(Pa/min)
τfloc × Athix
(Pa2/min)
90C10SF0.201712573421335.7755
90C10SL33358979928815.54473
80C10SL10SF8251054133852317.18939
Table 12. The compressive strengths of the UHPC mixtures.
UHPCw/c3-d,
MPa
Avg, MPa (COV., %)7-d,
MPa
Avg, MPa
(COV.,%)
28-d,
MPa
Avg, MPa
(COV.,%)
56-d,
MPa
Avg, MPa
(COV,%)
Type 1L cement
90C10SF0.2104.7111.1
(5)
129.6132.1
(3.8)
139136.6
(2.15)
114.4116.3
(1.9)
113.9128.8135118.8
114.8137.8134115.8
90C10SL100.0103.3
(2.9)
74.576.3
(3.9)
85.389.7
(5.0)
107.4107.9
(2.9)
105.974.589.6110.3
104.079.794.3105.9
80C10SF10SL93.999.2
(5.2)
108.5113.9
(5)
119.0116.6
(3.1)
136.9131.4
(4.2)
99.7113.5118.4127.5
104.0119.8112.5129.8
Disclaimer/Publisher’s Note: The statements, opinions and data contained in all publications are solely those of the individual author(s) and contributor(s) and not of MDPI and/or the editor(s). MDPI and/or the editor(s) disclaim responsibility for any injury to people or property resulting from any ideas, methods, instructions or products referred to in the content.