Article

The Influence of Microstructural Heterogeneities on the Thermal Response of CFRTP Composite Tapes at the Ply-Scale

by
Mabel Palacios
1 and
Anaïs Barasinski
2,*
1
Institut des Sciences Analytiques et de Physico-Chimie Pour l’Environnement et les Matériaux (IPREM), Université de Pau et des Pays de l’Adour, E2S UPPA, CNRS, 64053 Pau Cedex, France
2
Institut Clément Ader (ICA), Université de Toulouse, CNRS, ISAE-SUPAERO, UPS, INSA, IMT Mines Albi, Campus Jalard, 81013 Albi, France
*
Author to whom correspondence should be addressed.
J. Compos. Sci. 2025, 9(11), 617; https://doi.org/10.3390/jcs9110617 (registering DOI)
Submission received: 3 October 2025 / Revised: 2 November 2025 / Accepted: 6 November 2025 / Published: 9 November 2025

Abstract

The thermal response of Carbon Fiber Reinforced Thermoplastic (CFRTP) tapes under short-term localized heating is critical for automated manufacturing processes. Conventional homogenized models often overlook microstructural heterogeneities that can promote non-uniform heating and affect the quality of the consolidated part. In this work, we combine insights from infrared thermography with finite element simulations at the fiber scale built on micrographs extracted from real tapes to quantify the effect of individual heterogeneities—including surface roughness, thickness variation, fiber agglomeration, and porosity—on thermal propagation. Three modeling configurations were compared under identical conditions: a full microstructure model; a simplified geometry-aware model (where the real geometry is taken into the account, including the surface roughness and thickness variability, but the properties of the domain are considered as a homogeneous-equivalent material); and a homogeneous-equivalent baseline with flat borders and uniform thickness. Results show that porosity effects depend strongly on location and orientation: large, horizontally aligned pores near the heated surface produce the highest gradients. Surface roughness, on the other hand, exerts dominant effects on surface temperature non-uniformity with respect to thickness variation and fiber distribution. These findings demonstrate that accounting for microscale heterogeneities is essential to achieve more accurate, optimized, and application-tailored analyses of CFRTP tapes in advanced manufacturing.

1. Introduction

In high-performance sectors such as aerospace, automotive, construction, and energy, CFRTP composites are highly valued for their advantageous balance of mechanical strength, lightweight nature, long-term durability, and resistance to fatigue, creep, impact, and corrosion [1,2,3,4,5,6]. These attributes, combined with their recyclability, have contributed to a constant increase in the global consumption of carbon-fiber-reinforced composites in recent decades [7], leading to numerous research groups to study their particular behavior.
However, despite their anisotropic and heterogeneous nature, composite studies frequently employ homogenization techniques that assume idealized and rather uniform microstructures [8,9,10,11]. This approach often overlooks inherent microstructural heterogeneities, such as pores, fiber agglomerates, matrix-rich regions, surface roughness, and thickness variations, that can affect their macroscopic performance [12,13,14]. While the influence of these features on mechanical properties can be found in the literature, their role in the thermal response remains less explored.
Understanding thermal behavior is particularly critical for unidirectional (UD) CFRTP tapes, where thermally conductive carbon fibers are embedded in a low-conductivity thermoplastic matrix. During automated manufacturing processes such as filament winding (FW) and automated tape placement (ATP), brief and localized heating—typically via infrared (IR) lamps or lasers—is applied to pre-impregnated tapes before consolidation. This requires the surface temperature of the tapes to be kept within a carefully defined processing window that secures proper interlaminar bonding without degrading the matrix [15,16,17].
Microstructural heterogeneities directly impact the stability of this thermal window. For instance, pores or matrix-rich regions may act as local insulators, while fiber agglomerations can accelerate heat conduction. Consequently, monitoring surface temperature considering realistic microstructural features is crucial to achieve high-performance structures such as aerospace laminates or hydrogen storage vessels. By explicitly accounting for these inherent heterogeneities, this study moves beyond models that embrace idealized material architectures and aims to characterize their impact on thermal fields during processing, treating these features as intrinsic characteristics that can be potentially tolerated as long as their effects are well understood. This approach seeks to propose robust and cost-effective manufacturing solutions.
Previous research on the role of composite microstructure has predominantly focused on the influence of constituent volume fractions on thermal and mechanical properties [18,19]. For example, it is well documented that thermal conductivity decreases systematically with increasing pore volume fraction [20], and that fiber content often raises the thermal conductivity [21,22], the glass-transition temperature, and storage modulus [18]. Even so, pore studies traditionally remain limited to treating pores as a volume fraction parameter with an impact on mechanical properties [23,24,25], neglecting the potential impact of their size, shape, and spatial distribution on thermal behavior. Similarly, although some studies have considered fiber distribution, they predominantly focus on the impact on mechanical properties [26,27,28,29]. In addition, the thickness variation and surface roughness effects on thermal response remain largely unexplored.
This work addresses that gap by quantifying, at the ply scale, how individual heterogeneities affect the thermal field during brief localized heating of UD CFRTP tapes, and by evaluating when a homogenized model can be safely used. Because composite microstructures comprise a complex combination of features, analyzing their impact collectively can mask the severity of each contribution. Therefore, this study isolates the impact of individual heterogeneities such as pores, fiber distribution, surface roughness, and thickness variations to better understand their specific effects on the thermal response.
We use IR thermography to qualitatively document non-uniform surface temperature distribution in actual tapes and to identify possible trends. We then quantify the impact of these heterogeneities on the thermal field through transient simulations performed on real microstructures obtained from segmented micrographs. For comparability, we focus on surface temperature profiles across the tape width and analyze the maximum gradient within these profiles as a metric of non-uniform heat propagation.
For a more detailed characterization of microstructural features, micrograph-derived subdomains that isolate the contribution of (i) surface roughness, (ii) thickness variation, (iii) fiber distribution, and (iv) porosity are employed. A homogeneous-equivalent (HE) model is presented as a baseline for comparison with the microstructure-aware model, and a simplified model to capture the most important contributions driven by the tape structures is proposed. The results show that, under short, localized heating, characteristic of AFP and FW, the impact of porosities is governed primarily by their position along the tape thickness as well as their orientation (when considered as single ellipsoid-like entities). Meanwhile, surface roughness has a dominant effect on surface temperature non-uniformity over thickness variation and fiber distribution, which have a secondary effect. Remarkably, in microstructures rich in heterogeneities, the surface thermal gradient can become sufficiently high to push local temperatures beyond processing limits—even when mean values remain nominally safe—emphasizing the necessity of incorporating these heterogeneities in thermal models to optimize processing parameters and ensure product quality.

2. Materials and Methods

2.1. Materials

Unidirectional (UD) CFRTP composites with a polyamide-based matrix supplied as pre-impregnated tapes were selected for this study. Material properties, including density, thermal conductivity, and specific heat capacity at room temperature (23 °C) for both matrix and fiber phases, are summarized in Table 1. Material properties are assumed to be constant and isotropic for the sake of simplicity without loss of generality.
Transverse section micrographs were taken from a set of 13 tapes with a high-resolution digital microscope (KEYENCE VHX-7000, Keyence Corporation, Osaka, Japan) to obtain detailed visual information about the microstructural heterogeneities and enable the incorporation of real-life microstructures into composite analysis through images. The tapes exhibited an average thickness of 240 µm and an average width of 25.4 mm (1 inch). Each sample was subsampled by acquiring micrographs of 1200 µm in width (≈5 times the thickness) to increase statistical representativeness. Additionally, surface topography was acquired with the same microscope to quantify surface roughness. These samples were intentionally selected to encompass a wide range of features resulting from different manufacturing conditions, instead of limiting the study to highly optimized tapes with targeted uniform fiber distribution, low pore content, and consistent thickness. Thus, the obtained micrographs reflect high variations in fiber distribution with matrix-rich areas and fiber agglomerates, higher void content, thickness variation, and different grades of surface roughness. Figure 1 illustrates the contrast between real-life microstructures (Figure 1a) and the idealized material architecture typically adopted for homogeneous-equivalent material modeling (Figure 1b). Table 2 reports the microstructural parameter variability across samples.
In this study, the thermal response of the CFRTP tapes described above was examined within the framework of continuous manufacturing applications such as ATP and FW, where direct and localized heating is applied to the material over a short period of time. The region of interest in this analysis is the transversal section of the tapes at the end of the heating phase and immediately before the nip point. In this region, the front face of the incoming tape is exposed to the heating beam, and the back face is in contact with the consolidation roller; whereas for the substrate, the front face is receiving the heating beam and the back face is in contact with the underlying laminate, as illustrated in Figure 2. This region is critical because the tape temperature must be kept within the processing window recommended by the manufacturer for the thermoplastic matrix (230 °C minimum, and 270 °C maximum). Lower temperature values may lead to poor consolidation, while temperatures above this range at any point in the tape can cause degradation of the polymer chains in the matrix.

2.2. Experimental Setup for Infrared Thermography

An experimental setup was designed to replicate in a laboratory environment the brief and localized heating of ATP/FW. A single tape was used in this configuration in order to isolate the effects of the tape structure at the ply scale, avoiding the influence of potential processing defects such as wrinkling, tape misalignment, or gaps between layers that might be present in a laminate.
The setup, schematized in Figure 3, consists of placing samples 25 mm in length and tightly fixing both ends on supports. An infrared (IR) lamp of 1000 W is placed with perpendicular incidence onto one of the sample faces, which is defined as “front face”, while the opposite face, referred to as “back face,” is exposed to air and loses heat through air convection. The IR lamp is operated through a power regulator to achieve the desired temperature on the surface of the tapes. A thermal camera (FLIR A700, Teledyne FLIR, Wilsonville, OR, USA) is employed to record the surface temperature of the tapes. Measurements of the front face as well as of the back face of the samples were taken separately while heated for 5 to 30 s. Temperature data was processed using FLIR Research Studio Software (version 3.0 Teledyne FLIR, Wilsonville, OR, USA), taking into account ambient condition parameters. Additionally, for proper emissivity calibration, the emissivity of each sample was determined experimentally using the FLIR software calculator (version 3.0 Teledyne FLIR, Wilsonville, OR, USA).
Surface temperature profiles along the sample’s width were extracted from the obtained thermograms (edges were excluded to minimize boundary effects), and the maximum gradient along each profile was taken as an indicator of non-uniform surface temperature distribution driven by the structural heterogeneity. The temperature evolution in time was also tracked during both heating and cooling of the samples. Examples of the obtained temperature profiles are presented in Section 3.1, where we discuss the differences between samples.
Since thermal imaging only allows for obtaining surface temperature data, through-thickness temperature distributions were studied using numerical simulations. Given the small tape thickness, direct contact measurement using thermocouples was avoided to prevent perturbation to the system due to additional thermal resistance, imperfect contact, and slower response times relative to non-contact methods. Therefore, the quantitative impact of individual heterogeneity types is carried out using the numerical model described in Section 2.3.

2.3. Numerical Model

2.3.1. Governing Equation and Boundary Conditions

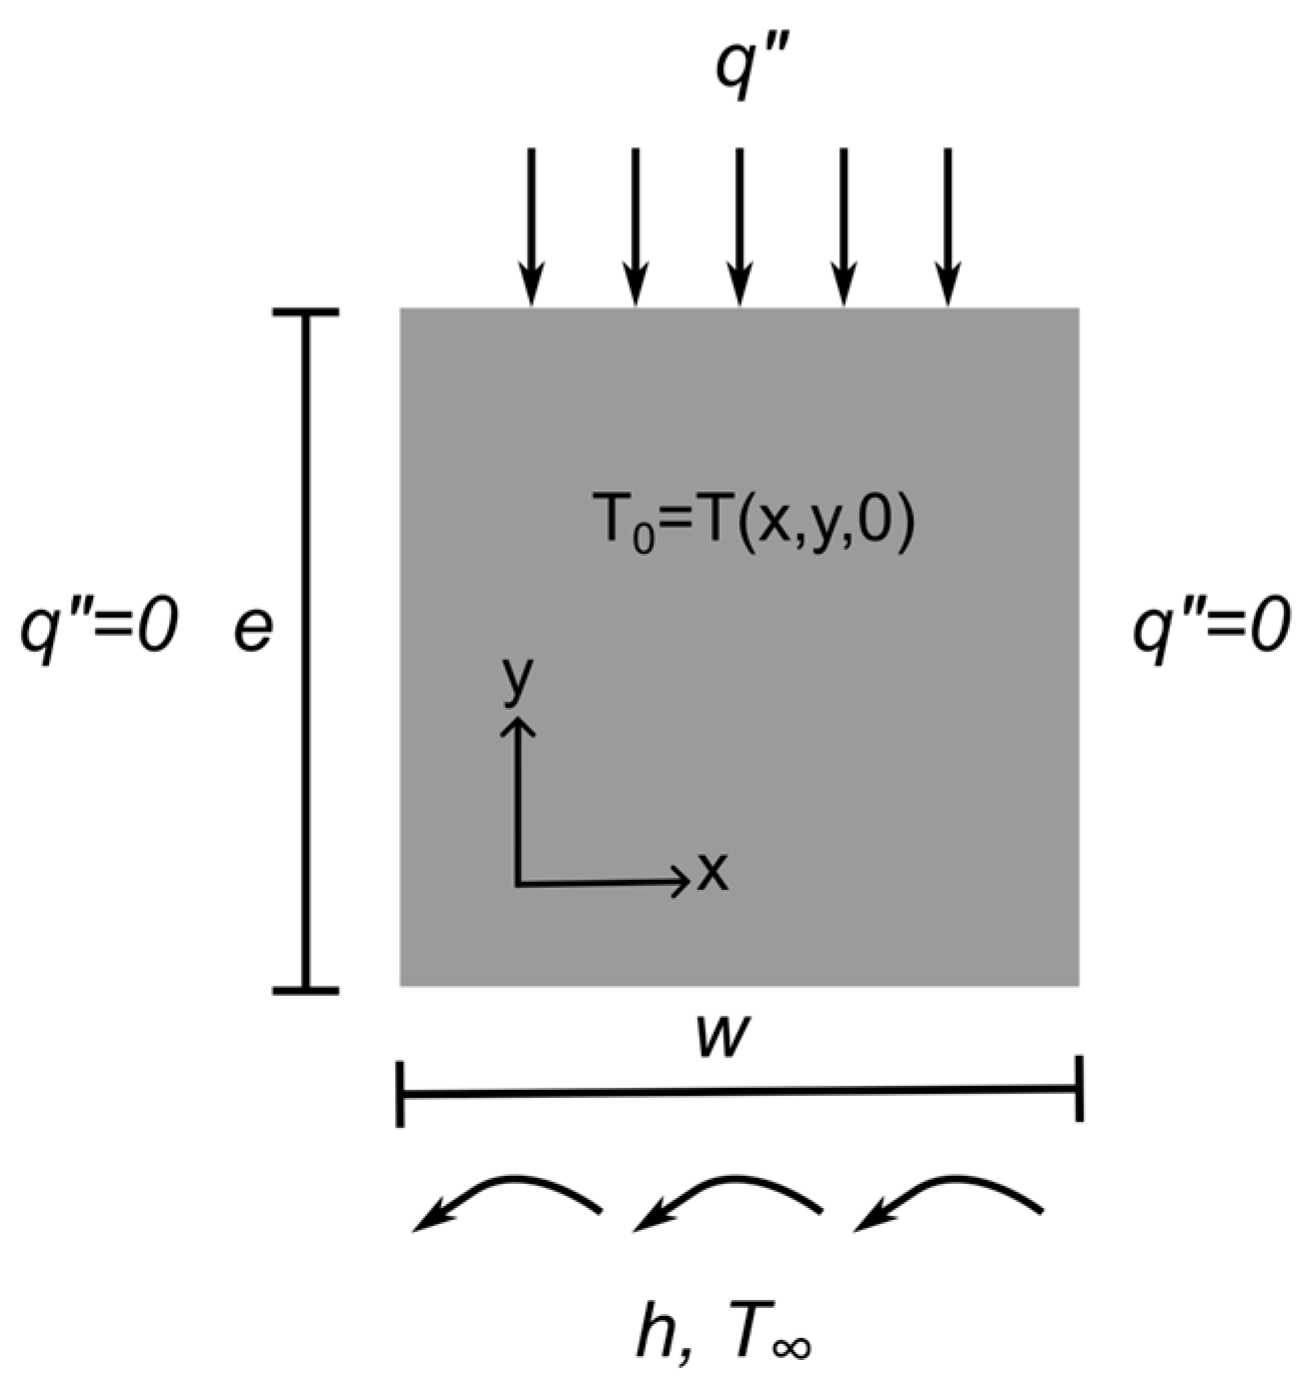
A two-dimensional numerical model was developed to simulate the temperature evolution across the transversal section of the tapes. The transient heat equation, expressed in its general form by Equation (1), was solved with a finite element method (FEM) using the ABAQUS software (version 6.14 Dassault Systèmes Simulia Corp., Johnston, RI, USA):
ρ c p   T t = · ( Κ   T )
where ρ is the material density, c p is the specific heat capacity, T is the temperature, t is the time, and Κ is the thermal conductivity tensor. Here, perfect thermal contact at fiber-matrix interfaces was assumed.
The initial condition was set as a homogeneous temperature across the whole domain, with T0 = 23 °C, corresponding to the ambient temperature.
A uniform heat flux, q , was applied on the top boundary of the transversal section as a Neumann boundary condition:
n · Κ   T = q
where n is the unit normal vector to the boundary. The heat flux was applied for a duration of t = 0.4 s, with a magnitude of q = 50 × 10−3 Wm−2. These values were chosen so that t represents the time during which a segment of the tape is actively receiving the heating beams, based on an assumed placement speed of 100 mm/s and an effectively illuminated length of approximately 40 mm (values consistent with Zaami et al. [35]). Under this scheme, the total incident energy received by the top boundary ( q t ) seeks to match the energy delivered by the infrared lamp in the experimental setup during 5 s, allowing shorter simulations and reducing the computational cost.
The bottom boundary was modeled as a Robin (convective) boundary condition:
n · Κ   T = h (   T T )
with T = 23 °C as the ambient temperature. The heat transfer coefficient, h , was initially set to 10 Wm−2 K−1 to represent air convection [36]. Additionally, higher values of h were considered to simulate contact with a compacting roller ( h = 100 Wm−2 K−1) and with a substrate ( h = 400 Wm−2 K−1) [36].
The lateral boundaries were considered adiabatic to reflect symmetry:
n · Κ   T = 0
A schema with the boundary conditions applied to a section of width w , and thickness e , is presented in Figure 4 for illustration.

2.3.2. Model Configurations: Full Microstructure, Isolated Heterogeneities, and Homogeneous Equivalent

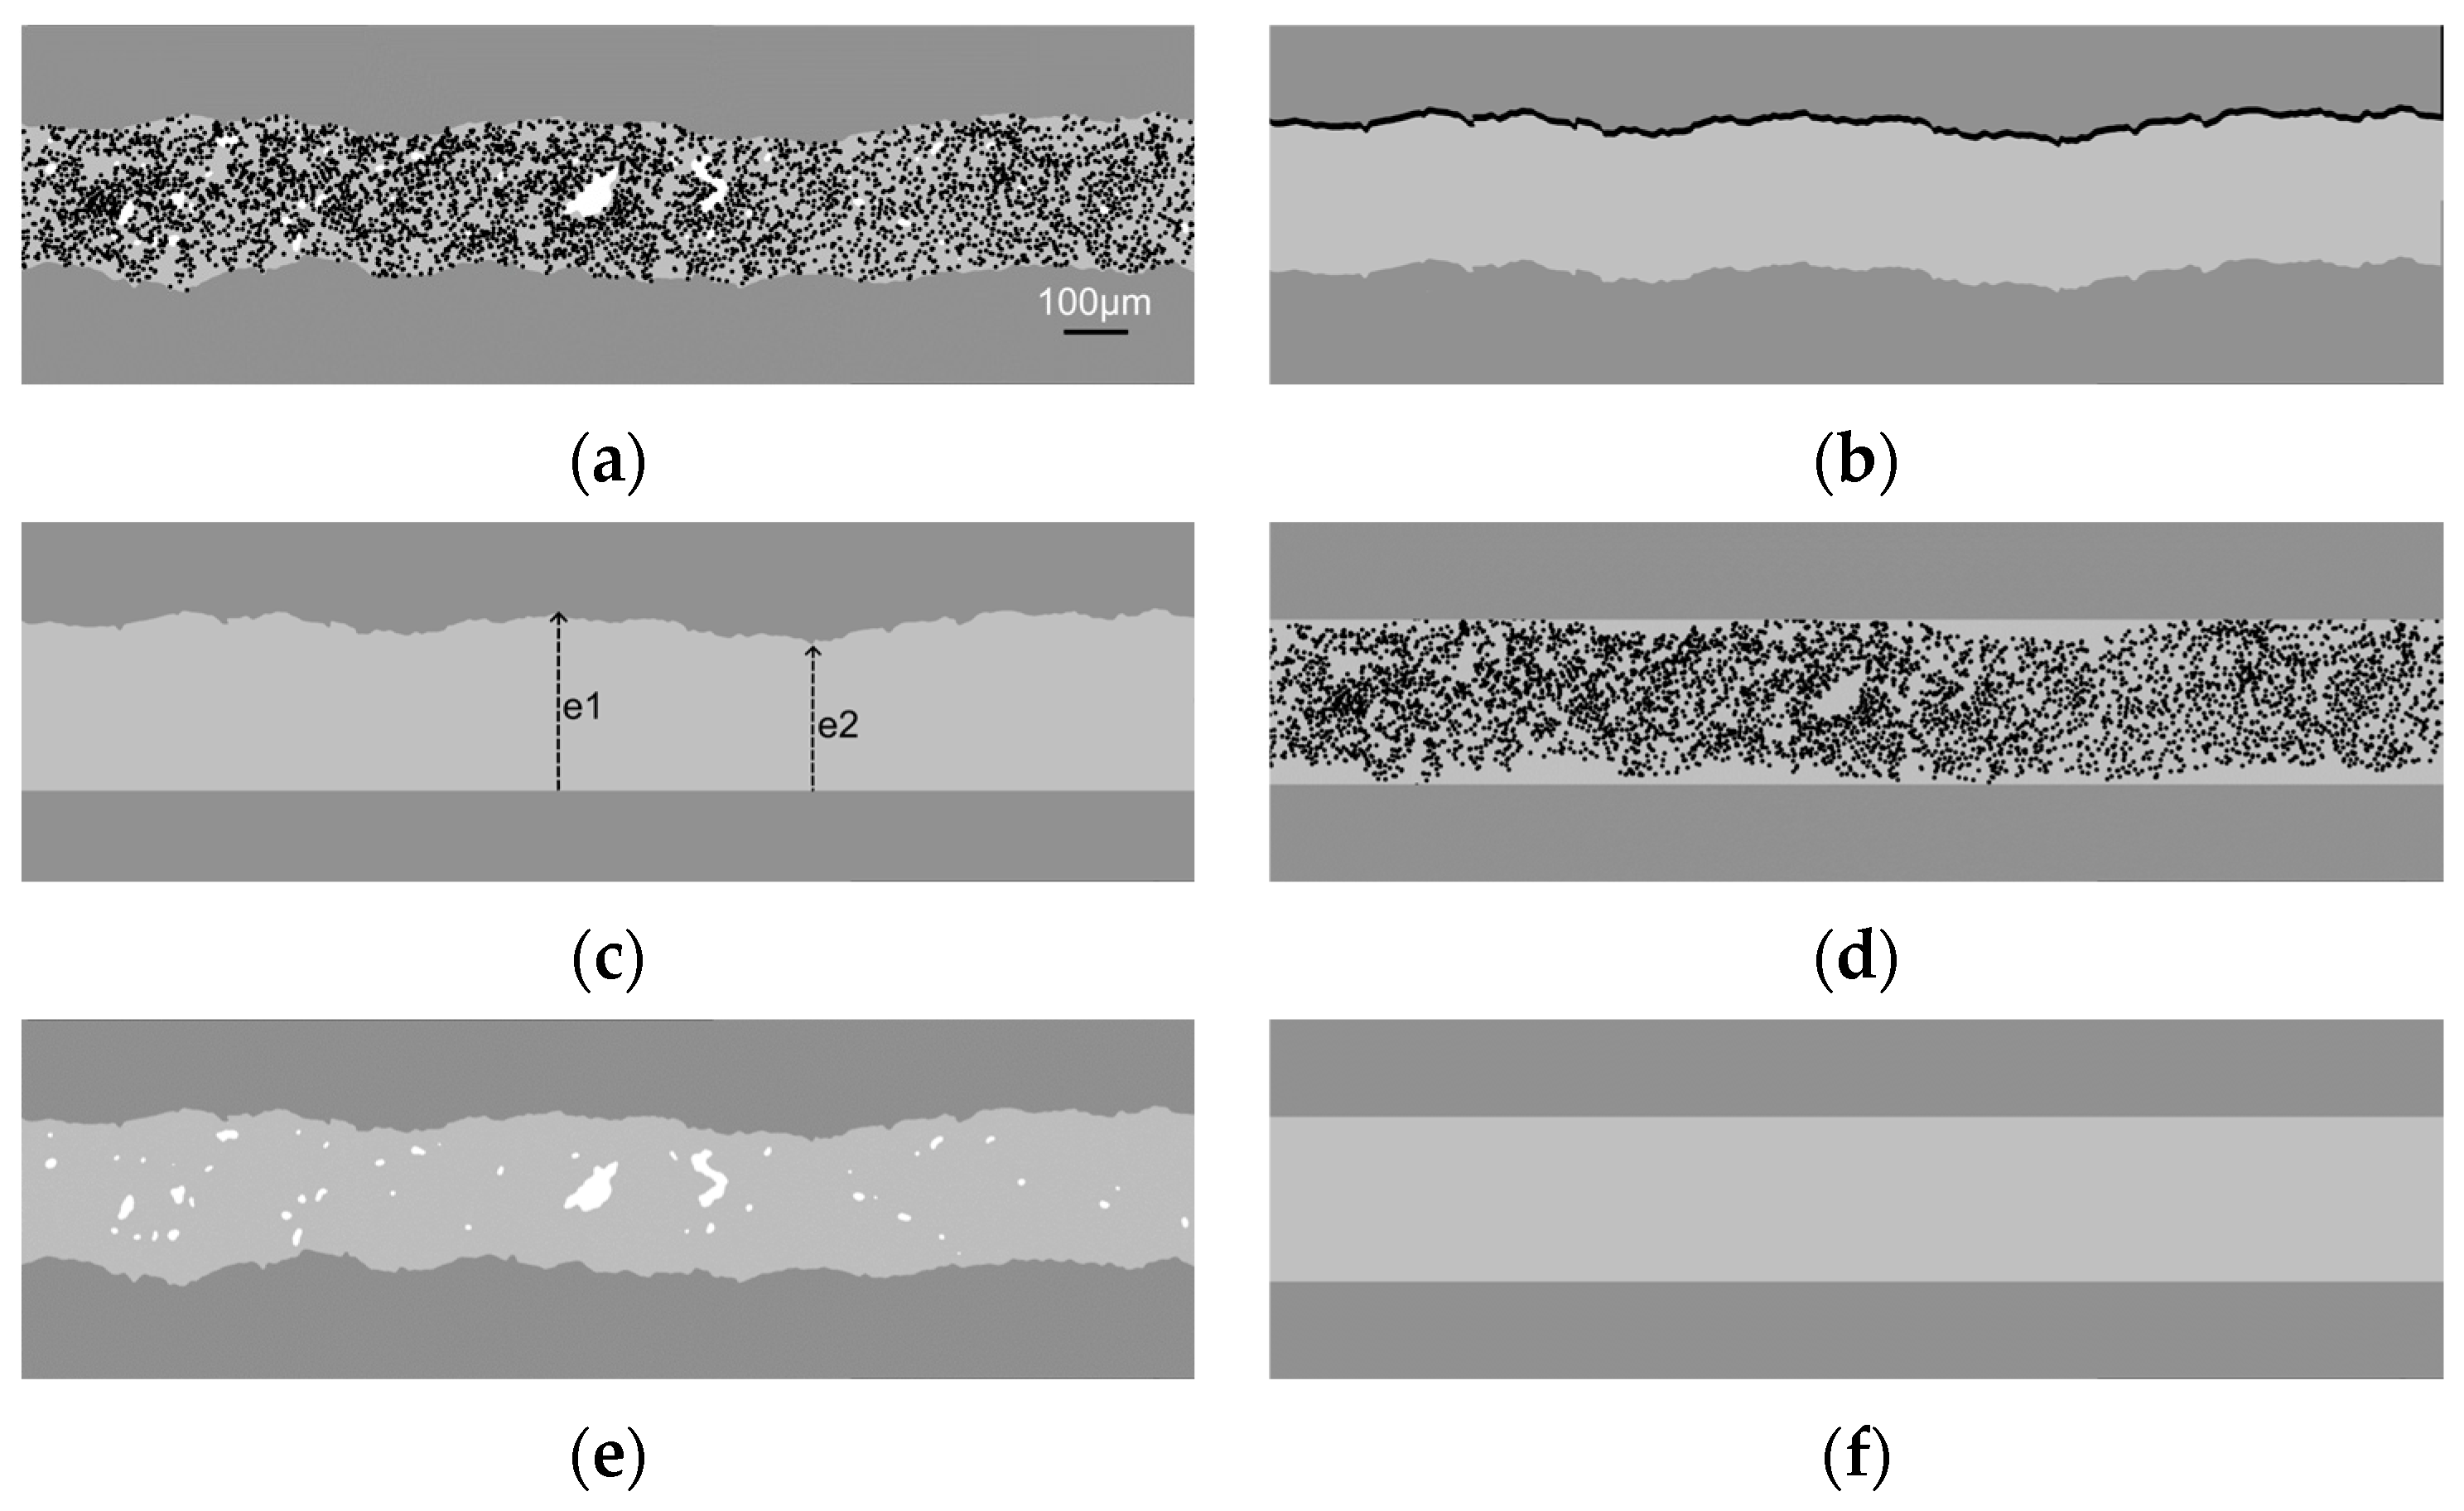
A set of model configurations, presented in Figure 5, was defined to analyze the influence of microstructural features on the thermal behavior of CFRTP tapes. First, micrograph-derived subdomains were generated directly from segmented micrographs, including the full microstructure comprising fibers, matrix, and pores. Afterwards, isolated heterogeneity models were constructed to individually analyze the effects of different types of microstructural heterogeneities (surface roughness, thickness variation, fiber distribution, and pores). Finally, a HE model with effective thermal properties and uniform thickness was used as a baseline for comparison.
All subdomains were defined to have the height from the actual tape thickness, ensuring that the top and bottom boundaries in the model correspond to the physical surfaces in the experiment and thus apply the same boundary conditions. In the width direction, each subdomain represents only a fraction of the total tape width rather than the entire transversal section to reduce computational costs. Surface roughness and thickness variation were included explicitly by reconstructing the non-planar top boundary and local thickness from the transversal sections (Figure 5b–c). We ran roughness-only, thickness-only, and combined configurations to isolate their effects.
Prior to segmentation, image enhancement was performed to improve visual quality. Fiber positions were extracted from the micrographs with the Circle Finder App from MATLAB (version R2023a MathWorks, Natick, MA, USA) , and fibers were reproduced as perfectly filled circles of 7 µm in diameter.
Special consideration was given to the pore models, as the irregular nature of real pore shapes requires complex meshing. To reduce the associated computational cost, each pore contour extracted from micrographs was replaced by an equivalent ellipse. The ellipses preserve area, centroid, major axis orientation, and aspect ratio of the original pore. All pores were considered to be filled with air and were assigned corresponding properties in all calculations (Table 1). Simulations were run on representative cases to compare temperature distribution on geometries with real pores and geometries with their ellipse equivalent, showing a maximum error of less than 0.3% in the temperature field.
As the impact of porosity volume fraction on the thermal behavior of composites has been commonly characterized by diverse studies, the present work focuses instead on the influence of pore location and geometry at a constant pore content. To decouple these effects, a single pore analysis was conducted varying: (a) pore centroid depth d, from the heated surface; (b) aspect ratio AR = H/V, (major axis/minor axis); and (c) major-axis orientation relative to the heated surface.
A sensitivity study was conducted to quantify the individual impact of models considering different types of heterogeneities. The objective is to identify which type of heterogeneities have a higher impact on the temperature field and whether any of them exhibit second-order effects or even negligible effects. The temperature field propagation resulting from the different model configurations was subsequently analyzed and compared to the temperature propagation on a homogeneous-equivalent model, and a simplified model that considers the most critical heterogeneities is proposed.

2.3.3. Meshing

Triangular meshes were generated for each sample using a MATLAB-implemented routine. Contour smoothing was applied to the borders of every segmented image to avoid sharp edges and reduce mesh distortion. As the fibers’ transversal section is relatively small compared to the tapes’ transversal section, a sufficiently fine mesh was necessary to capture the microstructural features.
A mesh-convergence study was carried out by progressively refining the element size and comparing the resulting temperature fields until successive refinements produced negligible changes in the monitored temperature values. While local temperature variations at the fiber scale were more sensitive to element size, the maximum temperature gradients at the ply scale were significantly less affected. The chosen mesh size, therefore, represented a compromise between geometric fidelity and computational cost. A coarser mesh was chosen for the case studies where fiber presence was not considered; for these cases, mesh convergence was re-evaluated to ensure that the monitored temperature metrics were not affected.

3. Results

3.1. Experimental Evaluation of Surface Temperature Response

Temperature profiles shown in Figure 6a illustrate the surface temperature evolution over time across a reference line along the sample width. Initially, at room temperature, the surface temperature is essentially uniform, displaying flat temperature profiles. Upon exposure to the heat flux, the temperature profiles exhibit noticeable peaks and valleys, revealing clear non-uniformities. As the heating time increased, the profiles maintained their shape, suggesting a direct influence from the microstructural features of the tape. The same pattern was observed during cooling, reinforcing the interpretation that thermal gradients are not random, but structurally induced.
For consistency in comparison between samples, the maximum temperature gradient across the width, ΔTmax, was normalized with respect to the mean temperature of each profile according to:
T m a x * = T m a x T m e a n × 100 %
This approach is represented in Figure 6b for two representative samples: one with the smoothest surface (Rt = 7.67 µm) and the other with the highest roughness (Rt = 57.41 µm). After 5 s of heating under the same input conditions, the smooth sample exhibited a thermal gradient across its width of less than 10 °C ( T m a x * around 6%), whereas the rough surface revealed higher temperature gradients that reached values up to 35 °C ( T m a x   * around 36%). Even though these samples also differ in other microstructural features, including fiber distribution and pore content, the pronounced difference in surface texture and the consequent response of temperature profiles suggest that surface roughness plays a dominant role in the temperature field response under direct heating.
Temperature measurements were also performed on the back face of each sample, applying emissivity corrections for the non-irradiated surface as previously described. These measurements revealed that the back faces exhibited a more uniform temperature distribution, obtaining a value of T m a x * of around 20% for the sample with the roughest surface. This behavior was expected due to the absence of direct radiation and the fact that thermal diffusion across the transversal section helps to reduce thermal gradients.
Overall, the experimental observations put in evidence that assuming a uniform surface temperature could result in important over- or under-estimations when dealing with real tapes that differ from the idealized geometries. Samples with higher surface roughness consistently exhibited larger temperature gradients across their width.

3.2. Numerical Modeling Results

Numerical simulations were performed on the configurations introduced in Section 2.3. and the corresponding results are presented in three parts: sensitivity to isolated heterogeneities, specific effects of pore geometry and location, and model comparison of microstructure-aware and HE models.

3.2.1. Sensitivity Analysis of Isolated Microstructural Heterogeneities

To categorize the contributions of the isolated heterogeneities, the top surface temperature profiles resulting from the previously discussed model configurations, considering fiber distribution, surface roughness, and thickness variation, are shown in Figure 7, and have been previously normalized according to:
T * = T T m e a n
for direct comparison. Among these features, surface roughness produces the largest temperature gradient on the front face, achieving a T m a x * of 8% for a Rt = 10.34 µm. A thickness variation of 50 µm can produce a T m a x * of 5%, while the fiber distribution has second-order effects, showing a T m a x * of 2% for a fiber volume content of 35%. Although the results presented in this work were obtained considering a polyamide-based matrix, they remain valid for other polymer matrices since the fiber-to-matrix thermal property ratio is roughly the same.

3.2.2. Pores Geometry and Location Effects

The results of the single pore analysis are summarized in Figure 8. In Figure 8a, the effects of the pore centroid depth d, on the normalized surface gradient are shown, exhibiting that shallow pores near the heated surface produce strong gradients, while increasing the pore depth diminishes its effect. The same figure shows that back face temperature gradients are less sensitive to pore depth. These results were consistent for pore contents of 2%, 5% and 8%.
Figure 8b illustrates the effects of pore geometry, defined for the elliptical pore model by the aspect ratio (shape) and the orientation of the major axis relative to the heated surface for a fixed pore content ( V a = 5%) and a fixed centroid depth (25% of thickness). The largest surface temperature gradients, and therefore the highest temperature non-uniformity, were produced by pores with their major axis parallel to the heated surface (horizontal pores), while pores with the major axis perpendicular to the front face had a lower impact. Additionally, it can be seen that elongated horizontal pores with a higher aspect ratio (H/V >> 1) produce higher gradients than circular ones with the same area and centroid depth, and that vertical pores (H/V < 1) have less impact on the surface temperature gradients.

3.2.3. Microstructure-Aware vs. HE Model

Since the computational expense of full-microstructure simulations is very high, a simplified model that can capture the dominant contributions of real microstructure features was considered. Based on the previous sensitivity analysis results, surface roughness, thickness variation, and pores preferentially oriented parallel to the tape surface and located near the heated surface (within approximately the upper 50% of the thickness) produce a higher impact on surface temperature gradients. Consequently, the proposed model preserves the surface roughness profile, thickness variation, and includes pores located in the top half of the tape. In contrast, fibers are not explicitly modeled, as their second-order influence on thermal behavior does not justify the significant computational cost associated with the fine meshing required for fiber resolution.
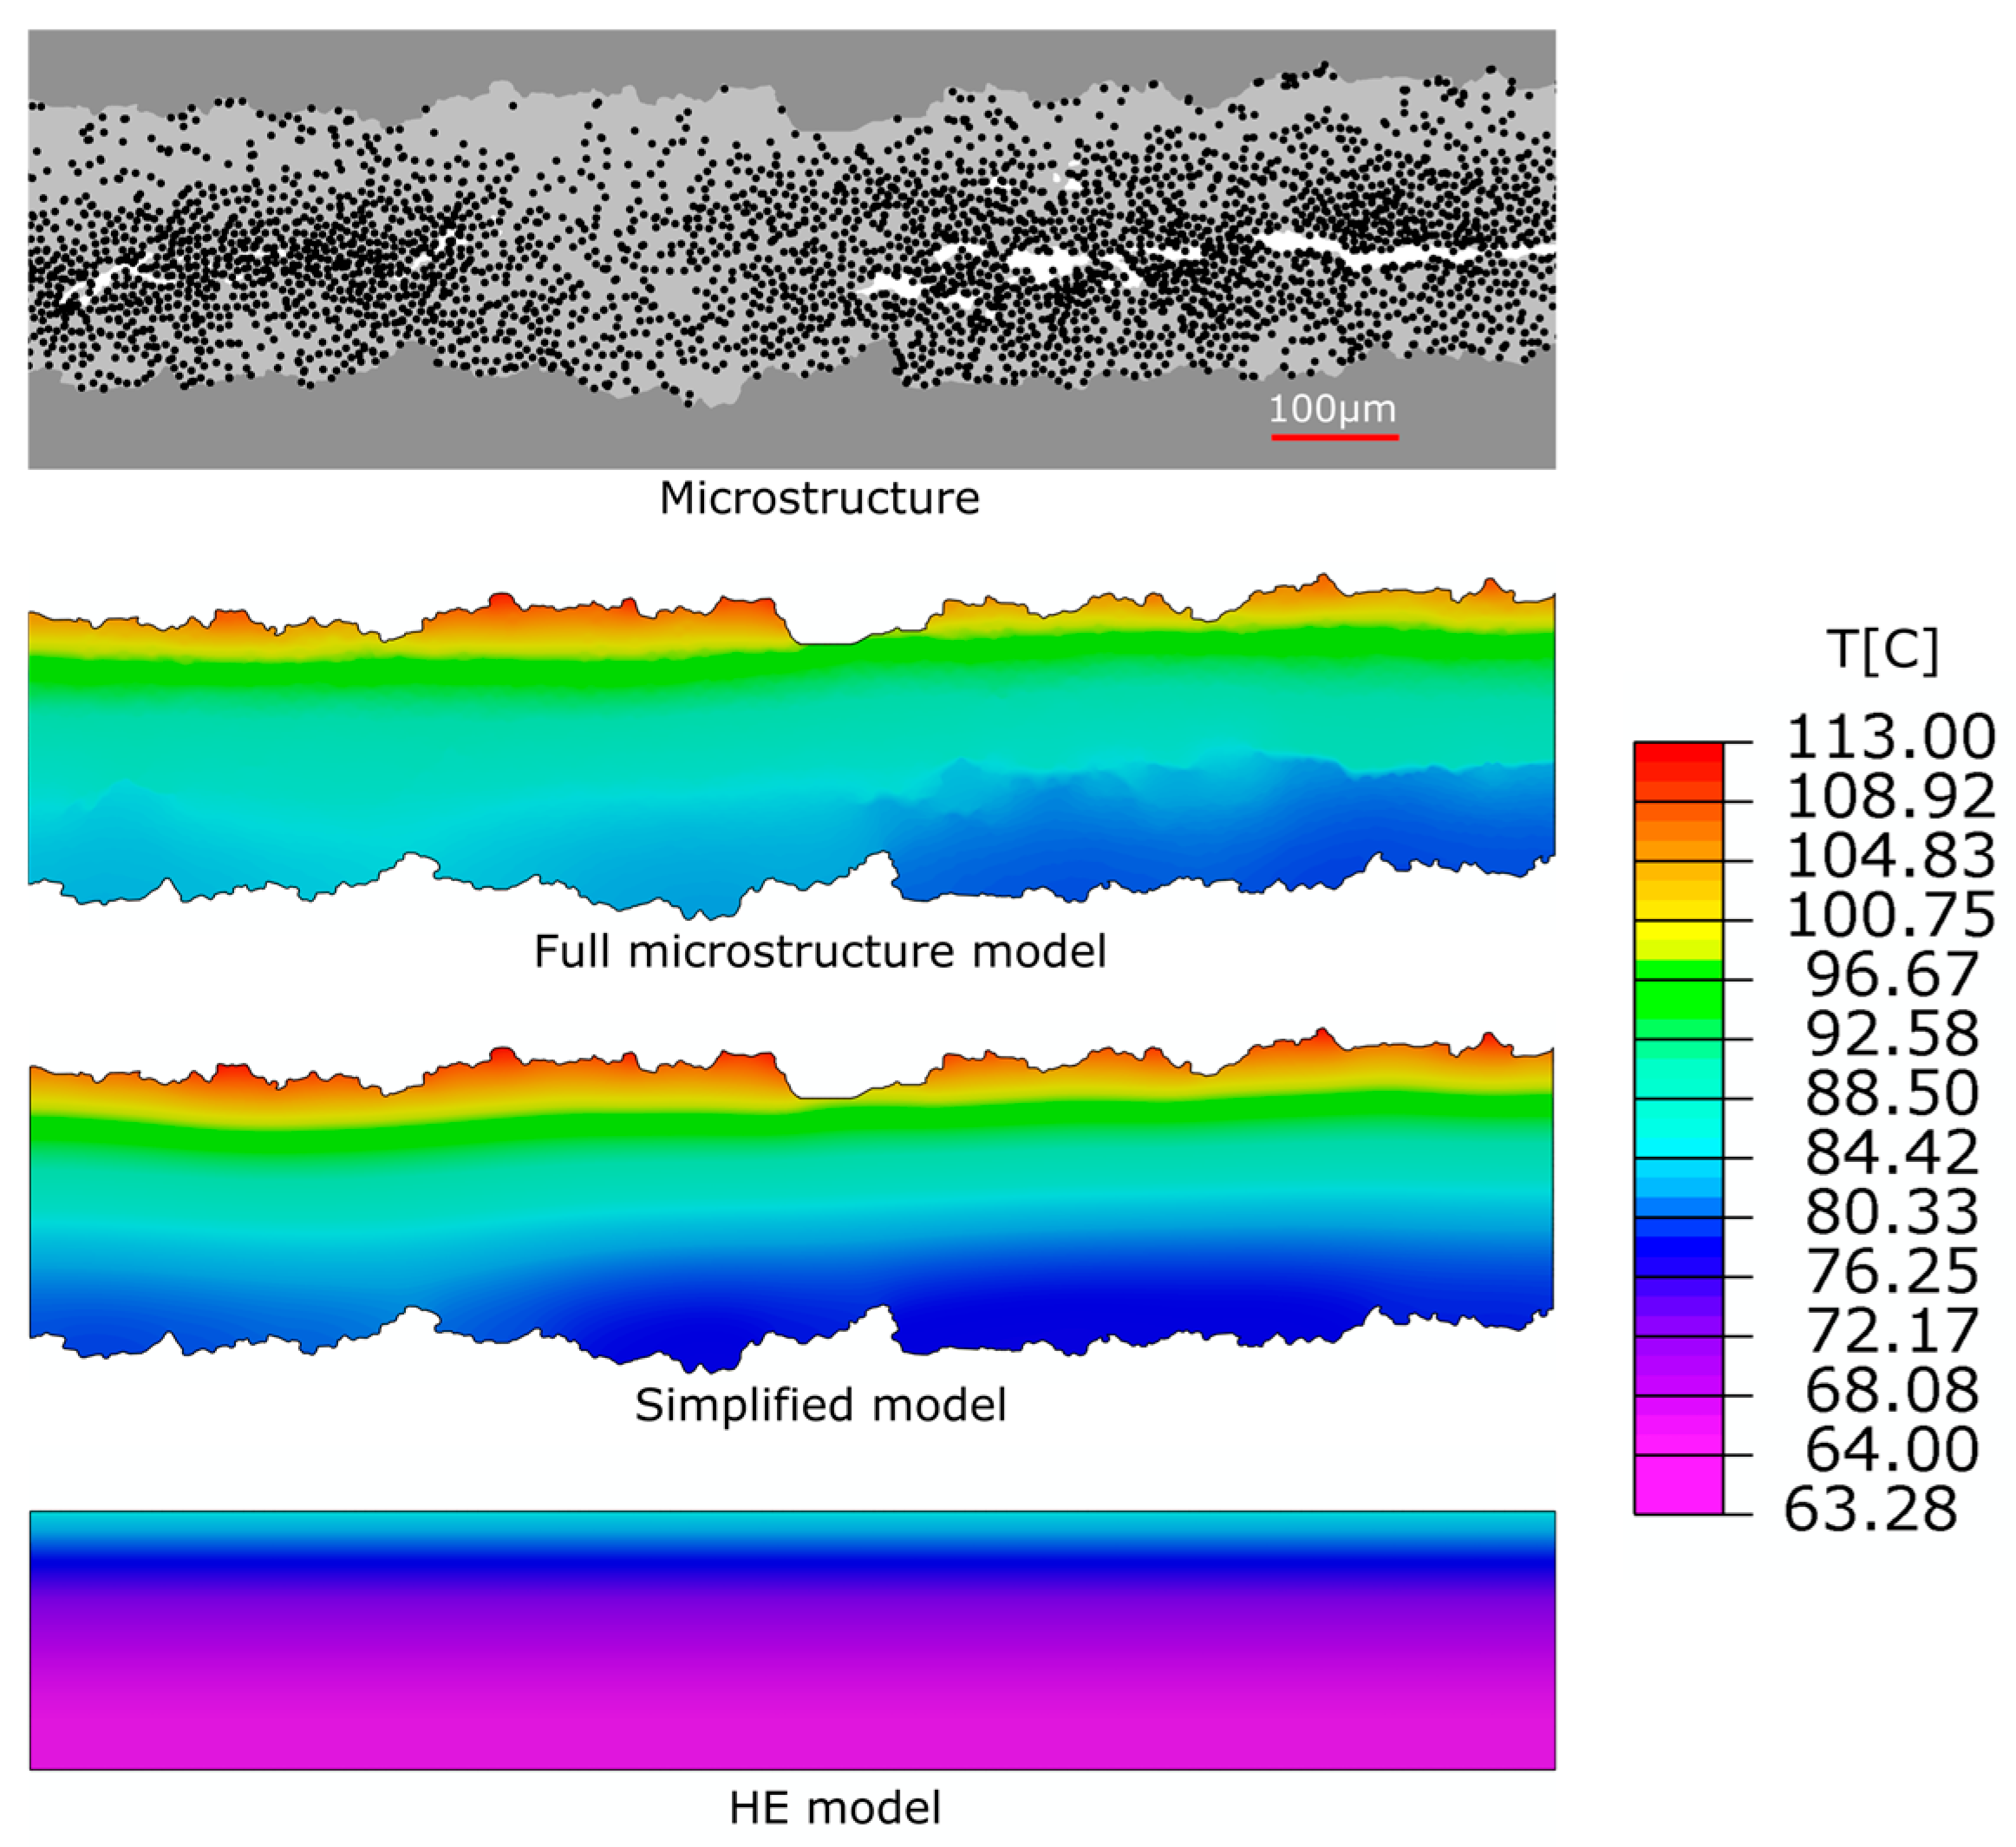
For illustration, Figure 9 displays the microstructure of a representative sample (Vf = 35%, Va = 2.5%, Rt = 54.7 µm, and an average thickness of 240 +/−50 µm) and the resulting through-thickness temperature fields under identical boundary conditions, with a full-microscale model, the proposed simplified model, and a HE model.
In the HE model, the composite was replaced by a homogeneous phase whose effective properties were computed from its constituents and phase fractions. Density and specific heat were obtained using the rule of mixtures, while the through-thickness thermal conductivity is evaluated with the inverse rule of mixtures. As a result, the HE model exhibits a strictly linear through-thickness thermal gradient; this uniform temperature evolution, characteristic of homogenized models, cannot capture local hot or cold spots.
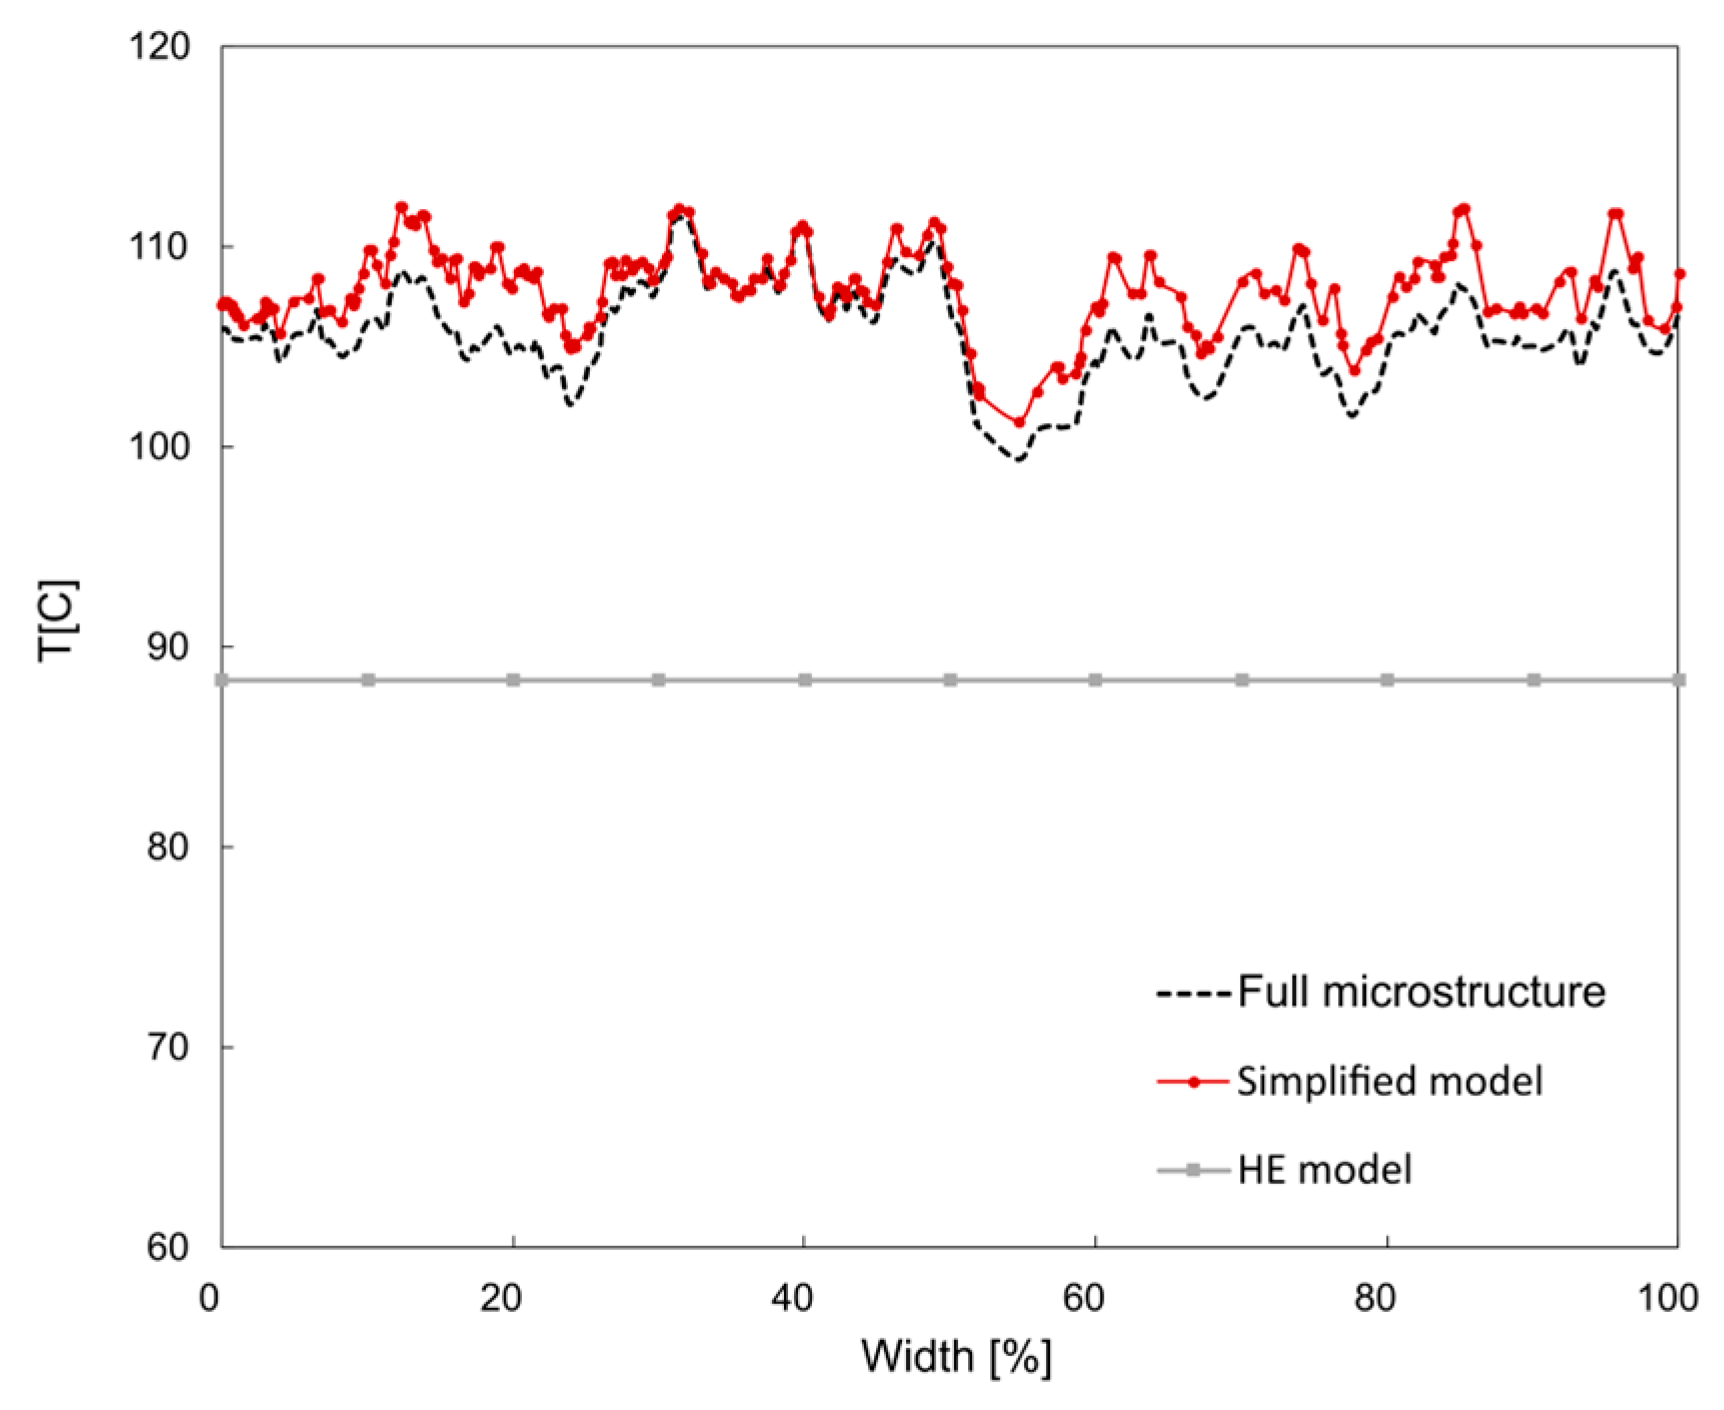
In contrast, the full microstructure model, exhibits clear non-uniform thermal gradients across the transverse section. Localized regions of higher temperatures are registered on the top surface, directly linked to the microstructural heterogeneities, which are better captured by the simplified model. Additionally, Figure 10 shows minimal deviation between the simplified and full-microstructure surface temperature profiles, while the HE model produces a considerably high deviation for this material architecture. Improved estimations of the effective transversal conductivity could be obtained with more elaborate micromechanical frameworks as those proposed by Rayleigh [21] or Lewis and Nielsen [21,37,38]. Nevertheless, although these frameworks can refine the estimation of effective properties, they remain homogenized approaches; when implemented within a uniform-thickness model, they fail to resolve the local temperature variations caused by thickness changes and surface roughness.
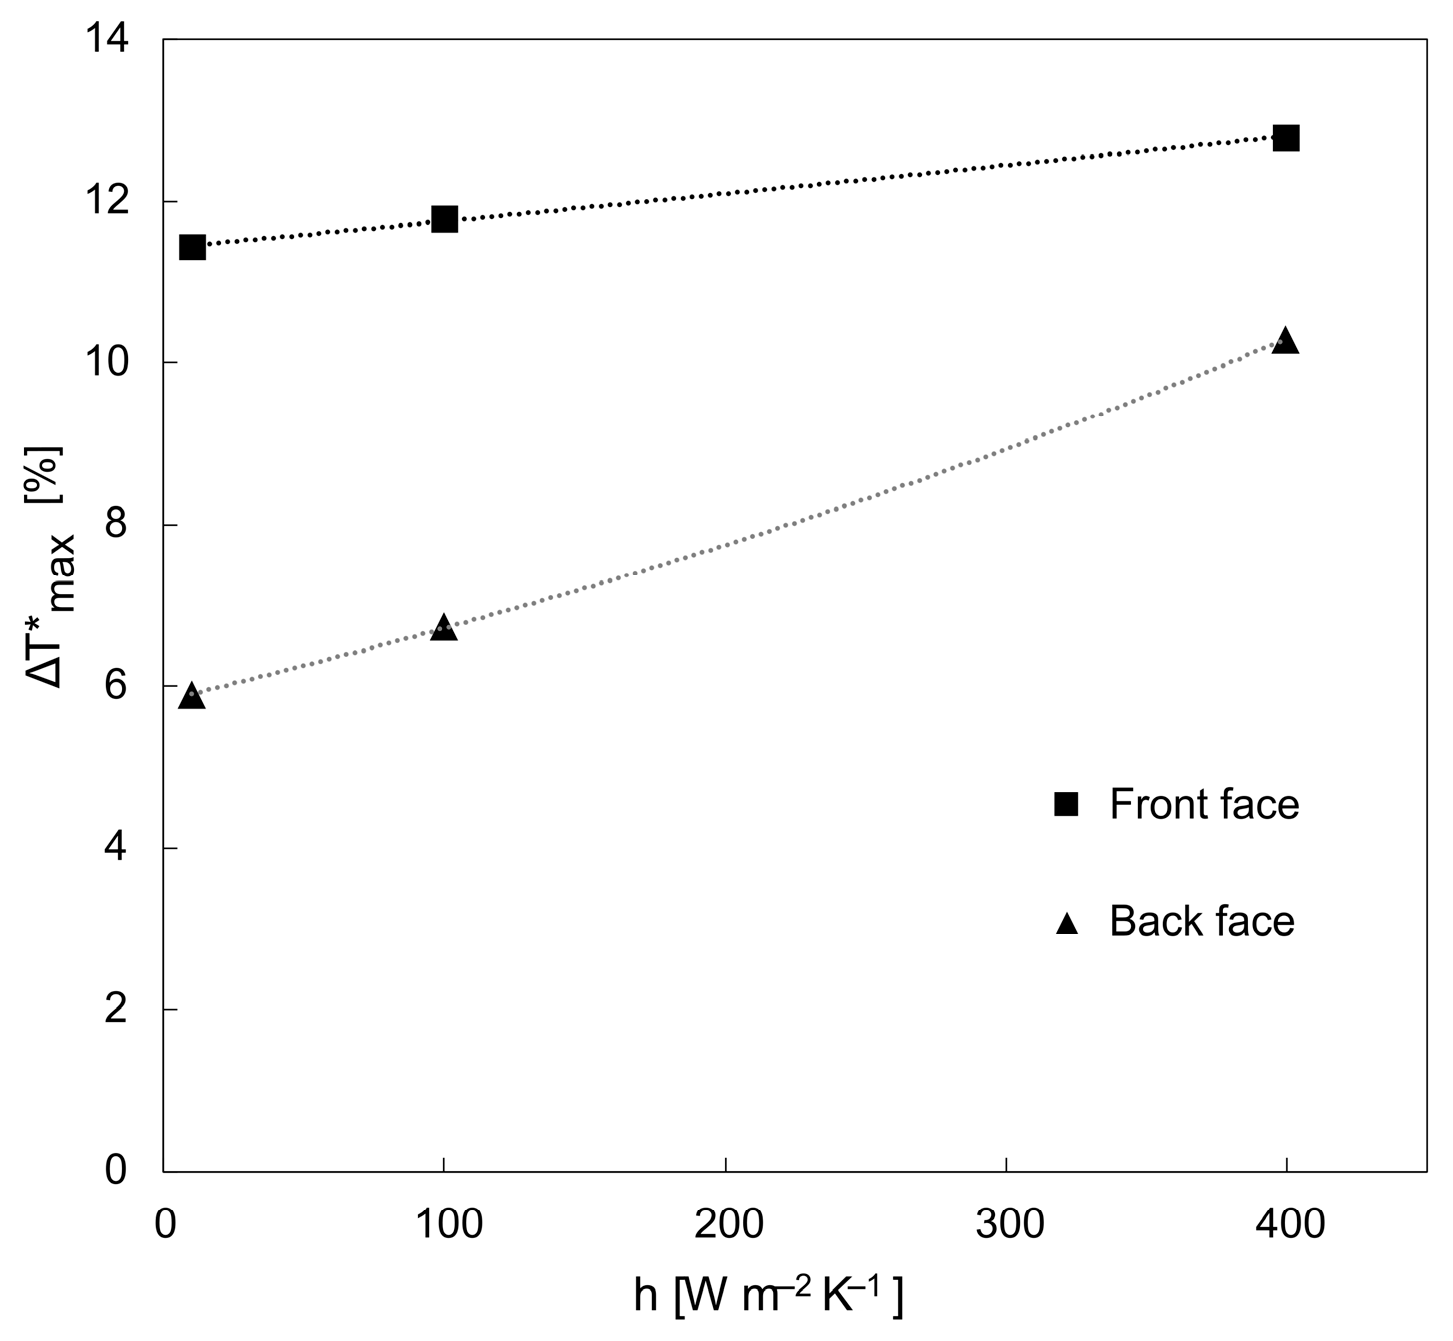
Finally, the influence of the back face boundary condition was explored. Simulations were repeated with bottom heat transfer coefficients of h = 10, 100, and 400 W m−2 K−1, corresponding, respectively, to air, underlying substrate contact, and consolidation roller contact. These exhibited that when h increases, the maximum surface gradient rises on both faces (Figure 11), confirming that typical processing conditions can amplify thermal gradients, increasing the risk of local deviations outside the processing window.

4. Discussion

4.1. On the Impact of Microstructural Heterogeneities

The combined experimental-numerical observations put in evidence that microstructural heterogeneities have an impact on thermal evolution at the ply scale, under short, localized heating. Non-uniform gradients and local hot spots detected in IR thermograms connect with the presence of microstructural heterogeneities, such as surface roughness, matrix-rich regions, fiber clusters, and pores.
Across the investigated parameters, surface roughness shows the highest impact on front face temperature non-uniformity; larger and more persistent surface temperature gradients are detected on rougher samples. Thickness variation exhibited contributions with less pronounced deviations. Fiber distribution has an impact on temperature distribution as well; however, in comparison, it can be considered as a second-order effect. Finally, the impact of pores, which act as a local thermal barrier, for a constant volume fraction, depends primarily on pore depth and orientation. Pores oriented preferentially parallel to the tape surface, located near the heated surface, generated the larger gradients in the surface temperature.
Effects on the back face are systematically diminished due to through-thickness diffusion, which attenuates the temperature gradients, yet a correlation with microstructural features is noticeable, confirming that the response retains a morphological dependence on the local architecture.
The combination of these effects can lead to either over- or underestimation of critical processing temperatures if not properly accounted for. While homogeneous-equivalent (HE) models provide a useful first-order reference suitable for tapes with scarce heterogeneities—meaning smooth surfaces, nearly uniform thickness, and small pores located away from the heated face—they lack enough accuracy under highly heterogeneous conditions. For instance, with the 230–270 °C processing window recommended for the thermoplastic matrix considered in this study, monitoring the mean front-surface temperature gradient at the recommended mean value (250 °C) might not be enough to prevent exceeding the upper limit if the involved microstructure produces thermal gradients of more than 8%, as a T m a x * > 8% implies a spread of 20 °C within this framework ( T m a x = 0.08 × 250 °C).
This highlights the necessity of microstructure-aware models that capture heterogeneity-induced hot spots during manufacturing. Similar recommendations are reported in studies on the anisotropy of the optical properties in UD tapes [39].

4.2. Numerical Model-Experiment Consistency and Limitations

It can be established from the obtained thermograms that surface temperature is not uniform; profiles maintain characteristic peaks and valleys over time in agreement with microstructure-aware simulations. Consistently, the registered gradients on the thermograms of samples with heterogeneous material architecture are incompatible with an HE model with uniform thickness, supporting the need for explicit microstructure inclusion in models for predictive fidelity.
Additionally, during the experimental measurements, more pronounced surface gradients were observed on rougher samples compared to smoother ones. The numerical models reproduce these trends when consistent normalization was applied and evidence the important influence of surface roughness and thickness variation on temperature distribution. IR measurements are sensitive to surface emissivity, ambient conditions, and camera calibration. Corrections were applied before each experiment, yet absolute temperature values may still carry some uncertainty.
These findings are valid under the heating and boundary conditions considered in this study. The sensitivity analysis using longer heating times while maintaining constant incident energy did not alter the relative trends and ranking of heterogeneities’ effects. Nevertheless, extrapolation to different heat fluxes or different heating times should be made with caution, and if needed, temperature-dependent material properties should be employed.
Because a two-dimensional model was adopted for numerical simulations, limitations could arise from three-dimensional effects that were not accounted for in this analysis.
Lastly, back-face boundary conditions corresponding to substrate/roller contact were explored numerically but not measured experimentally.

4.3. Future Work and Industrial Implications

Further studies should address 3D modeling and more realistic boundary conditions, such as partial roller-tape contact, as this could enhance the understanding and control of the manufacturing process. From an industrial perspective, the results from this study advise supervising the surface temperature along the tapes during manufacturing. As this type of monitoring might not be practical for all industrial configurations, surrogate models previously trained with tape microstructures could be used to make real-time decisions, as they are able to predict temperature fields from a given morphological image at millisecond timescales. A first demonstration along this path is presented by Ferrándiz et al. [40].

5. Conclusions

This study quantifies how specific microstructural heterogeneities shape the transient thermal behavior of UD CFRTP tapes under brief and localized heating at the ply scale. Normalized metrics were used to compare isolated effects, showing that surface roughness has an important effect on surface temperature non-uniformity.
For model selection, the following considerations are proposed: HE models can be used for smooth uniform tapes, whereas roughness/thickness-aware simplified models are preferable when surfaces are significantly heterogeneous. The influence of pores becomes critical when they are located closer to the heated surface, are horizontally oriented, and have a high aspect ratio. Although the influence of fiber distribution had a second-order effect on the obtained results, its contribution is not negligible. Therefore, explicit fiber modeling may be omitted on FEM models when computational cost becomes prohibitive for the intended applications. However, it is advised to consider surrogate models, which are able to retain their contribution without the meshing limitation, to increase thermal prediction accuracy.
From a practical perspective, controlling the mean temperature of manufacturing processes is insufficient; microstructures can easily produce thermal gradients of more than 8% on the surface temperature, which can be translated, for example, to a 20 °C underestimation on the maximum temperature for a processing window of 230 to 270 °C.

Author Contributions

Conceptualization, M.P. and A.B.; methodology, M.P.; software, M.P.; validation, M.P.; formal analysis, M.P.; resources, A.B.; writing—original draft preparation, M.P.; writing—review and editing, A.B.; visualization, M.P.; supervision, A.B.; funding acquisition, A.B. All authors have read and agreed to the published version of the manuscript.

Funding

This research was funded by the E2S-UPPA project in the framework of the Chair AWESOME and the project CIRCULAR2-ANR-23-CE10-0019-01.

Data Availability Statement

Data supporting the findings of this study are available from the corresponding author upon reasonable request. Restrictions apply to the availability of these data due to confidentiality requirements from the manufacturers.

Acknowledgments

This research has been supported by the European Alliance UNITA (101004082—UNITA—EAC-A02-2019/EAC-A02-2019-1 and 101124853—UNITA—ERASMUS-EDU-2023-EUR-UNIV).

Conflicts of Interest

The authors declare no conflicts of interest. The funders had no role in the design of the study; in the collection, analyses, or interpretation of data; in the writing of the manuscript; or in the decision to publish the results.

Abbreviations

The following abbreviations are used in this manuscript:
CFRTPCarbon Fiber Reinforced Thermoplastics
UDUnidirectional
FWFilament Winding
ATPAutomated Tape Placement
IRInfrared
HEHomogeneous-Equivalent
FEMFinite Element Method

References

  1. Teltschik, J.; Matter, J.; Woebbeking, S.; Jahn, K.; Borja Adasme, Y.; Van Paepegem, W.; Drechsler, K.; Tallawi, M. Review on Recycling of Carbon Fibre Reinforced Thermoplastics with a Focus on Polyetheretherketone. Compos. Part A Appl. Sci. Manuf. 2024, 184, 108236. [Google Scholar] [CrossRef]
  2. Yao, S.-S.; Jin, F.-L.; Rhee, K.Y.; Hui, D.; Park, S.-J. Recent Advances in Carbon-Fiber-Reinforced Thermoplastic Composites: A Review. Compos. Part B Eng. 2018, 142, 241–250. [Google Scholar] [CrossRef]
  3. Condé-Wolter, J.; Ruf, M.G.; Liebsch, A.; Lebelt, T.; Koch, I.; Drechsler, K.; Gude, M. Hydrogen Permeability of Thermoplastic Composites and Liner Systems for Future Mobility Applications. Compos. Part A Appl. Sci. Manuf. 2023, 167, 107446. [Google Scholar] [CrossRef]
  4. Wazeer, A.; Das, A.; Abeykoon, C.; Sinha, A.; Karmakar, A. Composites for Electric Vehicles and Automotive Sector: A Review. Green Energy Intell. Transp. 2023, 2, 100043. [Google Scholar] [CrossRef]
  5. Ismail, K.B.M.; Kumar, M.A.; Mahalingam, S.; Raj, B.; Kim, J. Carbon Fiber-Reinforced Polymers for Energy Storage Applications. J. Energy Storage 2024, 84, 110931. [Google Scholar] [CrossRef]
  6. Murray, R.E.; Beach, R.; Barnes, D.; Snowberg, D.; Berry, D.; Rooney, S.; Jenks, M.; Gage, B.; Boro, T.; Wallen, S.; et al. Structural Validation of a Thermoplastic Composite Wind Turbine Blade with Comparison to a Thermoset Composite Blade. Renew. Energy 2021, 164, 1100–1107. [Google Scholar] [CrossRef]
  7. Zhang, J.; Lin, G.; Vaidya, U.; Wang, H. Past, Present and Future Prospective of Global Carbon Fibre Composite Developments and Applications. Compos. Part B Eng. 2023, 250, 110463. [Google Scholar] [CrossRef]
  8. Torquato, S. Random Heterogeneous Materials; Interdisciplinary Applied Mathematics; Springer: New York, NY, USA, 2002; Volume 16, ISBN 978-1-4757-6357-7. [Google Scholar]
  9. Hyer, M.; Waas, A. Micromechanics of Linear Elastic Continuous Fiber Composites. In Reference Module in Materials Science and Materials Engineering; Elsevier: Amsterdam, The Netherlands, 2017; ISBN 978-0-12-803581-8. [Google Scholar]
  10. Jiang, J.; Wu, J.; Chen, Q.; Chatzigeorgiou, G.; Meraghni, F. Physically Informed Deep Homogenization Neural Network for Unidirectional Multiphase/Multi-Inclusion Thermoconductive Composites. Comput. Methods Appl. Mech. Eng. 2023, 409, 115972. [Google Scholar] [CrossRef]
  11. Kamiński, M.; Ostrowski, P. Homogenization of Heat Transfer in Fibrous Composite with Stochastic Interface Defects. Compos. Struct. 2021, 261, 113555. [Google Scholar] [CrossRef]
  12. Peng, X.-L.; Fathidoost, M.; Lin, B.; Yang, Y.; Xu, B.-X. What Can Machine Learning Help with Microstructure-Informed Materials Modeling and Design? MRS Bull. 2024, 50, 61–79. [Google Scholar] [CrossRef]
  13. Baskaran, A.; Kautz, E.J.; Chowdhary, A.; Ma, W.; Yener, B.; Lewis, D.J. The Adoption of Image-Driven Machine Learning for Microstructure Characterization and Materials Design: A Perspective. JOM 2021, 73, 3639–3657. [Google Scholar] [CrossRef]
  14. Chung, D.D.L. Processing-Structure-Property Relationships of Continuous Carbon Fiber Polymer-Matrix Composites. Mater. Sci. Eng. R Rep. 2017, 113, 1–29. [Google Scholar] [CrossRef]
  15. Grouve, W.J.B.; Warnet, L.L.; Rietman, B.; Visser, H.A.; Akkerman, R. Optimization of the Tape Placement Process Parameters for Carbon–PPS Composites. Compos. Part A Appl. Sci. Manuf. 2013, 50, 44–53. [Google Scholar] [CrossRef]
  16. Henninger, F.; Hoffmann, J.; Friedrich, K. Thermoplastic Filament Winding with Online-Impregnation. Part B. Experimental Study of Processing Parameters. Compos. Part A Appl. Sci. Manuf. 2002, 33, 1684–1695. [Google Scholar] [CrossRef]
  17. Martin, I.; Saenz del Castillo, D.; Fernandez, A.; Güemes, A. Advanced Thermoplastic Composite Manufacturing by In-Situ Consolidation: A Review. J. Compos. Sci. 2020, 4, 149. [Google Scholar] [CrossRef]
  18. Ziaee, S.; Kerr-Anderson, E.; Johnson, A.; Eastep, D.; Abdel-Magid, B. Effect of High Fiber Content on Properties and Performance of CFRTP Composites. J. Compos. Sci. 2024, 8, 364. [Google Scholar] [CrossRef]
  19. Mehdikhani, M.; Petrov, N.A.; Straumit, I.; Melro, A.R.; Lomov, S.V.; Gorbatikh, L. The Effect of Voids on Matrix Cracking in Composite Laminates as Revealed by Combined Computations at the Micro- and Meso-Scales. Compos. Part A Appl. Sci. Manuf. 2019, 117, 180–192. [Google Scholar] [CrossRef]
  20. Nasri, W.; Driss, Z.; Djebali, R.; Lee, K.-Y.; Park, H.-H.; Bezazi, A.; Reis, P.N.B. Thermal Study of Carbon-Fiber-Reinforced Polymer Composites Using Multiscale Modeling. Materials 2023, 16, 7233. [Google Scholar] [CrossRef]
  21. Bard, S.; Schönl, F.; Demleitner, M.; Altstädt, V. Influence of Fiber Volume Content on Thermal Conductivity in Transverse and Fiber Direction of Carbon Fiber-Reinforced Epoxy Laminates. Materials 2019, 12, 1084. [Google Scholar] [CrossRef]
  22. Kang, R.; Wang, S.; Liu, Y.; Ye, H.; Li, M.; Gu, Y. Analysis of Transverse Thermal Conductivity for Mesophase Pitch-Based Carbon Fibers and the through-Thickness Heat Conduction of Their Composites. Heliyon 2024, 10, e24349. [Google Scholar] [CrossRef]
  23. de Almeida, S.F.M.; Neto, Z.d.S.N. Effect of Void Content on the Strength of Composite Laminates. Compos. Struct. 1994, 28, 139–148. [Google Scholar] [CrossRef]
  24. Sisodia, S.; Gamstedt, E.K.; Edgren, F.; Varna, J. Effects of Voids on Quasi-Static and Tension Fatigue Behaviour of Carbon-Fibre Composite Laminates. J. Compos. Mater. 2015, 49, 2137–2148. [Google Scholar] [CrossRef]
  25. Saenz-Castillo, D.; Martín, M.I.; Calvo, S.; Rodriguez-Lence, F.; Güemes, A. Effect of Processing Parameters and Void Content on Mechanical Properties and NDI of Thermoplastic Composites. Compos. Part A Appl. Sci. Manuf. 2019, 121, 308–320. [Google Scholar] [CrossRef]
  26. Yang, L.; Wu, Z.; Cao, Y.; Ye, Y. Micromechanical Modelling and Simulation of Unidirectional Fibre-Reinforced Composite under Shear Loading. J. Reinf. Plast. Compos. 2015, 34, 72–83. [Google Scholar] [CrossRef]
  27. Wongsto, A.; Li, S. Micromechanical FE Analysis of UD Fibre-Reinforced Composites with Fibres Distributed at Random over the Transverse Cross-Section. Compos. Part A Appl. Sci. Manuf. 2005, 36, 1246–1266. [Google Scholar] [CrossRef]
  28. Melro, A.R.; Camanho, P.P.; Pinho, S.T. Generation of Random Distribution of Fibres in Long-Fibre Reinforced Composites. Compos. Sci. Technol. 2008, 68, 2092–2102. [Google Scholar] [CrossRef]
  29. Pulungan, D.; Lubineau, G.; Yudhanto, A.; Yaldiz, R.; Schijve, W. Identifying Design Parameters Controlling Damage Behaviors of Continuous Fiber-Reinforced Thermoplastic Composites Using Micromechanics as a Virtual Testing Tool. Int. J. Solids Struct. 2017, 117, 177–190. [Google Scholar] [CrossRef]
  30. Kumar, S.; Anderson, D.P.; Crasto, A.S. Carbon Fibre Compressive Strength and Its Dependence on Structure and Morphology. J. Mater. Sci. 1993, 28, 423–439. [Google Scholar] [CrossRef]
  31. Thermtest Inc. Materials Database—Thermal Properties. Available online: https://thermtest.com/thermal-resources/materials-database (accessed on 25 September 2025).
  32. Zhang, H.; Robitaille, F.; Grosse, C.U.; Ibarra-Castanedo, C.; Martins, J.O.; Sfarra, S.; Maldague, X.P.V. Optical Excitation Thermography for Twill/Plain Weaves and Stitched Fabric Dry Carbon Fibre Preform Inspection. Compos. Part A Appl. Sci. Manuf. 2018, 107, 282–293. [Google Scholar] [CrossRef]
  33. Rodrigo, O.; Bertrand, G. Radial Thermal Conductivity of a PAN Type Carbon Fiber Using the 3 Omega Method. Int. J. Therm. Sci. 2022, 172, 107321. [Google Scholar] [CrossRef]
  34. ISO 4287; Geometrical Product Specifications (GPS) — Surface Texture: Profile Method — Terms, Definitions and Surface Texture Parameters. ISO: Geneva, Switzerland, 1997.
  35. Zaami, A.; Baran, I.; Bor, T.C.; Akkerman, R. 3D Numerical Modeling of Laser Assisted Tape Winding Process of Composite Pressure Vessels and Pipes—Effect of Winding Angle, Mandrel Curvature and Tape Width. Materials 2020, 13, 2449. [Google Scholar] [CrossRef]
  36. Grouve, W.J.B. Weld Strength of Laser-Assisted Tape-Placed Thermoplastic Composites; University of Twente: Enschede, The Netherlands, 2012. [Google Scholar] [CrossRef]
  37. Lewis, T.B.; Nielsen, L.E. Dynamic Mechanical Properties of Particulate-Filled Composites. J. Appl. Polym. Sci. 1970, 14, 1449–1471. [Google Scholar] [CrossRef]
  38. Schutzeichel, M.O.H.; Kletschkowski, T.; Monner, H.P. Microscale Thermal Modelling of Multifunctional Composite Materials Made from Polymer Electrolyte Coated Carbon Fibres Including Homogenization and Model Reduction Strategies. Appl. Mech. 2021, 2, 739–765. [Google Scholar] [CrossRef]
  39. Zaami, A.; Baran, I.; Bor, T.C.; Akkerman, R. Optical Characterization of Fiber-Reinforced Thermoplastic Tapes for Laser-Based Composite Manufacturing. Compos. Part A Appl. Sci. Manuf. 2021, 146, 106402. [Google Scholar] [CrossRef]
  40. Ferrándiz, B.; Palacios, M.; Mailhé, C.; Barasinski, A.; Chinesta, F. Thermal Field Estimation in CFRTP Composites Using an Attention-Enhanced U-Net. Int. J. Mater. Form. 2025, 18, 76. [Google Scholar] [CrossRef]
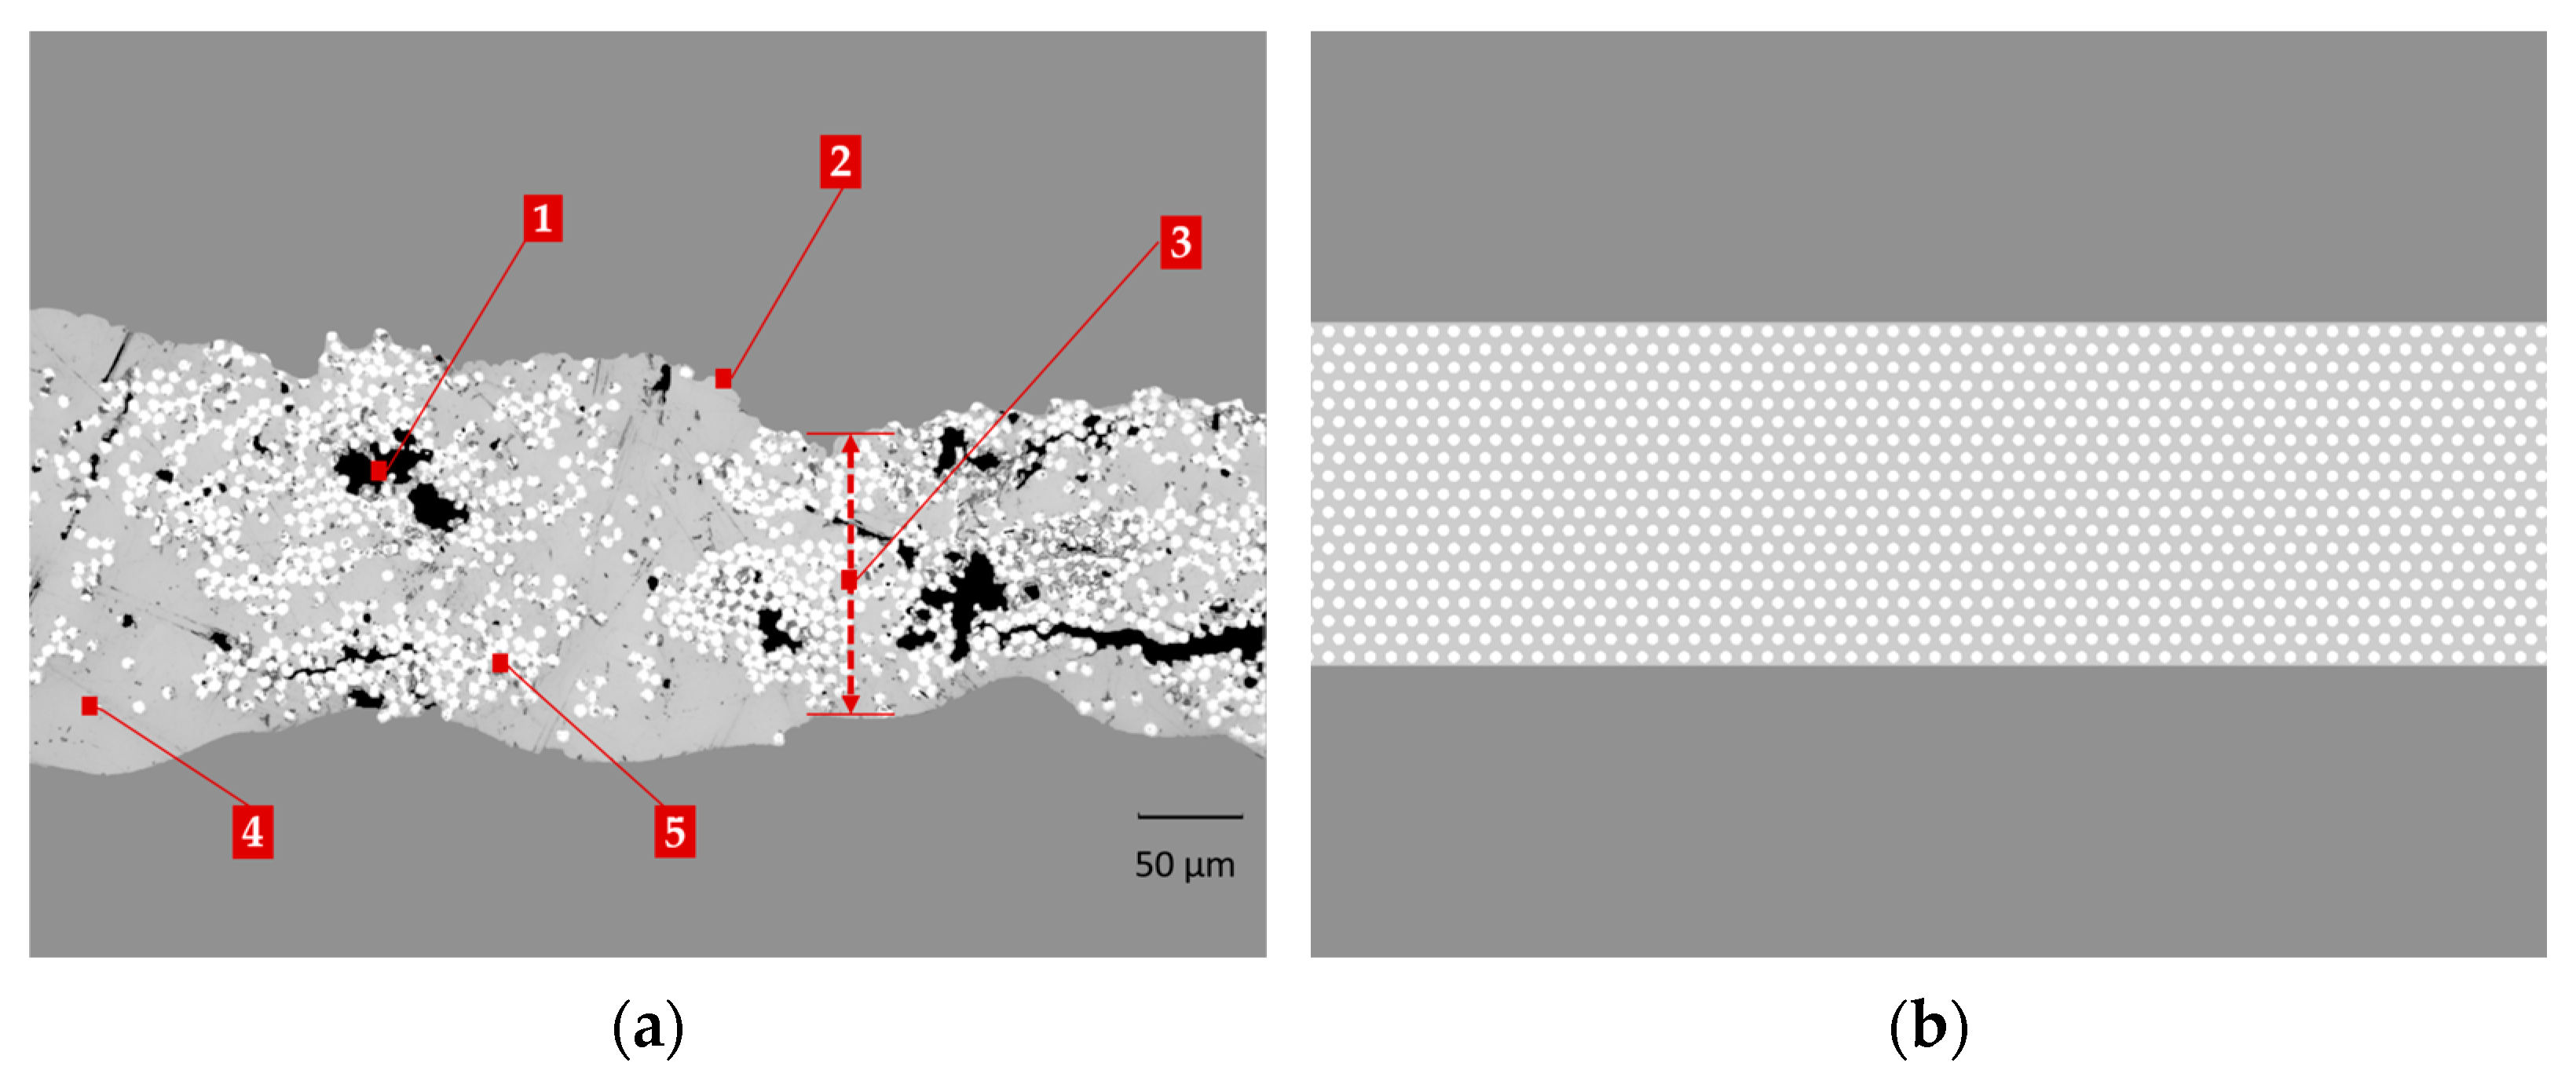
Figure 1. Transverse section microstructures of UD composite tapes: (a) Micrograph of a real sample showing pores (1), surface roughness (2), uneven thickness (3), matrix-rich regions (4), and fiber agglomerates (5); (b) Idealized structure with uniformly distributed fibers within a matrix with consistent thickness.
Jcs 09 00617 g001
Figure 2. Schematic of the ATP Process. In red are the regions of interest at the end of the heating phase, where the tape surfaces are exposed to direct heating on one side and are in contact with the roller or the underlying laminate on the opposite side.
Jcs 09 00617 g002
Figure 3. Experimental surface temperature measurements setup: (a) front face schema, (b) back face schema.
Jcs 09 00617 g003
Figure 4. Boundary conditions schema.
Jcs 09 00617 g004
Figure 5. Model configurations. (a) Full microstructure: Segmented directly from micrographs into fibers, matrix, and pores. (b) Surface roughness: Top surface profile extracted from micrographs, thickness set constant, and effective properties on the whole section. (c) Thickness variation: Top surface profile extracted from micrographs, flat bottom surface to obtain non-uniform thickness, and effective properties considered for the whole section. (d) Fiber distribution: Fiber positions extracted from micrographs, pores filled with matrix, and cross-section modeled with uniform thickness and flat borders. (e) Pores: Positions obtained from segmented micrographs and inserted into a uniform-thickness cross-section with effective properties. (f) Homogeneous Equivalent: Uniform thickness, flat borders, and effective thermal properties.
Jcs 09 00617 g005
Figure 6. Temperature profiles recorded with the thermal camera across a reference line. (a) Time evolution of the top surface of a rough sample, from the initial temperature (T0 = 23 °C) to heating during 5 s and 30 s, and to cooling during 120 s. (b) Comparison of profiles for rough and smooth surfaces. ΔTmax is the maximum temperature gradient within the profile. Data from both edges are excluded to minimize boundary effects.
Jcs 09 00617 g006
Figure 7. Surface temperature profiles at the end of the heating phase for different model configurations considering fiber distribution, surface roughness, thickness variation, and full microstructure. Temperature values are normalized.
Jcs 09 00617 g007
Figure 8. Single pore analysis. (a) Pore depth effect on the normalized temperature gradient for fixed pore contents (Va = 2%, 5%, 8%) for front and back surfaces. (b) Pore geometry effect (aspect ratio and orientation of the major axis relative to the heated surface) on the normalized temperature gradient for a fixed pore content (Va = 5%) and fixed centroid depth (25% of thickness).
Jcs 09 00617 g008
Figure 9. Comparison of through-thickness temperature fields obtained with the full-microstructure, simplified, and homogenized (HE) models for a representative sample under identical heating conditions. The upper panel illustrates the micrograph of the selected sample.
Jcs 09 00617 g009
Figure 10. Comparison of top surface temperature profiles for different model configurations (full microstructure, simplified model, and HE model) after heating for 0.4 s.
Jcs 09 00617 g010
Figure 11. Normalized temperature gradient evolution with heat transfer coefficients for both front and back surfaces after heating for 0.4 s.
Jcs 09 00617 g011
Table 1. Thermal properties.
Matrix 1FiberAir
Density [kg m−3] 1030 1960 [30]1.29 [31]
Specific Heat [J kg−1 K−1]1260 1296 [32]1004 [31]
Thermal conductivity [W m−1 K−1] 0.27 1.05 (Transverse) [33]0.025 [31]
1 Values provided by the manufacturer.
Table 2. Microstructural parameters variability.
MinimumMaximum
Fiber volume fraction Vf 0.320.36
Pore volume fraction Va0.010.08
Surface roughness Ra [µm] ISO 4287 [34] 0.977.92
Surface roughness Rt [µm] ISO 42877.6757.41
Thickness variation Δe [µm]1030
Disclaimer/Publisher’s Note: The statements, opinions and data contained in all publications are solely those of the individual author(s) and contributor(s) and not of MDPI and/or the editor(s). MDPI and/or the editor(s) disclaim responsibility for any injury to people or property resulting from any ideas, methods, instructions or products referred to in the content.