Article

Compression after Impact Response of Kevlar Composites Plates

by
Dionysis E. Mouzakis
1,*,
Panagiotis J. Charitidis
2 and
Stefanos P. Zaoutsos
3
1
Mechanics Laboratory, Sector of Mathematics and Engineering Sciences, Hellenic Army Academy, Vari P.O. 16673 Attica, Greece
2
Department of Environmental Engineering, Democritus University of Thrace, 67100 Xanthi, Greece
3
Department of Energy Systems, University of Thessaly, GR 41500 Larisa, Greece
*
Author to whom correspondence should be addressed.
J. Compos. Sci. 2024, 8(8), 299; https://doi.org/10.3390/jcs8080299
Submission received: 18 June 2024 / Revised: 18 July 2024 / Accepted: 22 July 2024 / Published: 1 August 2024
(This article belongs to the Special Issue Characterization and Modelling of Composites, Volume III)

Abstract

:
Boeing and Airbus developed a special testing procedure to investigate the compressive response of laminates that have been impacted (following standards ASTM D 7137 and DIN 65561). This study focuses on both experimental and numerical analysis of Kevlar plates subjected to compression after impact. To ensure high quality and appropriate mechanical properties, the composite plates were manufactured using autoclaving. The DIN 65561 protocol was followed for all three test systems. Initially, ultrasonic C-scanning was performed on all plates before testing to confirm they were free of any significant defects arising from the manufacturing process. Subsequently, low-energy impact testing was conducted at levels ranging from 0 to 8 Joules. Three specimens were tested at each energy level. After the impact, all specimens underwent ultrasonic C-scanning again to assess the internal delamination damage caused by the impactor. Finally, both pristine and impacted specimens were subjected to compressive testing using the special jig specified in DIN 65561. The compressive impact strength results obtained from these tests were plotted against the delamination area measured by C-scanning. These data were then compared to the results obtained from specimens with artificial damage. Semi-empirical equations were used to fit both sets of curves. The same procedure (impact testing, C-scanning, and data analysis) was repeated to investigate the relationship between impact energy and total delamination area. Lastly, finite element modeling was employed to predict the buckling stresses that develop under compression in the impacted systems studied. These modeling approaches have demonstrated good accuracy in reproducing experimental results for CAI tests.

Graphical Abstract

1. Introduction

The literature review shows that composite materials have excellent mechanical properties combined with low density and are increasingly used in several modern engineering fields such as aircraft and aerospace due to their high strength and low weight, while the design of laminated composite materials may be optimized over various objective functions and design variables [1,2]. One of the major topics to be investigated in this field is the impact behavior of laminated composites [3,4,5,6,7,8,9]. Among several types of composite materials, Kevlar aramid fibers based on poly (para-phenylene terephthalamide) (PPD-T) are widely used in high-velocity impact (HVI) applications [10,11,12,13]. However, textile fabrics can be yarns in many different styles, and several factors must be considered such as fabric count, yarn size, yarn waviness, fiber modulus, fiber diameter, cross-yarn friction, and parallel-fiber friction [14]. Over time, extensive literature has developed on various composite damage models [6,9,15,16,17]. Most of these models are based on capturing the behavior of unidirectional pre-impregnated composite plies, reflecting their prevalent use in high-performance applications. The accurate assessment of the influence of impact damage currently requires extensive experimental testing to meet certification requirements, which is costly and time-consuming. Impact-induced delamination occurs at a roughly circular region around the impact site. The delaminated region causes local buckling of the sub-laminates under compressive loads. The size of the delaminated zone increases with the energy of the impact event, reducing the CAI strength of the material [18,19,20,21,22,23,24].
A number of questions regarding the impact resistance remain to be addressed in order to certify these structures for the aeronautical industry, which is the concept of damage tolerance [25,26]. Moreover, a series of recent studies have indicated that three types of damages are classically induced on a low-velocity/low-energy impact on a uni-directional (UD) composite laminate: matrix cracking, fiber fracture, and delamination [5,7,25,27,28].
Matrix cracking conventionally occurs first in the damage scenario. Then, as the damage grows, delamination quickly occurs. An interaction between these two damage phenomena is also clearly visible during the impact tests [27,28]. Studies on compression after impact tests are well documented. It is also well acknowledged that it can be affected by several parameters such as microstructural configuration, the mechanical properties of resin [23], stacking sequence [20,29,30], the total thickness of the specimen [31], and the environmental condition [7,32]. Analytical models have been also proposed to determine the CAI strength. Among the researchers who studied the fracture toughness to predict the CAI strength are Soutis and Curtis [33] and Chai et al. [34]. This section presents a review of recent literature on the most popular numerical method for CAI modeling. Continuum Damage Mechanics (CDM) has been investigated by many researchers [6,9,24,35,36,37,38,39,40,41,42,43,44,45,46].
Building on this foundation, others have driven the further development of a three-dimensional (3D) CDM-based material model to investigate the progressive interlaminar degradation of composite laminates with non-linear shear behavior, ply friction and damage irreversibility considered. This model was combined with cohesive elements to capture interlaminar damage [47,48,49]. Bouvet et al. [50] and Hongkarnjanakul et al. [51] captured interlaminar matrix cracking in a 3D finite element mesh using cohesive interface elements through the thickness of each ply, which in turn was modeled with a single layer of 3D elements. Rivallant et al. [52] also presented a finite element model focusing on fiber failure and delamination to simulate both impact and residual strength tests and achieved a good correlation between experimental and numerical results. Generally, the advantage of the Continuum Damage Mechanics approach is that it can be easily combined with a stress and/or strain failure criterion for predicting damage initiation and fracture mechanics approach for the failure progression by coupling the internal damage variables with the fracture energy.
Prior work by Mendes et al. [53] employed a single-shell finite element model with an energy-based damage model to assess the Compressive After Impact (CAI) strength of CFRP coupons [54]. Their model was compared favourably to the built-in Hashin failure model in ABAQUS software (Version 2023) with regard to predicting impact response parameters like peak force, duration, and absorbed energy. However, both models exhibited limitations due to the shell element formulation. This formulation neglects out-of-plane stresses and strains, which are crucial for capturing delamination, a key damage mode in composite materials under impact.
With this aim in mind, this paper presents an experimental–numerical approach to determine the response of Kevlar laminate plates under compression after impact. The instrumented falling weight impact testing was performed at low energy levels (≤6 J/mm), while the results of CAI strength are compared against impact energies and delamination areas.

2. Materials and Methods
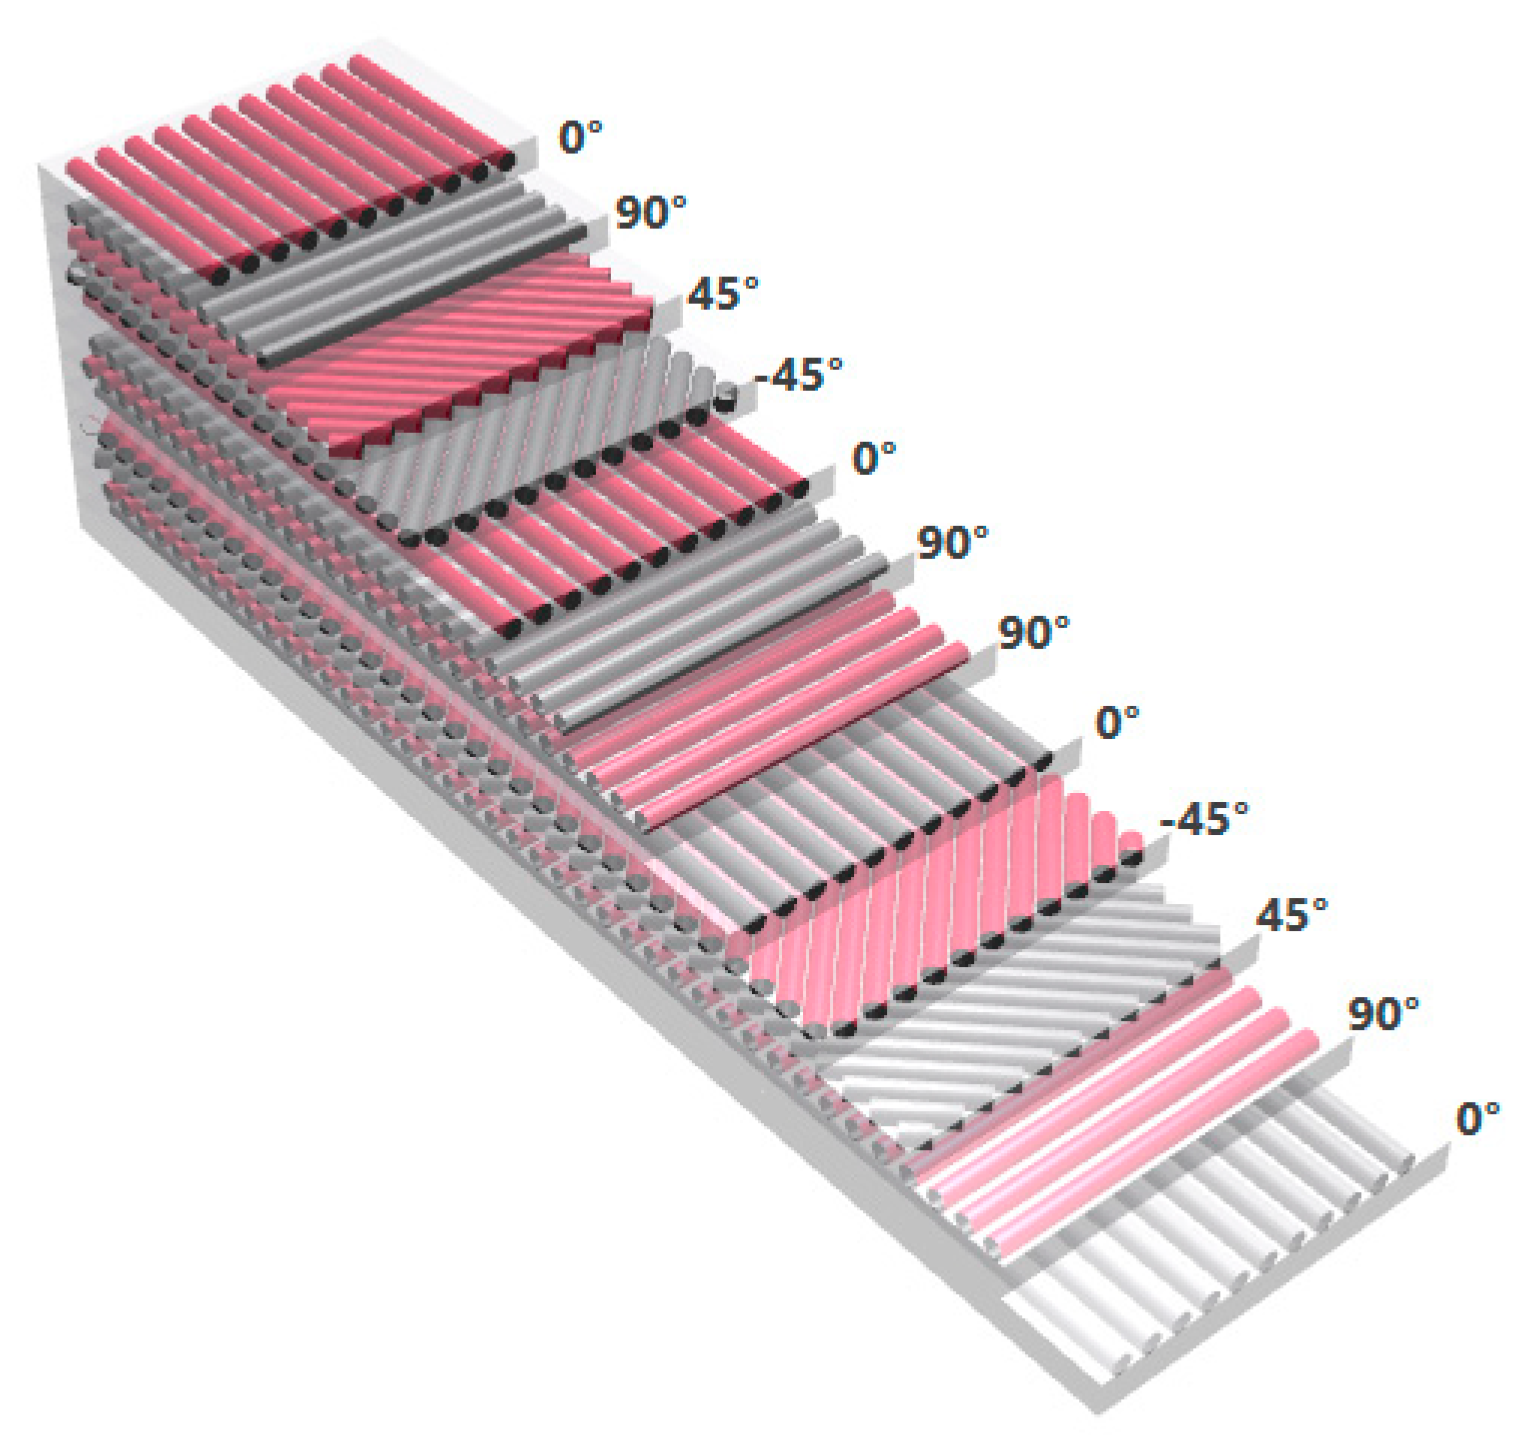
2.1. Material

This study investigates the potential of a Kevlar 49/epoxy composite for structural applications in drone wings and bodies. The chosen composite employs a twelve-ply, cross-ply laminate configuration of [0/90/±45/0/90]s (Figure 1). Three laminates measuring 300 mm × 300 mm were fabricated at Hellenic Airspace Industry facilities in strict accordance with the manufacturer’s specifications. The curing process involved subjecting the specimens to a pressure of 4.13 bars and a temperature of 175 °C (Tg = 190 °C) for 24 h under vacuum. This process resulted in the formation of rigid, quasi-isotropic plates. Following cure, the plates were sectioned to their final dimensions of 150 mm × 100 mm, adhering to DIN 65561 standards. The nominal thickness of each composite plate is 2.64 mm, with a fiber volume fraction of 41%.
Kevlar 49 offers high tensile strength, impact resistance, and excellent durability. However, its application in Compressed After Impact (CAI) testing can be challenging due to its inherently lower compressive strength, susceptibility to internal damage during impact, and complex failure modes. Careful consideration of these limitations is crucial to ensure the material performs adequately under anticipated in-service loads.
The selection of a 2.64 mm material thickness represents a strategic choice for drone wing and body structures, prioritizing a balance between structural integrity, weight efficiency, and cost-effectiveness. This thickness offers sufficient strength to withstand typical flight loads while providing a reasonable level of impact resistance. Additionally, it minimizes overall weight, maximizing flight time, maneuverability, and payload capacity. Weight reduction is a critical factor in drone design, directly influencing overall performance. Furthermore, this thickness aligns with weight regulations and utilizes readily available materials with standard fabrication techniques, keeping production costs manageable. In essence, the 2.64 mm thickness effectively balances the need for a strong and lightweight drone structure at a reasonable cost.
The mechanical properties and Hashin damage failure criterion strength parameters for the material are presented in Table 1 and Table 2, respectively. While Kevlar 49 offers several advantages, it is important to acknowledge the potential complications arising from its lower compressive strength, susceptibility to internal damage, and complex failure modes during CAI testing. These challenges necessitate careful management to ensure the material performs adequately under expected load conditions.
Prior to impact testing, pristine specimens were examined using an ultrasonic C-scan, a highly effective non-destructive testing (NDT) method (Figure 2). This technique allows for qualitative assessment of the damage distribution within the laminates and facilitates comparison of their compressive failure modes.

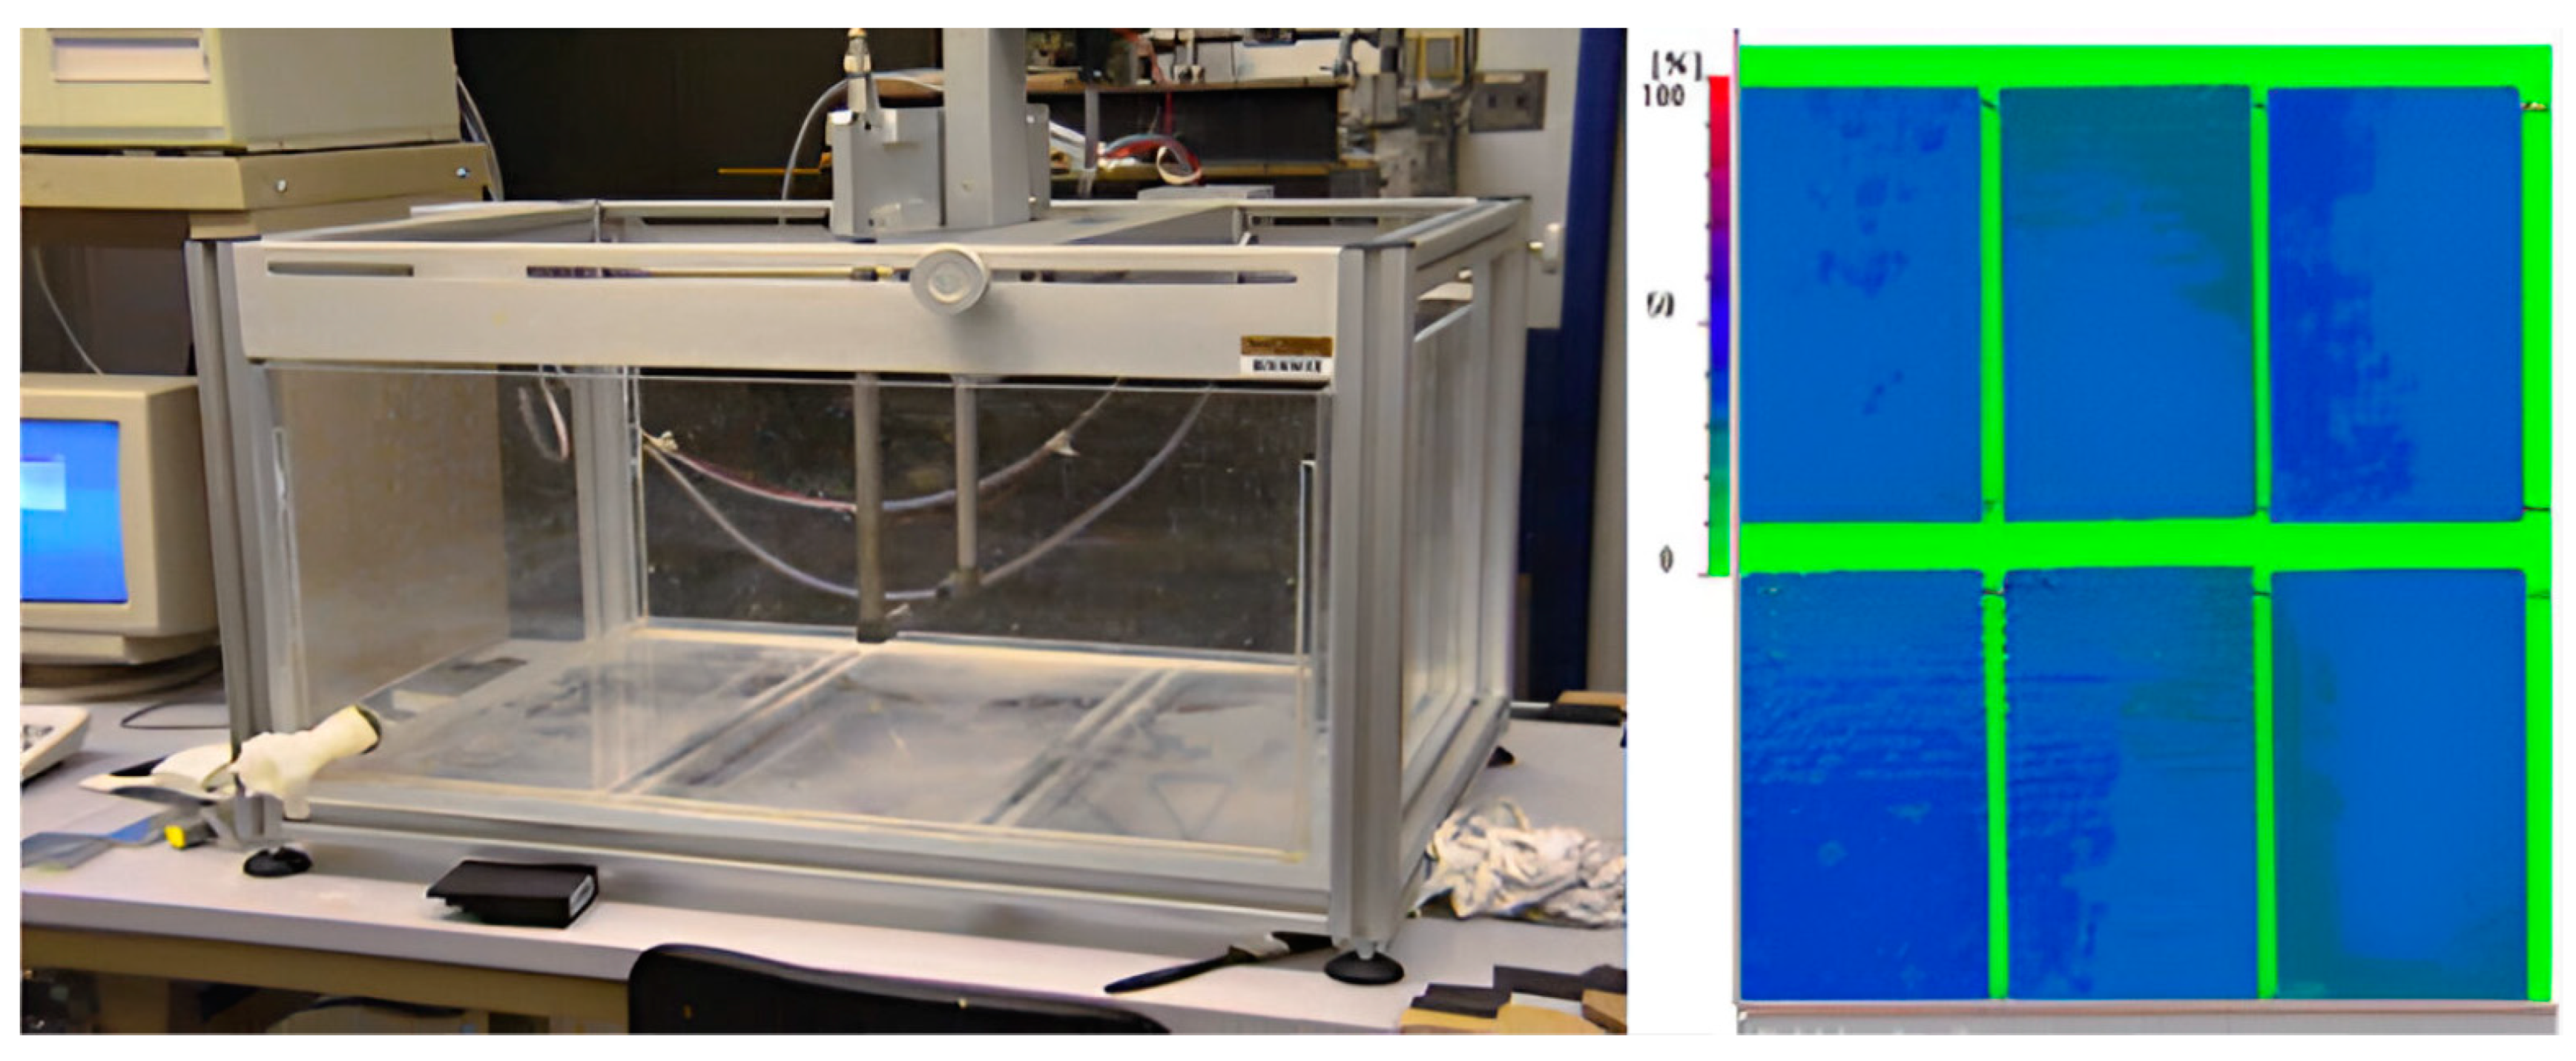
2.2. Experimental Procedure

Following ultrasonic C-scanning, low-velocity impact testing was conducted on the specimens using a drop-weight tower, specifically a Ceast 9350 (Instron, High Wycombe, England). Three specimens for each impact energy level were subjected to impacts of 2, 4, 6, and 8 Joules per millimeter of specimen thickness. The specimens were securely clamped around their edges to prevent misalignment during impact. The impactor employed a hemispherical tip with a diameter of 20 mm and a total mass of 3 kg. Post-impact, the specimens underwent another ultrasonic C-scan to identify and visualize any subsurface delamination within the composite laminates.
Following C-scanning, all specimens were oven-dried at 60 °C for 24 h to eliminate any residual moisture. Public domain image analysis software, ImageJ 1.45s (developed by Wayne Rasband), was then utilized to precisely quantify the total delamination areas from the corresponding C-scan images. Finally, both impacted and pristine specimens were subjected to in-plane compression testing by DIN 65561. This standard mandates the use of a dedicated anti-buckling jig constructed from high-strength steel (Figure 3). An Instron 3382, a 100 kN electromechanical universal testing machine, was employed to acquire the compressive response of the specimens (both pristine and impacted) at a crosshead speed of 0.5 mm/min. The following equation was subsequently employed to determine the residual compressive strength of the specimens:
σ c = F max bd
where σc is the compression strength, Fmax the maximum force applied, b the specimen width, and d its thickness.

3. Finite Element Analysis

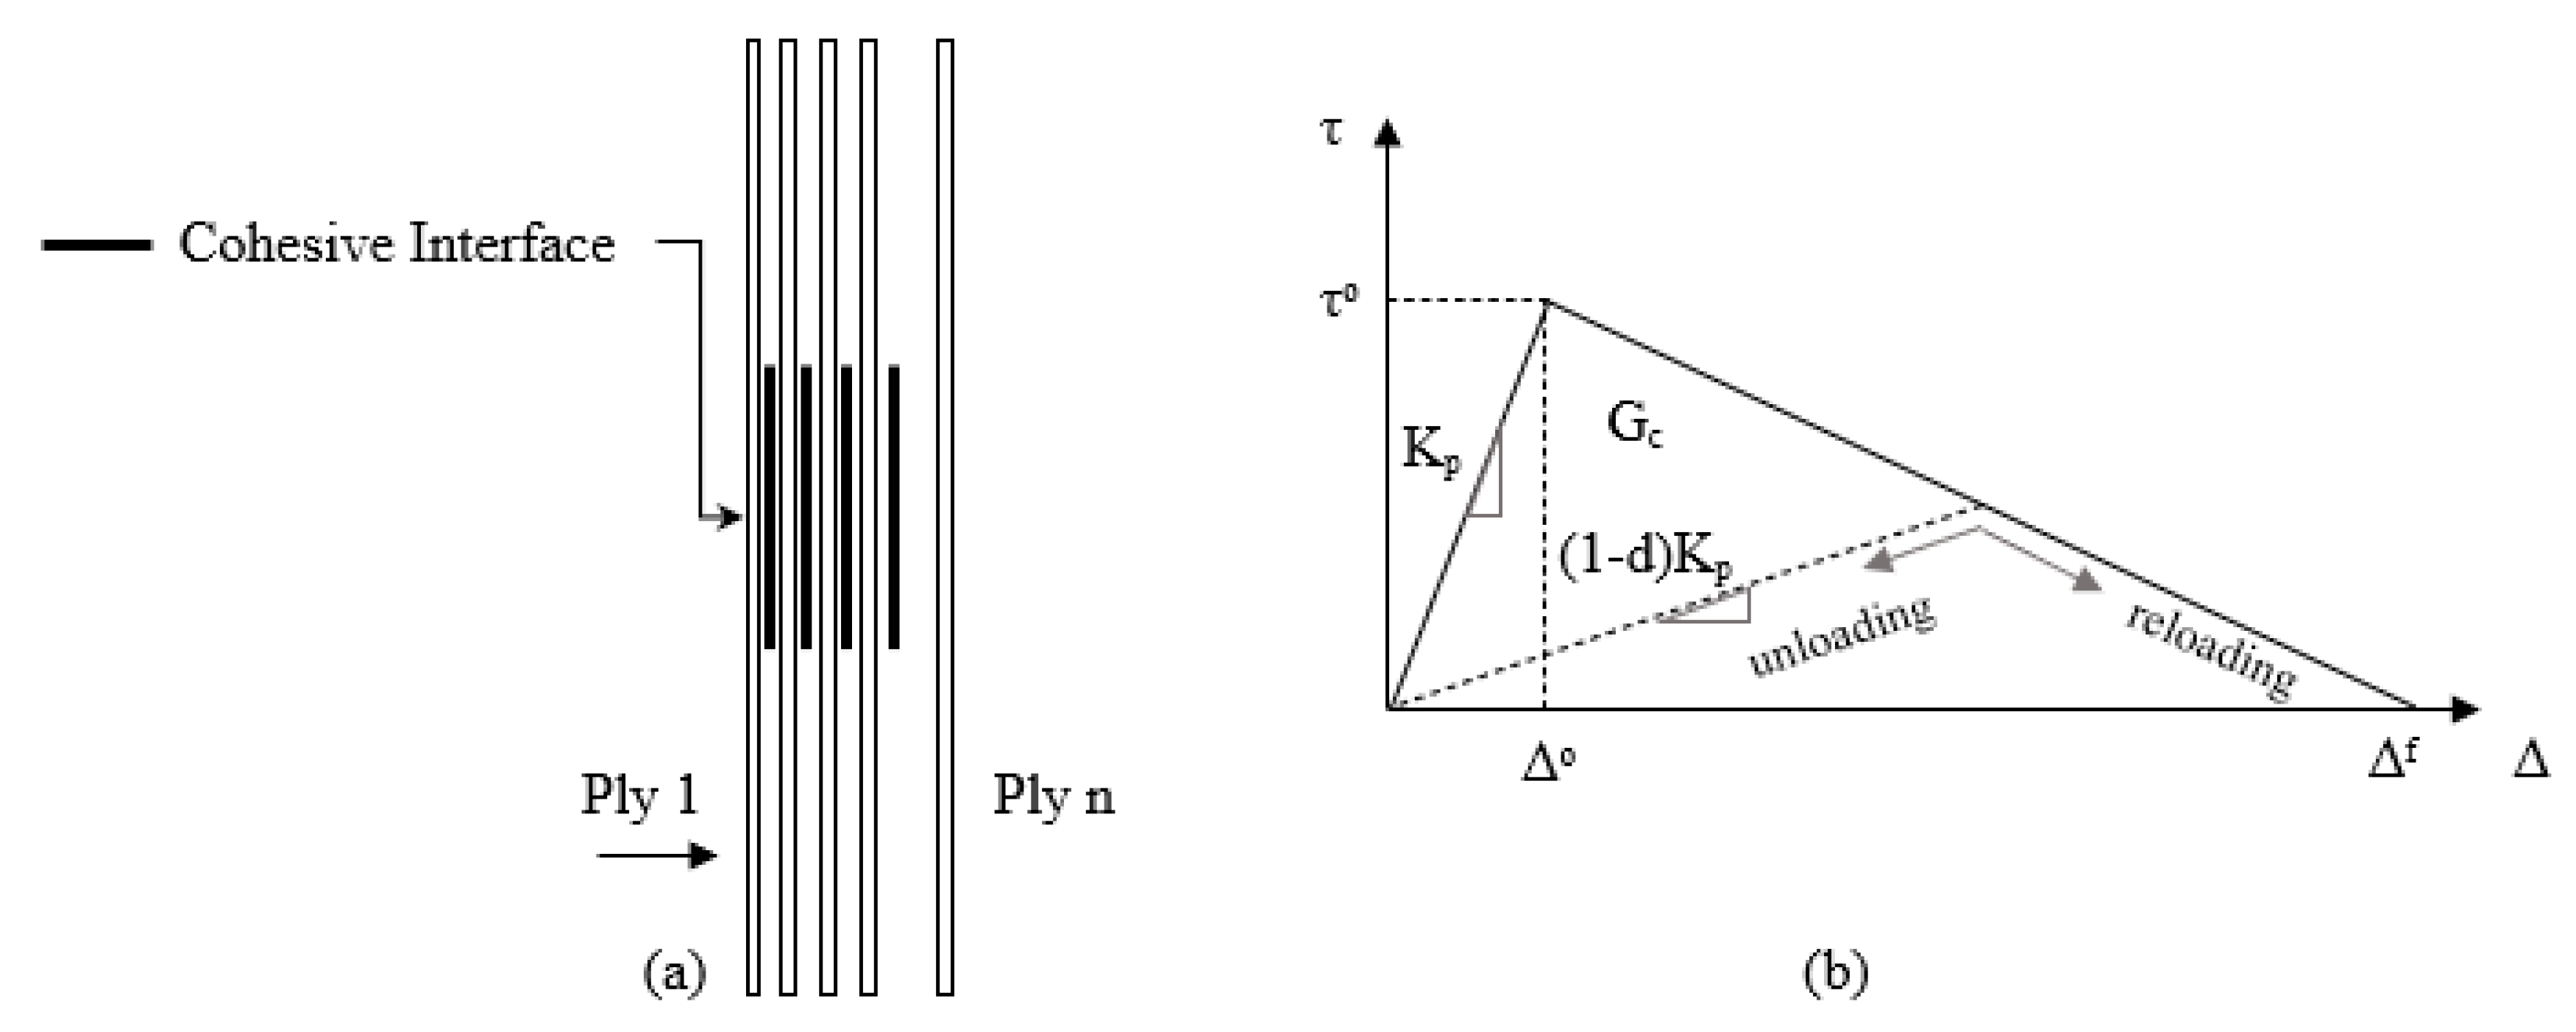
3.1. Cohesive Elements for Delamination Modeling

Cohesive elements offer a powerful tool for simulating delamination within composite materials (Figure 4). These elements effectively bridge the gap between strength-based and fracture mechanics approaches. They achieve this by predicting both the initiation of damage and subsequent crack propagation at the interface between individual layers. A single layer of cohesive elements represents a separation zone with zero physical thickness. These elements connect adjacent layers similarly to standard elements, but they function as two separate faces divided by a virtual thickness. The relative movement between these faces captures both the opening/closing of the delamination and the transverse shear behavior within the material. Cohesive elements enable modeling of the entire delamination process, encompassing initial loading through complete failure. This includes the pre-damage stage, often represented by a linear elastic penalty stiffness. This stiffness exhibits degradation under tensile or shear loading but remains unchanged under compressive loading. A cohesive constitutive law governs the relationship between traction, denoted by t, and the separation, Δ, at the interface. In this specific study, a penalty stiffness of 106 N/mm3 is employed.

3.2. Abaqus FEA for Composite Damage Analysis

This study utilizes Abaqus software to perform a three-dimensional finite element analysis (FEA) to investigate the initiation and propagation of damage within the Kevlar 49/epoxy composite specimens under compression. Continuum shell elements (SC8R) were chosen over conventional shell elements for modeling the composite plates due to several advantages.
SC8R elements offer distinct advantages over conventional shell elements for modeling composite plates. Firstly, they enable more accurate contact modeling, leading to a superior representation of the interactions between components within the simulation [24]. This improved interaction representation is crucial for understanding the complex damage behavior observed in composite materials. Secondly, unlike conventional shell elements, SC8R elements can account for the individual behavior of plies with varying orientations throughout the plate thickness [55]. This capability allows for a more refined capture of the response through the thickness, including factors like transverse shear stress and force distributions, as well as through-thickness pinching forces [55].
A uniformly generated mesh with an element size of 0.5 mm × 0.5 mm was employed in the impact area of the composite plate. Each ply was modeled using an 8-node quadrilateral, in-plane, general-purpose continuum shell element (SC8R) with reduced integration, hourglass control, and finite membrane strains. Additionally, 8-node linear 3D cohesive elements were used to model the interfaces between plies.
To ensure the entire model behaves as a single cohesive unit, tie constraints were defined between adjacent surfaces. Surface-to-surface contact with finite tangential frictionless sliding was also defined on adjacent composite plies to prevent interpenetration during local buckling. The bottom surface of the specimen was restrained in all directions to simulate a simply supported boundary condition (Figure 5). Local buckling was initiated during compression loading by applying a small transverse out-of-plane displacement to the nodes in the central region of the plate. This displacement was achieved by prescribing positive z-direction displacement to the nodes in the top six composite plies, while applying negative z-direction displacement to the bottom six plies.
A more realistic approach to simulating a testing machine was implemented by applying a compressive displacement incrementally to the plates, rather than applying nodal forces to each layer. This approach acknowledges that the stresses in each layer are dependent on the overall stiffness of the composite [24,56,57].
Accurate Compressive After Impact (CAI) strength prediction relies on effectively modeling impact-induced delamination, a key mechanism for local buckling under compression [58]. This study addresses this by explicitly including delamination in cohesive interfaces, with some acknowledged simplifications for efficiency.
A circular delamination zone was adopted, and delamination size was assumed uniform through the thickness based on prior research [59]. Realistic delamination behavior was mimicked by significantly reducing cohesive material properties within these zones. Friction and delaminated ply overlaps were disregarded for simplicity. Future work could explore incorporating more complex delamination shapes, size variations, and refined material parameters for a more comprehensive understanding of CAI strength in damaged composites. A more detailed discussion on damage area modeling can be found elsewhere [33,54,60].
The Hashin fabric failure criterion, a variant specifically designed for fabric-based materials, was adopted for this analysis (parameters in Table 2). This criterion is used to predict damage initiation in the composite plies [61,62], and a damage evolution response is used to model the damage progression [55]. Composite damage is characterized by the degradation of material stiffness, while the damage criteria consider four distinct failure modes: fiber rupture in tension; fiber buckling and kinking in compression; matrix cracking under transverse tension and shearing; and matrix crushing under transverse compression and shearing.

4. Results and Discussion

Experimental Results

Composite laminates were subjected to impact damage using established procedures developed by Boeing and Airbus, adhering to guidelines set forth by ASTM D 7137 and DIN 65561 standards (Figure 6). Crack propagation was observed in specimens impacted with energies exceeding 2.0 J/mm. The extent of the damaged zone was quantified using a C-scan technique.
Failure of impacted laminates under uniaxial compression loading was attributed to local buckling of sub-laminates initiated within the impact zone (Figure 7). While mid-plane fractures, indicative of micro-buckling and subsequent ply failure, were absent in all tested plates, the most significant delamination occurred between the 3rd–4th and 9th–10th plies (oriented at ±45°). Within these delaminated regions, interfacial forces are negligible under tensile and shear loading due to the absence of bonding between the plies. Additionally, friction between the debonded surfaces is minimal. The bending stiffness of these sub-laminates is lower compared to a non-impacted laminate, leading to localized buckling and premature failure under compression. The lines in Figure 7 indicate the fracture path where displacements were measured. As can be observed, fractures initiate at the free edges and propagate along the loaded edge at the clamped support.
Previous studies [33,63] reported a complete loss of load-carrying capacity in impact-damaged plies. In this investigation, matrix cracking emerged as the dominant form of intra-laminar damage within the impacted zone for the employed impact energy range. Evidence of fiber breakage was minimal and primarily confined to the top and bottom plies. The distribution of matrix cracking was symmetrical and continuous around the impact region, consistent with prior findings [64]. The extent of matrix cracking increased proportionally with increasing impact energy. The interlaminar matrix damage contours at ultimate failure (Figure 5) confirm damage propagation through the pre-damaged impacted center of the panel, aligning with established observations [65].
Figure 8 presents the experimental stress–strain curves obtained from the compression tests. The results demonstrate a clear influence of varying impact energies on the in-plane compressive response of the Kevlar fiber laminates. The specimens generally exhibited a linear stress–strain response until they reached their ultimate strength. Beyond this point, a significant drop in stress signifies the onset of a critical failure mode, characterized by compressive shattering or delamination-induced failure. This failure mode was observed in both undamaged and impacted laminates; however, impacted specimens exhibited central buckling prior to complete failure. As shown in Figure 8, the specimen strength exhibits a decreasing trend with increasing impact energy (refer to Table 3) [6,7,8,9,24,66,67]. The maximum compressive stress and the buckling initiation stress (determined by linear extrapolation of the curves where the slope decreases) were recorded from these curves. The initial rise in stress observed in Figure 8 is attributed to the specimen periphery adjusting to the compressive load and the testing fixture (jigs).
Compression after impact (CAI) testing on composite plates reveals a non-linear correlation between the impact energy (expressed per thickness mm) and the total delamination area as measured by image analysis. This correlation can be effectively modeled using a power law equation, where the total delamination area (AD) is proportional to the impact energy (I) raised to a power law coefficient (a) and scaled by a fit coefficient (f).
A D = f · I a
The fit coefficient (f) captures the influence of material properties and specific test conditions, while the power law coefficient (a) determines the rate of change in the delamination area with increasing impact energy. A positive value of a indicates a stronger effect, where the delamination area increases faster than proportionally with impact energy. Conversely, a negative value suggests a weaker effect, with the delamination area increasing slower than proportionally. This power law model provides a valuable tool for predicting delamination area in composite plates subjected to CAI testing based on the impact energy and allows researchers to understand the impact resistance behavior of these materials. The final equation for the specific model and test setup (R2 = 0.98) was as follows:
A D = 0.27 · I 1.62
Figure 9 depicts the relationship between cumulative delamination area (CDA) and impact energy for the impacted composite specimens. CDA refers to the total area within a laminate that has delaminated due to impact damage. A clear positive correlation is observed, where increasing incident energy results in a proportional increase in the delamination area within the composite. This trend can be attributed to higher energy impacts imparting greater forces, leading to the separation of layers and the formation of cracks within the material. This highlights the detrimental effect of increasing impact energy on the internal integrity of the composite.
Figure 10 presents the remaining compressive strength plotted against impact energy for all tested specimens. Unlike the delamination area relationship (Figure 9), a linear trend is not observed. Instead, the data suggest a power-law relationship with a negative exponent, which appears to provide a better fit for the experimental results. A significant reduction in the compressive strength of the specimens is evident at impact energies exceeding 0 J/mm of thickness. It is important to note that two samples were tested per energy level, with a third excluded due to its incompatibility with statistical validation procedures.
Finally, Figure 11 shows the CAI strength plotted as a function of the total delamination area. A sigmoidal (S-shaped) third-order polynomial was fitted to the experimental data. Interestingly, the graph reveals a plateau between 4% and 9% delamination area, indicating a relatively stable response in the specimens’ strength. However, for delaminations exceeding 10% of the total specimen area, the CAI strength deteriorates rapidly. As described earlier, three samples were tested per energy level, with the third sample excluded due to incompatibility with statistical validation procedures.
The experimental results reveal a CAI strength of 61.63 MPa for undamaged (non-impacted) specimens with the [0/90/±45/90/0]s stacking sequence. This value serves as the reference point for comparison with impacted specimens.
For impacted specimens (treated samples at 8 J/mm) where damage is confined to the impact zone with minimal pre-buckling damage assumed, the observed buckling strength is 6.80 MPa. This relatively smaller reduction in strength might be attributed to the ±45° surface plies acting as a sacrificial layer. These plies could potentially absorb impact energy and mitigate damage to the underlying, load-bearing 0° plies, as suggested in previous work [68].

5. Finite Element Results

A rectangular composite plate with dimensions of 100 mm × 150 mm and a ply thickness of 0.22 mm was modeled using finite element software. Compressive loading was simulated by applying a displacement to the top surface of the specimen. Figure 12 and Figure 13 demonstrate good agreement between the experimental and numerical results in terms of stress-strain response.
However, discrepancies exist between the experimental results and the predicted buckling strength from the finite element analysis for the impact-induced damage configuration (Figure 12). This overestimation by the model can be attributed to several limitations. Initially, the model assumes linear elastic buckling behavior. Composite materials often exhibit non-linear pre-buckling behavior, which can lead to underestimation of the actual buckling strength.
Furthermore, the relatively small number of specimens tested in the experiment might not fully capture the inherent statistical variability of the composite material. This variability can contribute to discrepancies between the average experimental results and the single model prediction.
Further investigation could involve incorporating non-linear material properties and performing simulations with a larger virtual sample population to account for these limitations and improve the predictive accuracy of the finite element model.
Following impact loading, cross-ply laminates typically experience delaminations that assume a predominantly circular shape and propagate perpendicularly to the loading direction (90°) [21]. Other failure modes, such as buckling and fiber failure, are also possible. Incorporating information about the internal ply orientations can significantly enhance the accuracy of modeling these failure modes [54,69]. The combined experimental and simulation study yielded two key insights regarding the impact response of the composite plates.
The impact procedure induces permanent damage within the laminate, rendering it unsuitable for its original function without repairs.
Analyzing composite plate failure solely through buckling calculations is insufficient. While the anti-buckling jigs successfully prevented peripheral buckling according to DIN65561, they cannot impose complete rigidity to entirely suppress out-of-plane displacements across the entire plate area. This highlights the limitations of buckling analysis as a standalone method for predicting post-impact behavior.
The observed discrepancy between the theoretical buckling strength obtained from the finite element analysis (FEA) in Table 4 and the actual compressive strength measured in the experiments can be attributed, at least partially, to the inherent differences between the two approaches. FEA typically employs idealized material models and may not fully capture the complexities of damage evolution observed in destructive testing, such as delamination and fiber breakage.

6. Conclusions

This paper presents the results of a combined experimental and numerical investigation into the impact response and compression after impact (CAI) behavior of Kevlar 49/Epoxy laminates with a thickness of 2.64 mm. This specific thickness is strategically relevant for drone wings and bodies, where a balance between structural integrity, weight efficiency, and cost-effectiveness is crucial. Two samples were tested per energy level, with a third excluded due to statistical incompatibility. The average experimental results were validated through comparison with finite element analysis.
The investigation revealed several key findings:
  • Impact significantly reduces CAI strength due to permanent delaminations within the laminate. This highlights the importance of considering pre-existing damage when evaluating the post-impact strength of composite materials.
  • For superior CAI strength under compression, laminates should have top and bottom plies oriented in the 0° direction (aligned with the loading direction).
  • While useful for analysis, the finite element model employs a simplified approach by representing impact damage as an equivalent hole. This may not fully capture the complexities of real-world damage, such as crack formation and propagation.
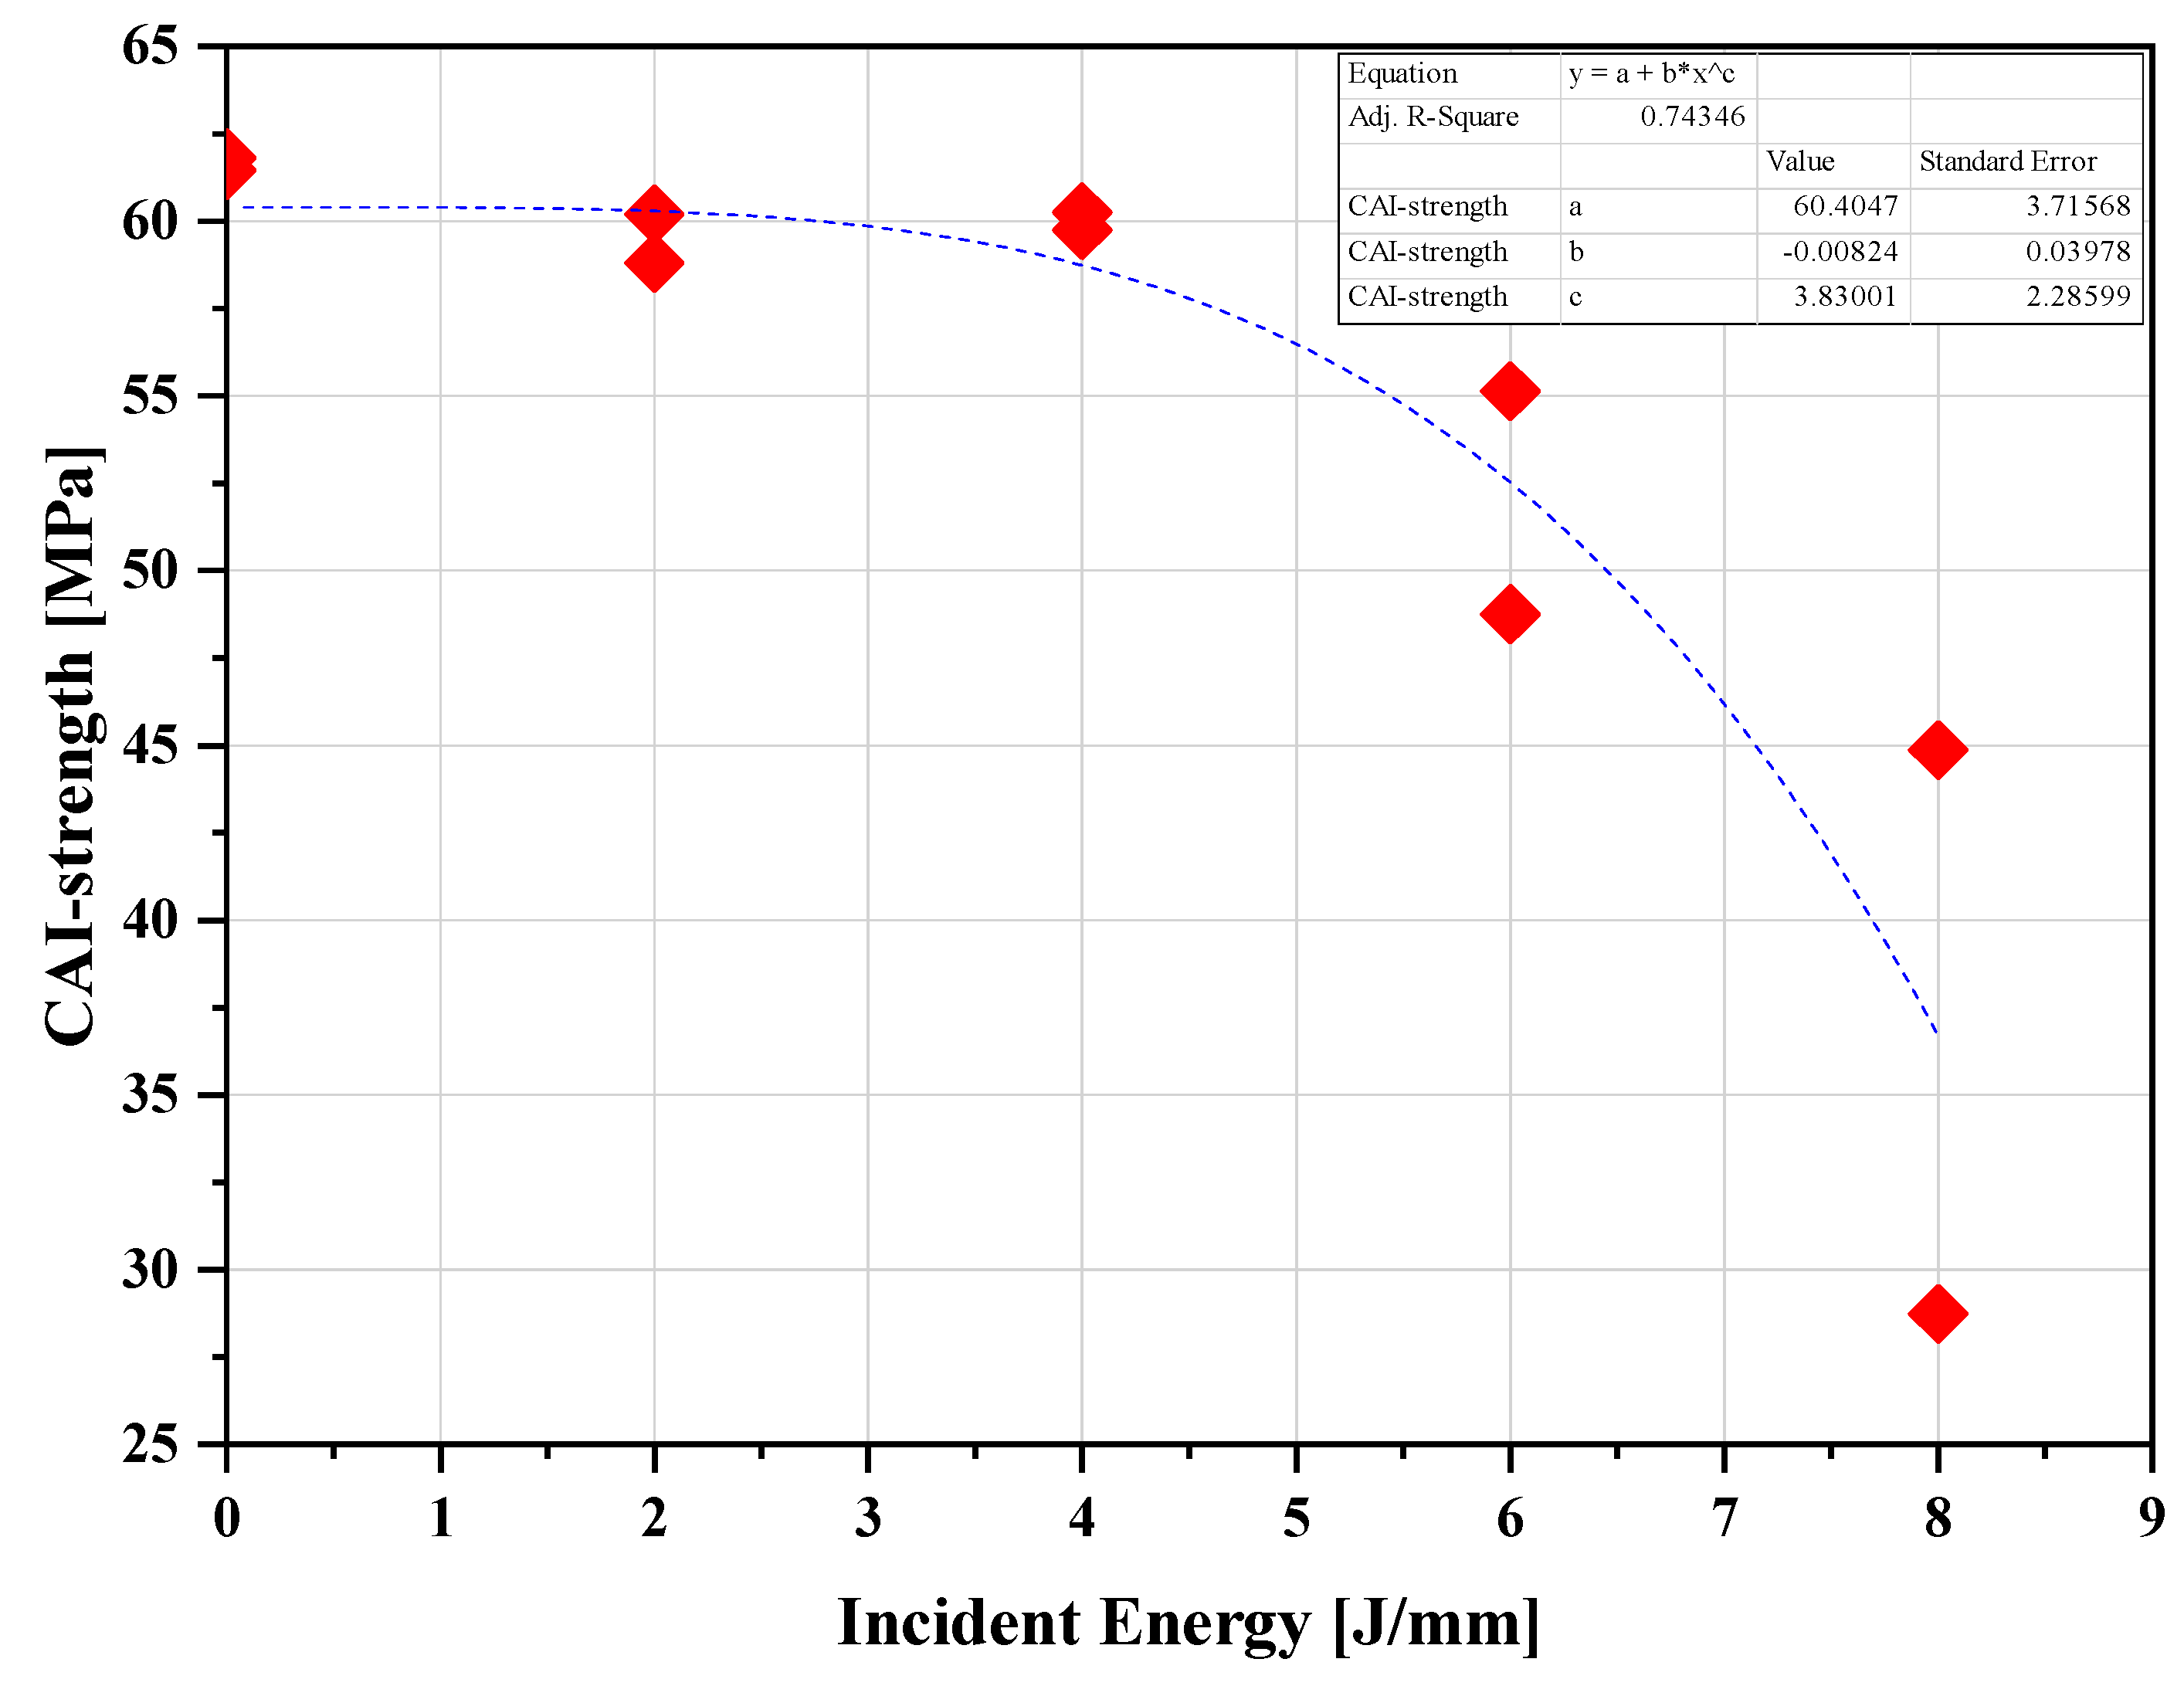
  • Delaminated regions lead to localized buckling of sub-laminates under compressive loads. The size of the delaminated zone increases with impact energy, consequently reducing the CAI strength of the material.
  • Anti-buckling jigs successfully prevented peripheral buckling during CAI tests, adhering to the DIN65561 standard. However, these results emphasize the limitations of solely relying on buckling analysis for post-impact behavior predictions. Plate failure can involve factors beyond buckling, such as delamination and matrix cracking.
  • The absence of mid-plane fractures in all tested plates suggests insufficient internal damage to induce micro-buckling and subsequent ply failure. The C-Scan technique proved effective for quantifying the extent of the damaged zone. Specimens generally exhibited a linear stress–strain response until they reached their ultimate strength, followed by a significant drop in stress signifying failure.
  • Increasing impact energy leads to a proportional increase in the delamination area within the composite, highlighting the detrimental effect on its internal integrity.
  • Discrepancies between experimental results and model predictions can be partially attributed to model limitations, such as the assumption of linear elastic buckling behavior. Real-world damage introduces complexities not fully captured by the model.

Author Contributions

Conceptualization, D.E.M. and S.P.Z.; methodology, D.E.M.; software, P.J.C.; validation, P.J.C.; formal analysis, P.J.C.; investigation, D.E.M. and S.P.Z.; resources, D.E.M. and S.P.Z.; data curation, D.E.M. writing—original draft preparation, D.E.M. and S.P.Z.; writing—review and editing, D.E.M. and S.P.Z. and P.J.C.; visualization, P.J.C.; supervision, D.E.M.; project administration, D.E.M. All authors have read and agreed to the published version of the manuscript.

Funding

This research received no external funding.

Institutional Review Board Statement

Not applicable.

Informed Consent Statement

Not applicable.

Data Availability Statement

The original contributions presented in the study are included in the article, further inquiries can be directed to the corresponding author.

Conflicts of Interest

The authors declare no conflict of interest.

References

  1. Pelletier, J.L.; Vel, S.S. Multi-objective optimization of fiber reinforced composite laminates for strength, stiffness and minimal mass. Comput. Struct. 2006, 84, 2065–2080. [Google Scholar] [CrossRef]
  2. Marble, E.; Boles, T. A Review of the Structural Characteristics of Aerospace Composites. Sci. Insights 2022, 41, 749–753. [Google Scholar] [CrossRef]
  3. Aktas, M.; Karakuzu, R.; Icten, B.M. Impact behavior of glass/epoxy laminated composite plates at high temperatures. J. Compos. Mater. 2010, 44, 2289–2299. [Google Scholar] [CrossRef]
  4. Aktaş, M.; Karakuzu, R.; İçten, B. Thermal impact behavior of glass–epoxy laminated composite plates. J. Thermoplast. Compos. Mater. 2011, 24, 535–553. [Google Scholar] [CrossRef]
  5. Liu, W.; Zhao, X.; Li, S. A review of aerospace composite materials for high-performance structures. Compos. Struct. 2020, 249, 112738. [Google Scholar]
  6. Carvelli, V.; Fiore, V.; Micheletti, G. Progressive damage modeling for the prediction of the compressive after impact response of woven Kevlar® 49/epoxy composites. Compos. Struct. 2021, 267, 114037. [Google Scholar]
  7. Gökçe, A.; Çoban, M.Z.; Uysal, M. The influence of moisture absorption on the low-velocity impact and compression after impact (CAI) response of Kevlar 49® epoxy composites. Mater. Sci. Appl. 2019, 10, 301–313. [Google Scholar]
  8. Hitte, J.; Périé, J.P.; Hemptinne, C. Experimental characterization of variable low velocity impact damage for flax fiber reinforced composites. Compos. Part A Appl. Sci. Manuf. 2014, 61, 188–196. [Google Scholar]
  9. Zhou, G.; Wang, Z.; Huang, J. Numerical simulation of compression after impact (CAI) for CFRP laminates considering progressive damage. Compos. Struct. 2018, 185, 42–53. [Google Scholar]
  10. Yang, H.H. Kevlar Aramid Fiber; Wiley: New York, NY, USA, 1993. [Google Scholar]
  11. Gökçe, A.; Çoban, M.Z.; Uysal, M. Effect of surface modification on the low-velocity impact and compression after impact (CAI) response of Kevlar 49® epoxy composites. J. Compos. Mater. 2020, 54, 4251–4267. [Google Scholar]
  12. Seyednejad, S.A.; Rahmani, M.; Sultan, M.T. Kevlar® composites for ballistic applications: A review of ballistic impact mechanisms, influencing factors and material enhancements. Compos. Part B Eng. 2018, 154, 238–258. [Google Scholar]
  13. Li, Y.; Mamouri, H.; Li, S.; Wang, Y. Effects of multi-scale reinforcements on the low-velocity impact and compression after impact (CAI) behaviors of Kevlar 49/epoxy composites. Compos. Part B Eng. 2023, 134, 110253. [Google Scholar]
  14. Dong, Z.; Sun, C.T. Testing and modeling of yarn pull-out in plain woven Kevlarfabrics. Compos. A Appl. Sci. Manuf. 2009, 40, 1863–1869. [Google Scholar] [CrossRef]
  15. Pinho, S.; Iannucci, L.; Robinson, P. Physically based failure models and criteria for laminated fibre-reinforced composites with emphasis on fibre kinking. Part II: FE implementation. Compos. A Appl. Sci. Manuf. 2006, 37, 766–777. [Google Scholar] [CrossRef]
  16. Pinho, S.; Iannucci, L.; Robinson, P. Physically-based failure models and criteria for laminated fibre-reinforced composites with emphasis on fibre kinking: Part I: Development. Compos. Part A Appl. Sci. Manuf. 2006, 37, 63–73. [Google Scholar] [CrossRef]
  17. Meddour, O.; Mamouri, H.; Guerrouache, M.; Benzeggagh, M.L. Prediction of the compressive response after impact of composite laminates using a damage mechanics approach. Compos. Struct. 2014, 116, 556–567. [Google Scholar]
  18. de Freitas, M.; Reis, L. Failure mechanisms on composite specimens subjected to compression after impact. Compos. Struct. 1998, 42, 365–373. [Google Scholar] [CrossRef]
  19. Johnson, W.; Masters, J.; Wilson, D.; Hosur, M.; Murthy, C.; Ramurthy, T. Compression after impact testing of carbon fiber reinforced plastic laminates. ASTM J. Compos. Technol. Res. 1999, 21, 51–64. [Google Scholar] [CrossRef]
  20. Naik, N.K.; Joglekar, M.N.; Arya, H.; Borade, S.V.; Ramakrishna, K.N. Impact and compression after impact characteristics of plain weave fabric composites: Effect of plate thickness. Adv. Compos. Mater. 2004, 12, 261–280. [Google Scholar] [CrossRef]
  21. Sanchez-Saez, S.; Barbero, E.; Zaera, R.; Navarro, C. Compression after impact of thin composite laminates. Compos. Sci. Technol. 2005, 65, 1911–1919. [Google Scholar] [CrossRef]
  22. Khondker, O.; Leong, K.; Herszberg, I.; Hamada, H. Impact and compression-after-impact performance of weft-knitted glass textile composites. Compos. Part A Appl. Sci. Manuf. 2005, 36, 638–648. [Google Scholar] [CrossRef]
  23. Cartié, D.; Irving, P. Effect of resin and fibre properties on impact and compression after impact performance of CFRP. Compos. Part A Appl. Sci. Manuf. 2002, 33, 483–493. [Google Scholar] [CrossRef]
  24. Liu, Y.; Mamouri, H.; Li, S.; Wang, C. Experimental and numerical investigation of the effect of fiber hybridization on the compressive after impact (CAI) behavior of Kevlar® 49/epoxy composites. Compos. Struct. 2022, 272, 114320. [Google Scholar]
  25. Abrate, S. Impact on Composite Structures; Cambridge University Press: Cambridge, UK, 1998. [Google Scholar]
  26. Rouchon, J. Fatigue and damage tolerance aspects for composite aircraft structures. In Proceedings of the ICAF Symposium, Delft, The Netherlands; March 1995. [Google Scholar]
  27. Rhead, A.T.; Marchant, D.; Butler, R. Compressive strength of composite laminates following free edge impact. Compos. Part A Appl. Sci. Manuf. 2010, 41, 1056–1065. [Google Scholar] [CrossRef]
  28. Choi, H.Y.; Chang, K. A model for predicting damage in graphite-epoxy laminated composites resulting from low-velocity point impact. J. Compos. Mater. 1992, 26, 2134–2169. [Google Scholar] [CrossRef]
  29. Carvelli, V.; Wegner, L.; Micheletti, G. Effect of stacking sequence and hygrothermal conditioning on the compressive after impact (CAI) response of woven Kevlar® 49/epoxy composites. Compos. Part A Appl. Sci. Manuf. 2018, 114, 305–317. [Google Scholar]
  30. Liu, X.; Li, S.; Mamouri, H. Experimental investigation on the effect of stacking sequence on the compression after impact (CAI) behavior of flax/epoxy composites. Compos. Struct. 2019, 222, 110942. [Google Scholar]
  31. Liu, D.; Raju, B.B.; Dang, X. Size effects on impact response of composite laminates. Int. J. Impact Eng. 1998, 21, 837–854. [Google Scholar] [CrossRef]
  32. Dale, M.; Acha, B.A.; Carlsson, L.A. Low velocity impact and compression after impact characterization of woven carbon/vinylester at dry and water saturated conditions. Compos. Struct. 2012, 94, 1582–1589. [Google Scholar] [CrossRef]
  33. Soutis, C.; Curtis, P. Prediction of the post-impact compressive strength of CFRP laminated composites. Compos. Sci. Technol. 1996, 56, 677–684. [Google Scholar] [CrossRef]
  34. Chai, H.; Babcock, C.D.; Knauss, W.G. One dimensional modelling of failure in laminated plates by delamination buckling. Int. J. Solids Struct. 1981, 17, 1069–1083. [Google Scholar] [CrossRef]
  35. Donadon, M.; Iannucci, L.; Falzon, B.; Hodgkinson, J.; de Almeida, S. A progressive failure model for composite laminates subjected to low velocity impact damage. Comput. Struct. 2008, 86, 1232–1252. [Google Scholar] [CrossRef]
  36. Maire, J.-F.; Lesne, P.-M. An explicit damage model for the design of composite structures. Compos. Sci. Technol. 1998, 58, 773–778. [Google Scholar] [CrossRef]
  37. Iannucci, L.; Dechaene, R.; Willows, M.; Degrieck, J. A failure model for analysis of thin woven glass composite structures under impact loadings. Comput. Struct. 2001, 79, 785–799. [Google Scholar] [CrossRef]
  38. Williams, K.V.; Vaziri, R.; Poursartip, A. A physically based continuum damage mechanics model for thin laminated composite structures. Int. J. Solids Struct. 2003, 40, 2267–2300. [Google Scholar] [CrossRef]
  39. Pavan, R.C.; Creus, G.J.; Maghous, S. A simplified approach to continuous damage of composite materials and micromechanical analysis. Compos. Struct. 2009, 91, 84–94. [Google Scholar] [CrossRef]
  40. Donadon, M.V.; de Almeida, S.F.M.; Arbelo, M.A.; de Faria, A.R. A three dimensional ply failure model for composite structures. Int. J. Aerospace Eng. 2009, 2009, 486063. [Google Scholar] [CrossRef]
  41. Ianucci, L.; Willow, M.L. An energy based damage mechanics approach to modeling impact onto composite materials. Part I—Numerical models. Compos. Part A Appl. Sci. Manuf. 2006, 37, 2041–2056. [Google Scholar] [CrossRef]
  42. Ianucci, L.; Willow, M.L. An energy based damage mechanics approach to modeling impact onto composite materials. Part II—Experimental and numerical results. Compos. Part A Appl. Sci. Manuf. 2007, 38, 540–554. [Google Scholar] [CrossRef]
  43. Johnson, A.; Pickett, A.; Rozycki, P. Computational methods for predicting impact damage in composite structures. Compos. Sci. Technol. 2001, 61, 2183–2192. [Google Scholar] [CrossRef]
  44. Iannucci, L.; Ankersen, J. An energy based damage model for thin laminated composites. Compos. Sci. Technol. 2006, 66, 934–951. [Google Scholar] [CrossRef]
  45. Mamouri, H.; Bessaieh, A.; Laksimi, A.; Aidoun, Z. Experimental and numerical investigation of the compressive behaviour after impact of woven flax/epoxy composites. Compos. Struct. 2014, 110, 346–355. [Google Scholar]
  46. Wang, Z.; Zhou, G.; Huang, J. Progressive damage modeling for compression after impact of CFRP laminates. Compos. Struct. 2017, 171, 372–383. [Google Scholar]
  47. Donadon, M.V. The Structural Behavior of Composite Laminate Manufactured Using Resign Infusion under Flexible Tooling (RIFT) Process. Ph.D. Thesis, Department of Aeronautics, Imperial College London, London, UK, 2005. [Google Scholar]
  48. Falzon, B.G.; Apruzzese, P. Numerical analysis of intralaminar failure mechanisms in composite structures. Part I: FE implementation. Compos. Struct. 2011, 93, 1039–1046. [Google Scholar] [CrossRef]
  49. Falzon, B.G.; Apruzzese, P. Numerical analysis of intralaminar failure mechanisms in composite structures. Part II: Applications. Compos. Struct. 2011, 93, 1047–1053. [Google Scholar] [CrossRef]
  50. Bouvet, C.; Rivallant, S.; Barrau, J. Low velocity impact modeling in composite laminates capturing permanent indentation. Compos. Sci. Technol. 2012, 72, 1977–1988. [Google Scholar] [CrossRef]
  51. Hongkarnjanakul, N.; Bouvet, C.; Rivallant, S. Validation of low velocity impact modelling on different stacking sequences of CFRP laminates and influence of fibre failure. Compos. Struct. 2013, 106, 549–559. [Google Scholar] [CrossRef]
  52. Rivallant, S.; Bouvet, C.; Hongkarnjanakul, N. Failure analysis of CFRP laminates subjected to compression after impact: FE simulation using discrete interface elements. Compos. Part A Appl. Sci. Manuf. 2013, 55, 83–93. [Google Scholar] [CrossRef]
  53. Mendes, P.A.A.E.; Arbelo, M.A.; Donadon, M.V.; de Almeida, S.F.M. Numerical modeling of compression after impact response of woven fiber-reinforced composites. In Proceedings of the 21st Brazilian Congress of Mechanical Engineering, Natal, Brazil, 24–28 October 2011. [Google Scholar]
  54. Ghorbani, M.; Jafar, S.H.; Shariati, M. A progressive damage modeling approach for predicting the impact response and damage mechanisms of laminated composite plates. Compos. Struct. 2020, 244, 112323. [Google Scholar]
  55. ABAQUS 2023 User’s Manual; ABAQUS Inc.: Providence, RI, USA, 2023.
  56. Papanicolaou, G.; Charitidis, P.; Mouzakis, D.; Jiga, G. Experimental and numerical investigation of unbalanced boron/epoxy-aluminum single lap joints subjected to a corrosive environment. J. Compos. Mater. 2015, 50, 145–157. [Google Scholar] [CrossRef]
  57. Papanicolaou, G.; Charitidis, P.; Mouzakis, D.; Karachalios, E.; Jiga, G.; Portan, D. Experimental and numerical investigation of balanced Boron/Epoxy single lap joints subjected to salt spray aging. Int. J. Adhes. Adhes. 2016, 68, 9–18. [Google Scholar] [CrossRef]
  58. Tan, K.; Watanabe, N.; Iwahori, Y.; Ishikawa, T. Effect of stitch density and stitch thread thickness on compression after impact strength and response of stitched composites. Compos. Sci. Technol. 2012, 72, 587–598. [Google Scholar] [CrossRef]
  59. Suemasu, H.; Sasaki, W.; Aoki, Y.; Ishikawa, T. Compressive behaviour of impact damaged composite laminates. In Proceedings of the 16th International Conference on Composite Materials (ICCM-16), Kyoto, Japan, 7 July 2007. [Google Scholar]
  60. Hitchen, S.A.; Kemp, R.M.J. The effect of stacking-sequence on impact damage in carbon–fibre epoxy com-posite. Composites 1995, 26, 207–214. [Google Scholar] [CrossRef]
  61. Hashin, Z. Failure criteria for unidirectional fiber composites. J. Appl. Mech. 1980, 47, 329–334. [Google Scholar] [CrossRef]
  62. Hashin, Z.; Rotem, A. A Fatigue Failure Criterion for Fiber Reinforced Materials. J. Compos. Mater. 1973, 7, 448–464. [Google Scholar] [CrossRef]
  63. Xiong, Y.; Poon, C.; Straznicky, P.; Vietinghoff, H. A prediction method for the compressive strength of impact damaged composite laminates. Compos. Struct. 1995, 30, 357–367. [Google Scholar] [CrossRef]
  64. Raimondo, L.; Iannucci, L.; Robinson, P.; Curtis, P. A progressive failure model for mesh-size-independent FE analysis of composite laminates subject to low-velocity impact damage. Compos. Sci. Technol. 2012, 72, 624–632. [Google Scholar] [CrossRef]
  65. Yan, H.; Oskay, C.; Krishnan, A.; Xu, L.R. Compression-after-impact response of woven fiber-reinforced composites. Compos. Sci. Technol. 2010, 70, 2128–2136. [Google Scholar] [CrossRef]
  66. Zhang, X.; Davies, G.; Hitchings, D. Impact damage with compressive preload and post-impact compression of carbon composite plates. Int. J. Impact Eng. 1999, 22, 485–509. [Google Scholar] [CrossRef]
  67. Zhou, G. Effect of impact damage on residual compressive strength of glass-fibre reinforced polyester (GFRP) laminates. Compos. Struct. 1996, 35, 171–181. [Google Scholar] [CrossRef]
  68. Cantwell, W.; Morton, J. The impact resistance of composite materials—A review. Composites 1991, 22, 347–362. [Google Scholar] [CrossRef]
  69. Abdulhamid, H.; Bouvet, C.; Michel, L.; Aboissiere, J.; Minot, C. Numerical simulation of impact and compression after impact of asymmetrically tapered laminated CFRP. Int. J. Impact Eng. 2016, 95, 154–164. [Google Scholar] [CrossRef]
Figure 1. Kevlar 49/Epoxy cross-ply 0 / 90 / ± 45 / 0 / 90 s .
Jcs 08 00299 g001
Figure 2. Ultrasonic scanning and back wall echo of pristine specimens before compression after impact (CAI) tests.
Jcs 08 00299 g002
Figure 3. In-plane compression and anti-buckle rig, test frame.
Jcs 08 00299 g003
Figure 4. (a) Cohesive interface and (b) Traction–separation law for cohesive interfaces.
Jcs 08 00299 g004
Figure 5. (a) Clamp supported for impact test and (b) Boundary conditions and loading for compression test.
Jcs 08 00299 g005
Figure 6. Optical and C-scan images were obtained after the impact test.
Jcs 08 00299 g006
Figure 7. Observable failures on the surface of the specimens after uniaxial compressive displacement.
Jcs 08 00299 g007
Figure 8. Strength–strain curves obtained from the CAI tests.
Jcs 08 00299 g008
Figure 9. Cumulative Delamination Area vs. Impact Energy.
Jcs 08 00299 g009
Figure 10. CAI Strength–Impact Energy for all specimens.
Jcs 08 00299 g010
Figure 11. CAI Strength vs. Total Delamination Area for all specimens.
Jcs 08 00299 g011
Figure 12. Finite element model with 8112 elements.
Jcs 08 00299 g012
Figure 13. Useful comparison between experimental strength (averaged) and FEA CAI strain–strength results.
Jcs 08 00299 g013
Table 1. Elastic constants of laminate model parameters.
E1 (GPa)E2 (GPa)E3 (GPa)G12 (GPa)G13 (GPa)G23 (GPa)v12v13v23
69.807.417.414.364.364.10.330.330.36
Table 2. Strength parameters for Hashin damage failure criterion.
XT (MPa).XC (MPa)YT (MPa)YC (MPa)SL (MPa)
69.807.417.414.364.36
Table 3. Buckling initiation loads for CAI specimens vs. Impact Energy (averaged).
Impact Energy [J/mm]02468
Buckling Stress [MPa]61.6359.9959.9251.9446.80
Table 4. Experimental results vs. finite element results.
Impact Energy [J/mm]ExperimentFE-Analysis
Buckling Stress [MPa]
061.63 64.64
259.99 61.61
459.52 60.45
651.92 53.96
846.80 48.87
Disclaimer/Publisher’s Note: The statements, opinions and data contained in all publications are solely those of the individual author(s) and contributor(s) and not of MDPI and/or the editor(s). MDPI and/or the editor(s) disclaim responsibility for any injury to people or property resulting from any ideas, methods, instructions or products referred to in the content.

